Effect of density functionals on the vibrational and thermodynamic properties of Fe2VAl and Fe2TiSn compounds
Abstract
First-principles phonon calculations along with Kohn-Sham density functional theory (DFT) is an essential tool to study the lattice dynamics, thermodynamical properties and phase-transitions of materials. The two full-Heusler compounds Fe2VAl and Fe2TiSn are studied for lattice vibration dependent properties using finite displacement method and supercell approach. For the investigation, four density functionals viz., LDA, PBE, PBEsol and meta-GGA SCAN are employed. Using these functionals, phonon dispersion, phonon density of states (DOS), partial density of states (PDOS) thermal propertis and zero-point energy are calculated at equilibrum lattice parameters under harmonic approximation. For the two compounds the Debye temperatures are calculated from the obtained phonon DOS which are 660 K and 540 K, respectively. The obtained results from different functionals are compared among each other. The overall phonon energy in the dispersion is found to be 15 meV higher in Fe2VAl than the Fe2TiSn compounds. For the two compounds PBE is yielding the lowest phonon frequencies while LDA or SCAN functional is giving the highest. The same pattern is observed in phonon DOS plots of two compounds. The zero-point energy calculated is the highest from SCAN (21.04 and 16.95 J) and the lowest from PBE functionals (20.09 and 16.02 J) obeying the same trend as frequency for both compounds. A general prediction of nature of lattice thermal conductivity is made based on the velocities of acoustic phonons which is in agreement with the qualitative behavior of reported experimental thermal conductivity of two compounds. Phonon spectra obtained from PBE and SCAN have similar general features while those from LDA and PBEsol have resembling features for Fe2VAl, while this trend is not observed for the compound Fe2TiSn.
Key words: Phonons, exchange-correlation functionals, lattice thermal conductivity, lattice dynamics.
I Introduction
First-principles Kohn-Sham density functional theory (DFT)kohnsham is one of the most widely used theoretical investigation tools in materials science. This tool has been very helpful since it’s inception for the study of electronic structure, and other ground-state properties. This is also made possible with the aid of advancements in the field of high-perfomance computing and it’s cost effectiveness.skelton2015 In the KS-DFT the total ground-state enrergy is calculated as a functional of the ground-state electron density for a static lattice and is minimized with respect to lattice constant. The total ground state energy is the sum of kinetic energy, Coulomb energy and exchange-correlation (XC) energy. And this XC energy is the part which is approximated in practice.hao2012lattice So, the best explanation to experimental results from DFT calculations depends on the approximation used in XC functionals. There are large number of approximations available to XC energy. LDA and GGA-PBE are the mostly used density functionals.
This application of first-principles calculations is extended in the field of condensed matter physics and materials science by the introduction of phonon calclations.togo ; wangnature ; skelton2015 When an atom is displaced from the equilibrium position in a crystal forces arise on all the atoms. By calculating the force on the each atom using the total energy of the crystal, phonon frequencies can be obtained. This approach of calculation is called finite-displacement method (FDM). Another method uses density functional perturbation theory (DFPT) to calculate the phonon frequencies and hence dependent properties.togo
Fe2VAl and Fe2TiSn are the two compounds belonging to the family of full-Heusler alloys. These compounds are reported to have non-magnetic ground state with applications in many fields. They crystallise in cubic phase with space group .nishino06 ; yabucchi ; galanakis The two compounds are also being studied for the application as thermoeletrics for heat energy conversion.luethermalfe2tisn ; luefe2valthermoelectric A thermoelectric is characterized by it’s figure of metit (ZT) value. As it is well known that ZT is proportional to the electrical conductivity and inversly related to thermal conductivity, it is important to study the electronic structure of a material in order to understand or improve the efficiency.mahan1989figure ; mahan2016introduction Since, the thermal conductivity has an important contribution from lattice vibrations, it is must to investigate the lattice thermal conductivity if one has to properly understand a thermoelectric in order to tailor it’s efficiency.mahan2016introduction
Keeping this in mind, we have studied the electronic strucure of the two compounds employing five XC functionals in our recently reported study.Shastri2018 We also calculated effective masses for two compounds and found that Fe2TiSn showing large value of effective mass having flat band. In this direction, to completely understand the thermoelectric behavior, there is a need to study the lattice part of thermal conductivity of the two compounds through phonon calculations. Also, the lattice dynamics study of the two compounds in literature using different functionals is missing. Performing the test of functionals to study phonon frequencies along with electronic structure gives strict test of the functional.skelton2015
Therefore, in the present work, we have undertaken the study of two full-Heusler compounds, Fe2VAl and Fe2TiSn using four XC functionals. The XC functionals employed are, LDA-PW92lda92 , GGA-PBEpbe , PBEsolpbesol and SCANscan meta-GGA. Using these functionals phonon dispersion, density of states (DOS), partial density of sates (PDOS) are calculated at equilibrium lattice parameters under harmonic approximation. Further, variation in thermodynamical quantities, constant volume specific heat and Helmholtz free energy (F) as a function of temperature are calculated. The Debye temeperature and the zero-point energy contribution to the static lattice are also calculated. The effect of the various functionals on the obtained phonon properties are discussed. Lattice thermal conductivity prediction from the slope of acoustic phonon branches are guessed. And this result is compared qualitatively with the experimental thermal conductivity study of two compounds.
II Computational details
In this work calculations are carried out using two computational programs. To obtain the total forces on the atoms , first-principles full-potential linearized augmented plane wave (FP-LAPW) based program WIEN2kwien2k is used as force calculator. Self-consistent cycles are run till the sum of total forces on atoms is less than 0.1 mRy/bohr. The calculations are performed using four exchange-correlation functionals viz., LDAlda92 , PBEpbe , PBEsolpbesol and recent meta-GGA functional SCAN.scan A k-mesh of size 5x5x5 is used for both Fe2VAl and Fe2TiSn compounds for force calculation. For the phonon calculations part PHONOPYtogo code is used. PHONOPYtogo is a first-principles phonon calculations tool which can handle force constants obtained from both finite displacement method (FDM) and density functional pertrubation theory (DFPT) for phonon frequency analysis. Here, FDM and supercell approach is used to calculate phonon properties. A supercell of size 2x2x2 of primitive lattice type is constructed for both the compounds with 128 atoms. The supercell is used to obtain the long-range force constants between atoms.skelton2014thermal An artificial force is created in the systems by displacing atom of each kind (Fe, V, Al, Ti, Sn) in the formula units by a distance of 0.02 bohr in x-direction. Further analysis of total forces on atoms to get force-cosntants and post-processing of them are carried out using PHONOPYtogo to obtain phonon dispersions and phonon density of states (DOS) and thermal properties on a sampling mesh of 21x21x21. Fe2VAl and Fe2TiSn full-Heusler compounds have cubic L21 crystal structure with Fm-3m space group. The Fe atoms occupy the Wyckoff position 8c , Y atoms occupy Wyckoff position 4a and Z atoms occupy Wyckoff position 4b .mahanti Where Y=V,Ti and Z=Al,Sn in the general representation Fe2YZ of these two full-Heusler compounds. Shastri2018
III Results and Discussion
The lattice vibration dependent properties of the two Heusler compounds are studied under harmonic approximation at equilibrium lattice parameters. The equilibrium lattice constants are obtained by minimizing the total energy with volume. The obtained optimized lattice constant values from four different XC functionals are presented in Table 1. The details of the volume-optimization calculation can be found in our previous work.Shastri2018
| Fe2VAl | Fe2TiSn | ||
| Lattice constant () | Lattice constant () | ||
| (Å) | (Å) | ||
| LDA | 5.5955 | 5.9102 | |
| PBE | 5.7089 | 6.0423 | |
| PBEsol | 5.6478 | 5.9664 | |
| SCAN | 5.6509 | 5.9762 |
From the Table 1.Shastri2018 the trends in the obtained equilibrum lattice parameters from four functionals can be observed. In these cases also the overbinding nature of LDA and relatively underbinding nature of PBE are clearly exhibited with the lowest and highest values of lattice constants, respectively.
To further study the lattice stability, phonon energy and thermodynamic properties of the two full Heusler compounds, first-principles phonon calculations are carried out.
III.1 Vibrational properties
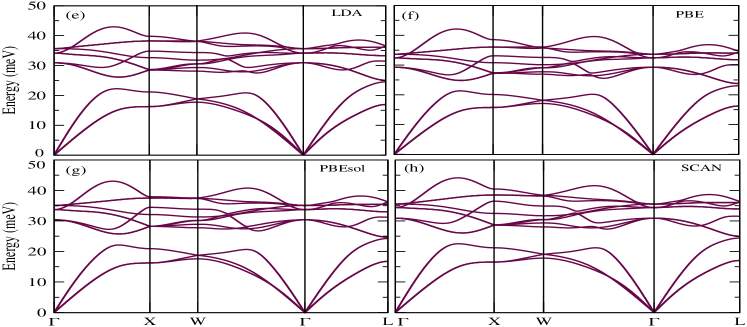
The phonon band structure and density of states (DOS) and partial density of states (PDOS) are calculated for the two compounds using four XC functionals. The corresponding phonon band structures from the four functionals for Fe2VAl and Fe2TiSn are shown in Fig. 1(a)-(d) and (e)-(h), respectively. The vibrational spectra is plotted along ---- directions in the first Brillouin zone. A crystal is considered to be mechanically stable if the potential energy of the crystal increases for any displacements of atoms inside it. According to harmonic approximation, this condition is satisfied when all the phonons have real and positive frequencies (or energies).togo The negative or imaginary frequencies imply that the crystal is dynamically unstable discarding the possibility of synthesis in that phase. In our case, the obtained dispersion curves for two compounds does not show any negative frequecies indicating that both the compounds are stable in the cubic L21 phase. The two branches out of the total three acoustic branches are doubly degenerate (or nearly doubly degenerate) nearly half-way along - direction and fully along - direction in case of both the compounds. The acoustic branches of Fe2VAl are following the linear relation with q for more distance (i.e more shorter wavelength) than in the case Fe2TiSn, along both - and - directions. In this linear region the group velocity will be the same as phase velocity.ashcroft Few of the acoustic and optical branches of Fe2VAl are degenerate at an energy of 29 meV and 33 meV, respectively at the zone boundary containg point . But this nature is not observed in case of Fe2TiSn vibrational spectrum, where there is a clear seperation between optical and acoustic phonon branches. On observing the energy scales of the dispersion curves of the two compounds, it is visible that the vibrational energy of phonons is more in Fe2VAl than in the case of Fe2TiSn compound. The Fe2TiSn compound contains heavier element Sn and it’s atomic mass is more than the Fe2VAl compound. As the vibrational frequency, in turn energy, is inversly proportional to the suare root of mass of elements in the compound, these observations justify the frequency-mass relation. In the Fe2VAl vibrational spectrum we observe three acoustic branches are crossing with some of the optical branches. And there are three high energy optical branches of 50 meV with a distinct seperation from the other branches. In Fe2VAl, looking at the atomic masses of the constituents of the formula unit, Al atom has the lowest atomic mass. Therefore, the major contribution to these curves should be from that atom.kanchana The crossing branches in the region between 25-40 meV energy are mainly due to the near atomic mass elements Fe and V. Now, while going from Fe2VAl to Fe2TiSn the following changes in the vibrational spectrum of the latter compound are observed. The highest energy optical phonon branches are observed 35 meV in the energy scale and which is shifted down compared to that of Fe2VAl. Compared with the former compound here, three lower energy acoustic branches are found to be well seperated from the higher energy optical phonon disperion curves except at the -point with energy difference of 1 meV. In this case, the major contribution to the energy of these acoustic phonons are from the heavier atomic mass element Sn in the compound. The contribution to the optical branches in 25-40 meV regions are maninly due to the near atomic mass elements Fe and Ti atoms in Fe2TiSn. These qualitative explanations are justified further through phonon PDOS plots in figure 3. As mentioned before, the linear relationship bewteen frequency (or energy) and q of acoustic branches is followed for small values of q in Fe2TiSn compared to that in the dispersion relation of Fe2VAl. With the seperation between acoustic and optical phonons mentioned, the degeneracy observed among them in case of the former compound is absent here. One of the interesting features of the vibrational spectra of the two compounds can be highlighted here. That is, on examining the slopes of the acoustic branches of the two compounds, the slope values in the linear region are decreasing from Fe2VAl to Fe2TiSn. It is known that, slopes of the acoustic branches are associated with sound velocity and in turn, give the group velocity (and phase velocity in linear region). Also, lattice thermal conductivity in a solid is directly proportional to the sound velocity.maciathermoelectric ; ashcroft So, knowing the value of sound velocity one can proceed to calculate lattice thermal conductivity. Qualitatively, thus it can be said that lattice thermal conductivity is higher in Fe2VAl compared to Fe2TiSn which is in the context of thermoelectric application is a useful information. Lue et. al have reported the thermoelectric properties of Heusler compounds Fe2-xV1+xM (M=Al,Ga)luefe2valthermoelectric and Fe2-xTi1+xSn.luethermalfe2tisn The reported value of thermal conductivity is higher in case of Fe2VAl than in the Fe2TiSn compound under the temperature range studied. Also, in both the compounds they have suggested total thermal conductivity is essentially from lattice part of thermal conductivity. These experimental results are in support of the qualitative explanation given above from our study of the two compounds with sound velocity higher in the former compound than in the Fe2TiSn as stated before. Thus, generally, based on the phonon disprersion analysis of this class of compounds we can say that going for a higher atomic mass compounds in the series can leads to lower value of lattice thermal conductivity keeping in mind the corresponding electronic structure of the compound with the supporting data of experimental thermal conductivity from Fe2VAl, Fe2VGaluefe2valthermoelectric , Fe2TiSn compounds.luethermalfe2tisn We could not come across any neutron inelastic scattering experimental data of phonon dispersion of both the compounds to compare the vibrational sperctrum of our study. Thus, it would be interesting to study the two compounds experimentally to compare the phonon dispersion results obtained from the calculations.

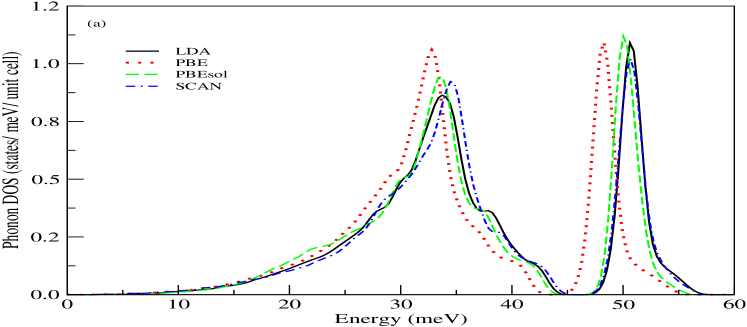
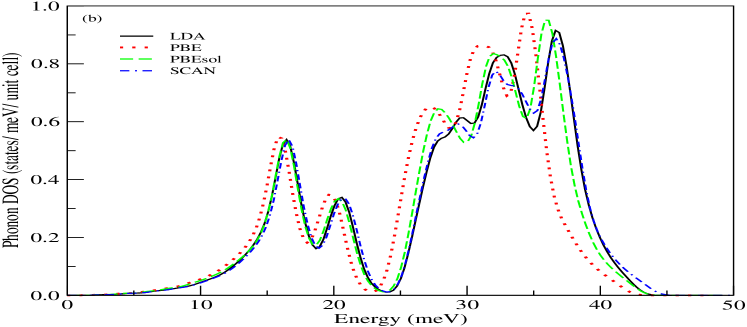
The phonon density of states (DOS) plots for two compounds are presented in Fig. 2 (a) and (b) from all four functionals under study. In Fig. 2(a), phonon DOS of Fe2VAl can be seen. Corresponding to the crossing branches of acoustic and optical phonons of the compound high value of phonon DOS peak can be seen in 25-40 meV region. The highest energy DOS peak in the neighborhood of 50 meV is representing the seperated optical branches in the spectra which is contributed mainly from Al vibrational states.kanchana Vibrational DOS of Fe2TiSn compound is shown in Fig. 2(b). Clearly, the two peaks in the lower energy region correspond to the three acoustic branches in the disperion plot. The next seperated higher energy peaks represent the coupled optical phonon branches. The nature of the respective phonon DOS peaks justifies the phonon dispersion of the two compounds shown in Fig. 1.
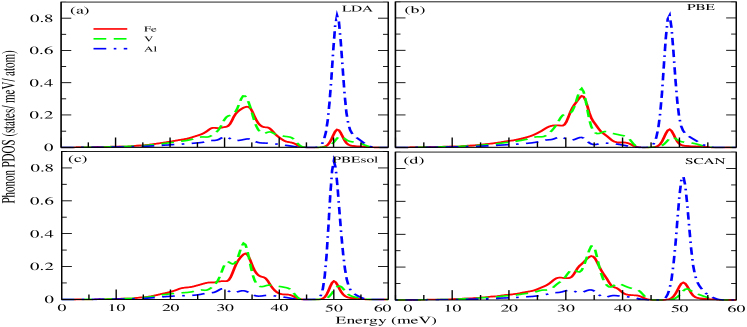
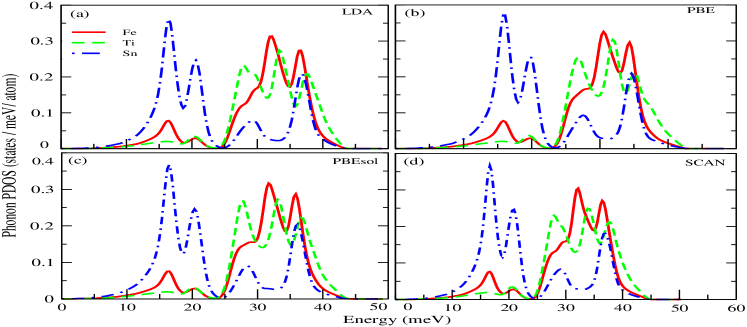
To see the contribution to the phonon frequencies from the different atoms, phonon partial density of states are calculated. Fig. 3 (a)-(d) shows the partial DOS for Fe2VAl obtained from four functionals. It is known that, Al is the lighter element compared to Fe and V. In the 20-40 meV region the main contribution to DOS is from Fe and V atoms. It can be observed that the higher energy three optical branches has primary contribution from Al atom. For Fe2TiSn compound, the phonon partial DOS plot is given in Fig. 3 (e)-(h). In the plot the acoustic phonons belong to the energy upto 25 meV. As we can see, energies of acoustic phonon branches are cheifly from the heavier Sn atoms. Contribution to DOS from Fe and Ti atoms are less in this region. The PDOS plot also shows for Fe2TiSn ,the optical phonons are contributed from the lighter Fe and Ti atoms. In both the compounds, the lighter atoms Al and Ti are contributing less in the lower frequency region and more in higher frequency region to the DOS, respectively.
III.2 Thermal properties
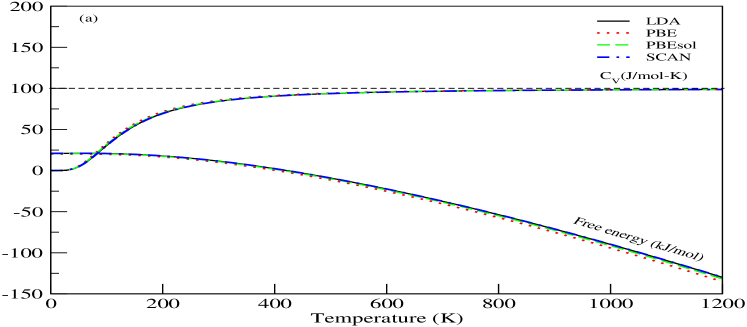
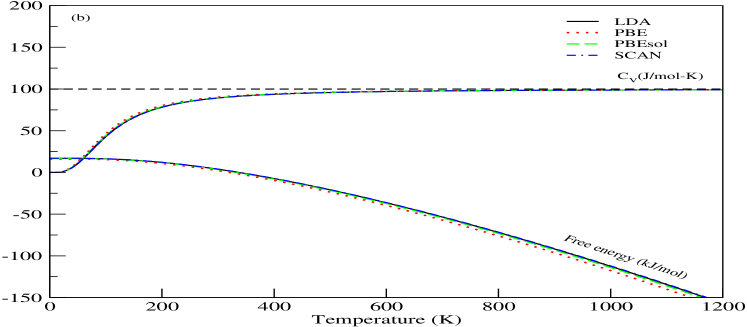
Using the thermodynamic equations, Helmholtz free energy () and constant volume specific heat () at different temperatures are calculated from PHONOPY.togo The results obtained from all the four functionals for the two compounds are shown in Fig.4 (a) and (b), respectively. In the figure the dotted line repersents the classical Dulong and Petit value of , which is in this case 100 J/K/mol. As can be seen from the Fig. 4(a) and (b), in case of Fe2VAl, the Dulong and Petit limit of is reaching at 650 K. But, for Fe2TiSn, is approaching the Dulong and Petit value at 550 K. Employing the high-temperature specific heat limiting case,ashcroft this can be justified with the obtained higher energy (or frequency) of phonons in case of Fe2VAl and lower energy of phonons in case of Fe2TiSn band structures, respectively. The variation of F at different temperatures are also shown in Fig. 3 (a) and (b) for two compounds. The Kohn-Sham DFT gives the ground state energy of the static lattice.hao2012lattice But, in a solid, the nuclei being quantum particles the vibrations exist even at zero temperature.hao2012lattice Thus, this zero-point energy of the lattice ignored by the KS DFT is obtained using PHONOPY in the harmonic crystal approximation.hao2012lattice The values of zero-point energies obtained in the present study for both the compounds with the help of four functionals are tabulated in Table 2. In the two figures, the intercepts to the y-axis from the Helmholtz free energy curve represent the zero-point energy.togo ; ashcroft From the plots it can be observed that the zero-point energies are 21 J and 16 J for Fe2VAl and Fe2TiSn, respetively. The reason for this decline in the values of zero-point energy is again related with higher and lower frequencies of the Fe2VAl and Fe2TiSn phonons,respectively. Because, the equational form of zero-point energy is .togo ; ashcroft . Thus, the proper explanation of the variation calculated for both the compounds justify the obtained phonon energy spectrum. Using the thermodynamical relations, and are calculated as functions of temperature based on the equationstogo :
| (1) | |||
| (2) |
Where, is Boltzmann constant, is reduced Planck’s constant, is phonon frequency for mode q,j and is absolute temperature.
The Debye temperature is defined as the temperature above which all modes begin to be excited, and below which they begin to frozen out.ashcroft Looking at the phonon DOS in Fig. 2, the highest energy phonons correspond to 55 meV and 45 meV for Fe2VAl and Fe2TiSn, respectively based on which the for two compounds are 660 K and 540 K. Thus, above these temperatures all the phonons are excited in the crystal lattice. In Fig. 4 (a) and (b), it can be observed that near these temperatures the is approaching Dulong and Petit limit. Which indicates that all the phonons starts to contribute to the which justifiy the calculated phonon dispersion for two compounds.
| Functional | Fe2VAl | Fe2TiSn |
|---|---|---|
| LDA | 20.99 | 16.87 |
| PBE | 20.09 | 16.02 |
| PBEsol | 20.67 | 16.63 |
| SCAN | 21.04 | 16.95 |
III.3 Density functionals and phonon properties
In first-principles DFT calculations the total energy of a crystal is calculated as the sum of electrostatic energy, kinetic energy and exchange-correlation energy.hao2012lattice In the direct method, the total energy of the crystal is expanded as a product of force constant matrices and displacements.yu1991force Hence, in the harmonic theory of crystals the frequencies, in turn, energy of phonons should depend on the XC energy used to obtain the total energy. The phonons dispersion plots of Fe2VAl obtained from LDA, PBE, PBEsol, and SCAN are shown in Fig. 1 (a)-(d), respectively. It can be noticed that, the phonon branches in PBE obtained vibrational spectrum are the mosted shifted down in energy scale by 3 meV from that of SCAN and LDA. The energies of phonon branches are nearly similar in case of LDA and SCAN meta-GGA with a difference that 6 optical branches are starting from same point at 35 meV in case of SCAN and while two degenerate branches are startig from 35 and 40 meV. While, in general, the PBEsol is producing the spectrum with energy intermediate to those from PBE and LDA (or SCAN). Observing the general features of the phonon bands for Fe2VAl, PBE and SCAN spectra are similar with three degenerate points at 47 meV, 33 meV and 0 meV at the -point. For LDA and PBEsol dispersion curves there is one more additional degenerate point 40 meV and 33 meV, repectively. These observations are well reflected in the phonon DOS of the compound in Fig. 2 (a). DOS curves from PBE are forming the lower bound but showing highest DOS in 20-40 meV region. These high values of peaks indicate that within the branches seperation is very less because of the low frequency of the phonons produced in PBE calculations. The SCAN or LDA functionals corresponding DOS curves, in general, forming the upper bound. While PBEsol phonon DOS is intermediate that of the three functionals lying in between PBE and LDA(or SCAN). Fig. 1 (e)-(h) show the phonon dispersion plots for Fe2TiSn compound from four functionals under study. In this case also, similar to the former compound, the PBE produced branches are the most shifted down in energy scale. This shift from the LDA and SCAN produced dispersions is 1 meV, which is to be noted that less than that in the former compound. The phonon branches from PBEsol functional is showing energy intermediate to those of SCAN and LDA. The general features of the four dispersion curves appears to be similar in case of this compound unlike the case of Fe2VAl. These observations are neatly justified in the phonon DOS plot shown in Fig. 2 (b). As in the case of the former compound, PBE is forming the lower bound in the phonon energy spectrum and showing the the highest value of DOS peaks in the 10-22meV and 25-40 meV regions. The lowest peaks corresponds to the SCAN functional while LDA and PBEsol phonon DOS peaks are lying in between in the DOS peaks. But, in the enrergy, in general, SCAN and LDA are forming the upper bounds. From Fig. 4 (a) and (b), it can be seen that change in XC functionals has negligible effect on , while in case of F, there is small variation in higher temperatures region for the two compounds.
IV Conclusions
In the present work, along with first-principles DFT to calcuate forces, phonon calculations using finite-displacement method and supercell approach are used for the study of Fe2VAl and Fe2tiSn compounds. The study is carried out using four XC functionals viz., LDA, PBE, PBEsol and SCAN. Under the harmonic approximation of crystals, phonon dispersion and DOS, PDOS are calculated. Using the thermodynamic relations and obtained phonon frequencies constant-volume specific heat, Helmholtz free energy as functions of temperature, zero-point energy and Debye temperatures are calculated. The obtained phonon frequencies, justify the classical Dulong and Petit limit constant-volume specific heat at higher temperatures. By comparing the phonon disperion plots and DOS from different functionals, PBE is found to give the lowest phonon energies while LDA and SCAN are giving higer values of energies. The PBE obtained dispersion energies are 2 meV and 1 meV lower than the LDA or SCAN values, respectively. The zero-point vibrational energy obtained from different functionals are in the order SCANLDAPBEsolPBE for both the compounds The value of are 660 K and 540 K for the first and second compound, respectively. Slope of the acoustic branches give sound velocity which is proportional to lattice part of thermal conductivity. By examining the slopes of the acoustic branches of the two compounds, for Fe2VAl higher value and Fe2TiSn lower value of lattice thermal conductivity is predicted. This qualitative prediction of our work is in agreement with nature of experimental lattice thermal conductivity measurements of Leu et. al for both the compounds. Phonon spectra obtained from PBE and SCAN have similar general features while those from LDA and PBEsol have resembling features for Fe2VAl, while this trend is not observed for the compound Fe2TiSn.
V Acknowledgements
The authors thank Science and Engineering Research Board (SERB), Department of Science and Technology, Government of India for funding this work. This work is funded under the SERB project sanction order No. EMR/2016/001511.
VI References
References
- (1) W. Kohn and L. J. Sham Phys. Rev., vol. 140, pp. A1133–A1138, 1965.
- (2) J. M. Skelton, D. Tiana, S. C. Parker, A. Togo, I. Tanaka, and A. Walsh The Journal of chemical physics, vol. 143, p. 064710, 2015.
- (3) P. Hao, Y. Fang, J. Sun, G. I. Csonka, P. H. Philipsen, and J. P. Perdew Physical Review B, vol. 85, p. 014111, 2012.
- (4) A. Togo and I. Tanaka, “First principles phonon calculations in materials science,” Scripta Materialia, vol. 108, pp. 1–5, 2015.
- (5) Y. Wang, S.-L. Shang, H. Fang, Z.-K. Liu, and L.-Q. Chen npj Computational Materials, vol. 2, p. 16006, 2016.
- (6) Y. Nishino, S. Deguchi, and U. Mizutani Phys. Rev. B, vol. 74, p. 115115, 2006.
- (7) S. Yabuuchi, M. Okamoto, A. Nishide, Y. Kurosaki, and J. Hayakawa Applied Physics Express, vol. 6, p. 025504, 2013.
- (8) I. Galanakis, P. H. Dederichs, and N. Papanikolaou Phys. Rev. B, vol. 66, p. 174429, 2002.
- (9) C.-S. Lue and Y.-K. Kuo Journal of applied physics, vol. 96, no. 5, pp. 2681–2683, 2004.
- (10) C. S. Lue and Y.-K. Kuo Physical Review B, vol. 66, no. 8, p. 085121, 2002.
- (11) G. Mahan Journal of applied physics, vol. 65, no. 4, pp. 1578–1583, 1989.
- (12) G. Mahan APL Materials, vol. 4, no. 10, p. 104806, 2016.
- (13) S. S. Shastri and S. K. Pandey Computational Materials Science, vol. 143, 2018.
- (14) J. P. Perdew and Y. Wang Phys. Rev. B, vol. 45, p. 13244, 1992.
- (15) J. P. Perdew, K. Burke, and M. Ernzerhof Phys. Rev. Lett., vol. 77, pp. 3865–3868, 1996.
- (16) J. P. Perdew, A. Ruzsinszky, G. I. Csonka, O. A. Vydrov, G. E. Scuseria, L. A. Constantin, X. Zhou, and K. Burke Phys. Rev. Lett., vol. 100, p. 136406, 2008.
- (17) J. Sun, A. Ruzsinszky, and J. P. Perdew Phys. Rev. Lett., vol. 115, p. 036402, 2015.
- (18) P. Blaha, K. Schwarz, G. K. H. Madsen, D. Kvasnicka, and J. Luitz, “wien2k,” An augmented plane wave+ local orbitals program for calculating crystal properties, 2001.
- (19) J. M. Skelton, S. C. Parker, A. Togo, I. Tanaka, and A. Walsh Physical Review B, vol. 89, p. 205203, 2014.
- (20) D. Do, M.-S. Lee, and S. D. Mahanti Phys. Rev. B, vol. 84, p. 125104, 2011.
- (21) N. Ashcroft and N. Mermin, Solid State Physics. Cengage Learning, 2011.
- (22) V. Kanchana, G. Vaitheeswaran, Y. Ma, Y. Xie, A. Svane, and O. Eriksson Phys. Rev. B, vol. 80, p. 125108, 2009.
- (23) E. Maciá, Thermoelectric Materials: Advances and Applications. CRC Press, 2015.
- (24) R. Yu, D. Singh, and H. Krakauer Physical Review B, vol. 43, p. 6411, 1991.