A Collaborative Filtering Recommender System
for Test Case Prioritization in Web Applications
Abstract.
The use of relevant metrics of software systems could improve various software engineering tasks, but identifying relationships among metrics is not simple and can be very time consuming. Recommender systems can help with this decision-making process; many applications have utilized these systems to improve the performance of their applications. To investigate the potential benefits of recommender systems in regression testing, we implemented an item-based collaborative filtering recommender system that uses user interaction data and application change history information to develop a test case prioritization technique. To evaluate our approach, we performed an empirical study using three web applications with multiple versions and compared four control techniques. Our results indicate that our recommender system can help improve the effectiveness of test prioritization.
1. Introduction
Software systems undergo many changes during their lifetime, and often such changes can adversely affect the software system. To avoid undesirable changes or unexpected bugs, software engineers need to test the overall functionality of the system before deploying a new release of the product. One of the common ways to evaluate system quality in a sequence of releases is regression testing. In regression testing, software engineers validate the software system to ensure that new changes have not introduced new faults. However, modern software systems evolve frequently, and their size and complexity grow quickly, and thus the cost of regression testing can become too expensive (jeff16, ). To reduce regression testing cost, many regression testing and maintenance approaches including test selection and test prioritization (marksurvey, ) have been proposed.
To date, most regression testing techniques have utilized various software metrics that are available from software repositories, such as the size and complexity of the application, code coverage, fault history information, and dependency relations among components. Further, various empirical studies have shown that the use of a particular metric or combination of multiple metrics can improve the effectiveness of regression testing techniques better than others. For example, Anderson et al. (jeff16, ) introduced a new technique that identifies distinct usage patterns of software through telemetry data and showed that their technique can reduce regression test execution time by over 30 percent compared to traditional prioritization techniques. However, we believe that, rather than simply picking one metric over another, adopting a recommender system, that identifies more relevant metrics by considering software characteristics and the software testing environment might provide a better solution.
Recommender systems have been utilized to alleviate the decision making effort by providing a list of relevant items to users based on a user’s preference or item attributes. For example, companies that produce daily-life applications, such as Netflix, Amazon, and many social networking applications (recomsurvey05, ), are adopting recommender systems to provide more personalized services so that they can attract more users. Recently, recommender systems have been used in software engineering areas to improve various software engineering tasks. For example, Anvik et al. conducted research that applied machine learning techniques to developers as well as bug history to make suggestions about “who should fix this bug?” (who, ). While many software engineering techniques have started to incorporate recommendation systems, no researchers have investigated the use of recommender systems in the area of regression testing.
Therefore, we have investigated whether the use of recommender systems can improve regression testing techniques, in particular focusing on test case prioritization. To implement the recommender system, we used user interaction data and application change history information. Previous studies have shown that change history information is an effective indicator for bug prediction (raimund, ; method, ), and the most frequently accessed components have a higher impact on the user-perceived reliability of the application (bryce08, ; jeff16, ). Using this kind of information, our recommender system identifies potential components that contain faults that can lead to system failure. By running test cases that exercise such components earlier, we can in turn find defects that are exposable by user interactions earlier. We implemented a test case prioritization technique by applying our recommender system and performed an empirical study using two open source and one commercial web applications. The results of our study show that our proposed recommender system approach can improve the effectiveness of test case prioritization compared to four other control techniques.
The rest of the paper is organized as follows. In Section 2, we discuss the approach used in this research and formally define collaborative filtering recommender systems. Sections 3 and 4 present our empirical study, including the design, results, and analysis. Section 5 discusses the results and the implications of these results. Section 7 presents background and related work, and finally in Section 8, we provide conclusions and discuss future work.
2. The Proposed Approach
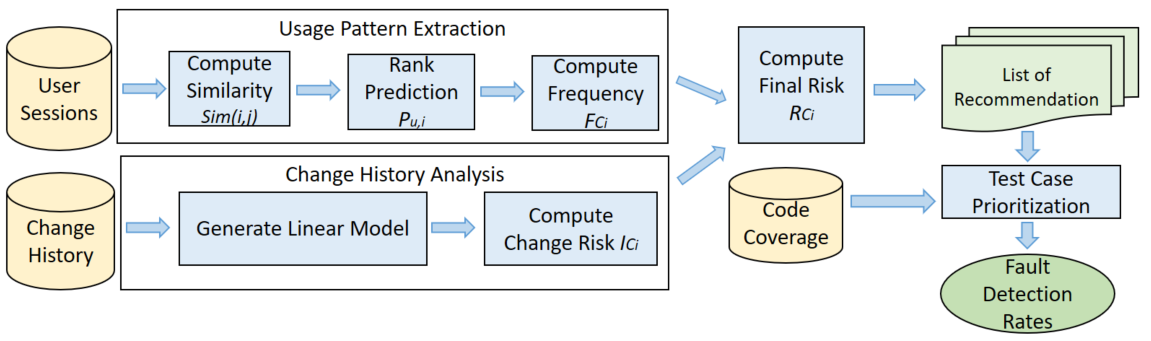
Figure 1 shows three major activities in our approach and how these activities are related to each other. The first step of our proposed technique is usage pattern extraction, which is shown in the upper box of Figure 1. In this activity, we analyze the users’ interaction data to determine the most frequently accessed components of the system. Our second activity is change history analysis, which is shown in the lower box of Figure 1. In this activity, we build a classification model to measure the relationship between software defects and change history metrics. Then, by obtaining the output from these two activities, we measure the risk score of each component and prioritize the test cases based on their coverage of these risky components. In this paper, component refers to method.
2.1. Usage Pattern Extraction
The goal of our recommender system is to suggest the highest-risk components with the most access frequency among all other components in the applications. In large scale applications, there are wide ranges of features and components; however, in reality, only a relatively small subset of components is accessed by users. Therefore, even if there are bugs in some part of the system that is not generally accessed by users, we assume that those bugs have less impact on the user-reliability perception of a system; catching those bugs that have been exposed by users is a bigger priority.
To calculate the access frequency of the components, we used two collected data sets: a list of users and a list of the components . Each component has a list of users’ ratings if users have performed at least one task with it. Typically, in recommender systems, prediction is based on the numerical values of ratings from active users, but in our case we do not have access to such rating modules; instead, we use the value of access frequency for a specific component by an individual active user as a rating score.
Suppose that we have a web application that has several functionalities; a group of users shows similar interests in using a set of components, while other groups of users use different sets of components. We want to measure the similarity between components by considering users’ activities and their preferences in using the components.
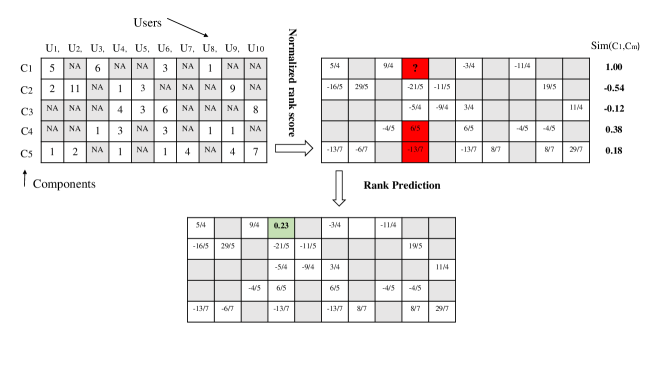
Figure 2 illustrates an example of component similarity prediction. The upper left-hand matrix in the figure shows how many times each component has been used by users. The numbers in the cells show the access frequency by the user of the component , and indicates that the user has not used that particular component yet. In this figure, , , , and utilized components ; and , , , , and utilized . We refer to a set of component ratings as a component vector. For example, the vector is 5, NA, 6, NA, NA, 3, NA, 1, NA, NA Once we identify the component vectors, we measure the similarity between and all other components one by one.
In order to determine the similarity between two components and , we use Pearson-r correlation (recom, ). If is the set of users who rated components and , then we compute the correlation similarity using the following equation:
where is the value of access frequency for component by user , and is the average access frequency value of .
The reason for finding the similarity between components is to find the missing value in the matrix. To measure the similarity between components, we normalize the rating of each component by subtracting the row mean. The upper right-hand matrix in Figure 2 shows the normalized rating values of the left matrix. For example, the average of access frequency of and is and , respectively. Then, we subtracted mean values from each corresponding row of the left matrix. Positive values indicate that the user used the component more than average; while negative values indicate that the user used the component less than average; 0 indicates the average access frequency for a component. We treat blank values as 0. The rightmost column in the upper right-hand matrix shows the similarity between and all other components. For example, means that the probability of rating of is much more like than .
After calculating the similarity between all components, we select the set of most similar components for ; this process will be iterated for every component. Once we have this set of , then we can make a prediction of access frequency for the missing values of based on a rating of the similar components. To estimate the access frequency rates of ignored components, we performed ratio prediction computation using a weighted sum method. This method provides the ratio prediction of a specific component for user based on similar components.
is the rating score for user and most similar components, and is the similarity score of component and . We illustrate this using an example in Figure 2. The lower matrix in the figure shows the predicted frequency access for , which is calculated by .
The number, , is determined based on the context of application domain, ranging from 1 to size of . However, assigning a large number to will increase the calculation cost significantly, while the result accuracy would not change noticeably. Therefore, to reduce the cost of the calculation process, we set , which means that to predict the missing values we only select the two most similar components to . This process is repeated until we find the ranking for the all missing values. Once we calculate ratio scores for the components, we can produce a matrix of components and their access frequency ranking scores. We calculate normalized access frequency scores using the following equation:
where is the predicted rank score and is the normalized rank score of component . Then we can sort the matrix of components based on their ranking to select most frequently accessed components.
2.2. Change History Analysis
The second phase of our proposed approach is change history analysis. Among hundreds of attributes of code and change history metrics to evaluate the code quality and error proneness, we chose change history metrics to identify the riskiest components. According to a previous study (raimund, ), change history is a better indicator for bug prediction purposes than code metrics.
The process of change analysis involves two major steps. First, we collect change history information (e.g., added lines of code, deleted lines of code, etc.) and bug reports from all available versions of the applications from their repositories. The details of collecting the change history information are discussed in Section 3.3. Once the change history data is collected, we then design a linear model from a set of collected change metrics to build a classification model for bug prediction. Our goal is to find the correlation coefficient of each metric to measure statistical relationships between a change metric and real defects. The value of this measure ranges between 1 and -1, where 1 indicates a strong positive relationship, 0 indicates no correlation, and a negative value indicates a reverse correlation.
To evaluate our linear model, we applied 10-fold cross validation and repeated this process 100 times. We used a common accuracy indicator to determine the accuracy of our model. The three accuracy indicators that we used are PC, TP and FP. PC indicates the percentage of correctly classified instances, TP (true positive) indicates the number of components that contain a bug (and our classification model also classified them as buggy components), and FP (false positive) is the number of components that are classified as buggy (but they are clean). The output of our classification model is a list of components with their risk values, (the risk score of being buggy for component ).
2.3. Test Prioritization Using the Recommender System
After obtaining the two metrics explained in previous subsections (component risk scores and access frequency ratios), we calculate the final risk scores using the following equation:
where is the access frequency score of component and is the fault risk score of . Using scores, our recommender system provides a ranked list of components. The ranked list of components contains those components of the system that are most likely to be the cause of regression faults. As shown in Figure 1, the test case prioritization algorithm reads two inputs (a recommended list of components and code coverage of tests), and reorders test cases.
For example, suppose we have five components with risk scores . Also, suppose we have a list of test cases with their code coverage information , such as . Then, we reorder the test cases in this order: , since covers , the two components having the highest risk score (0.561 + 0.251 = 0.812), and and will be executed last because covers , which has the lowest risk score (0.0014). only covers (this component has been covered by as well); and because covers more components (0.251 + 0.138 = 0.389), then it has higher priority than , which covers only . Finally, we calculate the fault detection rate of the reordered test cases by applying the proposed technique in the latest version of each application.
3. Study
Our study investigates whether the use of a recommender system can improve the effectiveness of test case prioritization techniques considering the following research question.
-
•
RQ: Can our recommender system be effective in improving the effectiveness of test case prioritization techniques when we have a limited time budget?
3.1. Objects of Analysis
To investigate our research question, we performed an empirical study using two open source applications and one commercial web application. DASCP is a digital archiving and scanning software designed for civil projects; we obtained this application from a private company. DASCP is a web based application written in ASP.Net and designed to store civil project contracts, which include the technical information of civil and construction projects such as project plans and relevant associated information. Our second application is nopCommerce, which is a widely used open source e-commerce web application with more than 1.8 million downloads. This application is written in ASP.Net MVC and uses Microsoft SQL Server (nopCommerece, ). The last application is Coevery, which is an open source customer relationship management (CRM) system written in ASP.Net. This application provides an easy framework for users to create their own customized modules without having to write any code (coevery, ).
| Metrics | DASCP | nopCommerce | Coevery |
|---|---|---|---|
| Classes | 107 | 1,919 | 2,258 |
| Files | 201 | 1,473 | 1,875 |
| Functions | 940 | 21,057 | 13,041 |
| LOC | 35,122 | 226,354 | 120,897 |
| Sessions | 748 | 1310 | 274 |
| Faults | 35 | 70 | 30 |
| Versions | 3 | 23 | 3 |
| Test Cases | 95 | 543 | 1,120 |
| Installations | 3 | 2 | 1 |
Table 1 lists the applications under study and their associated data: “Classes” (the number of class files), “Files” (the number of files), “Functions” (the number of functions/methods), “LOC” (the number of lines of code), “Sessions” (the number of user sessions that we collected), “Faults” (the total number of seeded and real faults), “Version” (the number of versions), “Test Cases” (the number of test cases), and “Installations” (the number of different locations where the applications were installed). Test cases were in the application package; we did not generate any new test cases. We downloaded all available versions of open source applications from the applications’ GitHub repositories.
3.2. Variables and Measures
3.2.1. Independent Variable
To investigate our research question, we manipulated one independent variable: prioritization technique. We considered five different test case prioritization techniques, which we classified into two groups: control and heuristic. Table 2 summarizes these groups and techniques. The second column shows prioritization techniques for each group. As shown in Table 2, we considered four control techniques and one heuristic technique. For our heuristic technique, we used the approach explained in Section 2, so, here, we only explain the control techniques we applied as follows:
| Group | Technique |
|---|---|
| Control | Change history-based () |
| Most frequent methods-based () | |
| Random () | |
| Greedy () | |
| Heuristic | Hybrid collaborative filtering-based () |
-
(1)
Change History-Based (): In order to perform this technique, we used the information that we obtained from the change history analysis approach, which we explained in Section 2.2. We prioritized our test cases based on the highest scores of the change risk list.
-
(2)
Most Frequent Methods-Based (): The most frequent methods usually have high dependency on other classes and methods. If one of them fails, it can cause a significant failure or degradation of the system. In order to prevent a domino effect in the system, high-frequency methods should be tested first, because their failure can cause other components to fail due to their dependencies.
-
(3)
Random (): The random prioritization technique randomly reorders test cases.
-
(4)
Greedy (): The greedy technique reorders test cases based on the total number of methods covered by test cases.
3.2.2. Dependent Variable
Our research question seeks to measure the effectiveness of our proposed approach when we have constrained resources. Qu et al. (myra, ) defined the normalized metric of APFD (apfd, ), which is the area under the curve when the numbers of test cases or faults are not consistent. The NAPFD formula is as follows:
In this formula, is a percentage of the test suite run, represents the total number of faults found by all test cases, is the first test case that catches the fault , and is the number of faults detected by the percentage of our budget divided by the total number of detected faults when running 100% of test cases.
3.3. Data Collection and Experimental Setup
In order to perform our experiment, for both the control and heuristic techniques we needed to collect three different types of datasets: telemetry data, change history, and code coverage information. We explain the data collection processes in the following subsections.
3.3.1. Collection of Telemetry Data
To collect telemetry data, we implemented a small function to record user interactions. We considered a sequence of each user’s interactions on a specific date as a user session. First, we uploaded two applications, Coevery and nopCommerce, on an IIS server at the University of X in November 2016. The server specification is CPU Core i7, with 16 GB of RAM. After deploying our applications, we recruited volunteer graduate and undergraduate computer science students and assigned a variety of tasks to them. These tasks to the volunteers were simple scenarios that each application is designed for. For example, in nopCommerce, we asked the volunteers to perform online shopping following the actual necessary steps, from login to payment. We also asked some of the users to be the system administrator, so we could monitor the whole system rather than only the end user side. We asked the end users to access other parts of the system randomly, for example, checking their inbox or wish list. In total, seventy volunteer students performed different tasks during a forty-day period. We collected 1,310 and 274 user sessions for nopCommerce, and Coevery respectively.
The data collection process for DASCP is different from that of Coevery and nopCommerce. The DASCP users whose data we examined are real users, and they have application domain knowledge. We collected a twelve-month period of user interactions for DASCP. In total, 748 user sessions were collected during the designated period of time.
However, the length of the sessions varied by user, date, and workplace. For example, some users performed all their assigned task a few hours before the determined deadline, while others distributed their tasks over several days. The average length of user sessions for nopCommerce is equal to 56 and, for Coevery, 24. However, in some cases we obtained session lengths over 300, especially when the interaction date was close to the deadline. Also, most of the Coevery users were selected among graduate students, since the functionality of this application is relatively more complex that of nopCommerce.
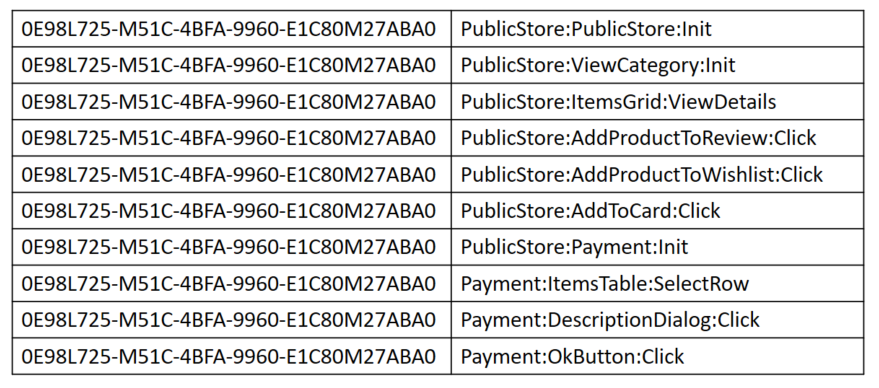
Figure 3 shows an example of the raw telemetry data. The left-hand column shows the session identifier, which is a user navigating through the system. The right-hand column is the set of server-side user interactions. The structure of the interactions is of the format (Form name):(Control name):(Action name).
3.3.2. Collection of Code Change History
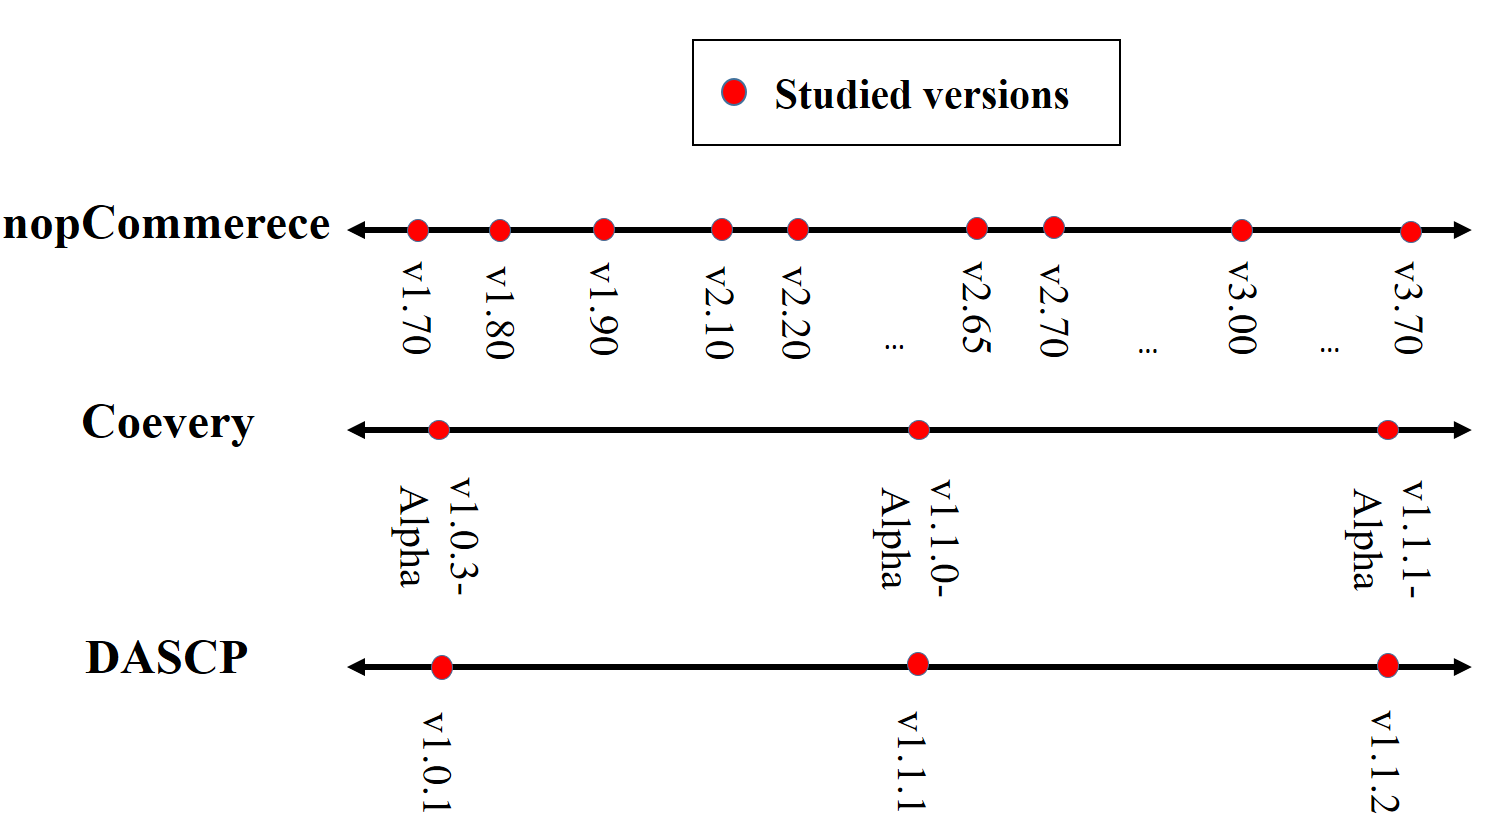
We had to take three steps to measure change risk. First, we needed a clear understanding of the applications with respect to their changes. For instance, we needed to check whether a change was just the renaming a variable or component, the addition of some comments, or an alteration of code by adding or deleting functions, and so on. Then, we needed to check whether changes had been made in the current version, and finally, we tested a recently changed system (change3, ). Figure 4 shows the versions that we used in this study. nopCommerece contains 36 versions but we used only the versions available on the GitHub repository as of the experiment date. However, for Coevery and DASCP, we used all available versions. All studied applications contain fine-grained changes, and the commits on these two open source applications are available in the GitHub repository.
In our study, we collected the change history of our three applications following Giger et al.’s approach (method, ). Most of these metrics have been used in bug detection research, and they are known to be good indicators for locating bugs (sungmicro, ; shihab12, ; raimund, ; change1, ; change2, ; method, ). Table 3 shows the applied change metrics in this study.
| Metrics Name | Description |
|---|---|
| Modification | Number of times a method was changed |
| LOC Added | Added lines of code to a method body over all method histories |
| Max LOC Added | Maximum added lines of code to a method body for all method histories |
| AVE LOC Added | Average added lines of code to a method body per method history |
| LOC Deleted | Deleted lines of code from a method body over all method histories |
| Max LOC Deleted | Maximum deleted lines from a method body for all method histories |
| AVE LOC Deleted | Average deleted lines from a method body per method history |
| Code Churn | Sum of all changes over all method histories |
| Max Code Churn | Maximum code churn for all method histories |
| AVE Code Churn | Average code churn per method history |
| Age | Age of a method in weeks from last release |
3.3.3. Collect Code Coverage
Once our recommender system was designed and implemented, we needed to find test cases that covered the recommended components. We collected the code coverage data of the latest version of AUTs for our test cases using the code coverage analysis tool that Microsoft Visual Studio provides as part of its framework. After collecting the code coverage information, we entered it into a relational database. We assigned unique identifier values for each method and test case, which provides a key for method and test tables. Hence, we could easily map the methods to the test cases that exercise them.
| MethodID | Risk Score | TestID1 | … | TestID n |
|---|---|---|---|---|
| 12 | 0.876 | 0 | 0 | |
| 287 | 0.012 | 1 | 0 | |
| 301 | 0.547 | 0 | 0 | |
| 148 | 0.145 | 1 | 1 | |
| 67 | 0.055 | 1 | 0 |
Table 4 show the code coverage data we collected. The first column, “MethodID”, shows the unique identifier values that we assigned for each method. The second column shows the final risk scores, which is the output of our recommender system. Other columns list our test cases with Boolean values: 0 indicates that the test case does not cover the method, and 1 indicates that the test case covers the method.
3.3.4. Faults
The applications contain real defects reported by users, but the number of defects is rather small considering the size of the applications we studied. Thus, two graduate students seeded additional faults by simulating programmers’ common mistakes (e.g., using a single equal sign to check equality). All seeded faults were in the server-side code level, and we ignored HTML-based and GUI faults. Four types of faults were seeded: (1) data faults that are related to interaction with the data store; (2) logic faults that are logic errors in the code; (3) action faults that modify parameter values and actions; and (4) linkage faults that change the hyperlinks references. Table 1 shows the total number of faults that including both real and seeded faults. The number of real faults for nopCommerce, Coevery, and DASCP is 25, 8, and 13, respectively. Once we collected all the required data, we ran control and heuristic techniques and calculated all the dependent values for the reordered test cases.
4. Data and Analysis
| Application | Test Exe. | Techniques | ||||
|---|---|---|---|---|---|---|
| Rate (%) | ||||||
| 10 | 18.54 | 15.12 | 14.33 | 19.81 | 23.37 | |
| 20 | 21.31 | 16.78 | 15.51 | 24.62 | 29.98 | |
| 30 | 28.86 | 25.12 | 18.47 | 38.23 | 40.95 | |
| 40 | 40.42 | 38.68 | 25.59 | 43.76 | 55.3 | |
| DASCP | 50 | 54.34 | 42.9 | 49.53 | 50.13 | 67.07 |
| 60 | 61.7 | 50.34 | 45.29 | 65.8 | 70.42 | |
| 70 | 68.34 | 65.97 | 60.74 | 74.66 | 76.67 | |
| 80 | 75.41 | 71.14 | 64.88 | 79.26 | 84.01 | |
| 90 | 83.35 | 77.69 | 67.11 | 88.32 | 89.83 | |
| 100 | 90.16 | 79.22 | 70.91 | 92.39 | 94.14 | |
| 10 | 17.54 | 15.75 | 8.33 | 16.85 | 28.14 | |
| 20 | 29.28 | 28.35 | 12.51 | 32.39 | 47.9 | |
| 30 | 38.86 | 35.45 | 15.57 | 34.73 | 55.28 | |
| 40 | 44.42 | 48.68 | 27.59 | 39.96 | 65.06 | |
| nopCommerce | 50 | 58.34 | 54.94 | 35.91 | 47.65 | 74.78 |
| 60 | 62.7 | 57.08 | 41.45 | 53.22 | 81.49 | |
| 70 | 68.14 | 59.97 | 50.02 | 59.39 | 86.38 | |
| 80 | 76.22 | 64.14 | 58.15 | 67.41 | 89.87 | |
| 90 | 79.4 | 70.22 | 60.17 | 71.81 | 95.14 | |
| 100 | 82.16 | 76.04 | 63.91 | 73.72 | 97.06 | |
| 10 | 26.54 | 29.12 | 20.33 | 26.15 | 41.02 | |
| 20 | 44.28 | 45.12 | 24.51 | 46.82 | 66.98 | |
| 30 | 60.86 | 50.12 | 28.57 | 53.71 | 73.28 | |
| 40 | 63.42 | 53.68 | 31.59 | 65.33 | 75.06 | |
| Coevery | 50 | 64.34 | 58.3 | 39.62 | 67.14 | 77.1 |
| 60 | 66.7 | 60.41 | 44.09 | 70.23 | 78.65 | |
| 70 | 68.19 | 62.97 | 46.11 | 73.14 | 81.13 | |
| 80 | 70.67 | 65.14 | 57.91 | 74.09 | 83.2 | |
| 90 | 71.81 | 66.03 | 59.01 | 74.69 | 86.69 | |
Our research question investigates whether the use of the recommender system can improve the effectiveness of test prioritization when we have a limited budget for testing, a common situation that the software industry often faces. To analysis this research question, we measured the NAPFD, which is a normalized ratio of APFD, when our resources were not consistent. In this experiment, first we executed 10% of our test cases, and we continued to execute the test cases in increments of 10% of the total until they had all been executed to see whether we could improve the fault detection rate, given a time constraint dictating that running 100% of the test cases at one time was not feasible.
Table 5 shows the results of our three applications. By examining the numbers in the table, we can observe that the improvement rates of our heuristic technique over the control techniques vary widely. When we compared the heuristic with , the improvement rates ranged from 4% to 41% for DASCP, from 17% to 63% for nopCommerce, and from 17% to 54% for Coevery. When compared with , the improvement rates ranged from 15% to 78% for DASCP, from 27% to 78% for nopCommerce, and from 27% to 48% for Coevery, indicating results similar to those for as . When compared with , the improvement rates ranged from 1% to 33% for DASCP, from 31% to 67% for nopCommerce, and from 10% to 56% for Coevery, showing improvement over a popular and commonly used technique. As for the comparison with , the results were more remarkable. The rates ranged from 32% to 282% for all three applications. Note that the results for random technique are average of iterating this technique for 10 times.
One outstanding trend we observed in the table is that the improvement rates are much higher when the time budget is smaller. For example, in the comparison with for nopCommerce, when 10% of the budget was assigned, the improvement rate was 60%, but when we had a full budget, the rate dropped to 18%. A similar trend can be observed across all control techniques and applications. This indicates that our approach can be more helpful when companies are operating under a tight budget.
5. Discussion
Our experiment results indicate that by utilizing a recommender system when we prioritize test cases, we were able to improve the effectiveness of test case prioritization. While we have not conducted a cost benefit analysis of our approach, which is our future work, we found that the cost of applying our approach is negligible. The biggest cost for applying our approach is calculating the matrix of access frequency scores, but it took only 580, 153, and 374 seconds for nopCommerce, Coevery and DASCP, respectively. Further, the prioritization algorithm took only 0.29 seconds for nopCommerce, the application that has the largest number of test cases.
Limitations of Applying Recommender Systems
There are three common limitations in collaborative filtering recommender systems; new user problem, new item problem, and sparsity (recomsurvey05, ). Among these three limitations, two of them are related to our study.
Sparsity. As we discussed earlier, we do not have a rating module in our applications, and thus we used access frequencies to each component as a user rating. Further, for the open source applications, nopCommerce and Coevery, we collected the user interaction data from nonprofessional users, so our data could contain noise and redundancy, which can affect the performance of our technique. Moreover, the number of collected ratings is relatively small, compared to the number of expected ratings required to generate an accurate prediction.
Also, the distribution patterns of user ratings can affect the outcome of collaborative filtering algorithms. For example, in nopCommerce case, some components were used by all users, such as registration and membership components, while some other components were ignored by the majority of users. In order to eliminate this issue, we need to collect more user interaction data by considering a larger number of users and a longer period of time. In addition, having actual users would generate more realistic results, because their interactions would be based on real business functions and system workflows.
New Item Problem. Another limitation of collaborative filtering that is related to our study is the “New Item Problem”. It is a common practice that newly developed components are frequently added to a system. However, rankings on collaborative filtering algorithms are based on user access frequencies to the components. Therefore, the newly added components would not appear in the recommender suggestion list until a certain number of users perform some tasks on them. In our study, in addition to using access frequency scores, we also applied change risk scores to recommend the riskiest components. Therefore, even if a new component has a high change risk score, its frequency score would still be zero, which makes the overall risk score zero. To overcome this limitation, we need to use a hybrid and normalized ranking score by assigning a small value to the components.
6. Threats to Validity
The primary threat to validity of this study is the amount of user session data and the type of users who participated in this study. For the proprietary application that we used in this study, we collected user interaction data for a long period time; the collected data was created by actual users of the application. However, for the two open source applications, the period of time over which we collected user interactions was relatively short, and the participants were not domain experts or regular users of the applications, so their usage patterns had wide variations. This threat can be addressed by performing additional studies that monitor user interactions over a longer time period among a wider population, and by considering industrial applications and different types of applications (e.g., mobile applications).
Another concern involves the bug reports that we used. Our classification prediction values for designing linear models in the change history analysis were generated from bug history that was reported by actual users. Further, using these bug reports, we measured the coefficient of other variables to create our linear model for change history analysis. Because our bug report data is not comprehensive and contains only those bugs accrued up to the time that we stopped collecting data, and because there might be other bugs that have not been reported yet or that might occur later, there is a possibility that the bug reports are biased.
7. Related Work
Test Case Prioritization
Due to the appealing benefits of test case prioritization in practice, many researchers have proposed various techniques. These techniques help engineers discover faults early in testing, which allows them to begin debugging earlier. Recent surveys (catal13, ; marksurvey, ) provide a comprehensive understanding of overall trends of the techniques and suggest areas for improvement. Depending on the types of information available, various test case prioritization techniques can be utilized, but the majority of prioritization techniques have used source code information to implement the techniques. For instance, many researchers have utilized code coverage information to implement prioritization techniques (elbaum02feb, ; kim02may, ; rothermel01oct, ).
Further, some researchers have used software risk information in testing approaches. For instance, Frankl and Weyuker (weyuker, ) introduced two risk related measures of software testing effectiveness, which are expected detected risk and expected risk reduction and investigated the effectiveness of these two measures on testing techniques. Hettiarachchi et al. (risk, ) proposed a new test case prioritization technique. Their technique uses risk levels of potential defects to detect risky requirements then it prioritizes test cases by mapping the related test cases and these requirements.
More recently, several prioritization techniques utilizing other types of information have also been proposed. For example, Anderson et al. applied telemetry data to compute fingerprints to extract usage patterns and for test prioritization (jeff16, ). Brooks and Memon performed a study applying telemetry data to generate usage pattern profiles (memongui, ). Gethers et al. presented a method that uses textual change of source code to estimate an impact set (kagdichange, ).
Recommender Systems
Recommender systems are software engineering tools that make the decision making process easier by providing a list of relevant items. Some widely-used applications that provide recommender systems are Amazon, Facebook, and Netflix. These applications provide suggestions to target users based on the user or on item characteristic similarities.
With the fast growth of such information, machine learning technologies motivate software engineers to apply recommendation systems in software development. Recommender systems in software engineering have been applied to improve software quality and to address the challenges of the development process (rssebook, ). For instance, Murakami et al. (murakami, ) proposed a technique that uses user editing activities detecting code relevant to existing methods. Danylenko and Lowe provided a context-aware recommender system to automate a decision-making process for determining the efficiency of non-functional requirements (contextawar, ).
As discussed briefly earlier, many types of information are available for implementing test case prioritization techniques. In this research, we collected over 2,000 user sessions from three different web applications and gathered the change history of each application. Our research seeks to apply item-based collaborative filtering algorithms to generate a recommendation list for test prioritization. To our knowledge, our recommender system-based prioritization technique is novel and has not yet been explored in regression testing.
8. Conclusions and Future Work
In this research, we proposed a new recommender system to improve the effectiveness of test case prioritization. Our recommender system uses three datasets (code coverage, change history, and user sessions) to produce a list of the riskiest components of a system for regression testing. We applied our recommender system using two open source applications and one industrial application to investigate whether our approach can be effective compared to four different control techniques. The results of our study indicate that our recommender system can improve test case prioritization; also, the performance of our approach was particularly noteworthy when we had a limited time budget.
In future research, we plan to investigate other approaches to address a sparsity problem of our recommender system by applying an associative retrieval framework and related spreading activation algorithms to track user transitive interactions through their previous interactions. To address the “New Item Problem,” we plan to apply knowledge-based techniques such as case-based reasoning.
Acknowledgments
This work was supported, in part, by NSF CAREER Award CCF-1564238 to University of North Texas.
References
- [1] hhttp://www.nopcommerce.com/. [Accessed: Jan. 26, 2017].
- [2] http://www.coevery.com/. [Accessed: Jan. 26, 2017].
- [3] J. Anderson, H. Do, and S. Salem. Customized regression testing using telemetry usage patterns. In Software Maintenance and Evolution (ICSME), 2016 IEEE International Conference on. IEEE, 2016.
- [4] J. Anvik, L. Hiew, and G. C. Murphy. Who should fix this bug? In Proceedings of the 28th international conference on Software engineering, pages 361–370. IEEE-ACM, 2006.
- [5] Shawn A. Bohner. Extending software change impact analysis into cots components. In Proceedings of the 27th Annual NASA Goddard Software Engineering Workshop, page 175. IEEE-ACM, 2002.
- [6] P. A. Brooks and A. M. Memon. Automated gui testing guided by usage profiles. In In Proceedings of the twenty-second IEEE/ACM international conference on Automated software engineering, pages 333–342. IEEE-ACM, 2007.
- [7] C. Catal and D. Mishra. Test case prioritization: A systematic mapping study. Software Quality Journal, 21:445–478, 2013.
- [8] A. Danylenko and W. Lowe. Context-aware recommender systems for non-functional requirements. In Proceedings of the Third International Workshop on Recommendation Systems for Software Engineering, pages 80–84. IEEE-ACM, 2012.
- [9] S. Elbaum, A. G. Malishevsky, and G. Rothermel. Test case prioritization: A family of empirical studies. IEEE Transactions on Software Engineering, 28(2):159–182, February 2002.
- [10] P. Frankl and E. Weyuker. Testing software to detect and reduce risk. In Journal of Systems and Software, 2000.
- [11] G. and A. Tuzhilin. Toward the next generation of recommender systems a survey of the state of the art and possible extensions. IEEE Transactions on knowledge and Data Engineering, 17(6):734–749, 2005.
- [12] M. Gethers, B. Dit, H. Kagdi, and D. Poshyvanyk. Integrated impact analysis for managing software changes. In Proceedings of the 34th International Conference on Software Engineering, pages 430–440. IEEE-ACM, 2012.
- [13] E. Giger, M. D’Amborce, M. Pinzger, and H. Gall. Method-level bug prediction. In ESEM, 2012.
- [14] C. Hettiarachchi, H. Do, and B. Choi. Effective regression testing using requirements and risks. In Eighth International Conference on Software Security and Reliability, pages 157–166. IEEE, 2014.
- [15] Y. Jiang, B. Cuki, T Menzies, and N Bartlow. Comparing design and code metrics for software quality prediction. In Proceedings of the 4th international workshop on Predictor models in software engineering, pages 11–18. ACM, 2008.
- [16] J. Kim and A. Porter. A history-based test prioritization technique for regression testing in resource constrained environments. In Proceedings of the International Conference on Software Engineering, May 2002.
- [17] T. Lee, J. Nam, D. Han, S. Kim, and H. Peter. Micro interaction metrics for defect prediction. In ESEC/FSE ’11 Proceedings of the 19th ACM SIGSOFT symposium and the 13th European conference on Foundations of software engineering, pages 311–321. IEEE-ACM, 2011.
- [18] R. Moser, W. Pedrycz, and G. Succi. A comparative analysis of the efficiency of change metrics and static code attributes for defect prediction. In ICSE ’08 Proceedings of the 30th international conference on Software engineering, pages 181–190. IEEE-ACM, 2008.
- [19] N. Murakami, H. Masuhara, and T. Aotani. Code recommendation based on a degree-of-interest model. In Proceedings of the 4th International Workshop on Recommendation Systems for Software Engineering, pages 28–29. IEEE-ACM, 2014.
- [20] N. Nagappan and T. Ball. Use of relative code churn measures to predict system defect density. In ICSE ’05 Proceedings of the 27th international conference on Software engineering, pages 284–292. IEEE-ACM, 2005.
- [21] X. Qu, M.B. Cohen, and G.Rothermel. Configuration-aware regression testing: an empirical study of sampling and prioritization. In International Symposium on Software Testing and Analysis (ISSTA), pages 75–85. IEEE-ACM, 2008.
- [22] M. P. Robillard, W. Maalej, R. J. Walker, and T. Zimmermann. Recommendation Systems in Software Engineering. Springer, 2014.
- [23] G. Rothermel, R. Untch, C. Chu, , and M. J. Harrold. Test case prioritization: An empirical study. In Proceedings of the IEEE International Conference on Software Maintenance, pages 179–188. IEEE-ACM, 1999.
- [24] G. Rothermel, R. Untch, C. Chu, and M. J. Harrold. Prioritizing test cases for regression testing. IEEE Transactions on Software Engineering, 27(10):929–948, October 2001.
- [25] S Sampath, R. C. Bryce, G. Viswanath, V. Kandimalla, and A. G. Koru. Prioritizing user-session-based test cases for web applications testing. In ICST ’08 Proceedings of the 2008 International Conference on Software Testing, Verification, and Validation, pages 141–150. IEEE-ACM, 2008.
- [26] B. Sarwar, G. Karypis, J. Konstan, and J. Riedl. Item-based collaborative filtering recommendation algorithms. In Proceedings of the 10th international conference on World Wide Web, pages 285–295. IEEE-ACM, 2001.
- [27] E. Shihab, A. E. Hassan, B. Adams, and Z. M. Jiang. An industrial study on the risk of software changes. In FSE ’12 Proceedings of the ACM SIGSOFT 20th International Symposium on the Foundations of Software Engineering, page 62. ACM, 2012.
- [28] S. Yoo and M. Harman. Regression testing minimization, selection and prioritization: a survey. Software Testing, Verification and Reliability, 22(2):67–120, 2012.