ALMA Reveals an Inhomogeneous Compact Rotating Dense Molecular Torus at the NGC 1068 Nucleus
Abstract
We present the results of our ALMA Cycle 4 high-spatial-resolution (004–007) observations, at HCN J=3–2 and HCO+ J=3–2 lines, of the nucleus of NGC 1068, the nearby prototypical type 2 active galactic nucleus (AGN). Our previous ALMA observations identified the compact emission of these lines at the putative location of the torus around a mass-accreting supermassive black hole. We now report that we have detected the rotation of this compact emission, with the eastern and western sides being redshifted and blueshifted, respectively. Unlike the previously reported CO J=6–5 emission, both the morphological and dynamical alignments of the HCN J=3–2 and HCO+ J=3–2 emission are roughly aligned along the east–west direction (i.e., the expected torus direction), suggesting that these molecular lines are better probes of a rotating dense molecular gas component in the torus. The western part of the torus exhibits larger velocity dispersion and stronger emission in the HCN J=3–2 and HCO+ J=3–2 lines than the eastern part, revealing a highly inhomogeneous molecular torus. The dense molecular gas in the torus and that of the host galaxy at 05–20 from the AGN along the torus direction are found to be counter-rotating, suggesting an external process happened in the past at the NGC 1068 nucleus.
Subject headings:
galaxies: active — galaxies: nuclei — galaxies: Seyfert1. Introduction
Active galactic nuclei (AGNs) exhibit very bright emission from the nuclear compact regions of galaxies. The origin of the emission is believed to be the release of gravitational energy by a mass-accreting supermassive black hole (SMBH) into radiative energy. Some AGNs exhibit a strong time-varying optical continuum and broad optical emission lines (classified as type 1), while others do not (type 2). A unified picture of AGNs has been proposed based on observations of the nearby type-2 AGN, NGC 1068 (z = 0.0037, distance 14 Mpc, 1 arcsec is 70 pc) (Antonucci & Miller, 1985); Type-1 and -2 AGNs are intrinsically the same, but the central engine (= a mass-accreting SMBH) and the surrounding sub-pc-scale broad-line-emitting regions of a type-2 AGN are hidden behind a toroidally distributed obscuring medium, the so-called “dusty molecular torus” (Antonucci, 1993). This AGN unification paradigm has become widely accepted because it naturally explains observational results from various AGNs. In this way, the torus plays an important role in AGNs, but our understanding of its physical/chemical/morphological/dynamical properties is observationally still highly incomplete because its compact size (a few 10 pc or 0.5 arcsec at a 10 Mpc distance) makes it difficult to clearly spatially resolve emission from the torus.
The dust in close proximity to the mass-accreting SMBH is heated to high temperatures (100 K) by the AGN’s strong energetic UV–X-ray radiation, so that the torus is expected to shine brightly in the mid-infrared (3–20 m) wavelengths. Using the very high-spatial-resolution (10 mas) interferometric technique, the mid-infrared 10 m emitting region of the torus in NGC 1068 was estimated to be several pc elongated along the east–west direction (Jaffe et al., 2004; Poncelet et al., 2006; Raban et al., 2009; Burtscher et al., 2013; Lopez-Gonzaga et al., 2014). However, the 10 m continuum emission may be biased toward the inner hotter region and therefore may not reflect the overall structure of the torus (Schartmann et al., 2008). Furthermore, recent mid-infrared observations of NGC 1068 and other nearby AGNs have demonstrated that the observed mid-infrared continuum is often dominated by radiation from and/or scattering by polar dust, rather than emission from the putative torus (Bock et al., 2000; Alloin et al., 2000; Tomono et al., 2001; Tristram et al., 2014; Honig et al., 2017). Quantitative discussion of the torus based on mid-infrared continuum observations has recently been recognized as more complicated than previously thought. Finally, and most importantly, no dynamical information can be obtained from the dust continuum data.
High-spatial-resolution molecular line observations using ALMA are a powerful tool for investigating the morphological structure of the torus, where molecular gas and dust are expected to coexist. More importantly, we can use molecular line observations to obtain information about the dynamics of the torus. Imanishi et al. (2016) presented 01–02 resolution ALMA observational results of the NGC 1068 nucleus at the HCN J=3–2 and HCO+ J=3–2 lines (= dense molecular tracers) and detected compact emission at the location of the putative torus around the central mass-accreting SMBH by clearly isolating from the surrounding much brighter molecular emission at the inner 5 arcsec region of the host galaxy. However, no meaningful information concerning the dynamics of the torus was obtained, due to the limited spatial resolution. Garcia-Burillo et al. (2016) conducted 005–007 resolution CO J=6–5 line observations of the NGC 1068 nucleus and spatially resolved the molecular emission from the torus. These authors found that the redshifted and blueshifted CO J=6–5 emission lines were aligned along the north–south direction, which is highly tilted with respect to the morphologically elongated east–west direction (i.e., the expected torus direction), and interpreted that the molecular gas in the torus is highly turbulent (Garcia-Burillo et al., 2016). Gallimore et al. (2016) also detected redshifted and blueshifted CO J=6–5 line emission roughly along the north–south direction and argued that the detected emission originated from bipolar outflow activity in the direction almost perpendicular to the torus. The dynamical origin of the compact CO J=6–5 line emission is not clear, and the CO J=6–5 emission could be largely affected by highly excited molecular gas in the outflow. To better understand the properties of the torus, it is desirable to make high-spatial-resolution observations using different dense gas tracers. In this letter, we present the results of our ALMA 004–007 resolution observations of the HCN J=3–2 and HCO+ J=3–2 lines of the NGC 1068 nucleus.
2. Observations and Data Analysis
We conducted ALMA band 6 (211–275 GHz) observations of the NGC 1068 nucleus in our Cycle 4 program 2016.1.00052.S (PI = M. Imanishi). In addition to the long baseline observations required to achieve very high-spatial-resolution (004–007), we conducted shorter baseline observations to recover 1′′ scale spatially extended diffuse emission. Table 1 summarizes our observational details. We combined our Cycle 4 data with our ALMA Cycle 2 01–02 resolution observational data (2013.1.00188.S) of the same molecular lines to improve the signal to noise (S/N) ratio.
| Data | Date | Antenna | Baseline | Integration | Calibrator | ||
|---|---|---|---|---|---|---|---|
| [UT] | Number | [m] | [min] | Bandpass | Flux | Phase | |
| (1) | (2) | (3) | (4) | (5) | (6) | (7) | (8) |
| Cycle 4 | 2016 Oct 19 | 44 | 17–1808 | 44 | J02381636 | J02381636 | J02390234 |
| Cycle 4 | 2016 Oct 19 | 44 | 17–1808 | 44 | J02381636 | J02381636 | J02390234 |
| Cycle 4 (H1) | 2017 Sep 11 | 40 | 41–7552 | 39 | J00060623 | J00060623 | J02390234 |
| Cycle 2 | 2015 Sep 19 | 36 | 41–2270 | 25 | J02240659 | J0334401 | J02190120 |
Note. — Col.(1): Data. Col.(2): Observing date in UT. Col.(3): Number of antennas used for observations. Col.(4): Baseline length in meter. Minimum and maximum baseline lengths are shown. Col.(5): Net on source integration time in min. Cols.(6), (7), and (8): Bandpass, flux, and phase calibrator for the target source, respectively.
We adopted the widest 1.875 GHz width mode in each spectral window. We took spectra at 263.7–268.6 GHz with three spectral windows to cover HCN J=3–2 ( = 265.886 GHz) and HCO+ J=3–2 ( = 267.558 GHz) lines, as well as vibrationally excited HCN v2=1f J=3–2 ( = 267.199 GHz) and HCO+ v2=1f J=3–2 ( = 268.689 GHz) lines.
We used CASA (https://casa.nrao.edu) for our data reduction, starting from calibrated data provided by ALMA. We determined a continuum flux level using data that were not affected by obvious emission lines, and used the CASA task “uvcontsub” to subtract a constant continuum from molecular line data. We then applied the task “clean” (Briggs-weighting 111 www.aoc.nrao.edu/dissertations/dbriggs/ , robust=0.5, gain 0.1) to the continuum-subtracted molecular line data and the extracted continuum data. The adopted velocity resolution was 20 km s-1, and the pixel scale was 001 pixel-1.
We created cleaned images by using (a) Cycle 4 longest baseline data only (dubbed as “H1” in Table 1) and (b) Cycle 2 and all Cycle 4 data. We achieved a smaller spatial resolution for (a), but recovered a larger amount of molecular emission from the central several arcsec region of the host galaxy from (b). We thus used the data from (a) to investigate the morphological and dynamical properties of the compact torus in detail, as the achieved S/N ratios were sufficient for this purpose. The data from (b) will be used to discuss molecular emission in the host galaxy outside the compact torus-associated emission, by recovering 13 scale emission components. Diffuse emission with a spatial extent of 2′′ is resolved out in our ALMA data.
3. Results
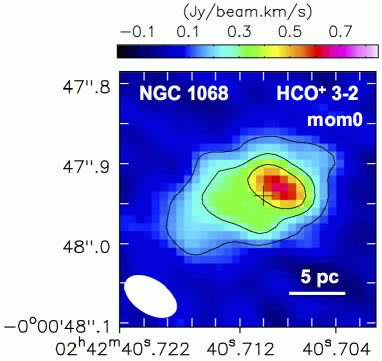
Figure 1 shows the continuum map, integrated intensity (moment 0) and intensity-weighted mean velocity (moment 1) maps of HCN J=3–2 and HCO+ J=3–2, obtained using dataset (b). Their overall spatial distributions within the central 5 arcsec of NGC 1068, previously revealed by our 01–02 resolution Cycle 2 data (Imanishi et al., 2016), are reproduced in our new Cycle 4 data. The continuum peak position in our 001 pixel-1 map is (02h42m40.710s, 00∘00′47.94′′)ICRS for both dataset (a) and (b). We regard this coordinate as the location of the AGN (i.e., a mass-accreting SMBH) because it spatially coincides with the radio VLBA 5 GHz continuum peak position (Gallimore et al., 2004). The continuum emission at 266 GHz is detected also at the northern side of the nucleus, along the radio jet (Gallimore et al., 2004).
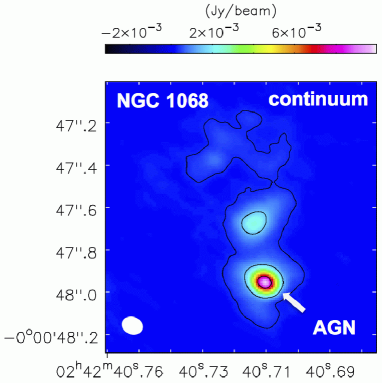
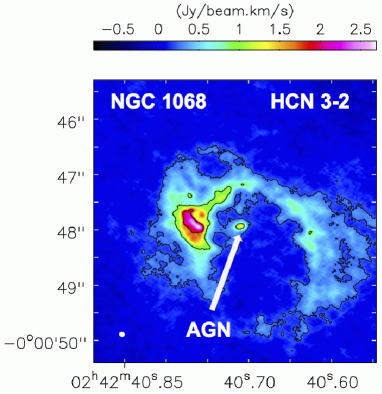
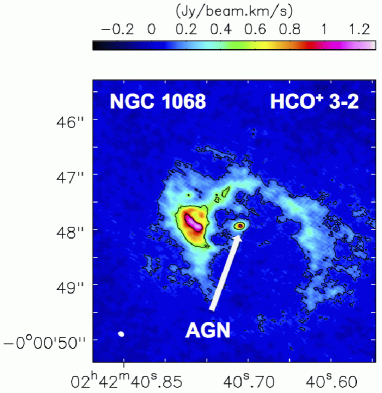
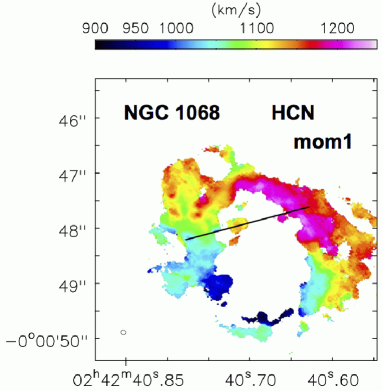
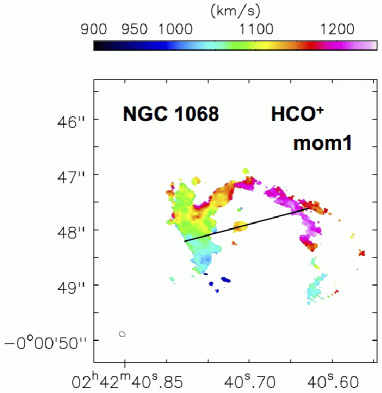
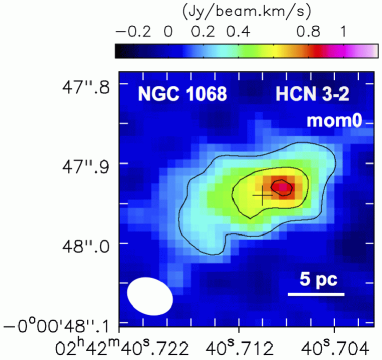
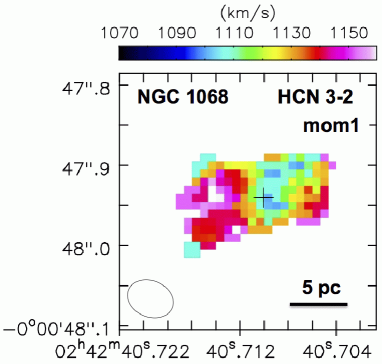
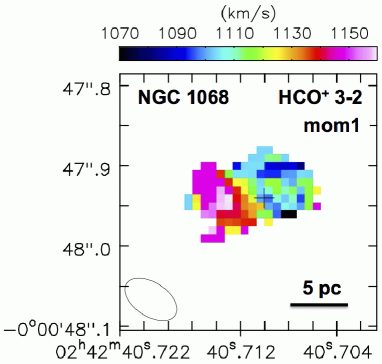
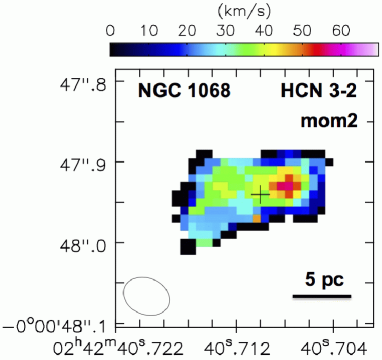
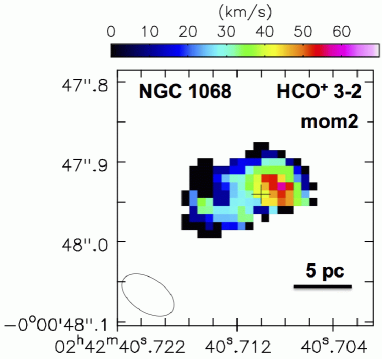
Figure 2 shows the moment 0, moment 1, and intensity-weighted velocity dispersion (moment 2) maps of HCN J=3–2 and HCO+ J=3–2 for the nuclear compact emission component (labeled “AGN” in Figure 1), obtained using only the Cycle 4 longest baseline data (a). In the moment 0 maps, the emission is elongated almost along the east–west direction for both HCN J=3–2 and HCO+ J=3–2. We used the CASA task “imfit” function in these maps to estimate the position angles to be PA = 1073∘ and 1096∘ (east of north) for the HCN J=3–2 and HCO+ J=3–2 emission, respectively. The deconvolved emission sizes, which we also estimated using “imfit”, are 18617 mas 637 mas (13 pc 4 pc) for HCN J=3–2 and 16818 mas 7112 mas (12 pc 5 pc) for HCO+ J=3–2, respectively. In the moment 1 maps, we see signatures of rotation patterns such that the eastern (western) part of the mass-accreting SMBH is redshifted (blueshifted) for both HCN J=3–2 and HCO+ J=3–2. In the moment 2 maps, the velocity dispersion is larger in the western part than in the eastern part for both HCN J=3–2 and HCO+ J=3–2. These representative observed properties about morphology and dynamics are seen in a similar manner between HCN J=3–2 and HCO+ J=3–2, strongly suggesting that they are real.
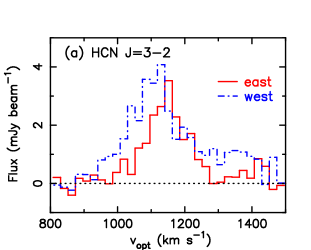
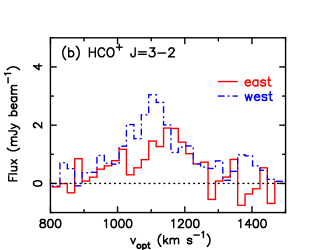
We investigated the rotational motion in more detail by making spectra within the beam size at the eastern redshifted region (centered on [02h42m40.714s, 00∘00′47.951′′]ICRS) and the western blueshifted region (centered on [02h42m40.708s, 00∘00′47.923′′]ICRS) for HCN J=3–2 (Figure 3a) and HCO+ J=3–2 (Figure 3b). The peak velocity at the eastern region is slightly redshifted with respect to that at the western region, as expected from the rotational motion.
We extracted HCN J=3–2 and HCO+ J=3–2 spectra within the 02 (east–west) 015 (north–south) rectangular region around the mass-accreting SMBH position and applied Gaussian fits, which are shown in Figure 3(c) and (d). We obtained peak optical LSR velocity = 11373 (km s-1), full-width at half-maximum FWHM = 1569 (km s-1), peak flux density = 161 (mJy) for HCN J=3–2, and peak optical LSR velocity = 11244 (km s-1), FWHM = 19010 (km s-1), and peak flux density = 101 (mJy) for HCO+ J=3–2. The Gaussian fit fluxes are 2.60.2 (Jy km s-1) and 2.00.1 (Jy km s-1) for HCN J=3–2 and HCO+ J=3–2, respectively. Some excess emission at the redshifted side of the HCN J=3–2 emission lines is recognizable (Figure 3c).
The vibrationally excited HCN v2=1f J=3–2 ( = 267.199 GHz) and HCO+ v2=1f J=3–2 ( = 268.689 GHz) emission lines were not clearly detected in the nuclear spectra.
4. Discussion
Unlike CO J=6–5 emission, whose morphological and dynamical directions (roughly east-west and north-south, respectively) are largely tilted with 50∘ (Garcia-Burillo et al., 2016), our ALMA data show that the HCN J=3–2 and HCO+ J=3–2 emission are aligned approximately along the east–west direction (PA = 100–110∘), both morphologically (moment 0 map) and dynamically (moment 1 map). This direction is aligned with that of the mid-infrared 10 m dust continuum emission from the torus (Jaffe et al., 2004; Poncelet et al., 2006; Raban et al., 2009; Burtscher et al., 2013; Lopez-Gonzaga et al., 2014) as well as the VLBA radio continuum which is thought to trace the inner plasma torus (Gallimore et al., 2004). The inner part of the morphology of the optical [OIII] emission line is elongated along the north–south direction (Evans et al., 1991; Das et al., 2006). As AGN’s ionizing photons can only escape in directions that are not blocked by the torus, the [OIII] emission line data also support the hypothesis that the torus in NGC 1068 is oriented east–west. Our high-spatial-resolution ALMA data demonstrate that the HCN J=3–2 and HCO+ J=3–2 emission lines probe the bulk of the rotating dense molecular gas that spatially coexists with the dust in the torus.
A simple torus model postulates that the molecular gas and dust are distributed axisymmetrically around a mass-accreting SMBH. However, our ALMA data demonstrate that molecular emission from the torus is not axisymmetrical in that the western part is brighter and exhibits larger dispersion than the eastern part for both HCN J=3–2 and HCO+ J=3–2 (Figure 2). A natural interpretation is that the molecular turbulence is higher in the western region, which reduces the line opacity, resulting in the higher observed molecular line flux. Molecular gas spatial distribution can be inhomogeneous if conversion from molecular gas into stars is not uniform spatially. Feedback from supernovae in the local nuclear starbursts in the torus 222 Infrared spectroscopy revealed no detectable polycyclic aromatic hydrocarbon (PAH) emission features (= a good starburst indicator) at the NGC1068 nucleus (Imanishi et al., 1997; Imanishi, 2002). The upper limit of the starburst far-infrared luminosity is 2.7 1043 (erg s-1) (Imanishi et al., 2016) or star-formation rate with 1.3 M⊙ yr-1 (Kennicutt, 1998). (Wada et al., 2009) can also alter the spatial distribution and turbulence of the molecular gas in which case radiation from the central AGN has a different effect to molecular gas from position to position within the torus (Wada et al., 2016). The resulting inhomogeneous spatial distribution and dynamics of the molecular gas, as well as the different AGN radiation effect, may explain the observed inhomogeneous molecular line emission.
The HCN J=3–2 luminosity, derived using Equations (1) and (3) of Solomon & Vanden Bout (2005), is 14011 [L⊙] or (2.30.2)105 [K km s-1 pc2]. If the HCN emission is optically thick and thermalized (sub-thermal) at up to J=3, the luminosity in units of [K km s-1 pc2] for HCN J=1–0 is the same as (larger than) that of HCN J=3–2. By applying the conversion factor from the HCN J=1–0 luminosity to the dense molecular mass, Mdense = 10 HCN J=1–0 luminosity [M⊙ (K km s-1 pc2)-1] (Gao & Solomon, 2004; Krips et al., 2008), we obtain the dense molecular mass within the central 02015 (14 pc 10 pc) rectangular region to be 2 106 M⊙, or possibly even higher. Though there may be a large ambiguity in the above conversion factor, the derived dense molecular mass is substantially smaller than the SMBH mass of NGC 1068, 1 107M⊙ (Greenhill et al., 1996; Hure, 2002; Lodato & Bertin, 2003), which was estimated from the rotational motion of a water maser disk much inside the dense molecular torus that we are now probing.
From the moment 1 maps in Figure 2 and spectra at the east and west regions in Figure 3, we derive the rotational velocity to be v/sin() 20 (km s-1) at distance r 3 (pc) from the mass-accreting SMBH, where the inclination angle () is estimated to be = 34–46∘ (Garcia-Burillo et al., 2016). Assuming that this rotation is Keplerian motion governed by the central SMBH mass, even if we adopt the lowest value of = 34∘, this yields a value for the enclosed mass inside the rotating dense molecular disk to be 9 105M⊙, which is much lower than the above estimated SMBH mass. This suggests that the dynamical motion of the dense molecular gas at a scale of a few pc is far from Keplerian, as argued by some theories (Chan & Krolik, 2017).
At the HCN J=3–2 and HCO+ J=3–2 emission lines, the eastern (western) part is redshifted (blueshifted) in the torus (Figure 2), while the eastern (western) dense molecular gas in the central 05–20 region of the host galaxy along the torus direction (shown as the solid lines in the bottom plots of Figure 1) is blueshifted (redshifted) (Figure 1). Thus, the torus and molecular gas in the inner part of the host galaxy are dynamically decoupled, and it seems that some external process is required. Furuya & Taniguchi (2016) and Tanaka et al. (2017) argued that a minor merger took place in NGC 1068, and this may be responsible for the dynamical decoupling. The dense molecular torus we are probing is likely to have experienced some disturbance, which might be related to the observed non-Keplerian motion.
The amount of molecular gas and dust in the torus in the vicinity close to the central AGN is expected to decrease due to outflow by radiation pressure from the central AGN and nuclear starbursts, conversion of molecular gas into stars inside the torus, a mass inflow into the central SMBH, and/or other forces. A mass supply from the host galaxy is required to maintain the structure of the torus over the long term. We have detected bridging emission from the torus in the eastern direction to massive molecular clouds in the host galaxy in our new ALMA data with 3, for both HCN J=3–2 and HCO+ J=3–2 (Figure 1). Even though we cannot rule out the possibility that this emission is just a superposition of two unrelated emission components along this line of sight, this might be related to a long-sought-after mass inflow from a host galaxy to the outer part of an AGN torus. Further observations of this emission will be interesting.
5. Summary
We conducted 004–007 resolution ALMA Cycle 4 observations of the NGC 1068 nucleus at HCN J=3–2 and HCO+ J=3–2. Thanks to the increase in spatial resolution by a factor of 2–3, we have now spatially resolved the compact dense molecular emission that we had previously detected at the location of the putative torus at the same molecular lines in our Cycle 2 data. We found that (1) the torus-associated dense molecular emission is elongated along the east–west direction (PA = 100–110∘), (2) it is rotating in almost the same direction, but with far from pure Keplerian motion governed by the central SMBH mass, and (3) the torus is highly inhomogeneous in that the western region of the AGN engine is more turbulent and exhibits stronger molecular line emission than the eastern region does. The dense molecular gas in the torus and that in the central 05–20 region of the host galaxy along the torus direction are counter-rotating, indicating an external process, such as a minor galaxy merger.
We thank the anonymous referee for his/her valuable comments which helped improve the clarity of this manuscript. We are grateful to Dr. K. Saigo and X. Lu for their supports regarding ALMA observation preparation and data analysis. M.I. is supported by JSPS KAKENHI Grant Number 15K05030. K.W. is supported by JSPS KAKENHI Grant Number 16H03959. This paper made use of the following ALMA data: ADS/JAO.ALMA#2016.1.00052.S. ALMA is a partnership of ESO (representing its member states), NSF (USA) and NINS (Japan), together with NRC (Canada), NSC and ASIAA (Taiwan), and KASI (Republic of Korea), in cooperation with the Republic of Chile. The Joint ALMA Observatory is operated by ESO, AUI/NRAO, and NAOJ. Data analysis was in part carried out on the open use data analysis computer system at the Astronomy Data Center, ADC, of the National Astronomical Observatory of Japan.
References
- Alloin et al. (2000) Alloin, D., Pantin, E., Lagage, P. O., & Granato, G. L. 2000, A&A, 363, 926
- Antonucci (1993) Antonucci, R. R. J. 1993, ARA&A, 31, 473
- Antonucci & Miller (1985) Antonucci, R. R. J. & Miller, J. S. 1985, ApJ, 297, 621
- Bock et al. (2000) Bock, J. J., Neugebauer, G., Matthews, K., 2000, AJ, 120, 2904
- Burtscher et al. (2013) Burtscher, L., Meisenheimer, K., Tristram, K. R. W., et al. 2013, A&A, 558, A149
- Chan & Krolik (2017) Chan, C-H., & Krolik, J. H. 2017, ApJ, 843, 58
- Das et al. (2006) Das, V., Crenshaw, D. M., Kraemer, S. B., & Deo, R. P. 2006, AJ, 132, 620
- Evans et al. (1991) Evans, I. N., Ford, H. C., Kinney, A. L. et al., 1991, ApJL, 369, L27
- Furuya & Taniguchi (2016) Furuya, R., & Taniguchi, Y., 2016, PASJ, 68, 03
- Gallimore et al. (2004) Gallimore, J. F., Baum, S. A., & O’dea, C. P., 2004, ApJ, 613, 794
- Gallimore et al. (2016) Gallimore, J. F., Elitzur, M., Maiolino, R., et al. 2016, ApJL, 829, L7
- Gao & Solomon (2004) Gao, Y., & Solomon, P. M. 2004, ApJ, 606, 271
- Garcia-Burillo et al. (2016) Garcia-Burillo, S., Combes, F., Ramos Almeida, C., et al. 2016, ApJL, 823, L12
- Greenhill et al. (1996) Greenhill, L. J., Gwinn, C. R., Antonucci, R., & Barvainis, R. 1996, ApJ, 472, L21
- Honig et al. (2017) Honig, S. F., & Kishimoto, M. 2017, ApJL, 838, 20
- Hure (2002) Hure, J. -M. 2002, A&A, 395, L21
- Imanishi (2002) Imanishi, M. 2002, ApJ, 569, 44
- Imanishi et al. (2016) Imanishi, M., Nakanishi, K., & Izumi, T. 2016, ApJL, 822, L10
- Imanishi et al. (1997) Imanishi, M., Terada, H., Sugiyama, K., et al. 1997, PASJ, 49, 69
- Jaffe et al. (2004) Jaffe, W., Meisenheimer, K., Rottgering, H. J. A., et al. 2004, Nature, 429, 47
- Kennicutt (1998) Kennicutt, Jr. R. C. 1998, ARA&A, 36, 189
- Krips et al. (2008) Krips, M., Neri, R., Garcia-Burillo, S., Martin, S., Combes, F., Gracia-Carpio, J., & Eckart, A. 2008, ApJ, 677, 262
- Lodato & Bertin (2003) Lodato, G., & Bertin, G. 2003, A&A, 398, 517
- Lopez-Gonzaga et al. (2014) Lopez-Gonzaga, N., Jaffe, W., Burtscher, L., Tristram, K. R. W., & Meisenheimer, K. 2014, A&A, 565, A71
- Poncelet et al. (2006) Poncelet, A., Perin, G., & Sol, H. 2006, A&A, 450, 483
- Raban et al. (2009) Raban, D., Jaffe, W., Rottgering, H., et al. 2009, MNRAS, 394, 1325
- Schartmann et al. (2008) Schartmann, M., Meisenheimer, K., Camenzind, M., et al. 2008, A&A, 482, 67
- Solomon & Vanden Bout (2005) Solomon, P. M., & Vanden Bout, P. A. 2005, ARA&A, 43, 677
- Tanaka et al. (2017) Tanaka, I., Yagi, M., & Taniguchi, Y., 2017, PASJ, 69, 90
- Tomono et al. (2001) Tomono, D., Doi, Y., Usuda, T., & Nishimura, T. 2001, ApJ, 557, 637
- Tristram et al. (2014) Tristram, K. R. W., Burtscher, L., Jaffe, W. et al., 2014, A&A, 563, 82
- Wada et al. (2009) Wada, K., Papadopoulos, P. P., & Spaans, M. 2009, ApJ, 702, 63
- Wada et al. (2016) Wada, K., Schartmann, M., & Meijerink, R., 2016, ApJL, 828, L19