Lattice Energetics and Correlation-Driven Metal-Insulator Transitions: The Case of Ca2RuO4
Abstract
This Letter uses density functional, dynamical mean field, and Landau-theory methods to elucidate the interplay of electronic and structural energetics in the Mott metal-insulator transition. A Landau-theory free energy is presented that incorporates the electronic energetics, the coupling of the electronic state to local distortions and the coupling of local distortions to long-wavelength strains. The theory is applied to Ca2RuO4. The change in lattice energy across the metal-insulator transition is comparable to the change in electronic energy. Important consequences are a strongly first order transition, a sensitive dependence of the phase boundary on pressure and that the geometrical constraints on in-plane lattice parameter associated with epitaxial growth on a substrate typically change the lattice energetics enough to eliminate the metal-insulator transition entirely.
pacs:
71.27.+a,75.50.Cc,72.15.EbMany materials exhibit ”Mott” metal-insulator transitions, primarily driven by electron-electron interactions Imada et al. (1998) but also involving changes in atomic positions. In the rare earth titanates and vanadates, the distortion associated with the insulating phase is a GdFeO3-type octahedral rotationCwik et al. (2003); Pavarini et al. (2004), in the rare earth manganites, it is an approximately volume-preserving even-parity octahedral distortionMillis et al. (1995); Haghiri-Gosnet and Renard (2003); Tokura (2006): in the perovskite nickelates, a two sublattice disproportionation of the mean Ni-O bond length Torrance et al. (1992); Alonso et al. (1999); Fernández-Díaz et al. (2000); Medarde et al. (2009) and in VO2 a V-V dimerization Morin (1959). In other materials including Ca2RuO4 Nakatsuji et al. (1997) and V2O3 McWhan et al. (1969) the metal-insulator transition occurs simultaneously with a crystal symmetry-preserving change of atomic positions. The association of metal-insulator and structural transitions suggests the possibility of tuning electronic behavior by strain Kikuzuki and Lippmaa (2010), epitaxial growth, or ”nonlinear phononic” effects arising from intense terahertz radiationRini et al. (2007); Ehrke et al. (2011); Ichikawa et al. (2011).
While electronic aspects of the Mott transition are becoming well understood, and energies, forces, and many-body structural relaxation are now available in beyond density functional frameworks such as the density functional plus dynamical mean field methodology Park et al. (2014); Leonov et al. (2014); Haule and Pascut (2016), the interplay between the lattice and electronic energetics has yet to be fully unraveled. A physical basis for interpreting the calculations and the experiments remains to be defined and the magnitude of the lattice contribution to the energetics of the transition has yet to be determined. Here we argue that the key point is that the electronic transition couples directly to local atomic configurations such as octahedral rotations and transition metal-oxygen bond lengths, which in turn couple directly to externally controllable variables such as strain and pressure. The response of the material to these stresses defines a lattice stabilization energy, which can in fact be large enough to dominate the energetics of the transition.
To quantify these effects we write an electronic free energy that depends on a state variable labeling whether the material is in the metallic or insulating phase, and on atomic coordinates, labeled by a vector expressing deviations of atomic positions from a reference configuration. Expanding in we obtain
| (1) |
The electronic state-dependent linear term specifies the force exerted by the electronic state on the atomic degrees of freedom. Typically couples only to a subset of the lattice degrees of freedom, but this subset is coupled to other lattice coordinates by the quadratic restoring term . The ellipsis represents anharmonic terms that are not needed for the considerations of this Letter but may be important in other circumstances Kanamori (1960); Millis et al. (1995).
Minimizing the terms written in Eq. (1) gives defining the stabilization energy
| (2) |
so that if the lattice is free to relax, the transition between phases will occur when corresponding to a shift in the transition point relative to a frozen lattice calculation and a lattice change across the transition .
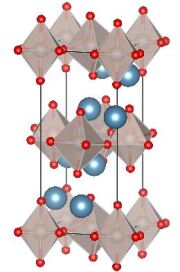
We now apply these generic considerations to Ca2RuO4, which exhibits a correlation-driven paramagnetic metal to paramagnetic insulator transition as the temperature is decreased below a critical value about 350 KNakatsuji et al. (1997). The transition is accompanied by a large amplitude, symmetry preserving lattice distortion Braden et al. (1998); Friedt et al. (2001). Below about 140 K there is an onset of antiferromagnetic orderBraden et al. (1998); Friedt et al. (2001), which is not relevant to our present considerations. Ca2RuO4 crystallizes in a -symmetry structure with four formula units in each crystallographic unit cell. The basic structural unit is the Ru-O6 octahedron; these form corner-shared planes separated from adjacent Ru-O6 planes by layers involving Ca atoms. The left panel of Fig. 1 shows one unit cell with four formula units. The structure is derived from the ideal tetragonal Ruddlesden-Popper structure by rotations of the Ru-O6 octahedrons about the apical Ru-O(2) bonds, tilts of this axis with respect to the Ru-O(1) plane, as well as an additional distortion that makes the two in-plane Ru-O bond lengths slightly different. The apical [Ru-O(2)] and the average over the two in-plane directions [Ru-O(1)] Ru-O bond lengths are the crucial variables in the electronic energetics. Their values across the metal-insulator transition are presented in Table 1. The bond lengths continue to evolve as temperature is further lowered through the insulating phaseBraden et al. (1998); Friedt et al. (2001). The corner-shared structure implies that if the rotation angles remain fixed, the Ru-O(1) bond lengths predict the average in-plane lattice parameters. Density functional calculations show that changes in the rotation angles are negligible for reasonable strainsHan and Millis , so the in-plane Ru-Ru and Ru-O(1) distances are not independent variables. On the other hand, the -axis stacking of the Ruddlesden-Popper structure means that at fixed -axis lattice constant, changes in the Ru-O(2) bond length can be accommodated by a buckling of the Ca-O planes.
We will be interested here in structures where the -axis lattice parameter is relaxed for given values of the octahedral bond lengths. Thus the lattice degrees of freedom in our theory are the average Ru-O(1) and Ru-O(2) lengths. We parametrize the Ru-O bond lengths in terms of changes with respect to a reference state, which we take to be the 400 K metallic state, and we express these in terms of the octahedral coordinates
| (3) |
which we assemble into the vector . in Eq. (1) is defined from the dependence of energies on and , with the c-axis lattice constant relaxed for each value of . We used density functional plus U (DFT+U) calculations and observed phonon frequencies (which give energetics of Ru-O bond length changes without lattice relaxation) to estimate the entries of (see Supplemental MaterialHan and Millis ), finding , , eV per formula unit. The observationRho et al. (2005); Jung et al. (2003); Souliou et al. (2017) that the changes in optical phonon frequencies across the transition are about , justifies the harmonic approximation and the independence of on the electronic phase.
| RuO(2) | RuO(1) | |||||
|---|---|---|---|---|---|---|
| 400 K | 2.042 | 1.95 | 0.0 | 0.0 | 0.671 | 0.665 |
| 295 K | 1.995 | 1.99 | 0.0196 | -0.069 | 0.982 | 0.508 |
We now turn to the electronic degrees of freedom. The relevant frontier electronic states are -derived Ru- oxygen antibonding states which we refer to as Ru states, following standard practice Allen et al. (1996); Ahn et al. (1999); Gorelov et al. (2010); Dang et al. (2015); Han et al. (2016). The -derived bands are well separated from the other bands, so we may focus our treatment of the correlation problem on them, treating the other bands as inertGorelov et al. (2010); Dang et al. (2015); Han et al. (2016). The tetragonal symmetry splits the -derived triplet into a singlet () and a doublet ( and ). The octahedral rotations and other distortions (angles ) provide small additional rearrangements of the level structure (in particular lifting the / degeneracy), but as long as the orbitals are defined with respect to the local octahedral symmetry axes, the deviations from the perfectly tetragonal structure do not significantly affect the on-site level splitting, basic energetics, or assignment of orbital character. Spin-orbit coupling ( eV) is important for lower magnetic properties of the insulating state Souliou et al. (2017); Sutter et al. (2017); Kim et al. (2018) but is not relevant to the physics we consider here since the spin-orbit energy scales are small compared to the orbital level splitting and electron interactions.
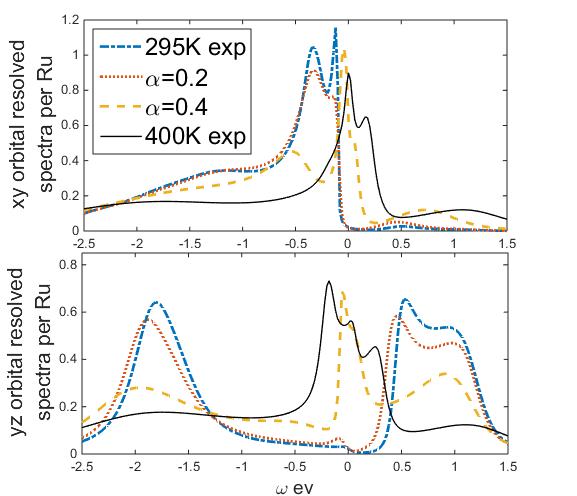
We have performed DFT and DFT+DMFT calculations (see Supplemental MaterialSup ). We find, in agreement with previous work Gorelov et al. (2010), that a calculation at room temperature with the experimentally determined 400 K structure produces a moderately correlated metallic solution while using the 295 K structure produces a Mott insulator. The metallic state is characterized by an approximately equal occupancy of the three orbitals. The approximately equal orbital occupancy is not protected by any symmetry and is due to the strong electron-electron scattering. The insulating state is orbitally disproportionated, with an essentially fully filled band and half filled, much narrower, bands with upper and lower Hubbard bands separated by a gap (Fig. 1 right panel with blue dashed lines). Calculated orbital occupancies are given in Table 1.
The right-hand panels of Fig. 1 present the orbitally resolved densities of states obtained from DFT+DMFT calculations at room temperature, performed for a series of structures linearly interpolated between the =295 () and =400 K () structures. As the interpolation parameter changes from to , the state remains metallic but the bands and occupancies () change from to . A first order MIT occurs as is decreased below a critical value . Further changes of structure within the insulating phase () do not affect the orbital occupancies but do lead to an approximately eV shift upward of the band relative to the band. We have also performed calculations in which one starts from the DFT+U relaxed insulating phase atomic positions with in-plane lattice constants fixed to 5.44 Å and the -axis parameter is then gradually stretched. The results are very similar to the first group. Although the transition is first order we have not observed coexistence of metal and insulator phases at any of the lattice configurations we have studied.
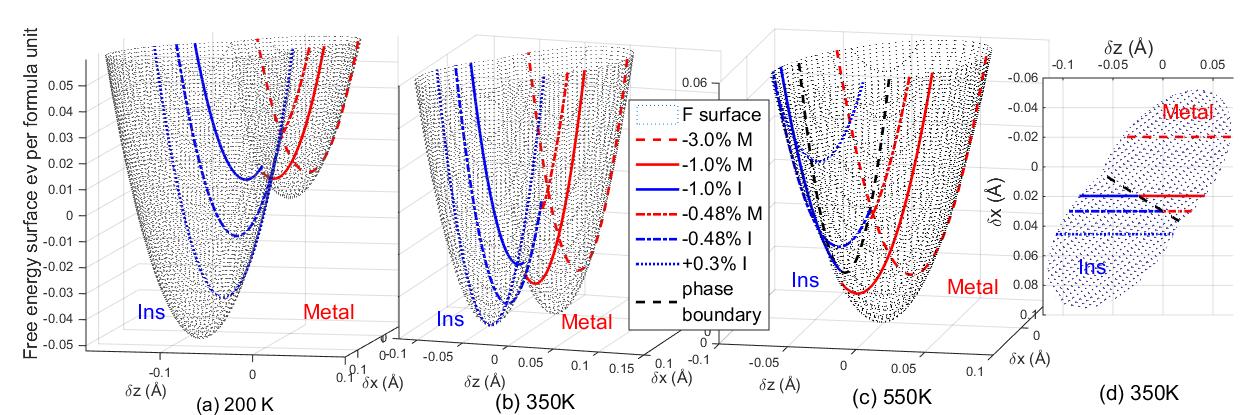
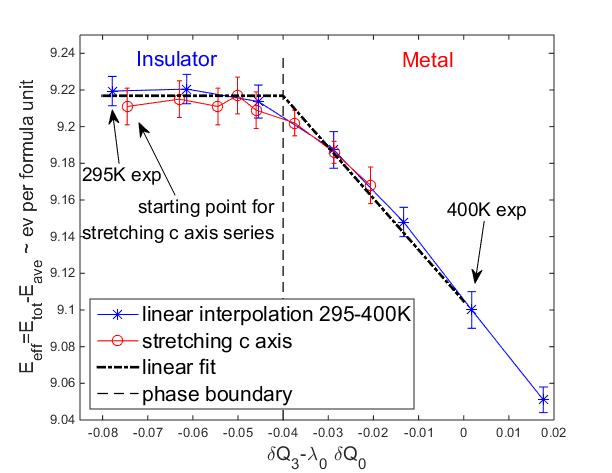
Fig. 2 plots the DFT+DMFT energy of the correlated bands (obtained as described in the Supplemental MaterialSup for interpolated and -axis stretched structures) against a linear combination of octahedral parameters [Eq. (3)].
| (4) |
Here is the orbitally averaged on-site energy from MLWF fits to the converged DFT band structures; , and basically represents the insulating phase electron energy up to a constant. The particular linear combination with is chosen so that the data from the two different families of structures (which change the bandwidth and octahedral distortion in different proportions) collapses in both the insulating and metallic phases. The dependence on reflects the relation between the octahedral shape and the orbital splitting. The dependence on reflects the change in bandwidth. We emphasize that the insulating (metallic) state is only stable for (we expect depends on ). Apart from some rounding in the immediate vicinity of the transition, the energy is a linear function of the relevant combination of the structural parameters, with a difference in slope between phases. The curvatures in two phases are difficult to determine accurately from these calculations but are small enough compared with the that any change in the across the phase boundary is negligible (details are in the Supplemental MaterialSup ).
The choice of variables in Fig. 2 fixes the change in force across the transition as and eV/Å. Within the assumptions made here, the dependence of the insulating phase energy on is essentially independent of temperature. However, as temperature is further lowered through the paramagnetic insulating phase to the AFM phase transition, an approximately linear evolution of the Ru-O bonds lengths is observedBraden et al. (1998); Friedt et al. (2001), indicating an approximately -linear dependence of the insulating-state force. Linearly extrapolating the Ru-O bond lengths measured in experiments Braden et al. (1998); Friedt et al. (2001) at 180, 295 and 350 K to 0 K yields results within 14% of our calculated values. We therefore believe that the single-site DMFT theory used here is a good representation of K energetics and that the temperature dependence is due to entropic terms arising from a combination of intersite effects missing in the single-site approximation used here, spin orbit effects which change the on-site multiplet structure and lattice contributions. We model these effect by a phenomenological linear term in , so
| (5) |
The consistency of the model can be verified via a computation of the pressure dependence of the transition. This is obtained by adding to Eq. (1) a term with eV/(GPaÅ formula unit), so that applied pressure is in effect a linear term shifting the position and value of the energy minimum. We find which is comparable to fitted from published dataNakamura (2007). More details are in the Supplemental MaterialSup .
In Fig. 3 we plot the free energy landscape at different temperatures in the plane of Ru-O bond length coordinates and , using force terms estimated in Eq. (5). We chose the metallic state at as the reference. At high temperature, there is no global minimum in the insulating phase. For , an insulating energy minimum as in Eq. (2) appears and becomes more stable. The stabilization energy defined in Eq. (2) is eV/Ru at .
We now turn to epitaxially grown films. While epitaxial films are strained with respect to bulk, strain is not the key issue. Rather, the tight association of the in-plane lattice parameter and the Ru-O(1) bond length means that epitaxy implies a constraint: instead of freely minimizing Eq. (1) over the full space of structural variables, the system can explore only a one-dimensional cut across the energy landscape, corresponding to a fixed Ru-O(1) bond length. The solid and dashed lines in Fig. 3 show the one-dimensional cuts which can be explored under different epitaxy conditions. Because the curves typically do not pass near the global minimum, the phase transition becomes much more expensive and in most cases is eliminated. Only in a small range of compressive strains around (relative to 295 K structure) can a metal-insulator transition occur in a reasonable temperature range. For a larger compressive strain the system is always a metal while for a tensile or small compressive strain the material is always an insulator. This is consistent with recent experimental observations Nair et al. (2017); Dietl et al. (2018) that thin films of Ca2RuO4 grown epitaxially on NdGaO3 (+0.3 strain) and NSAT (-0.48) remain insulating up to 550 K while films grown on NdAlO3 (-3.0) remain metallic down to lowest temperature. Only films grown on LaAlO3 (-1.6%) exhibit a transition to a weakly insulating phase at K.
In summary, we demonstrated the importance of lattice energetics in the Mott metal-insulator transition, elucidating the crucial interplay between the local octahedral distortions and long wavelength strains, and the previously unappreciated role of epitaxial constraints. We focused on Ca2RuO4, which has two simplifying features: the metal and insulator have the same symmetry and octahedral rotations are of minor importance, so the order parameter couples linearly to strains and the in-plane Ru-O bond lengths determine the Ru-Ru spacing. Performing a complete DFT+DMFT structural relaxation study and providing a less phenomenological treatment of the electronic and, especially, lattice entropies are also important directions for future research. Most importantly, a generalization of the theory to cases where octahedral rotation is important (perovskite titanates and vanadates) or the insulating phase breaks a translation symmetry (manganites and nickelates) so that strain couples via nonlinear terms in the elastic theory, is urgently needed.
We thank H. Nair, D.Schlom, Jacob Ruf and K.Shen for sharing data in advance of publication and for helpful discussions. The DMFT calculations used codes written by H. T. Dang and were performed on the Yeti HPC cluster at Columbia University. This research is supported by the Basic Energy Science Program of the Department of Energy under Grant No. ER-04169 and Cornell Center for Materials Research with funding from the NSF MRSEC program (DMR-1120296).
References
- Imada et al. (1998) M. Imada, A. Fujimori, and Y. Tokura, Rev. Mod. Phys. 70, 1039 (1998).
- Cwik et al. (2003) M. Cwik, T. Lorenz, J. Baier, R. Müller, G. André, F. Bourée, F. Lichtenberg, A. Freimuth, R. Schmitz, E. Müller-Hartmann, and M. Braden, Phys. Rev. B 68, 060401 (2003).
- Pavarini et al. (2004) E. Pavarini, S. Biermann, A. Poteryaev, A. I. Lichtenstein, A. Georges, and O. K. Andersen, Phys. Rev. Lett. 92, 176403 (2004).
- Millis et al. (1995) A. J. Millis, P. B. Littlewood, and B. I. Shraiman, Phys. Rev. Lett. 74, 5144 (1995).
- Haghiri-Gosnet and Renard (2003) A.-M. Haghiri-Gosnet and J. P. Renard, J. Phys. D 36, R127?R150 (2003).
- Tokura (2006) Y. Tokura, Rep. Prog. Phys. 69, 797 (2006).
- Torrance et al. (1992) J. B. Torrance, P. Lacorre, A. I. Nazzal, E. J. Ansaldo, and C. Niedermayer, Phys. Rev. B 45, 8209 (1992).
- Alonso et al. (1999) J. A. Alonso, J. L. García-Muñoz, M. T. Fernández-Díaz, M. A. G. Aranda, M. J. Martínez-Lope, and M. T. Casais, Phys. Rev. Lett. 82, 3871 (1999).
- Fernández-Díaz et al. (2000) M. T. Fernández-Díaz, J. A. Alonso, M. J. Martínez-Lope, M. T. Casais, J. L. García-Muñoz, and M. A. G. Aranda, Physica (Amsterdam) 276B, 218 (2000).
- Medarde et al. (2009) M. Medarde, C. Dallera, M. Grioni, B. Delley, F. Vernay, J. Mesot, M. Sikora, J. A. Alonso, and M. J. Martínez-Lope, Phys. Rev. B 80, 245105 (2009).
- Morin (1959) F. J. Morin, Phys. Rev. Lett. 3, 34 (1959).
- Nakatsuji et al. (1997) S. Nakatsuji, S. ichi Ikeda, and Y. Maeno, J. Phys. Soc. Jpn. 66, 1868 (1997).
- McWhan et al. (1969) D. B. McWhan, T. M. Rice, and J. P. Remeika, Phys. Rev. Lett. 23, 1384 (1969).
- Kikuzuki and Lippmaa (2010) T. Kikuzuki and M. Lippmaa, Appl. Phys. Lett. 96, 132107 (2010).
- Rini et al. (2007) M. Rini, R. Tobey, N. Dean, J. Itatani, Y. Tomioka, Y. Tokura, R. W Schoenlein, and A. Cavalleri, Nature (London), 449, 72 (2007).
- Ehrke et al. (2011) H. Ehrke, R. I. Tobey, S. Wall, S. A. Cavill, M. Först, V. Khanna, T. Garl, N. Stojanovic, D. Prabhakaran, A. T. Boothroyd, M. Gensch, A. Mirone, P. Reutler, A. Revcolevschi, S. S. Dhesi, and A. Cavalleri, Phys. Rev. Lett. 106, 217401 (2011).
- Ichikawa et al. (2011) H. Ichikawa, S. Nozawa, T. Sato, A. Tomita, K. Ichiyanagi, M. Chollet, L. Guérin, N. Dean, A. Cavalleri, S. ichi Adachi, T. hisa Arima, H. Sawa, Y. Ogimoto, M. Nakamura, R. Tamaki, K. Miyano, and S. ya Koshihara, Nat. Mater. 102, 101 (2011).
- Park et al. (2014) H. Park, A. J. Millis, and C. A. Marianetti, Phys. Rev. B 89, 245133 (2014).
- Leonov et al. (2014) I. Leonov, V. I. Anisimov, and D. Vollhardt, Phys. Rev. Lett. 112, 146401 (2014).
- Haule and Pascut (2016) K. Haule and G. L. Pascut, Phys. Rev. B 94, 195146 (2016).
- Kanamori (1960) J. Kanamori, J. Appl. Phys. 31, S14 (1960).
- Braden et al. (1998) M. Braden, G. André, S. Nakatsuji, and Y. Maeno, Phys. Rev. B 58, 847 (1998).
- Friedt et al. (2001) O. Friedt, M. Braden, G. André, P. Adelmann, S. Nakatsuji, and Y. Maeno, Phys. Rev. B 63, 174432 (2001).
- (24) Q. Han and A. J. Millis, See Supplemental Material at [https://link.aps.org/doi/10.1103/PhysRevLett.121.067601]. See Sec. I for details of DFT+U calculation and estimation of stiffness matrix , which includes Refs. Kresse and Hafner, 1993; Kresse and Furthmüller, 1996a, b; Kresse and Joubert, 1999 not cited in the main text.
- Rho et al. (2005) H. Rho, S. L. Cooper, S. Nakatsuji, H. Fukazawa, and Y. Maeno, Phys. Rev. B 71, 245121 (2005).
- Jung et al. (2003) J. H. Jung, Z. Fang, J. P. He, Y. Kaneko, Y. Okimoto, and Y. Tokura, Phys. Rev. Lett. 91, 056403 (2003).
- Souliou et al. (2017) S.-M. Souliou, J. Chaloupka, G. Khaliullin, G. Ryu, A. Jain, B. J. Kim, M. Le Tacon, and B. Keimer, Phys. Rev. Lett. 119, 067201 (2017).
- Allen et al. (1996) P. B. Allen, H. Berger, O. Chauvet, L. Forro, T. Jarlborg, A. Junod, B. Revaz, and G. Santi, Phys. Rev. B 53, 4393 (1996).
- Ahn et al. (1999) J. S. Ahn, J. Bak, H. S. Choi, T. W. Noh, J. E. Han, Y. Bang, J. H. Cho, and Q. X. Jia, Phys. Rev. Lett. 82, 5321 (1999).
- Gorelov et al. (2010) E. Gorelov, M. Karolak, T. Wehling, F. Lechermann, A. Lichtenstein, and E. Pavarini, Phys. Rev. Lett. 104, 226401 (2010).
- Dang et al. (2015) H. T. Dang, J. Mravlje, A. Georges, and A. J. Millis, Phys. Rev. B 91, 195149 (2015).
- Han et al. (2016) Q. Han, H. T. Dang, and A. J. Millis, Phys. Rev. B 93, 155103 (2016).
- Sutter et al. (2017) D. Sutter, C. Fatuzzo, S. Moser, M. Kim, R. Fittipaldi, A. Vecchione, V. Granata, Y. Sassa, F. Cossalter, G. Gatti, M. Grioni, H. Ronnow, N. Plumb, C. Matt, M. Shi, M. Hoesch, T. Kim, T. Chang, H. Jeng, C. Jozwiak, A. Bostwick, E. Rotenberg, A. Georges, T. Neupert, and C. J., Nat. Commun. 8, 15176 (2017).
- Kim et al. (2018) M. Kim, J. Mravlje, M. Ferrero, O. Parcollet, and A. Georges, Phys. Rev. Lett. 120, 126401 (2018).
- (35) See Supplemental Material Sec. II at [https://link.aps.org/doi/10.1103/PhysRevLett.121.067601] for details of DFT, DFT+DMFT calculation and calculations of electronic energetic and force terms , which includes Refs. Dang and Millis, 2013; Marzari and Vanderbilt, 1997; Souza et al., 2001; Kanamori, 1963; Parcollet et al., 2015; Seth et al., 2016; Chen et al., 2015; Pruschke et al., 1993; Steffens et al., 2005 not cited in the main text.
- Nakamura (2007) F. Nakamura, J. Phys. Soc. Jpn. 76, 96 (2007).
- Nair et al. (2017) H. Nair, J. Ruf, Y. Liu, N. Shukla, B. Grisafe, C. S. . Chang, Q. Han, A. Millis, D. A. Muller, S. Datta, K. Shen, and D. G. Schlom, EMA-S2-032 (2017).
- Dietl et al. (2018) C. Dietl, S. K. Sinha, G. Christiani, Y. Khaydukov, T. Keller, D. Putzky, S. Ibrahimkutty, P. Wochner, G. Logvenov, P. A. van Aken, B. J. Kim, and B. Keimer, Appl. Phys. Lett. 112, 031902 (2018).
- Kresse and Hafner (1993) G. Kresse and J. Hafner, Phys. Rev. B 47, 558 (1993).
- Kresse and Furthmüller (1996a) G. Kresse and J. Furthmüller, Comput. Mater. Sci. 6, 15 (1996a).
- Kresse and Furthmüller (1996b) G. Kresse and J. Furthmüller, Phys. Rev. B 54, 11169 (1996b).
- Kresse and Joubert (1999) G. Kresse and D. Joubert, Phys. Rev. B 59, 1758 (1999).
- Dang and Millis (2013) H. T. Dang and A. J. Millis, Phys. Rev. B 87, 155127 (2013).
- Marzari and Vanderbilt (1997) N. Marzari and D. Vanderbilt, Phys. Rev. B 56, 12847 (1997).
- Souza et al. (2001) I. Souza, N. Marzari, and D. Vanderbilt, Phys. Rev. B 65, 035109 (2001).
- Kanamori (1963) J. Kanamori, Prog. Theor. Phys. 30, 275 (1963).
- Parcollet et al. (2015) O. Parcollet, M. Ferrero, T. Ayral, H. Hafermann, I. Krivenko, L. Messio, and P. Seth, Comput. Phys. Commun. 196, 398 (2015).
- Seth et al. (2016) P. Seth, I. Krivenko, M. Ferrero, and O. Parcollet, Comput. Phys. Commun. 200, 274 (2016).
- Chen et al. (2015) J. Chen, A. J. Millis, and C. A. Marianetti, Phys. Rev. B 91, 241111 (2015).
- Pruschke et al. (1993) T. Pruschke, D. L. Cox, and M. Jarrell, Phys. Rev. B 47, 3553 (1993).
- Steffens et al. (2005) P. Steffens, O. Friedt, P. Alireza, W. G. Marshall, W. Schmidt, F. Nakamura, S. Nakatsuji, Y. Maeno, R. Lengsdorf, M. M. Abd-Elmeguid, and M. Braden, Phys. Rev. B 72, 094104 (2005).