Optical, near-IR and sub-mm IFU Observations of the nearby dual AGN Mrk 463
Abstract
We present optical and near-IR Integral Field Unit (IFU) and ALMA band 6 observations of the nearby dual Active Galactic Nuclei (AGN) Mrk 463. At a distance of 210 Mpc, and a nuclear separation of 4 kpc, Mrk 463 is an excellent laboratory to study the gas dynamics, star formation processes and supermassive black hole (SMBH) accretion in a late-stage gas-rich major galaxy merger. The IFU observations reveal a complex morphology, including tidal tails, star-forming clumps, and emission line regions. The optical data, which map the full extent of the merger, show evidence for a biconical outflow and material outflowing at 600 km s-1, both associated with the Mrk 463E nucleus, together with large scale gradients likely related to the ongoing galaxy merger. We further find an emission line region 11 kpc south of Mrk 463E that is consistent with being photoionized by an AGN. Compared to the current AGN luminosity, the energy budget of the cloud implies a luminosity drop in Mrk 463E by a factor 3–20 over the last 40,000 years. The ALMA observations of 12CO(2-1) and adjacent 1 mm continuum reveal the presence of 109M☉ in molecular gas in the system. The molecular gas shows velocity gradients of 800 km/s and 400 km/s around the Mrk 463E and 463W nuclei, respectively. We conclude that in this system the infall of 100s /yr of molecular gas is in rough balance with the removal of ionized gas by a biconical outflow being fueled by a relatively small, 0.01% of accretion onto each SMBH.
=20
1 Introduction
For the last 30 years there has been growing evidence for a strong connection between major, 3:1 mass ratio, galaxy mergers and simultaneous episodes of strong star formation and significant central supermassive black hole (SMBH) growth (e.g., Sanders et al., 1988; Barnes & Hernquist, 1991; Di Matteo et al., 2005). Early observations of nearby galaxies carried out with the Infrared Astronomical Satellite (IRAS) have shown that the most luminous IR sources appear to be associated with interacting galaxies, as evidenced by the presence of tidal tails, disrupted morphologies and other features (Soifer et al., 1984). Theoretical models and computational simulations (e.g., Barnes & Hernquist, 1991; Mihos & Hernquist, 1996; Springel et al., 2005) have shown that a major galaxy merger provides a very efficient mechanism to drive gas to the nuclear regions of the resulting system, which can in turn fuel the observed star formation bursts and SMBH growth. As a consequence, it is natural to expect that major mergers can play a fundamental role in galaxy evolution (e.g., Hopkins et al., 2006).
Major galaxy mergers can also explain the observed correlations between the mass of the central SMBH and physical properties of its host galaxy (e.g., Di Matteo et al., 2005, 2008). However, a key element in setting up this physical connection are so-called feedback effects. Such effects are regularly invoked by semi-analytical models in order to reproduce even basic galaxy properties, such as the luminosity function (e.g., Kauffmann & Charlot, 1998, and many others since), as they provide additional sources of energy required to prevent runaway star formation episodes (Benson et al., 2003; Croton et al., 2006; Schawinski et al., 2006). In particular, nuclear activity can play a critical role in the regulation of star formation, as observed in some nearby galaxies (e.g., Alatalo et al., 2015).
Treister et al. (2012) found that while most AGN activity is triggered by internal, secular processes and minor galaxy mergers, major mergers are directly linked to the most luminous AGN, quasars, and therefore are responsible for most (60%) of the SMBH accretion across the cosmic history. A natural consequence of this scenario is that dual AGN — i.e., systems in which the two nuclear SMBHs are growing simultaneously at separations of 10 kpc — should be relatively common (e.g., Volonteri et al., 2003; Fu et al., 2011a; Van Wassenhove et al., 2012). This particular stage in a major galaxy merger, albeit short — hundreds Myears — (Van Wassenhove et al., 2012; Blecha et al., 2013), is very relevant for galaxy evolution. As shown by Koss et al. (2012), both the fraction of dual AGN and their individual X-ray luminosities peak at nuclear separations 10 kpc. This implies that significant and rapid SMBH growth can be directly associated with the dual AGN phase, which in turn might be associated with strong feedback effects on the interstellar medium (e.g., Rupke & Veilleux, 2011; Veilleux et al., 2013).
Furthermore, the relative frequency of dual systems can be used to constrain the AGN duty cycle in merger-triggered events. In a rather extreme scenario, if the lifetime of the AGN/quasar phase is similar to the merger timescale, we should expect every merger-triggered system to host a dual AGN. However, the observed fraction of dual AGN is significantly lower, 2% (Liu et al., 2011; Shen et al., 2011). This can be explained at least in part by the difficulty in detecting and confirming observationally these dual AGN. Confirming the dual AGN nature even for nearby sources often requires high spatial resolution radio, near-IR and/or X-ray observations (e.g. Fu et al., 2011b; Koss et al., 2012; Müller-Sánchez et al., 2016; McGurk et al., 2015). Furthermore, in many cases the nuclear regions in these systems are subject to large amounts of obscuration (Hopkins et al., 2005; Scoville et al., 2017; Ricci et al., 2017), making their detections even more challenging. Nonetheless, many merger systems lack dual nuclei despite adequate data. This suggests the AGN duty cycle is shorter than the merger time scale.
In order to study the physical properties of the ionized, atomic and molecular gas and the dust in confirmed dual AGN in the local Universe, , we started the Multiwavelength Observations of Dual AGN (MODA) program111http://moda.astro.puc.cl/. The aim of MODA is to study the growth and co-evolution of galaxies and their SMBHs during merger events, particularly at the later merger stages when feedback and nuclear activity likely peak. MODA currently focuses on 17 confirmed dual AGN distributed across the sky. Our program combines: (i) Atacama Large Millimeter Array (ALMA) observations of molecular gas tracers and dust continuum mm/sub-mm emission, (ii) Very Large Telescope (VLT)/ Spectrograph for INtegral Field Observations in the Near Infrared (SINFONI) and Keck/OSIRIS (OH- Suppressing Infra-Red Imaging Spectrograph) maps of , Pa, Br, [Si VI], and other near-IR emission lines, and (iii) VLT Multi Unit Spectroscopic Explorer (MUSE) optical Integral Field Unit (IFU) spectroscopic observations, aimed primarily to map the atomic emission lines of Hα, , [Oiii] and other atomic species, together with Na D in absorption, in order to measure gas and stellar kinematics, and constrain stellar populations and star formation histories. In addition, we are now in the process of adding mid-IR observations from the VLT spectrometer and imager for the mid-infrared (VISIR) and SOFIA (Stratospheric Observatory for Infrared Astronomy) to study the properties of the hot, 300-1,000K, dust in these systems, compute accurate nuclear mid-IR to X-ray flux ratios and obtain accurate estimates of the bolometric luminosities of each AGN.
Here, we focus on one of the sources in the MODA sample, Mrk 463, for which we recently finished obtaining multi-wavelength IFU observations. Mrk 463 is a nearby, =0.0504 (Falco et al., 1999) or 210Mpc, Ultra-Luminous Infrared Galaxy (ULIRG; Sanders & Mirabel, 1996). It was classified as a dual AGN based on Chandra X-ray observations reported by Bianchi et al. (2008). The two nuclei are separated by 3.80.01′′, which roughly corresponds to 3.8 kpc. The Chandra observations reveal that both nuclei, Mrk 463E and Mrk 463W, respectively, have relatively low X-ray luminosities of =1.51043 erg/s and 3.81042 erg/s in the 2-10 keV band and are heavily obscured with =7.11023 cm-2 and 3.21023 cm-2. The AGN nature of the eastern nucleus was independently established by Spitzer spectroscopic observations, as presented by Farrah et al. (2007). Given its distance, nuclear separation, infrared luminosity and existing multi-wavelength observations, Mrk 463 joins NGC6240 (Komossa et al., 2003), Mrk 739 (Koss et al., 2011) and Mrk 266 (Mazzarella et al., 2012) as prime targets for understanding how SMBHs gain mass and how black hole growth can impact their host galaxies in the dual AGN phase of a major galaxy merger.
In this paper we present optical and near-IR IFU observations of the nearby dual AGN Mrk 463, obtained with the VLT MUSE and SINFONI, and ALMA Cycle 2 observations of 12CO(2-1) and adjacent sub-mm continuum in this system. The main goal is to study the morphology and kinematics of the gas in all its phases using atomic and molecular emission lines as tracers, in order to understand the behavior of the gas that is simultaneously feeding the SMBH and fueling star formation during a major galaxy merger. In §2, we describe all the different datasets and data reduction strategies used. In §3, we describe the multi-wavelength morphological properties of this system, while in §4 we focus on the kinematics. The discussion and conclusions are presented in §5 and §6, respectively. Throughout this paper, we assume a CDM cosmology with =0.7, =0.27 and =0.73 (Hinshaw et al., 2009).
2 Data
2.1 MUSE
MUSE is a state-of-the-art second generation VLT IFU instrument (Bacon et al., 2010). Its relatively large field of view, 1 arcmin2, and broad wavelength coverage, 4800-9300Å, are particularly well suited for observing the entire physical extents of low redshift systems (e.g., physical sizes of tens of kpc in a single pointing) across a large spectral range (simultaneous coverage of the , and [Oiii] lines, among others). The resolving power of MUSE ranges from 1770 at 4800Å to 3590 at 9300Å, which corresponds to velocity resolutions of 80 to 170 km/s.
Mrk 463 was observed by the VLT/MUSE as part of program 095.B-0482 (PI: E. Treister). Four other nearby dual AGN were also observed as part of this program and will be presented on subsequent papers. Mrk 463 was observed on July 18, 2015 in two 58 min observation blocks (OBs), IDs 1182834 and 1182837, each comprised of three on-target integrations of 976 s plus overheads. Sky conditions were clear, with 50% lunar illumination, and a reported ambient seeing 0.8′′. The final combined, processed and calibrated VLT/MUSE data cube for Mrk 463 has an effective exposure time of 5856 seconds (1.6 hours), an average airmass of 1.5 and an average FWHM of 0.7′′ based on measurements of stars in the field on the reconstructed white filter image.
Data reduction was carried out using the ESO MUSE pipeline version 1.6.2222Available at https://www.eso.org/sci/software/pipelines/muse/ (Weilbacher et al., 2014), in the ESO Reflex graphical environment (Freudling et al., 2013). The data reduction stages are standard and include bias and dark current subtraction, flat fielding, wavelength and flux calibration, and astrometric correction. Sky background was subtracted using emission-free regions of the resulting data cube. The process is however complicated by the large data volume. The MUSE 1′1′ field of view has 300300 spatial bins (spaxels) and 4000 spectral bins, such that an individual MUSE frame is a few Gbytes in size and data reduction requires several Gbytes for intermediate products and multiple CPU cores to run. First-look visualizations of the resulting combined data cube were done using the QFitsview333http://www.mpe.mpg.de/~ott/QFitsView/ software, but not used in our subsequent work. Further analysis, including emission line fitting, velocity maps, etc. of well-isolated narrow emission lines was carried out using IDL Fluxer444http://www.ciserlohe.de/fluxer/fluxer.html tool version 2.7. More complex line fits, including several overlapping components were carried out using the Pyspeckit Python package (Ginsburg & Mirocha, 2011), as Fluxer only allowed a maximum of two simultaneous gaussian fits.
2.2 SINFONI
We obtained near-IR IFU observations of Mrk 463 using the Spectrograph for INtegral Field Observations in the Near Infrared (SINFONI; Eisenhauer et al., 2003) camera mounted at the VLT, as part of program 093.B-0513 (PI: S. Cales). This program aimed to observe four confirmed 0.1 dual AGN that are visible from the southern hemisphere, one of which was Mrk 463. SINFONI has a much smaller field of view, 8′′8′′, hence these observations only cover the central region around the dual nuclei.
The observations were carried out using the 125250 mas spatial scale in seeing-limited mode (i.e., no adaptive optics), together with the -band grating, which provides coverage from 1.95 to 2.45 m and a spectral resolution of 4000. The observations were carried out in service mode and spread over 4 OBs: IDs 1053697 (April 17, 2014), 1053700 (May 17, 2014), 1053702 (June 18, 2014) and 1053704 (July 21, 2014). The requested weather conditions were ambient seeing better than 0.8′′, clear skies and airmass 1.5. However, only OBs 1053697 and 1053700 met such conditions; the remaining ones were either taken in worse seeing and/or in the presence of thin clouds. Therefore, for this analysis we mostly focus on the first 2 OBs in order to achieve the highest possible image quality.
The reduction of the SINFONI data was carried out using the dedicated ESO pipeline version 2.9.0 (Modigliani et al., 2007) in Reflex. The following steps were performed: (i) creation of a map of non-linear pixels from flat-field frames obtained with increasing exposure times; (ii) creation of a combined dark frame and hot pixel map; (iii) creation of a master flat field from individual flat-field images; (iv) determination of the optical distortion coefficients and computation of the slitlets’ distance table; (v) creation of a wavelength map from a set of arc lamp observations in order to carry out the wavelength calibration; (vi) stacking of individual science and telluric star frames. The flux calibration of the science frames was performed using the Fitting Utility for SINFONI (FUS) package developed by Dr. Krispian Lowe as part of his PhD thesis555Available at http://uhra.herts.ac.uk/bitstream/handle/2299/2449/Krispian%20Lowe.pdf., based on observations of standard stars taken less than 2 hours away and with a difference in airmass 0.2 from the science data. As in the case of the VLT/MUSE data, the final combined data cubes were analyzed using the QFitsview tool for a first look visualization and Fluxer for the Gaussian fitting of each isolated emission lines.
2.3 ALMA
During ALMA Cycle 2, we were granted 5.1 hours of priority B time to observe a sample of four nearby dual AGN, including Mrk 463, in band 6 as part of program 2013.1.00525.S (PI: E. Treister). Four separate spectral windows were defined: one covering the 12CO(2-1) molecular transition, providing a 10.7 km/s spectral resolution and a 2560 km/s bandwidth and the remaining three covering the mm continuum at 220-235 GHz. The observations of Mrk 463 were taken on August 16, 2015 between 22:27 and 23:27 UT (uid://A002/Xa830fc/X4abc) and on September 16, 2015 between 21:01 and 22:01 UT (uid://A002/Xaa305c/X129). For the August 16th observations, 34 antennae were used with baselines ranging from 43 m to 1.57 km, while on September 16th the same number of antennae were used distributed between 41 m and 4.5 km baselines. The total on-target time in each observation was 25.7 minutes. Data reduction and analysis were carried out using the Common Astronomy Software Applications (CASA) version 4.5.0.
The requested 3- sensitivity of the observations was 0.58 mJy/beam per 10.7 km/s channel. This requirement was not quite met, as the early processing carried out by the North America ALMA Science Center yielded a sensitivity of 0.78 mJy/beam on the 12CO(2-1) spectral window, 34% higher than the goal value. This value was obtained using a Brigg Robust image weighting (Briggs, 1995) with a robust parameter of 0.5, that provides a balance between a smaller beam but with a lower sensitivity. Instead, we decided to re-process the ALMA data using a natural weighting scheme, which delivers a higher sensitivity at the expense of a slightly worse spatial resolution. Using this method, we achieved a sensitivity of 0.6 mJy/beam at 3- in the 12CO(2-1) line, thus much closer to our goal flux limit. The resulting beam size is 0.3′′0.17′′.
2.4 Astrometric Calibration
In order to be able to compare emission at different wavelengths from the instruments described above it is critical to ensure that all the datasets share the same astrometric reference point. This is potentially difficult given the relatively small overlap in structures at different wavelengths. The ALMA absolute astrometric calibration is better than 0.1′′ as reported by González-López et al. (2017).
Using the Chandra X-ray data for this system, Bianchi et al. (2008) located the position of the two AGN to within 0.5′′. In particular, we derived the exact position using the hard X-ray band, 2–8 keV, as in this case most of the emission can be attributed to the AGN.
3 Morphologies
Mrk 463 was morphologically classified as a peculiar/interacting galaxy based on early optical imaging (Adams, 1977; Petrosian et al., 1978). Deeper CCD imaging by Hutchings & Neff (1989), which included a narrow-band filter covering the redshifted [Oiii] 5007Å emission lines, revealed extended emission in the Mrk 463E nucleus and a bright knot 10′′ south of the nucleus that are not visible in the optical continuum. Radio continuum observations at 6 and 20 cm performed by Mazzarella et al. (1991) show that the radio emission is aligned with the bi-polar [Oiii] conical flows and the southern knot, strongly suggesting that they are connected to the Mrk 463E nuclear region.
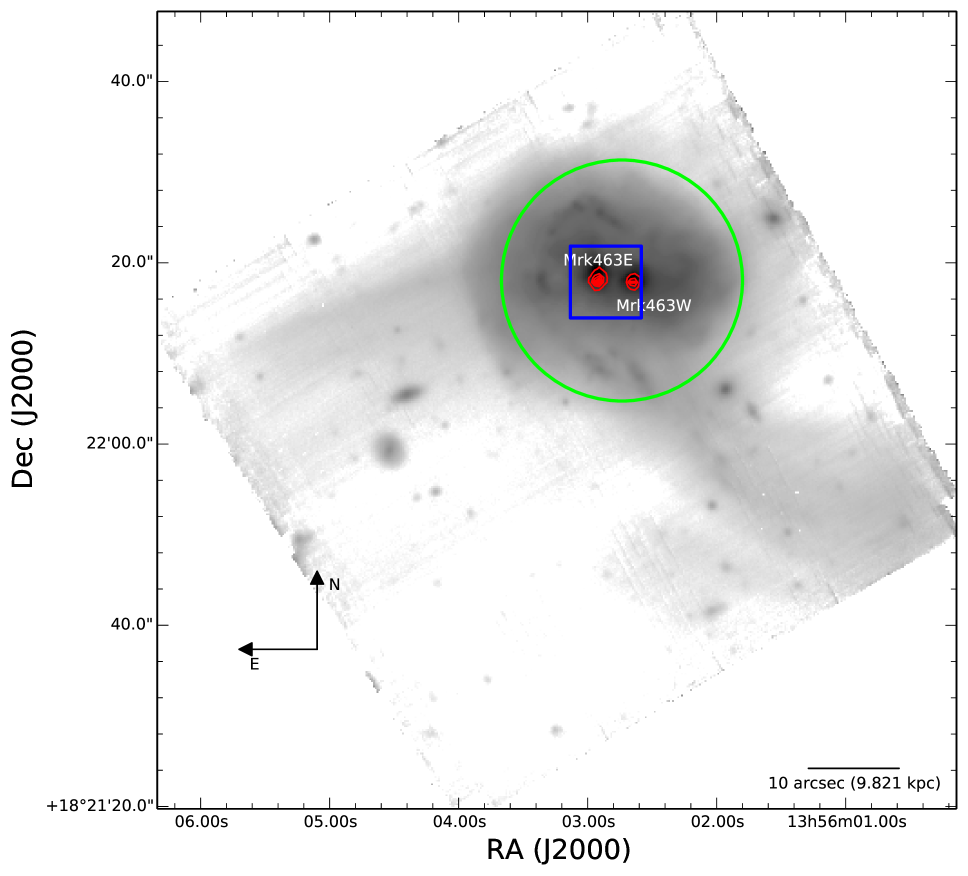
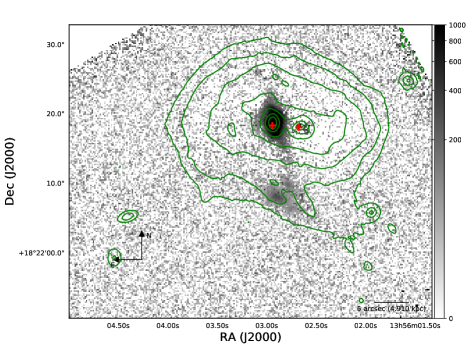
Taking advantage of the MUSE IFU data, in Fig. 1 we present a reconstructed optical continuum image of the Mrk 463 system, ranging from 4800 to 9300Å. This image covers the entire MUSE 11 arcmin2 field of view, roughly an order of magnitude larger than previous IFU observations of this source (e.g., Chatzichristou & Vanderriest, 1995). Both nuclei, Mrk 463E and Mrk 463W, are clearly visible on the image, together with the southern knot, which is almost exclusively seen in [Oiii] emission, as discussed in §3.1. Additionally, we can see relatively bright emission clumps, most prominently to the north-east of the Mrk 463E galaxy, which we will later, in the following subsection, associate with off-nuclear star-forming regions.
3.1 Optical Atomic Transitions
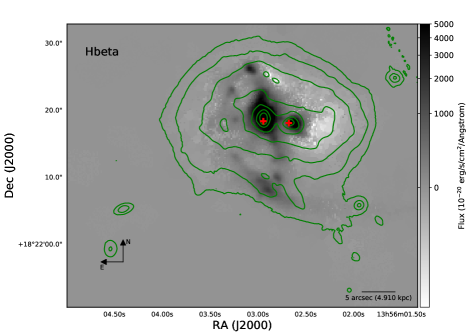
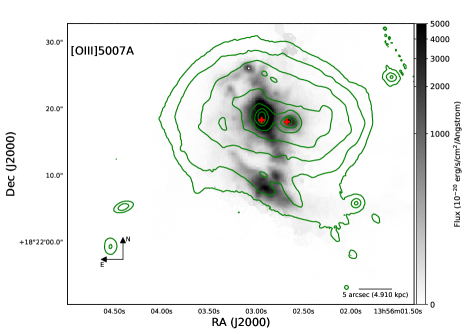
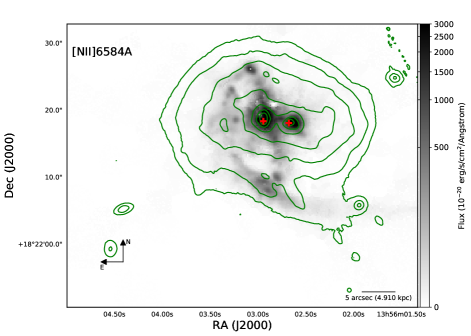
In order to obtain line flux maps from the MUSE data cubes we perform Gaussian fits to the He II 4685Å, 4861Å, [Oiii] 5007Å, 6563Å, [Nii] 6548,6583Å and [Sii] 6717,6731Å features. The line fitting procedure is as follows: First, the continuum emission in each pixel is subtracted by performing a fit using a second order polynomial function between 5000Å and 8000Å. Using this broad wavelength range and a relatively small polynomial order allows to obtain a good fit for the spectral continuum in the region of interest while remaining unaffected by the presence of even prominent emission or absorption features. Then, we performed a Voronoi tesselation of the cube by demanding a minimal signal-to-noise ratio of 10 in the /[Nii] complex in each bin. While this choice has no impact on the central regions of the system, where this condition is met basically on every pixel, it is important in the outskirts. We then assume Gaussian profiles for all emission lines. Given that it is a strong and well-isolated feature, we use the [Oiii] 5007Å line as a template in order to define the widths and relative wavelength offsets for all the subsequent narrow components. We further allow for a secondary line component at a different velocity, also using the [Oiii] 5007Å line as template and adding extra Gaussians with both the line centers and widths as free parameters to account for the possible presence of broad and emission. In each case, a component is only considered if the peak is detected at a signal-to-noise greater than 3.
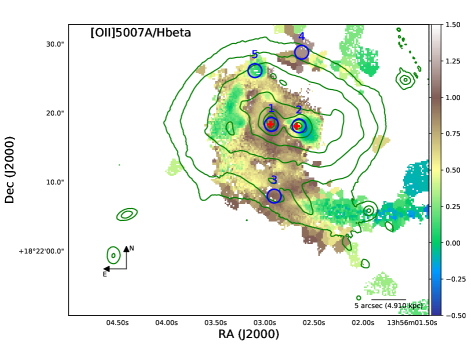
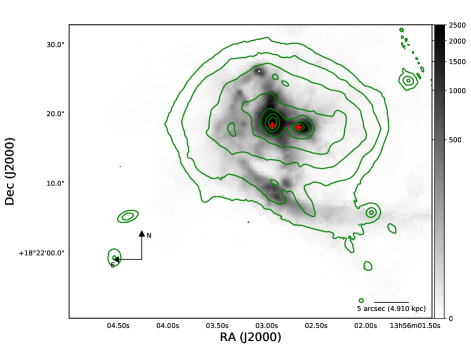
The resulting images are presented in Figs. 2 and 3. In all of these cases, the total flux for all the line components is shown. Some of the same key features seen in Fig. 1 and discussed in the previous section are clearly visible in these images as well. However, other remarkable components are now detected as well. Particularly important are the detections of extended gas to the northwest of the system and the “stream” of blobs to the southwest, seen in Fig. 3. Additionally, in the 4861Å map we can identify an absorption region to the west of the Mrk 463W nucleus.

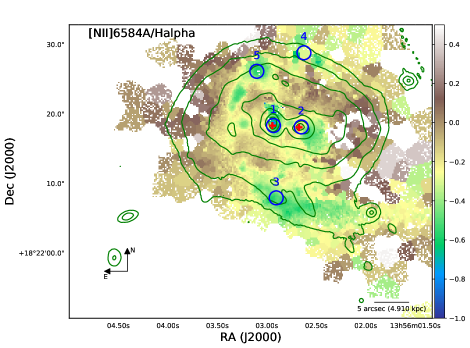
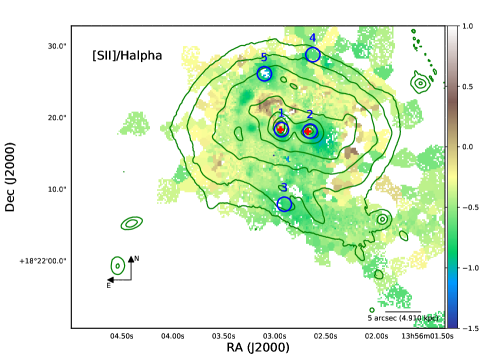
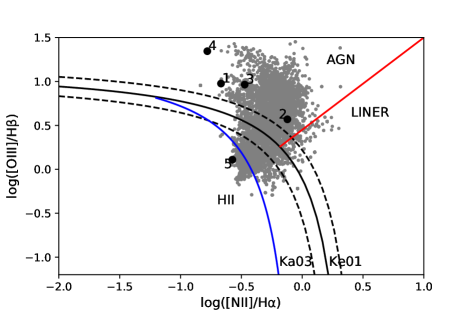
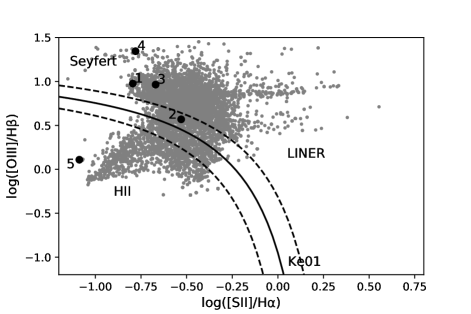
The flux ratios of these emission lines can be used in order to determine the nature of the ionization source (e.g., Baldwin et al., 1981; Veilleux & Osterbrock, 1987; Kewley et al., 2006). Figures 4 and 5 show the maps for the [Oiii]/, [SII]/, and [NII]/ ratios, computed using the sum of the flux in the narrow components for each emission line. According to Kewley et al. (2006), any source/region with [Oiii]/10 is nearly guaranteed to be dominated by AGN ionization, independent of the value of [NII]/ or [SII]/. While shocks appear to be widespread in major galaxy mergers, they typically have lower [Oiii]/ ratios, 1-5, compared to active nuclei (Rich et al., 2011, 2015). Hence, just from examination of Fig. 4 we can see several potential AGN-dominated regions. In order to investigate the nature of the ionization energy source(s), we selected five outstanding zones in the system, highlighted in Figures 4 and 5: the two nuclear regions, the southern emission line region, the northern clump, and a representative emitting region in the northwest. The location of these five regions on the [Oiii]/ versus [NII]/ and [SII]/ diagnostic diagrams is shown in Figure 6. As can be clearly seen, both nuclei, the southern emission line region and the northern clump are consistent with being dominated by the AGN energy output. In contrast, region #5 appears to fall on the star-forming locus. These diagrams indicate that the influence of the AGN on the surrounding material is widespread and can be detected at large distances, even 10 kpc away from the nuclei.
Further hints about the nature of the ionization sources in this system can be obtained by exploring emission lines with higher ionization energies. To this end, Fig. 7 shows the emission maps for the He II 4685Å and the [SII] 6717/31Å lines, which have ionization energies of 54.4 eV and 23.3 eV respectively. As can be seen in the figure, highly ionized lines, in particular He II, are much more concentrated, mostly on the Mrk 463E nucleus and the emission line regions, while Mrk 463W is barely detected. As presented by Shirazi & Brinchmann (2012) and later by Bär et al. (2016), the He II 4685Å emission and the He II/H ratio, can be used to identify AGN even in sources missed by classification methods based on emission lines at lower ionization energies (Sartori et al., 2015). According to Shirazi & Brinchmann (2012), sources or regions with (He II/)-1 can be classified as AGN dominated. This is the case for the Mrk 463E nucleus and its surrounding ionization cone, for the southwest emission line region but not for the Mrk 463W nucleus. This suggests that the AGN in Mrk 463E is energetically more important for the system than the one in Mrk 463W.
3.2 Near-IR maps
Although the VLT/SINFONI near-IR IFU data only cover a smaller 8′′8′′ region at the center of the Mrk 463 system, as shown in Fig. 1, they are an important complement to the MUSE optical maps. Figure 8 shows the near-IR continuum between 2.1 and 2.4 m and the continuum-subtracted integrated Pa hydrogen emission line at 1.8751 m in the rest frame. For this and all near-IR emission lines, the continuum subtraction was carried out by performing a simple first order polynomial fit to the adjacent spectral regions on each side of the line. The line fitting was carried out assuming a single Gaussian functional form, which was visually deemed appropriate and reasonable considering that the SINFONI data only cover the central region of the system. No cut in signal to noise ratio of the resulting line was used in constructing the map. Both nuclei are clearly detected on the continuum map, showing a very similar morphology to the optical continuum image presented in Fig. 1. The Pa map, in contrast, reveals new components. In particular, we can marginally detect an emission blob between the two nuclei and another emitting region to the west of the Mrk 463W nucleus. While both of these regions are also visible in the H map, they are not detected in [Oiii], suggesting that they are star-forming regions. However, as it will be later shown in section 5.1, the region between the nuclei is subject to moderate extinction, 2, and therefore it is possible that the lack of detection of [Oiii] in this area is due to obscuration.
The Pa emission line provides a measurement of the star formation rate. Using the SINFONI cube together with the conversion from Pa luminosity to star formation rate provided by Rieke et al. (2008), we derive values of 26.5 M⊙/yr for the East nucleus and 0.75 M⊙/yr for the West one. These star formation rates derived from the Pa line are fully consistent with those of 30 M⊙/yr for Mrk 463E and 10 M⊙/yr for Mrk 463W reported by Evans et al. (2002). However, it is important to point out that as shown in Fig. 6, both nuclei appear to be dominated by the AGN emission, at least for the optical lines, and thus these SFR estimates can be considered as upper limits.
The near-IR data also map other emission lines such as [Si VI] and Hydrogen Br at rest-frame wavelengths of 1.962 and 2.1655 m, respectively; these are both presented in Figure 9. Emission from [Si VI] is detected at high significance from Mrk 463E and weakly from Mrk 463W, thus further confirming the AGN nature of both nuclei. However, Br is in contrast only weakly detected from Mrk 463E.
3.3 CO and dust continuum
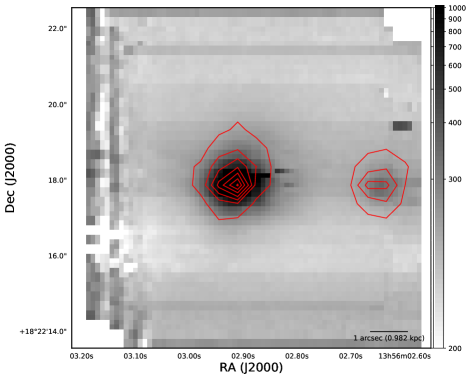
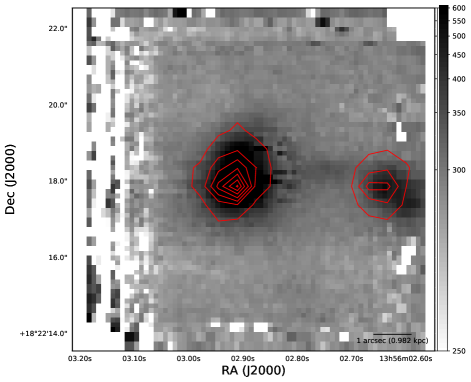
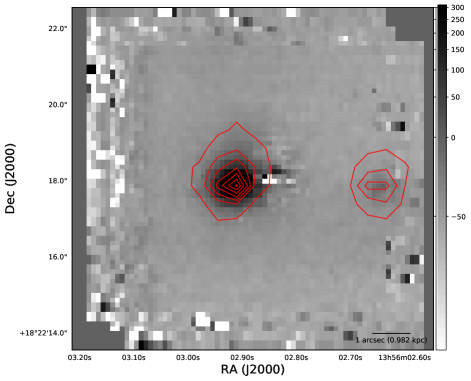
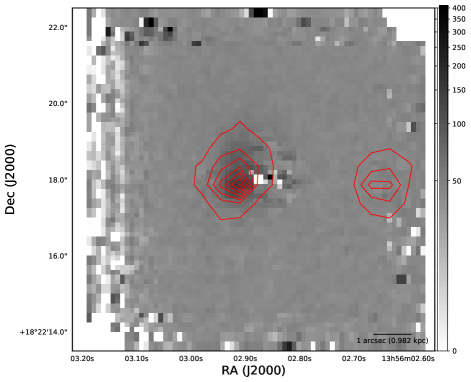
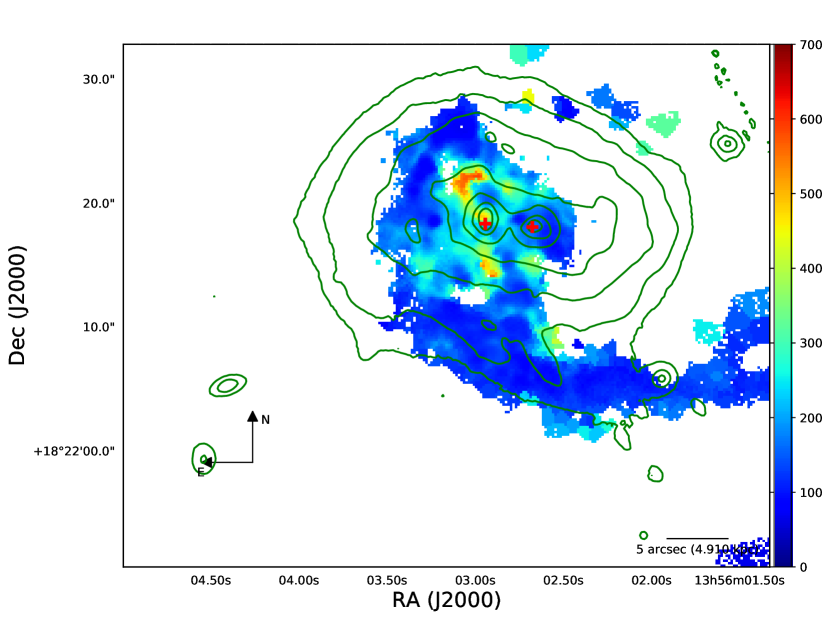
With our ALMA Cycle 2 data we detect both 12CO(2-1) and the mm continuum in the central region of the Mrk 463 system. Fig. 10 shows the velocity-integrated continuum-subtracted 12CO(2-1) emission map together with contours for the rest-frame 232 GHz continuum. As can be seen, the strongest CO(2-1) emission is found in a region to the Northeast of the Mrk 463E nucleus, although significant emission is also located around each nucleus and in between them. Interestingly, only a small fraction of the CO(2-1) emission overlaps with the AGN location.

Defining a 4′′3′′ region centered on the Mrk 463E nucleus that encloses the majority of the flux, we obtain a total flux density of 11.40.12 Jy km/s. In this case the error bars were estimated by measuring the RMS in nearby source-free regions of the same area. Previous observations of this source at lower resolution, 2′′, yielded total unresolved fluxes of 7.20.8 Jy km/s (Alloin et al., 1992) and 6.80.9 Jy km/s (Evans et al., 2002) for the 12CO(1-0) transition. Following Solomon & Vanden Bout (2005), we assume that the CO emission is thermalized and optically thick so that the intrinsic line luminosity is independent of and hence we expect the 12CO(2-1) flux density to be 4 higher than 12CO(1-0). Therefore, our high-resolution ALMA observations resolve out 50% of the CO emission for the Mrk 463E nucleus extended over scales of 4′′. Using a region of the same area centered on the Mrk 463W nucleus, we derive a line flux density of 4.50.12 Jy km/s. This is consistent with the estimates of Evans et al. (2002), who also found a flux ratio of 3:1 between the Mrk 463E and Mrk 463W nuclei, thus suggesting that the extended component encompasses both nuclei, expected given the observed nuclear separation.
Following the prescription described in Sections 2.1 and 2.2 of Solomon & Vanden Bout (2005), and in particular their equation 3:
we calculate a CO(2-1) luminosity for the emission surrounding the Mrk 463E nucleus of (2-1)=3.173108 K km s-1pc2. Then, using the relation =M()=, and =4.3M☉(K km s-1pc2)-1 (Bolatto et al., 2013), we obtain a total gas mass in this region of 1.36109M☉. Similarly, for the material surrounding the Mrk 463W nucleus we obtain (2-1)=1.253108 K km s -1pc2 and =5.39108M☉. These differ from the gas masses derived by Evans et al. (2002) primarily due to the different values of assumed. Indeed, Evans et al. (2002) used a value of =1.5M☉(K km s-1pc2)-1 for this source and reported a total molecular gas mass of 109M☉, while assuming their value we obtain 7108M☉.
4 Kinematics
The multi-wavelength IFU data for Mrk 463 can be used to trace both absorption and emission lines and measure the kinematics of the system.
4.1 Optical Emission Lines
Using the VLT/MUSE data, we analyze the kinematics from two strong and well-isolated emission lines: 4861Å and [Oiii] 5007Å. Figure 11 shows the position-velocity (p-v) diagram centered on the Mrk463-E nucleus with position angles (PAs) of 0∘ (i.e., north-south) and 75∘ using the [Oiii] 5007Å line. In this case we assume a reference velocity of 15226 km/s, which is 130 km/s higher than the systemic heliocentric velocity of 15096 km/s corresponding to the redshift of 0.050355 reported by Falco et al. (1999) which we used for the rest of the analysis. This was done to match the center of the potential additional stellar disk to the west of Mrk 463W discussed in §4.2. A clear velocity gradient can be seen on the north-south slit, as discussed below. This structure is highly localized spatially, as it is not present on the PA=75∘ diagram. Visible on the PA=0∘ slit is the southern emission line region at 10′′. As can be seen, this region is roughly at the systemic velocity. Similarly, part of the emission associated with the Mrk463W nucleus can be seen on the PA=75∘ diagram, at 4′′ away from the eastern one.
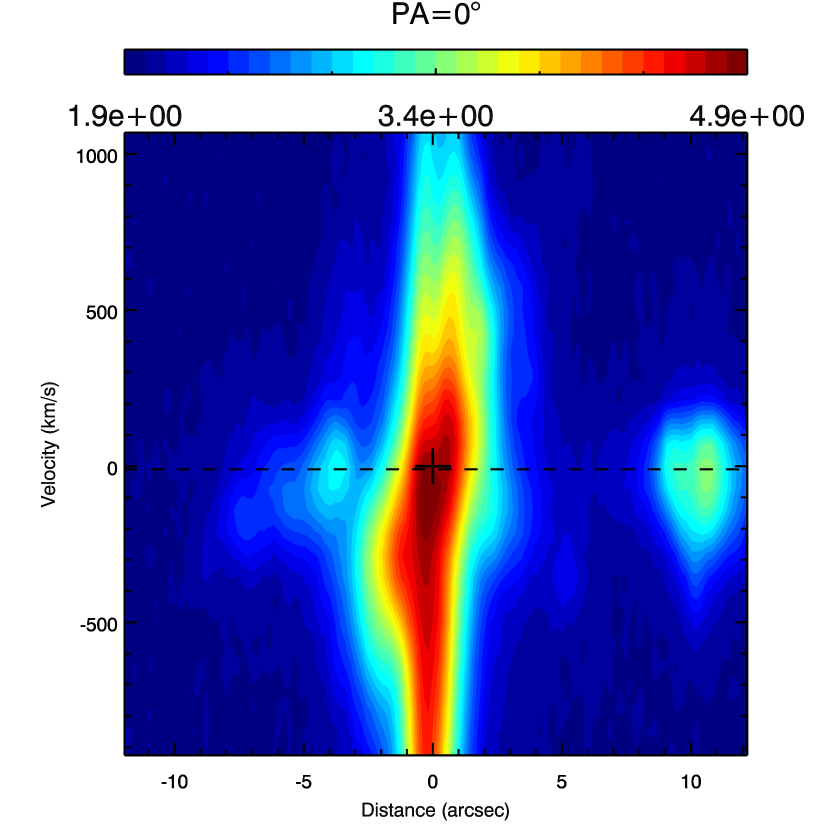
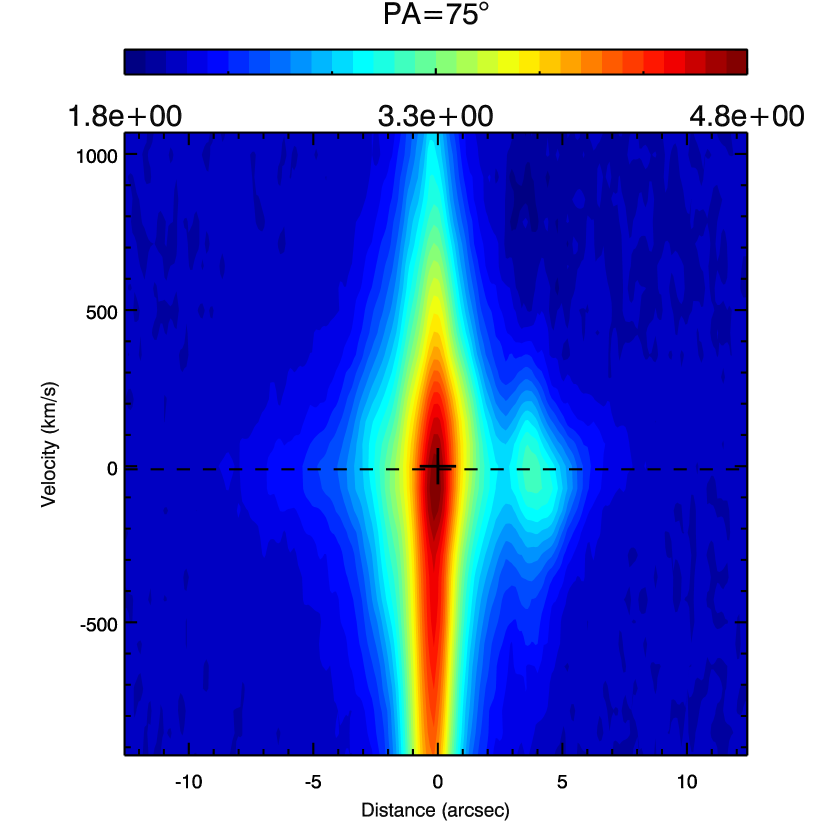
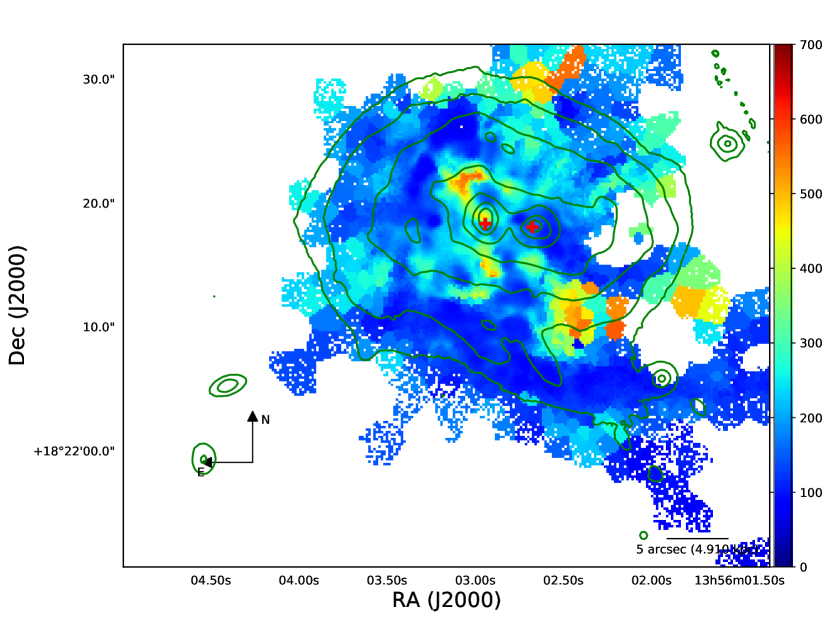
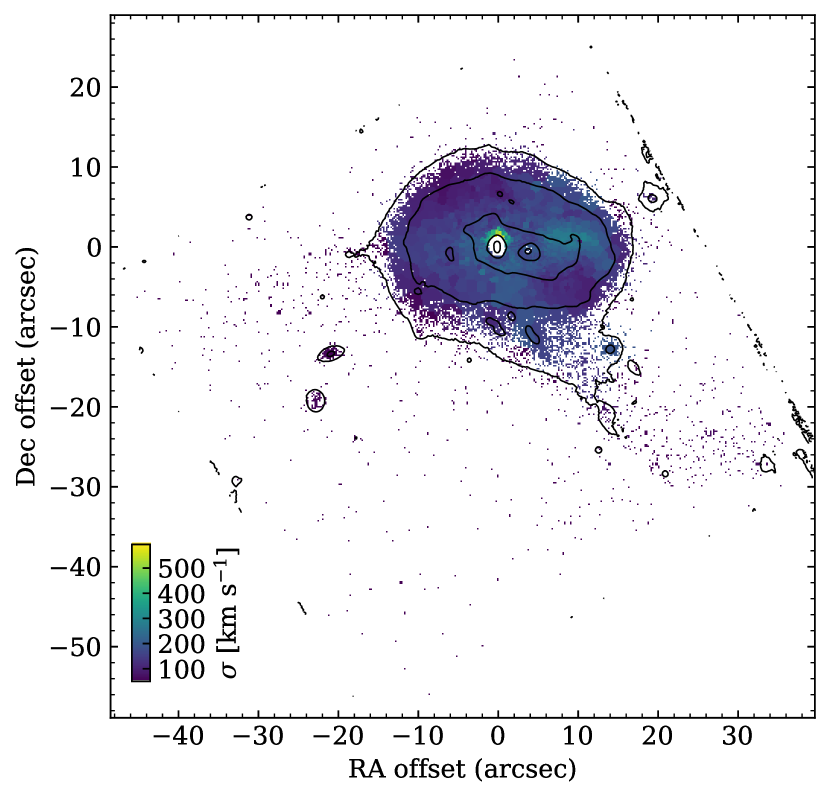
Figure 12 shows the velocity and velocity dispersion maps for the [Oiii] 5007Å emission line. The velocity gradient associated with the eastern nucleus that was visible on the p-v diagram presented in Fig. 11 is present here as well. As first suggested by Hutchings & Neff (1989) and later discussed by Chatzichristou & Vanderriest (1995), this structure is consistent with the presence of a two-sided ionization cone, which also aligns with the extended radio emission detected from this nucleus. While a detailed modeling of this biconical outflow is beyond the scope of this paper, we can use the observed emission line features in this region to derive physical properties of the ionized gas outflow. As presented by Müller-Sánchez et al. (2011), the mass outflow rate is given by
where is the proton mass, is the density of the ionized gas, is the lateral surface area of one cone of the outflowing region, and is the filling factor of the ionized gas. The factor of 2 accounts for the two sides of the ionized cone. The value of can be estimated from the observed ratio of the [SII] 6716/6731Å emission lines, as described by Osterbrock & Ferland (2006). We find that on average the [SII] ratio in the region of the biconical outflow has values 0.7. According to the prescription of Osterbrock & Ferland (2006) and assuming a temperature of 10,000K, we estimate that should be in the range from 1000 to 5000 cm-3 and adopt a value of 3000 cm-3. For the filling factor, , which cannot be derived directly from observations, a range of 0.010.1 is commonly assumed (e.g., Storchi-Bergmann et al., 2010). However, our assumed value is much higher than in those cases, and considering the relation proposed by Oliva (1997) we assume a value of =0.001, which is 10 times larger than the value used by Nevin et al. (2018). We consider a maximal velocity of 350km/s, as measured on the [Oiii] velocity map. The value of is obtained considering that the physical distance from the nucleus to the location of the maximal velocity is 3.3 kpc and that the cone radius at that position is 0.9 kpc thus yielding A=9.62106pc2. Then, using the expression described above we obtain that =512(/0.001) /yr. This value is on the high side of the range of mass outflow rates found previously in systems hosting biconical outflows (Müller-Sánchez et al., 2011, 2016; Nevin et al., 2018) in moderate-luminosity AGN and similar to those found in high redshift quasars (Brusa et al., 2015) and ULIRGs (e.g. Veilleux et al., 2005).
In addition, we also detect a rapidly outflowing region to the north-west of the Mrk 463E nucleus, reaching speeds of up to -600 km/s. This region was already identified as #4 in Figure 4. As shown in Figure 6, this region has the highest value of the [Oiii]/H ratio and is clearly located in the AGN region, which confirms that this outflowing material is being ionized by the AGN, most likely in Mrk 463E given its spatial location and the luminosity of its nucleus. Furthermore, this outflowing region appears to be spatially connected to the biconical outflow. The velocity dispersion map for the [Oiii] 5007Å line shows a broad emission line component in the central region of Mrk 463E. Both the north and south edges of the biconical outflows also show relatively high velocity dispersions, reaching up to 600 km/s, and hence suggest the presence of shocks in the boundary of the outflowing regions. The remaining regions are characterized by relatively low velocity dispersions, up to 200 km/s, close to the spectral resolution of VLT/MUSE.
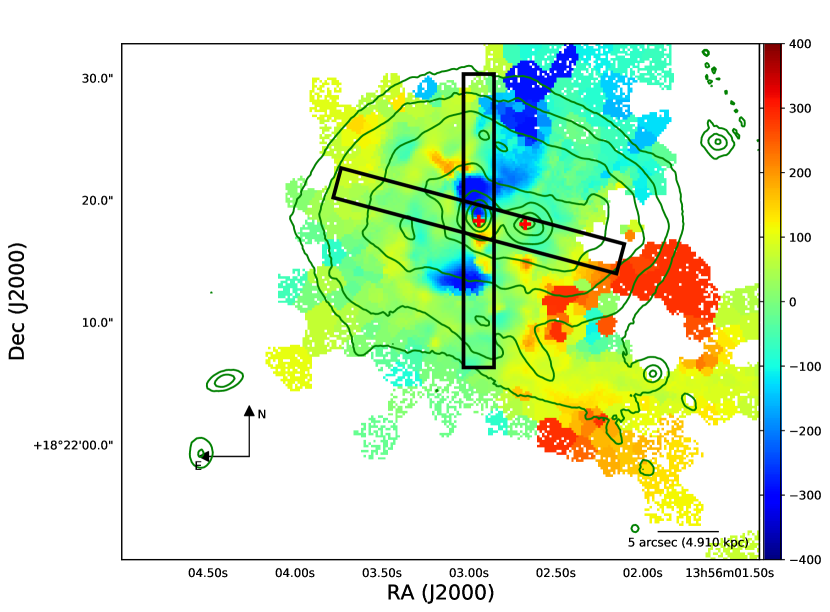
The velocity and velocity dispersion maps, as measured from the 4861Å emission line, are shown in Figure 13. As for the [Oiii] 5007Å line, a very clear gradient, ranging from -350 km/s in the north to 150 km/s to the south, centered on the Mrk 463E nucleus is clearly visible. This gradient is also associated with the biconical outflow presented above. This map does not include the absorption line region located to the west of the Mrk463W nucleus, which will be studied in detail in the following subsection. Both nuclei appear to be consistent with the systemic velocity, or with very small offsets. Similarly, the southern emission line region is at the systemic velocity and has no discernible structure. However, there is a clear tail of atomic gas emission traced by the 4861Å transition, which includes the southern emission line region visible in the [Oiii] map, presenting a velocity gradient ranging from 100 km/s to 200 km/s. This appears to reflect the velocity gradient along a tidal tail from the ongoing dynamical interaction and is consistent with the velocity gradient seen in HI observations of other systems (e.g., Hibbard & van Gorkom, 1996).
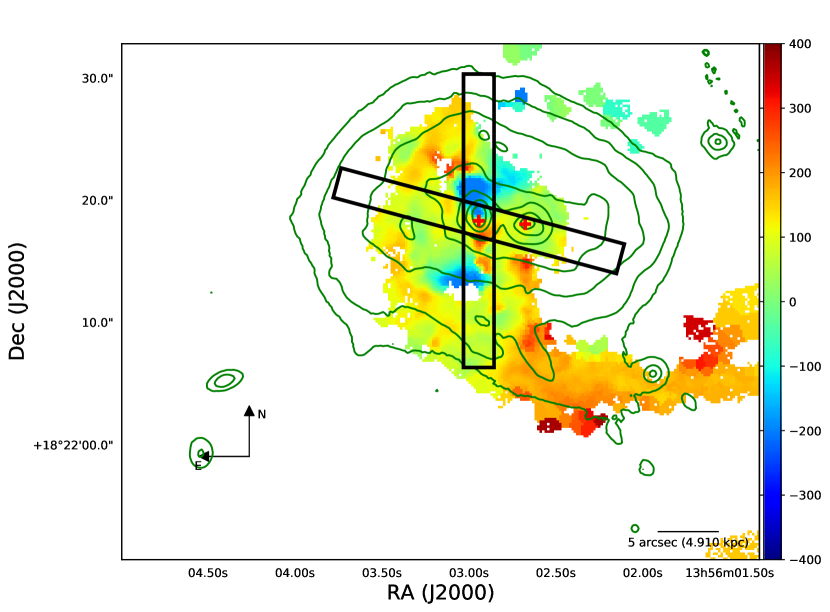
The velocity dispersion profile for the 4861Å line reveals the presence of a relatively broad component with a FWHM of up to 700 km/s in the nuclear region Mrk 463E, consistent with the location of the hard X-ray emission reported by Bianchi et al. (2008). The arc-like structure to the north-east of the Mrk 463E, which also shows high velocity dispersion values, is explained by the presence of two superimposing velocity components, one associated to the edge of the biconical outflow reaching velocities of 400 km/s and the underlying galaxy at the systemic velocity. The rest of the system presents only narrow components with a width of 200 km/s or less, consistent being unresolved at the MUSE spectral resolution.
4.2 Stellar kinematics
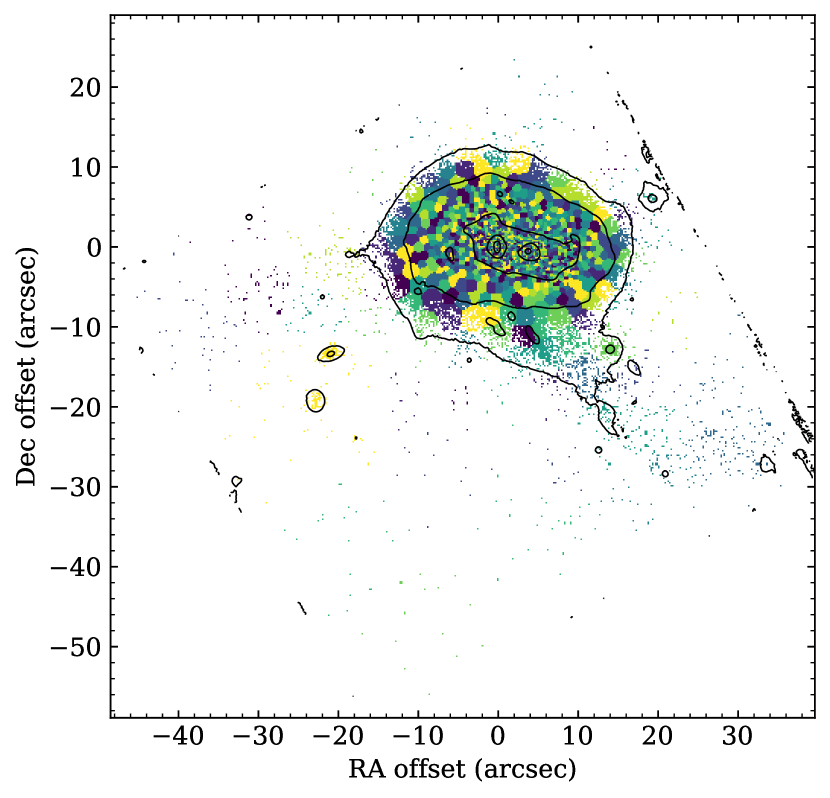
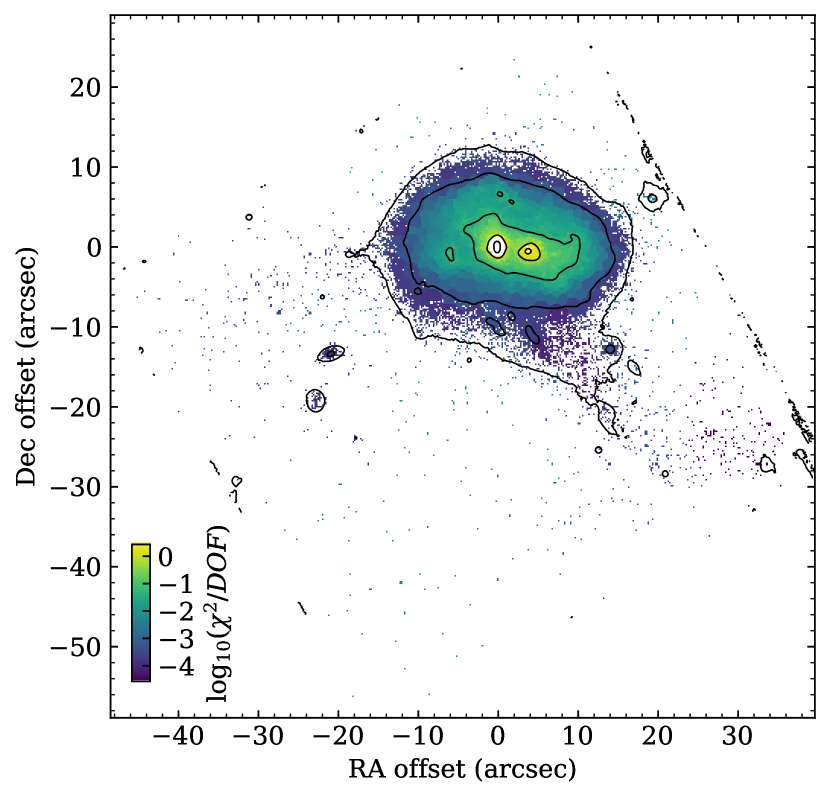
We can further use the VLT/MUSE data cube to measure the kinematic properties of the stars in the Mrk 463 system. In order to achieve this, we performed a new Voronoi tessellation (Cappellari & Copin, 2003), this time aimed to reach a minimum signal-to-noise ratio of 30 per bin in the optical continuum near the Mg b feature at 5200Å in the rest frame. The resulting bin map is shown in Figure 14. Then, for each bin, we simultaneously masked the most prominent emission lines and fitted the optical continuum and absorption lines using the Penalized Pixel-Fitting (pPXF) method presented by Cappellari & Emsellem (2004). The optical spectrum at each Voronoi bin was fitted using stellar templates from the MILES library (Falcón-Barroso et al., 2011) which were then used to derive properties such as the stellar velocity and velocity dispersion, and Hermite polynomial coefficients, etc. A more detailed description of this procedure is given by Cappellari (2017). In Figure 14 we show the reduced for each Voronoi bin. Fits were not obtained for the central regions of each galaxy, as the optical spectra in these are dominated by AGN light.
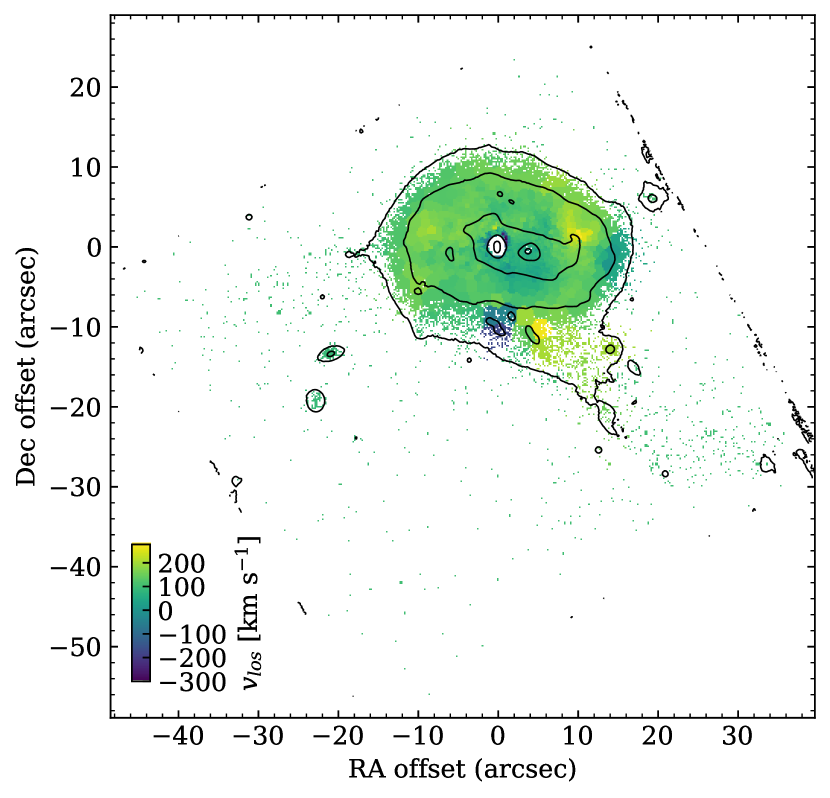
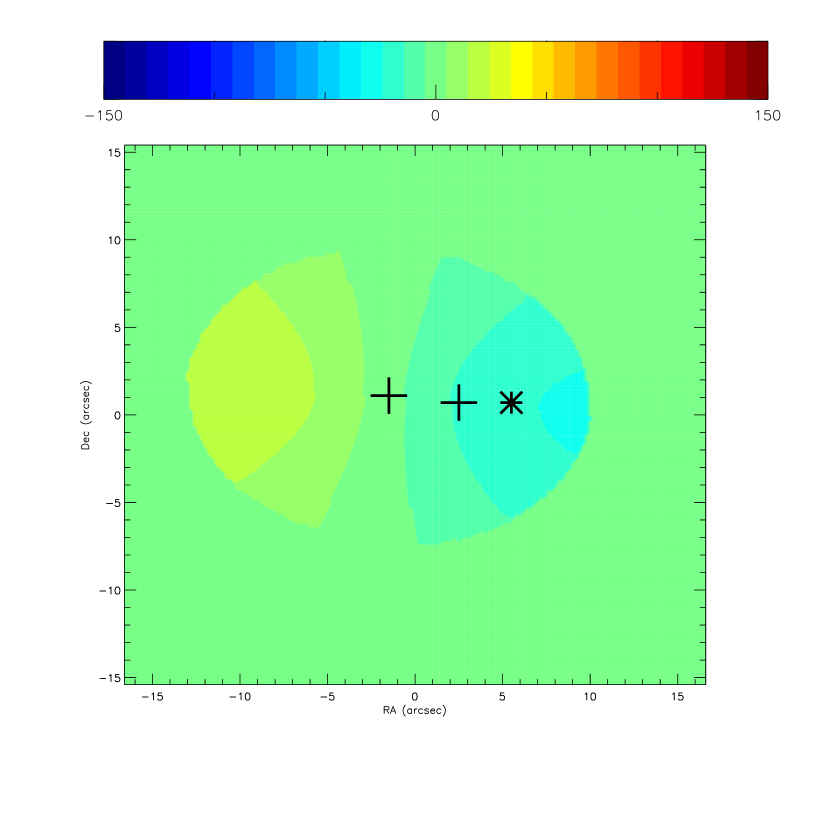
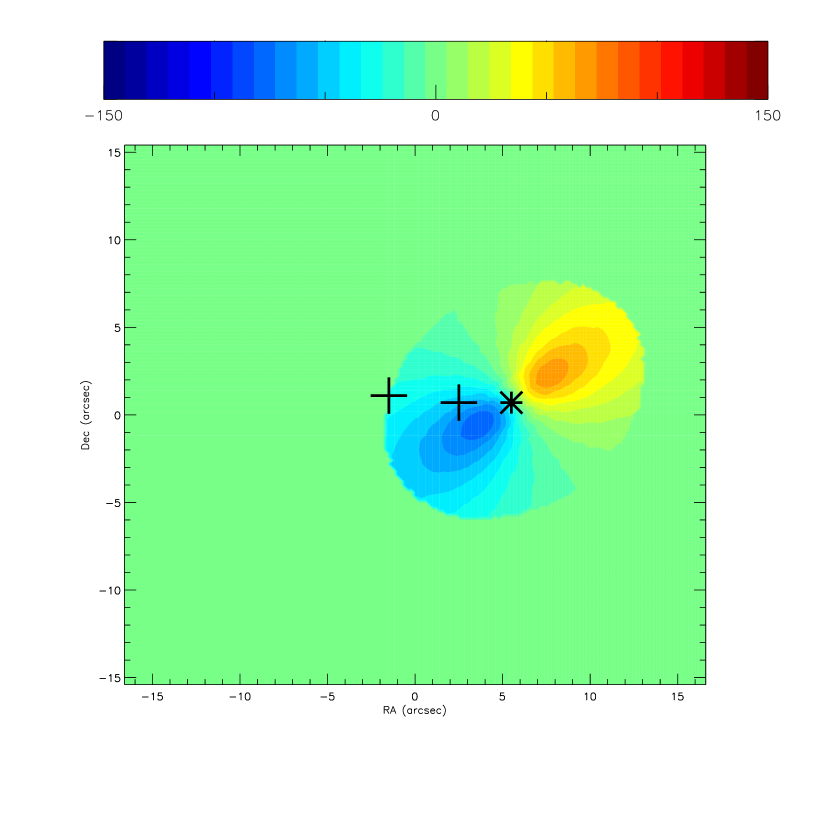
By performing this spectral fitting, in Figure 15 we present the stellar velocity and velocity dispersion maps. While the stellar velocity map appears rather flat, some structures are visible. In particular, there is a clear region to the northwest of the Mrk 463W nucleus presenting a relative line-of-sight velocity of 200 km/s. In addition, a negative velocity region can be observed to the south of the Mrk 463W nucleus. These features could potentially be related to the ongoing major merger, such as tidal plumes from a second (or latter) close pass of the nuclei. Interestingly, this structure overlaps spatially with a region dominated by H in absorption, as can be seen in Figure 2. This, together with the fact that this region does not have a counterpart on the emission line velocity maps presented in Figures 13 and 12, strongly suggests that this region is mostly devoid of ionized gas. While very faint, this structure can be seen as an extra component in the optical continuum, as shown in Figure 1.
The stellar population fit simultaneously constrains the line-of-sight stellar velocity dispersion, which is presented on the right panel of Figure 15. As for the velocity map, the velocity dispersion in the Mrk 463 system appears to be rather flat and featureless. Again, the region to the northwest of the Mrk 463W nucleus presents an elevated value for the stellar velocity dispersion of 400 km s-1 while the average for the system is 100 km s-1. This broadening in the line-of-sight velocity dispersion may be evidence of multiple velocity components at this location, perhaps due to the superposition of a secondary tidal tail against a potential stellar disk.
In order to explore the existence of potential disk(s) revealed by kinematical structures, we attempt to fit the stellar kinematics with disk models. Specifically, we use the Keplerian disk models presented by Bertola et al. (1998). We use two disks, one centered on the Mrk 463E nucleus and the second one at the center of the velocity gradient found to the west of Mrk 463W. Spatial profiles of the two models are presented in Figure 16. The models fit the data reasonably well, leaving only small velocity residuals. Hence, it is possible to explain the Mrk 463 system as a combination of a bulge and a faint extended disk associated with Mrk 463E, together with a bulge centered on Mrk 463W and a gas-stripped stellar disk to the west of Mrk 463W. There does not seem to be any connection between the ionized gas outflows discussed in section 4.1 and the potential stellar disks presented here. As discussed in §4.1, the outflows in this system appear to be mostly located in the north-south direction and originate from the Mrk 463E nucleus. In contrast, the Mrk 463E stellar disk is oriented with a PA of 75 degrees, i.e., mostly east-west. Similarly, the presumed stellar disk to the west of Mrk 463W does not appear to be connected in any obvious way with any ionized gas outflow.
As described above, we would like to further emphasize that it is also possible to understand the observed structures in the stellar kinematics maps by the dynamical effects of the ongoing major galaxy mergers, which is also more natural as it does not require to assume an ad-hoc stellar disk offset by 3 kpc from the nucleus of the galaxy. Unfortunately, separating these two scenarios requires observations at higher spectral resolutions than those that can be provided by VLT/MUSE over relatively large angular scales in order to cover the whole system.
4.3 CO and dust continuum
Thanks to the ALMA data, we can analyze the molecular gas kinematics in the nuclear regions of the Mrk 463 system. Figure 17 shows the 12CO(2-1) velocity map. Interestingly, the molecular gas regions around each nucleus show very clear velocity gradients, with a range of 800 km/s in the case of the east region and 400 km/s next to the west region. Smaller gradients can be seen in a few other locations, including the one in between the two nuclei.

The eastern emission region presents an incomplete ring-like or infalling spiral structure, possibly centered on the AGN, based on the X-ray position. While there is relatively little CO(2-1) emission detected directly on top of the nucleus, we can use the gas mass and velocity in the immediate vicinity of Mrk 463E to obtain an estimate of the gas infall rate on scales of 300 pc around the SMBH. Considering only the material in the central ALMA beam, corresponding to 0.3′′ or 300 pc or a 150 pc radius, we obtain a total CO mass of 3.8107M☉. Now, assuming that this gas is falling at 200 km/s based on the CO(2-1) velocity measured on the nuclear ALMA beam and that it is at an average distance of 75 pc, this yields an influx rate of 104 M☉/yr. While just an approximation, this value is 3 orders of magnitudes larger than the accretion rate of 0.017 M☉/yr inferred from the X-ray luminosity of the Mrk 463E nucleus reported by Bianchi et al. (2008). This situation is very similar to what was found in the local AGN NGC1068 by Müller Sánchez et al. (2009) and later confirmed by García-Burillo et al. (2014) using high-resolution ALMA data, thus strongly suggesting that SMBH accretion is a highly inefficient process that requires the infalling material to lose most of its angular momentum.
5 Discussion
5.1 Optical Extinction
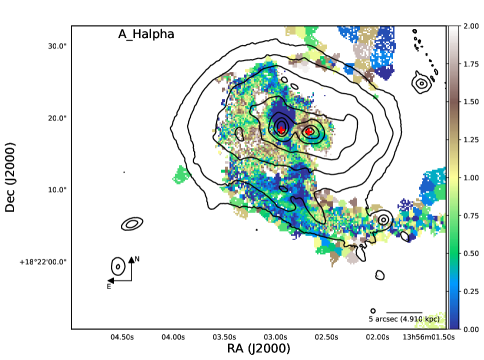
Major galaxy mergers are known for potentially being subject to significant extinction, particularly at optical and UV wavelengths (e.g. Trentham et al., 1999; Bekki & Shioya, 2000). Spectroscopically, the traditional way to estimate the amount of optical extinction is based on the observed ratio between the H and H lines (e.g. Caplan & Deharveng, 1986; Maíz-Apellániz et al., 2004). Taking advantage of the VLT/MUSE observations of the Mrk 463 system we can then produce a AHα map. Following the prescription of Lee et al. (2009), we assume case B recombination with an intrinsic /H ratio of 2.86, a Milky Way extinction curve and =3.1 so that AHα is given by:
where and are the total emission line fluxes on the H and H lines derived following the procedure described in section 3.1. The resulting map is shown in Figure 18. As can be seen, most of the system is only affected by relatively low extinction levels, 1. However, there are specific areas which appear subject to higher optical obscuration. These include some of the regions where we previously identified high levels of star formation to the east of the Mrk 463E nucleus, and the area between the two nuclei, where we can see values of 1.5-2. While locally important, these relatively modest obscuration levels do not affect significantly the conclusions about the morphologies and kinematics derived from the optical VLT/MUSE IFU maps presented here and are even less important for the near-IR analysis shown in section 3.2.
5.2 Energetics of the Emission Line Region
As described in Section 3.1, we identify an emission line region to the south of the system, consistent with AGN powering. This region closely resembles the “Hanny’s Voorwerp” structure associated with IC 2497 (Lintott et al., 2009), which was found serendipitously by visual inspection of the galaxy optical images carried out as part of the Galaxy Zoo project (Lintott et al., 2008). Hanny’s Voorwerp appears to be ionized by the nearby AGN in IC 2497, which must have been at least 100 times more luminous years earlier (Schawinski et al., 2010; Keel et al., 2012b; Sartori et al., 2016). For Mrk 463, the southern region is 11 kpc away from the Mrk 463E nucleus, which corresponds to 40,000 light years. Based on the evident alignment between this emission line region and the ionization cone arising from the Mrk 463E core, we can safely neglect the contribution from the Mrk 463W AGN. Then, we can estimate the luminosity necessary in order to supply the ionizing flux required to explain the observed spectrum of the southern region.
In order to carry out this computation we selected a region in the center of the emission region enclosing most of its flux. We used as constraints the observed luminosities and their errors in the , , [HeII]4686Å, [Oiii]5007Å, [NII]6583Å, [SII]6717Å and [SII]6731Å lines, all measured from the VLT/MUSE optical IFU observations. We then performed radiative transfer simulations using the plasma ionization code CLOUDY version 13.04 (Ferland et al., 2013). We considered two different cases: (1) a matter-bounded scenario in which the main parameters are U, the dimensionless ionization parameter, nH, the hydrogen volume density and NH, the hydrogen column density, and (2) a radiation-bounded case, whose only parameters are U and nH. In both cases we assumed that the input AGN spectrum was given by a broken power law of the form with =-0.5 for E13.6 eV, =-1.5 in the range 13.6E0.5 keV and =-0.8 at E0.5 keV, consistent with the observed spectrum of local AGN (e.g., Elvis et al., 1994; Kraemer et al., 2009).
For each resolution element in the southern emission region we used the grid of simulations carried out using CLOUDY in order to find the best fit to the intrinsic emission line ratios, all computed with respect to the line. From this solution we can obtain the corresponding value of Q, the number of ionizing photons emitted per unit of time, which is defined by
| (1) |
where is the distance between the AGN and the cloud. Then, we use this value to obtain the corresponding intrinsic bolometric luminosity by assuming an intrinsic AGN spectral shape such as the one given by, e.g., Elvis et al., 1994. The results of the simulations are presented in Figure 19. The best-fitting value for U can be found between -2.9 and -2.6, with a mean value of -2.7.
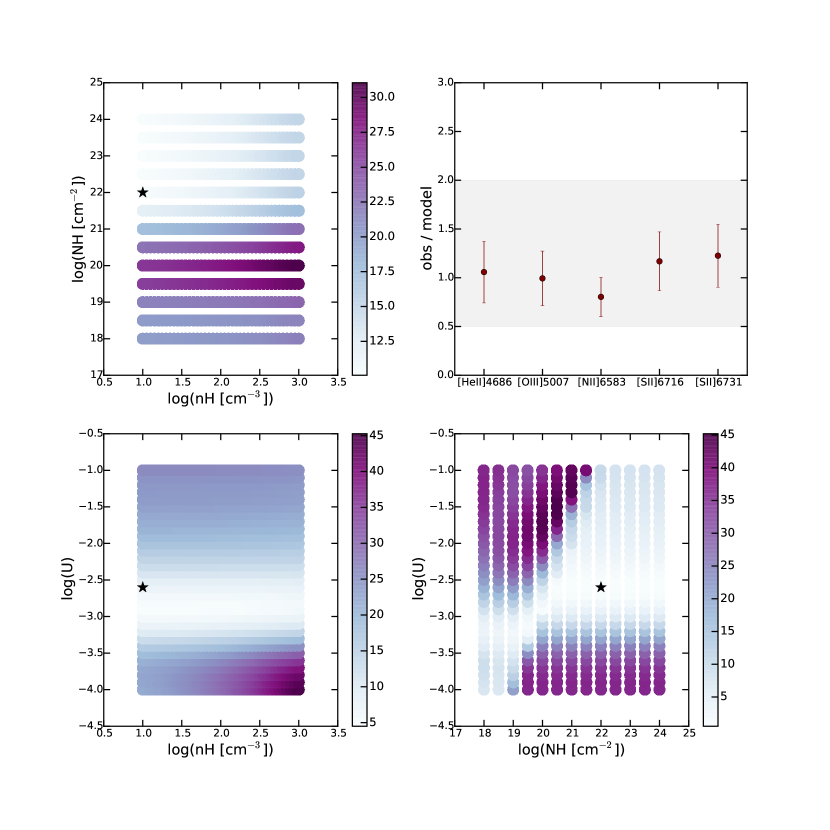
As can be seen in Figure 19, the resulting fits are not very sensitive to the value of nH. Indeed, models with the same U and but different values of nH yield very similar reduced . This is critical in our calculation, as the required intrinsic AGN bolometric luminosity is proportional to U, as can be seen in equation 1. For the calculation we assume a fully-ionized gas, as was done for the Voorwerpjes (Keel et al., 2012a). Hence, the atomic hydrogen column density is the same as the electron density, =, which can be estimated from the ratio of the two [SII] lines. Furthermore, we can neglect the contribution from molecular hydrogen, given that no molecular gas was detected at the position of the southern ionized cloud. From the observed values of the [SII] 6716/6731 ratio we estimate an allowed average range in the southern emission region of 10-100 atoms cm-3. In turn, this implies bolometric AGN luminosities in the range of 2.71045 erg s-1 to 1.81046 erg s-1. We compare this value with the current AGN luminosity, as observed in X-rays. From Chandra observations, Bianchi et al. (2008) reported a 2-10 keV luminosity of 1.51043 erg s-1. Using their reported value of 7.11023 atoms cm-2, we can estimate an intrinsic 2-10 keV luminosity of 9.91043 erg s-1. Assuming a bolometric correction from 2-10 keV of 10 (e.g., Marconi et al., 2004), this implies that the intrinsic AGN luminosity was a factor of 3-20 times higher 40,000 years ago, when the light that photo-ionized the southern region was emitted. This is similar to the sample of Hanny’s Voorwerp-like objects studied by Keel et al. (2017).
Short term (up to tens of years) AGN variability by factors of 5 has been observed in the hard X-ray luminosity before (e.g., Ulrich et al., 1997, and references therein). Hence, our results imply that the AGN activity in Mrk 463E could have changed by up to an order of magnitude for the last 40,000. This is consistent with so-called “standard” variability and thus consistent with the AGN lifetime of 100,000 years suggested by Schawinski et al. (2015).
5.3 Feeding the SMBHs
The Chandra X-ray data show that the SMBH in the Mrk 463E nucleus is accreting at a 5 higher rate, and is more obscured than the one in Mrk 463W. In turn, most of the larger scale structures detected by the VLT/MUSE observations both in continuum and emission lines, appear to be associated preferentially with the Mrk 463E nucleus. Similarly, both the southern emission line region and the outflowing cloud in the north appear to be well aligned with the apparent biconical gradient, which in turn is also linked to the Mrk 463E AGN. This could be interpreted as the AGN in Mrk 463E being older and more evolved than the one in Mrk 463W, which is then most likely just starting its activity. Additional evidence pointing in that direction was presented on the previous section, where a lifetime greater than 40,000 years was estimated for the Mrk 463E AGN.
Based on the ALMA 12CO(2-1) observations presented on Section 3.3 we see that both nuclei contain significant molecular gas reservoirs, 109M☉ around Mrk 463E and 5108M surrounding Mrk 463W. We further find 3107 M in molecular gas in clouds in between the two nuclei. This amount of material, albeit small, could be readily available to feed both SMBHs in the near future. Indeed, as presented in Section 4.3, we estimate that the gas infalling rate onto the Mrk 463E nucleus is 3 orders of magnitude larger than the SMBH accretion rate inferred from the X-ray luminosity. Hence, we can conclude that both nuclei have the potential fuel to feed quasar-like luminosity systems and increase their SMBH masses significantly, by adding 108 M. However, and as presented in §4.1, the outflow rate of the ionized gas is similar to the infall rate of the molecular gas onto the central regions of the system. Therefore, while the accretion rate onto the SMBHs is relatively small, there appears to be a rough balance between the material infalling (as molecular gas) and outflowing (as ionized gas). This outflowing material does not appear to affect however the star formation processes, as it is highly anisotropic and not aligned with the stellar disks.
5.4 Possible Evolution
Currently the two nuclei in Mrk 463 are both active, perhaps at a relatively low level, heavily obscured at 1023 atoms cm-2 and separated by 4 kpc. As the merger continues, it is expected that the two nuclei will get closer over timescales of 108 years. The molecular gas that is now surrounding each nucleus will likely tend to concentrate such that a fraction of it will likely be available for accretion onto the SMBHs, while at the same time increasing the nuclear obscuration. Depending on the exact and yet unknown dynamics of the nuclei, the system may pass through a stage analogous to that which the nearby dual AGN NGC6240 is experiencing now, in which both nuclei are separated by 1 kpc and are heavily obscured (Komossa et al., 2003), while most of the gas is concentrated in between the two nuclei (Tacconi et al., 1999; Iono et al., 2007, Privon et al. in prep.). Alternatively, the gas could remain concentrated on each nucleus as they approach each other, thus creating a configuration similar to what it is observed now in the central region of Arp 220 (e.g., Manohar & Scoville, 2017, and references therein). While the amount of ongoing SMBH accretion in Arp 220 is still uncertain (e.g., Barcos-Muñoz et al., 2015), Chandra (Iwasawa et al., 2005) and NuSTAR observations (Teng et al., 2015) suggest that there is at least one heavily obscured, Compton thick, AGN associated with the system, on the western nucleus. In any case, following the scenario suggested by Treister et al. (2010), we can expect that after 1-2108 years the collapsed nuclear region will start to become unobscured due to the effects of radiation pressure, thus revealing an unobscured quasar, perhaps similar to the one observed in Mrk 231, with strong ionized winds and ultrafast outflows (Feruglio et al., 2015), as those already observed in this system, associated with the Mrk 463E nucleus.
We note that the case of Mrk 463 highlights the difficulty of using the instantaneous AGN luminosity in placing objects within evolutionary sequences. At least one nucleus show evidence for changing luminosities on timescales of years, which is significantly shorter than those expected for dynamical evolution of the system (e.g., LaMassa et al., 2015; Parker et al., 2016; Gezari et al., 2017). This suggests it is likely problematic to use AGN luminosity even as a broad indicator of evolutionary stage, as at any point one or both nuclei can rapidly rise or drop in luminosity. This further highlights the need for multi-wavelength spatially-resolved spectroscopy over large spatial scales, as presented here, in order to fully understand the evolutionary stage of these complex merging galaxies.
6 Conclusions
We have presented optical and near-IR seeing-limited IFU data for the nearby dual AGN Mrk 463, complemented by relatively high resolution band 6 ALMA data covering both the 12CO(2-1) transition and the surrounding 220 GHz continuum. The multiwavelength spatially-resolved spectroscopy reveal a very complex system in which the gas morphology is highly distorted, both due to the ongoing major merger and the SMBH accretion activity. Optical emission lines such as [Oiii] and H reveal the presence of AGN-ionized emission line regions extending beyond 10 kpc away from the nuclear regions, while the H and Pa emission lines trace star forming regions up to even larger distances. The HeII 4686 line traces the influence of the AGN both in the nuclei and the extended regions. We find in general relatively low optical extinction in this system, 1, although moderate values are found toward specific isolated regions. Kinematically, the [Oiii] and H maps show evidence for a clear biconical outflow in the central region of the Mrk 463E galaxy in which we infer mass outflow rates of 512 /s. We further detected an outflowing region at 600 km s-1, about 15 kpc to the north of the Mrk 463E nucleus. Velocity gradients in these emission lines could also be detected in the tidal tails, most likely associated with the dynamics of the galaxy merger. From an energetics analysis of the southern emission line region, which according to the observed line ratios is consistent with being photo-ionized by the AGN emission, we conclude that the AGN luminosity, and thus SMBH accretion rate, on the Mrk 463E nucleus changed by a factor 3-20 in the last 40,000 years, much like the handful of known Hanny’s Voorwerp-like objects. The structure of the stellar kinematics reveals the presence of a strong velocity gradient to the west of the Mrk 463W nucleus. While this gradient can be fitted by a Keplerian disk, it can also be associated to the tidal plumes originating from the ongoing major merger, thus suggesting that the system is undergoing a second or later close pass of the nuclei. Indeed, the rather smooth optical continuum spatial profile of that region, and the spatial separation of 3-4 kpc between the presumed stellar disk and the Mrk 463W nucleus strongly supports the latter interpretation.
From the ALMA data we can see significant molecular gas reservoirs, 109M☉ in Mrk 463E and 5108M☉ on the western nucleus, surrounding each nuclei, closer than 1 kpc but not directly on the AGN locations. The molecular gas around each nuclei present significant velocity gradients, thus suggesting a ring-like structure. While it is expected that a significant fraction of this molecular gas should be available for the SMBH to accrete, by comparing the molecular gas directly overlapping with the AGN with the accretion rate inferred from the AGN luminosity we conclude that only a very small fraction, 0.01%, of the surrounding material is actively feeding the SMBH. Considering the observed properties of the gas in this system, we conclude that in this system molecular gas is infalling onto the central regions at a rate of 100s M⊙/yr. Of this, a relatively small fraction, 0.0017 M⊙/yr, is accreted onto the SMBH. This small amount of accreted material is able to generate an outflow of ionized gas that pushes 500 M⊙/yr away from the nucleus. Hence, we can consider this major galaxy merger as a machine that receives large amounts of molecular gas and in return expels that material in the form of collimated ionized winds, being fueled by only a very small fraction, 10-5, of that material being accreted by the SMBH.
We can speculate that in the future, as the two nuclei get closer to each other, the surrounding molecular gas will concentrate on the coalescent nucleus increasing both the SMBH accretion and nuclear obscuration. After 100 million years, the radiation pressure should be strong enough to evaporate most of the surrounding material revealing an unobscured high-luminosity AGN, i.e., quasars, characterized by strong winds and outflows as those already observed in nearby galaxies such as Mrk 231. High resolution dynamical modeling of this system would allow us to better predict the future of gas-rich major galaxy mergers.
While these multiwavelength observations have been critical to increase our understanding of the gas in the dual AGN Mrk 463, it is clear that higher resolution data are necessary in order to understand for example the behavior of the gas actively feeding the SMBHs now and its connection to the merger dynamics. It is possible now to obtain these data thanks to the long baseline, 10 km, modes available with ALMA, which would yield spatial resolutions of tens of parsec for the molecular gas observations. Similarly, observations of higher-J CO transitions would allow to measure physical parameters such as temperature and study the denser material, which might be located closer to the SMBHs.
References
- Adams (1977) Adams, T. F. 1977, ApJS, 33, 19
- Alatalo et al. (2015) Alatalo, K., Lacy, M., Lanz, L., et al. 2015, ApJ, 798, 31
- Alloin et al. (1992) Alloin, D., Barvainis, R., Gordon, M. A., & Antonucci, R. R. J. 1992, A&A, 265, 429
- Bacon et al. (2010) Bacon, R., Accardo, M., Adjali, L., et al. 2010, in Proc. SPIE, Vol. 7735, Ground-based and Airborne Instrumentation for Astronomy III, 773508
- Baldwin et al. (1981) Baldwin, J. A., Phillips, M. M., & Terlevich, R. 1981, PASP, 93, 5
- Bär et al. (2016) Bär, R., Weigel, A. K., Sartori, L. F., et al. 2016, ArXiv e-prints, arXiv:1612.04815
- Barcos-Muñoz et al. (2015) Barcos-Muñoz, L., Leroy, A. K., Evans, A. S., et al. 2015, ApJ, 799, 10
- Barnes & Hernquist (1991) Barnes, J. E., & Hernquist, L. E. 1991, ApJ, 370, L65
- Bekki & Shioya (2000) Bekki, K., & Shioya, Y. 2000, A&A, 362, 97
- Benson et al. (2003) Benson, A. J., Bower, R. G., Frenk, C. S., et al. 2003, ApJ, 599, 38
- Bertola et al. (1998) Bertola, F., Cappellari, M., Funes, José G., S. J., et al. 1998, ApJ, 509, L93
- Bianchi et al. (2008) Bianchi, S., Chiaberge, M., Piconcelli, E., Guainazzi, M., & Matt, G. 2008, MNRAS, 386, 105
- Blecha et al. (2013) Blecha, L., Loeb, A., & Narayan, R. 2013, MNRAS, 429, 2594
- Bolatto et al. (2013) Bolatto, A. D., Wolfire, M., & Leroy, A. K. 2013, ARA&A, 51, 207
- Briggs (1995) Briggs, D. S. 1995, in Bulletin of the American Astronomical Society, Vol. 27, American Astronomical Society Meeting Abstracts, 1444
- Brusa et al. (2015) Brusa, M., Bongiorno, A., Cresci, G., et al. 2015, MNRAS, 446, 2394
- Caplan & Deharveng (1986) Caplan, J., & Deharveng, L. 1986, A&A, 155, 297
- Cappellari (2017) Cappellari, M. 2017, MNRAS, 466, 798
- Cappellari & Copin (2003) Cappellari, M., & Copin, Y. 2003, MNRAS, 342, 345
- Cappellari & Emsellem (2004) Cappellari, M., & Emsellem, E. 2004, PASP, 116, 138
- Chatzichristou & Vanderriest (1995) Chatzichristou, E. T., & Vanderriest, C. 1995, A&A, 298, 343
- Croton et al. (2006) Croton, D. J., Springel, V., White, S. D. M., et al. 2006, MNRAS, 365, 11
- Di Matteo et al. (2008) Di Matteo, T., Colberg, J., Springel, V., Hernquist, L., & Sijacki, D. 2008, ApJ, 676, 33
- Di Matteo et al. (2005) Di Matteo, T., Springel, V., & Hernquist, L. 2005, Nature, 433, 604
- Eisenhauer et al. (2003) Eisenhauer, F., Abuter, R., Bickert, K., et al. 2003, in Proc. SPIE, Vol. 4841, Instrument Design and Performance for Optical/Infrared Ground-based Telescopes, ed. M. Iye & A. F. M. Moorwood, 1548–1561
- Elvis et al. (1994) Elvis, M., Wilkes, B. J., McDowell, J. C., et al. 1994, ApJS, 95, 1
- Evans et al. (2002) Evans, A. S., Mazzarella, J. M., Surace, J. A., & Sanders, D. B. 2002, ApJ, 580, 749
- Falco et al. (1999) Falco, E. E., Kurtz, M. J., Geller, M. J., et al. 1999, PASP, 111, 438
- Falcón-Barroso et al. (2011) Falcón-Barroso, J., Sánchez-Blázquez, P., Vazdekis, A., et al. 2011, A&A, 532, A95
- Farrah et al. (2007) Farrah, D., Bernard-Salas, J., Spoon, H. W. W., et al. 2007, ApJ, 667, 149
- Ferland et al. (2013) Ferland, G. J., Porter, R. L., van Hoof, P. A. M., et al. 2013, Rev. Mexicana Astron. Astrofis., 49, 137
- Feruglio et al. (2015) Feruglio, C., Fiore, F., Carniani, S., et al. 2015, A&A, 583, A99
- Freudling et al. (2013) Freudling, W., Romaniello, M., Bramich, D. M., et al. 2013, A&A, 559, A96
- Fu et al. (2011a) Fu, H., Myers, A. D., Djorgovski, S. G., & Yan, L. 2011a, ApJ, 733, 103
- Fu et al. (2011b) Fu, H., Zhang, Z.-Y., Assef, R. J., et al. 2011b, ApJ, 740, L44
- García-Burillo et al. (2014) García-Burillo, S., Combes, F., Usero, A., et al. 2014, A&A, 567, A125
- Gezari et al. (2017) Gezari, S., Hung, T., Cenko, S. B., et al. 2017, ApJ, 835, 144
- Ginsburg & Mirocha (2011) Ginsburg, A., & Mirocha, J. 2011, PySpecKit: Python Spectroscopic Toolkit, Astrophysics Source Code Library, , , ascl:1109.001
- González-López et al. (2017) González-López, J., Bauer, F. E., Romero-Cañizales, C., et al. 2017, A&A, 597, A41
- Hibbard & van Gorkom (1996) Hibbard, J. E., & van Gorkom, J. H. 1996, AJ, 111, 655
- Hinshaw et al. (2009) Hinshaw, G., et al. 2009, ApJS, 180, 225
- Hopkins et al. (2006) Hopkins, P. F., Hernquist, L., Cox, T. J., et al. 2006, ApJS, 163, 1
- Hopkins et al. (2005) Hopkins, P. F., Hernquist, L., Martini, P., et al. 2005, ApJ, 625, L71
- Hutchings & Neff (1989) Hutchings, J. B., & Neff, S. G. 1989, AJ, 97, 1306
- Iono et al. (2007) Iono, D., Wilson, C. D., Takakuwa, S., et al. 2007, ApJ, 659, 283
- Iwasawa et al. (2005) Iwasawa, K., Sanders, D. B., Evans, A. S., et al. 2005, MNRAS, 357, 565
- Kauffmann & Charlot (1998) Kauffmann, G., & Charlot, S. 1998, MNRAS, 297, L23+
- Kauffmann et al. (2003) Kauffmann, G., Heckman, T. M., Tremonti, C., et al. 2003, MNRAS, 346, 1055
- Keel et al. (2012a) Keel, W. C., Chojnowski, S. D., Bennert, V. N., et al. 2012a, MNRAS, 420, 878
- Keel et al. (2012b) Keel, W. C., Lintott, C. J., Schawinski, K., et al. 2012b, AJ, 144, 66
- Keel et al. (2017) Keel, W. C., Lintott, C. J., Maksym, W. P., et al. 2017, ApJ, 835, 256
- Kewley et al. (2001) Kewley, L. J., Dopita, M. A., Sutherland, R. S., Heisler, C. A., & Trevena, J. 2001, ApJ, 556, 121
- Kewley et al. (2006) Kewley, L. J., Groves, B., Kauffmann, G., & Heckman, T. 2006, MNRAS, 372, 961
- Komossa et al. (2003) Komossa, S., Burwitz, V., Hasinger, G., et al. 2003, ApJ, 582, L15
- Koss et al. (2012) Koss, M., Mushotzky, R., Treister, E., et al. 2012, ApJ, 746, L22
- Koss et al. (2011) —. 2011, ApJ, 735, L42
- Kraemer et al. (2009) Kraemer, S. B., Trippe, M. L., Crenshaw, D. M., et al. 2009, ApJ, 698, 106
- LaMassa et al. (2015) LaMassa, S. M., Cales, S., Moran, E. C., et al. 2015, ApJ, 800, 144
- Lee et al. (2009) Lee, J. C., Gil de Paz, A., Tremonti, C., et al. 2009, ApJ, 706, 599
- Lintott et al. (2008) Lintott, C. J., Schawinski, K., Slosar, A., et al. 2008, MNRAS, 389, 1179
- Lintott et al. (2009) Lintott, C. J., et al. 2009, MNRAS, 399, 129
- Liu et al. (2011) Liu, X., Shen, Y., Strauss, M. A., & Hao, L. 2011, ApJ, 737, 101
- Maíz-Apellániz et al. (2004) Maíz-Apellániz, J., Pérez, E., & Mas-Hesse, J. M. 2004, AJ, 128, 1196
- Manohar & Scoville (2017) Manohar, S., & Scoville, N. 2017, ApJ, 835, 127
- Marconi et al. (2004) Marconi, A., Risaliti, G., Gilli, R., et al. 2004, MNRAS, 351, 169
- Mazzarella et al. (1991) Mazzarella, J. M., Soifer, B. T., Graham, J. R., et al. 1991, AJ, 102, 1241
- Mazzarella et al. (2012) Mazzarella, J. M., Iwasawa, K., Vavilkin, T., et al. 2012, AJ, 144, 125
- McGurk et al. (2015) McGurk, R. C., Max, C. E., Medling, A. M., Shields, G. A., & Comerford, J. M. 2015, ApJ, 811, 14
- Mihos & Hernquist (1996) Mihos, J. C., & Hernquist, L. 1996, ApJ, 464, 641
- Modigliani et al. (2007) Modigliani, A., Hummel, W., Abuter, R., et al. 2007, ArXiv Astrophysics e-prints, astro-ph/0701297
- Müller-Sánchez et al. (2016) Müller-Sánchez, F., Comerford, J., Stern, D., & Harrison, F. A. 2016, ApJ, 830, 50
- Müller Sánchez et al. (2009) Müller Sánchez, F., Davies, R. I., Genzel, R., et al. 2009, ApJ, 691, 749
- Müller-Sánchez et al. (2011) Müller-Sánchez, F., Prieto, M. A., Hicks, E. K. S., et al. 2011, ApJ, 739, 69
- Nevin et al. (2018) Nevin, R., Comerford, J. M., Müller-Sánchez, F., Barrows, R., & Cooper, M. C. 2018, MNRAS, 473, 2160
- Oliva (1997) Oliva, E. 1997, in Astronomical Society of the Pacific Conference Series, Vol. 113, IAU Colloq. 159: Emission Lines in Active Galaxies: New Methods and Techniques, ed. B. M. Peterson, F.-Z. Cheng, & A. S. Wilson, 288
- Osterbrock & Ferland (2006) Osterbrock, D. E., & Ferland, G. J. 2006, Astrophysics of gaseous nebulae and active galactic nuclei
- Parker et al. (2016) Parker, M. L., Komossa, S., Kollatschny, W., et al. 2016, MNRAS, 461, 1927
- Petrosian et al. (1978) Petrosian, A. R., Saakian, K. A., & Khachikian, E. E. 1978, Astrofizika, 14, 69
- Ricci et al. (2017) Ricci, C., Bauer, F. E., Treister, E., et al. 2017, MNRAS, 468, 1273
- Rich et al. (2011) Rich, J. A., Kewley, L. J., & Dopita, M. A. 2011, ApJ, 734, 87
- Rich et al. (2015) —. 2015, ApJS, 221, 28
- Rieke et al. (2008) Rieke, G. H., Blaylock, M., Decin, L., et al. 2008, AJ, 135, 2245
- Rupke & Veilleux (2011) Rupke, D. S. N., & Veilleux, S. 2011, ApJ, 729, L27
- Sanders & Mirabel (1996) Sanders, D. B., & Mirabel, I. F. 1996, ARA&A, 34, 749
- Sanders et al. (1988) Sanders, D. B., Soifer, B. T., Elias, J. H., et al. 1988, ApJ, 325, 74
- Sartori et al. (2015) Sartori, L. F., Schawinski, K., Treister, E., et al. 2015, MNRAS, 454, 3722
- Sartori et al. (2016) Sartori, L. F., Schawinski, K., Koss, M., et al. 2016, MNRAS, 457, 3629
- Schawinski et al. (2015) Schawinski, K., Koss, M., Berney, S., & Sartori, L. F. 2015, MNRAS, 451, 2517
- Schawinski et al. (2007) Schawinski, K., Thomas, D., Sarzi, M., et al. 2007, MNRAS, 382, 1415
- Schawinski et al. (2006) Schawinski, K., et al. 2006, Nature, 442, 888
- Schawinski et al. (2010) Schawinski, K., Evans, D. A., Virani, S., et al. 2010, ApJ, 724, L30
- Scoville et al. (2017) Scoville, N., Murchikova, L., Walter, F., et al. 2017, ApJ, 836, 66
- Shen et al. (2011) Shen, Y., Liu, X., Greene, J. E., & Strauss, M. A. 2011, ApJ, 735, 48
- Shirazi & Brinchmann (2012) Shirazi, M., & Brinchmann, J. 2012, MNRAS, 421, 1043
- Soifer et al. (1984) Soifer, B. T., Rowan-Robinson, M., Houck, J. R., et al. 1984, ApJ, 278, L71
- Solomon & Vanden Bout (2005) Solomon, P. M., & Vanden Bout, P. A. 2005, ARA&A, 43, 677
- Springel et al. (2005) Springel, V., Di Matteo, T., & Hernquist, L. 2005, MNRAS, 361, 776
- Storchi-Bergmann et al. (2010) Storchi-Bergmann, T., Lopes, R. D. S., McGregor, P. J., et al. 2010, MNRAS, 402, 819
- Tacconi et al. (1999) Tacconi, L. J., Genzel, R., Tecza, M., et al. 1999, ApJ, 524, 732
- Teng et al. (2015) Teng, S. H., Rigby, J. R., Stern, D., et al. 2015, ApJ, 814, 56
- Treister et al. (2010) Treister, E., Natarajan, P., Sanders, D. B., et al. 2010, Science, 328, 600
- Treister et al. (2012) Treister, E., Schawinski, K., Urry, C. M., & Simmons, B. D. 2012, ApJ, 758, L39
- Trentham et al. (1999) Trentham, N., Kormendy, J., & Sanders, D. B. 1999, AJ, 117, 2152
- Ulrich et al. (1997) Ulrich, M.-H., Maraschi, L., & Urry, C. M. 1997, ARA&A, 35, 445
- Van Wassenhove et al. (2012) Van Wassenhove, S., Volonteri, M., Mayer, L., et al. 2012, ApJ, 748, L7
- Veilleux et al. (2005) Veilleux, S., Cecil, G., & Bland-Hawthorn, J. 2005, ARA&A, 43, 769
- Veilleux & Osterbrock (1987) Veilleux, S., & Osterbrock, D. E. 1987, ApJS, 63, 295
- Veilleux et al. (2013) Veilleux, S., Meléndez, M., Sturm, E., et al. 2013, ApJ, 776, 27
- Volonteri et al. (2003) Volonteri, M., Haardt, F., & Madau, P. 2003, ApJ, 582, 559
- Weilbacher et al. (2014) Weilbacher, P. M., Streicher, O., Urrutia, T., et al. 2014, in Astronomical Society of the Pacific Conference Series, Vol. 485, Astronomical Data Analysis Software and Systems XXIII, ed. N. Manset & P. Forshay, 451