Robust Foregrounds Removal
for 21-cm Experiments
Abstract
Direct detection of the Epoch of Reionization via the redshifted 21-cm line will have unprecedented implications on the study of structure formation in the early Universe. To fulfill this promise current and future 21-cm experiments will need to detect the weak 21-cm signal over foregrounds several order of magnitude greater. This requires accurate modeling of the galactic and extragalactic emission and of its contaminants due to instrument chromaticity, ionosphere and imperfect calibration. To solve for this complex modeling, we propose a new method based on Gaussian Process Regression (GPR) which is able to cleanly separate the cosmological signal from most of the foregrounds contaminants. We also propose a new imaging method based on a maximum likelihood framework which solves for the interferometric equation directly on the sphere. Using this method, chromatic effects causing the so-called “wedge” are effectively eliminated (i.e. deconvolved) in the cylindrical () power spectrum.
keywords:
methods:data analysis, statistical; techniques:interferometric; cosmology: observations, early universe, large-scale structure of universe1 Introduction
Observations of the redshifted 21-cm signal from neutral hydrogen is a unique probe of the early universe and can open the entire redshift window for astrophysical and cosmological studies, allowing us to directly study the astrophysical processes occurring during the Epoch of Reionization (EoR) and the Cosmic Dawn (CD). This exciting goal is challenged by the difficulty of extracting the feeble 21-cm signal buried under astrophysical foregrounds orders of magnitude brighter and contaminated by numerous instrumental systematics.
Several experiments are currently underway aiming at statistically detecting the 21-cm signal from the Epoch of Reionization (e.g. LOFAR, MWA, PAPER), already achieving increasingly attractive upper limits on the 21-cm signal power spectra (Patil et al., 2017; Beardsley et al., 2016; Ali et al., 2015), and paving the way for the second generation experiments such as the SKA and HERA which will be capable of robust power spectra characterization and for the first time directly image the large scale neutral hydrogen structures from EoR and CD.
To fully exploit the sensitivity of these experiments, accurate removal of the foregrounds is required. The radiation from our own Galaxy and other extra-galactic sources are well-known to vary smoothly in frequency, and this characteristic can be used to model and remove them (Jelić et al., 2008; Chapman et al., 2013). However, the interaction of the spectrally smooth foregrounds with the Earth’s ionosphere and the observing instrument create additional “mode-mixing” foregrounds contaminants, which can mimic the 21-cm signal. Those are mainly due to the rapid phase and sometime amplitude modifications of radio waves caused by small-scale structures in the ionosphere (e.g. Koopmans, 2010), the inherent chromatic response of the instrument which creates chromatic side-lobe noise (e.g. Vedantham et al., 2012; Thyagarajan et al., 2015; Gehlot et al., 2017), calibration errors and mis-subtraction of sources due to imperfect sky modeling which also introduce frequency structure to the otherwise smooth foregrounds (e.g. Patil et al., 2016; Ewall-Wice et al., 2017). Mitigating those sources of chromatic noise has proven to be extremely difficult. The accuracy of the sky model used for calibration is limited by the instrument confusion noise level and the precision of the beam response model of our radio receivers. Unavoidably the observed signal will be contaminated by mode-mixing.
To reduce the impact of this potential ‘show-stopper’, we have developed a Maximum-Likelihood Power Spectra estimator using the spherical-wave visibility equation (SpH ML) and a foreground removal method based on Gaussian Process Regression (GPR).
2 Spherical Harmonics Maximum-Likelihood Inversion
The SpH ML is a new method to produce Point-Spread-Function (PSF) deconvolved images of the sky from radio-interferometric observations. It solves for the interferometric equation using Maximum-Likelihood inversion of the spherical-wave visibility equation, formulated in a full sky setting and including the primary beam and its side-lobes (Carozzi, 2015; Ghosh et al., 2018):
| (1) |
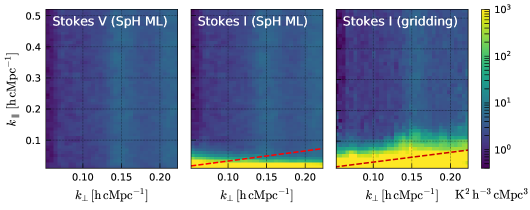
The method is tested using simulated LOFAR-HBA full-sky observations which include diffuse astrophysical foregrounds (Jelić et al., 2008), 21-cm signal simulated using 21cmFast (Mesinger et al., 2011) and noise level corresponding to 100 nights of 12 hr LOFAR integration time. From the simulated Stokes-I and Stokes-V visibilities, we infer the recovered spherical harmonics using the SpH ML algorithm and compute the angular power spectra. Figure 1 presents the cylindrically averaged power spectra. We find the smooth diffuse foreground in the Stokes I power spectrum mostly dominates at low , where most of the foreground power is bound within . The power drops by two to three orders of magnitudes in high regions, where the 21-cm signal plus noise signal is expected to dominate. In the power spectra obtained from the same simulated visibilities but using the more traditional method of gridding the visibilities in uv-space, a wedge like structure is clearly visible (central panel of Figure 1), and is well known to be due to the frequency dependence of the PSF (Vedantham et al., 2012; Hazelton et al., 2013). This demonstrate that by doing a ML fit to non-gridded visibility data sets at each frequency, we effectively obtain a PSF-deconvolved estimates of the sky spherical harmonics coefficients.
3 Statistical 21-cm Signal Separation
The source of mode-mixing contaminants are manifold, and we also need to account for the remaining contaminants related to calibration error and sky-model incompleteness. Ad-hoc modeling is not an option for most of them, and the problem boils down to statistically separating this contaminants from the 21-cm signal.
With this aim, we developed a foreground removal method using the technique of Gaussian Process Regression (GPR) (Mertens et al., 2017). In this framework, the different components of the observations, including the astrophysical foregrounds, mode-mixing contaminants, and the 21-cm signal, are modeled with Gaussian Process (GP). Formally, a GP is the joint distribution of a collection of normally distributed random variables (Rasmussen & Williams, 2005). The covariance matrix of this distribution is specified by a covariance function, which defines the covariance between pairs of observations (e.g. at different frequencies). The covariance function determines the structure that the GP will be able to model, for example its smoothness. In GPR, we use GP as parameterized priors, and the Bayesian likelihood of the model is estimated by conditioning this prior to the observations. Standard optimization or MCMC methods can be used to determine the parameters of the covariance functions.
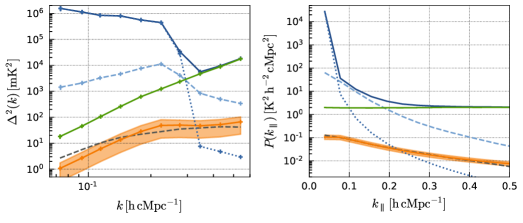
This formulation ensures a relatively unbiased separation of their contribution and accurate uncertainty estimation, even in very low signal to noise observations. When applied to simulation datasets, equivalent to LOFAR-HBA 1200 hours of observations and based on its current assessment of noise and systematic errors, we found that the method is capable of recovering well the 21-cm signal power spectrum (see Fig. 2).
4 Discussions and Future Perspective
In this paper we have introduced two new methods that aim at mitigating the foregrounds contaminants including the mode-mixing.
We have shown that using an ML spherical harmonic power spectra estimator, it is possible to deconvolve the chromatic “wedge” (caused by frequency-dependent side-lobes) in the () power spectrum space.
We also introduced a novel signal separation method which uses Gaussian Process Regression (GPR) to model the various mixed components of the observed signal, including the spectrally smooth sky, mode-mixing, and a 21-cm signal model.
The fundamental improvement of GPR resides in its complete statistical description of all components contributing to the observed signal. In the current implementation of GPR, we use generic covariance models for the 21-cm signal and mode-mixing components. While this treatment may be sufficient for a detection of the 21-cm signal and its characterization with LOFAR, an improved model may be build for future experiments with e.g. the more sensitive SKA. The mode-mixing model for example can be improved by integrating the dependency of the foreground wedge and folding into the model the analytic work describing the effect on the signal of the instrumental chromaticity, calibration errors and sky-model incompleteness. Exploiting the isotropic nature of the 21-cm signal and its evolution at different redshift-bins will also ensure a more sensitive and accurate modeling.
References
- Ali et al. (2015) Ali Z. S., et al., 2015, ApJ, 809, 61
- Beardsley et al. (2016) Beardsley A. P., et al., 2016, ApJ, 833, 102
- Carozzi (2015) Carozzi T. D., 2015, MNRAS, 451, L6
- Chapman et al. (2013) Chapman E., et al., 2013, MNRAS, 429, 165
- Ewall-Wice et al. (2017) Ewall-Wice A., Dillon J. S., Liu A., Hewitt J., 2017, MNRAS, 470, 1849
- Gehlot et al. (2017) Gehlot B. K., et al., 2017, preprint, (arXiv:1709.07727)
- Ghosh et al. (2018) Ghosh A., Mertens F. G., Koopmans L. V. E., 2018, MNRAS, 474, 4552
- Hazelton et al. (2013) Hazelton B. J., Morales M. F., Sullivan I. S., 2013, ApJ, 770, 156
- Jelić et al. (2008) Jelić V., et al., 2008, MNRAS, 389, 1319
- Koopmans (2010) Koopmans L. V. E., 2010, ApJ, 718, 963
- Mertens et al. (2017) Mertens F. G., Ghosh A., Koopmans L. V. E., 2017, preprint, (arXiv:1711.10834)
- Mesinger et al. (2011) Mesinger A., Furlanetto S., Cen R., 2011, MNRAS, 411, 955
- Patil et al. (2016) Patil A. H., et al., 2016, MNRAS, 463, 4317
- Patil et al. (2017) Patil A. H., et al., 2017, ApJ, 838, 65
- Rasmussen & Williams (2005) Rasmussen C. E., Williams C. K. I., 2005, Gaussian Processes for Machine Learning (Adaptive Computation and Machine Learning). The MIT Press
- Thyagarajan et al. (2015) Thyagarajan N., et al., 2015, ApJ, 804, 14
- Vedantham et al. (2012) Vedantham H., Udaya Shankar N., Subrahmanyan R., 2012, ApJ, 752, 137