Wave-packet numerical investigation of thermal diffuse scattering:
A time-dependent quantum approach to the Debye method
Abstract
The effects of thermal diffuse scattering on the transmission and eventual diffraction of highly accelerated electrons are investigated with a method that incorporates the frozen phonon approximation to the exact numerical solution of the time-dependent Schrödinger equation. Unlike other methods in the related literature, in this approach the attenuation of diffraction features arises in a natural way by averaging over a number of wave-packet realizations, thus avoiding any additional experimentally obtained Debye-Waller factors or artificial modulations. Without loss of generality, the method has been applied to analyze the transmission of an electron beam through a thin Al film in two dimensions, making use of Einstein’s model to determine the phonon configuration for each realization at a given temperature. It is shown that, as temperature and hence atomic vibration amplitudes increase, incoherence among different electron wave-function realizations gradually increases, blurring the well-defined diffraction features characterizing the zero-temperature intensity.
Experiments are often performed at room temperature causing temperature driven atomic vibrations or thermal diffuse scattering (TDS) to importantly affect the acquired data. Consequently, any methodology aimed at analyzing such data has to be devised in such a way that it can properly reproduce the effects of thermal vibrations. Currently, two major techniques are used in this regard, namely the Debye method and the frozen phonon model, both of which are applied to studies ranging from determining mechanical properties to electron imaging Sasaki et al. (2016); Winkelmann et al. (2007); Wang (1995). In the case of the frozen phonon model, current approaches are based on performing wave function propagations by invoking the paraxial approximation, which constrains the simulations to applications in the high-energy regime Kirkland (2010). However, for applications within the low-energy regime, such an assumption is no longer valid and simulations require the use of time-dependent approaches. As of now, computations of phonon excitation including TDS for time-dependent wave packet propagation have not been thoroughly investigated.
In this Letter we tackle the issue by exactly solving the electron time-dependent Schrödinger equation, avoiding the many-body problem associated with atomistic motions by appealing to the frozen phonon model. It is shown that attenuation of diffraction peaks naturally arises without the use of smoothing functions and experimentally obtained Debye-Waller factors. The Debye method adjusts the averaged material potential of a crystal using a combination of the Debye-Waller factor Peng (1999); Gilat and Nicklow (1966) and another portion to account for the TDS Nicklow and Young (1966),
| (1) |
where is the Debye-Waller factor and is the intensity of a stationary, non-vibrating lattice. The Debye-Waller factor itself is empirically determined from experimental data obtained by X-ray or neutron diffraction McDonald (1967); Pryor and Sabine (1964); Chipman (1960). The TDS portion of Eq. 1 is often modeled by the use of complex potentials which act as absorbers Peng et al. (1996). While the Debye method can be used to obtain diffraction peaks affected by TDS, multiple scattering cannot be reproduced using absorbing potentials because once a portion of the wave function is absorbed, it is removed from the total probability density. This also makes it impossible to ensure measured quantities, such as the energy of the system are conserved Muller et al. (2001).
| (Å) | 0.0265 | 0.0529 | 0.0794 | 0.106 | 0.132 | 0.159 | 0.185 | 0.212 | 0.238 | 0.265 |
|---|---|---|---|---|---|---|---|---|---|---|
| (K) | 6.7 | 26.7 | 60.2 | 107.3 | 166.4 | 241.4 | 327.4 | 429.19 | 541.2 | 670.6 |
To properly describe the atomic vibrations and hence TDS, Einstein’s model is incorporated in the frozen phonon approach, often used in calculations such as diffraction image simulations Allen et al. (2015). The method assumes that each electron “feels” a single frozen atomic configuration. Treating phonon excitations as both independent Loane et al. (1991) and correlated Jesson and Pennycook (1995); Muller et al. (2001) harmonic oscillators has been thoroughly explored, showing that Einstein’s model is sufficient to obtain general information about diffraction patterns, while correlated phonon excitations are necessary to distinguish small characteristics of complex patterns in numerical simulations Muller et al. (2001). Typically, a phonon configuration is first chosen at random, with the atomic displacements from equilibrium following a Gaussian distribution. Then, the electron wave function is propagated in time to obtain the exit wave function and diffraction pattern Kirkland (2010); Loane et al. (1992), which constitutes a single, non-dissipative realization. After performing a large number of such simulations with different random phonon configurations at the same energy, Monte Carlo integration of the detected wave function provides a simulated diffraction pattern including TDS effects Allen et al. (2015); Kirkland (2010); Loane et al. (1991); Muller et al. (2001); Findlay et al. (2005). The nature of this method makes simulating plural scattering possible and permits quantification of observables.
More specifically, thermal vibrations have been incorporated by displacing each atom about its mean position following a Gaussian probability distribution. The probability of the th atom being in position is given by
| (2) |
where is the mean position of the th atom and the root mean squared vibration amplitude. The vibration amplitude is related to the Debye-Waller factor by
| (3) |
and can be related to the temperature of the material by the following expression Peng et al. (1996); Cartz (1955),
| (4) |
where is the stationary lattice parameter and is the melting temperature. Once the atom positions are determined, the average potential of the material is calculated using the parametrization of scattering factors given by Peng Peng (1999). In our case, the potential simulates a thin Al(100) film in two dimensions (2D).
Once the potential model is set, the numerical simulation of the electron transmission has been carried out according to the method described in earlier work for fully coherent scattering Rudinsky et al. (2017). The vibration amplitudes investigated and the corresponding material temperatures are displayed in Table 1. The initial state of each electron has been modeled as a Gaussian wave packet with spread and . The initial wave function is positioned above the thin film and propagation is performed in the -direction normal to the material surface. This configuration has been chosen to closely represent an electron probe. The electron probe of an electron microscope is generated by eliminating frequencies from a plane wave which are outside a specified range. As a result, the incident wave function is a Gaussian wave packet at the sample plane. The kinetic energy of the initial wave function in all cases is 1 keV, so the wave packet moves towards the film with a speed of m/s. Since the thickness of the film chosen to be in our calculations is 80 Å it takes the electrons about 4.26 fs to pass through this material. This time is much faster than the typical vibration period, which is of the order of picosecond (the phonon frequencies are within the range – Hz Kirkland (2010), thus validating the frozen phonon model here considered.
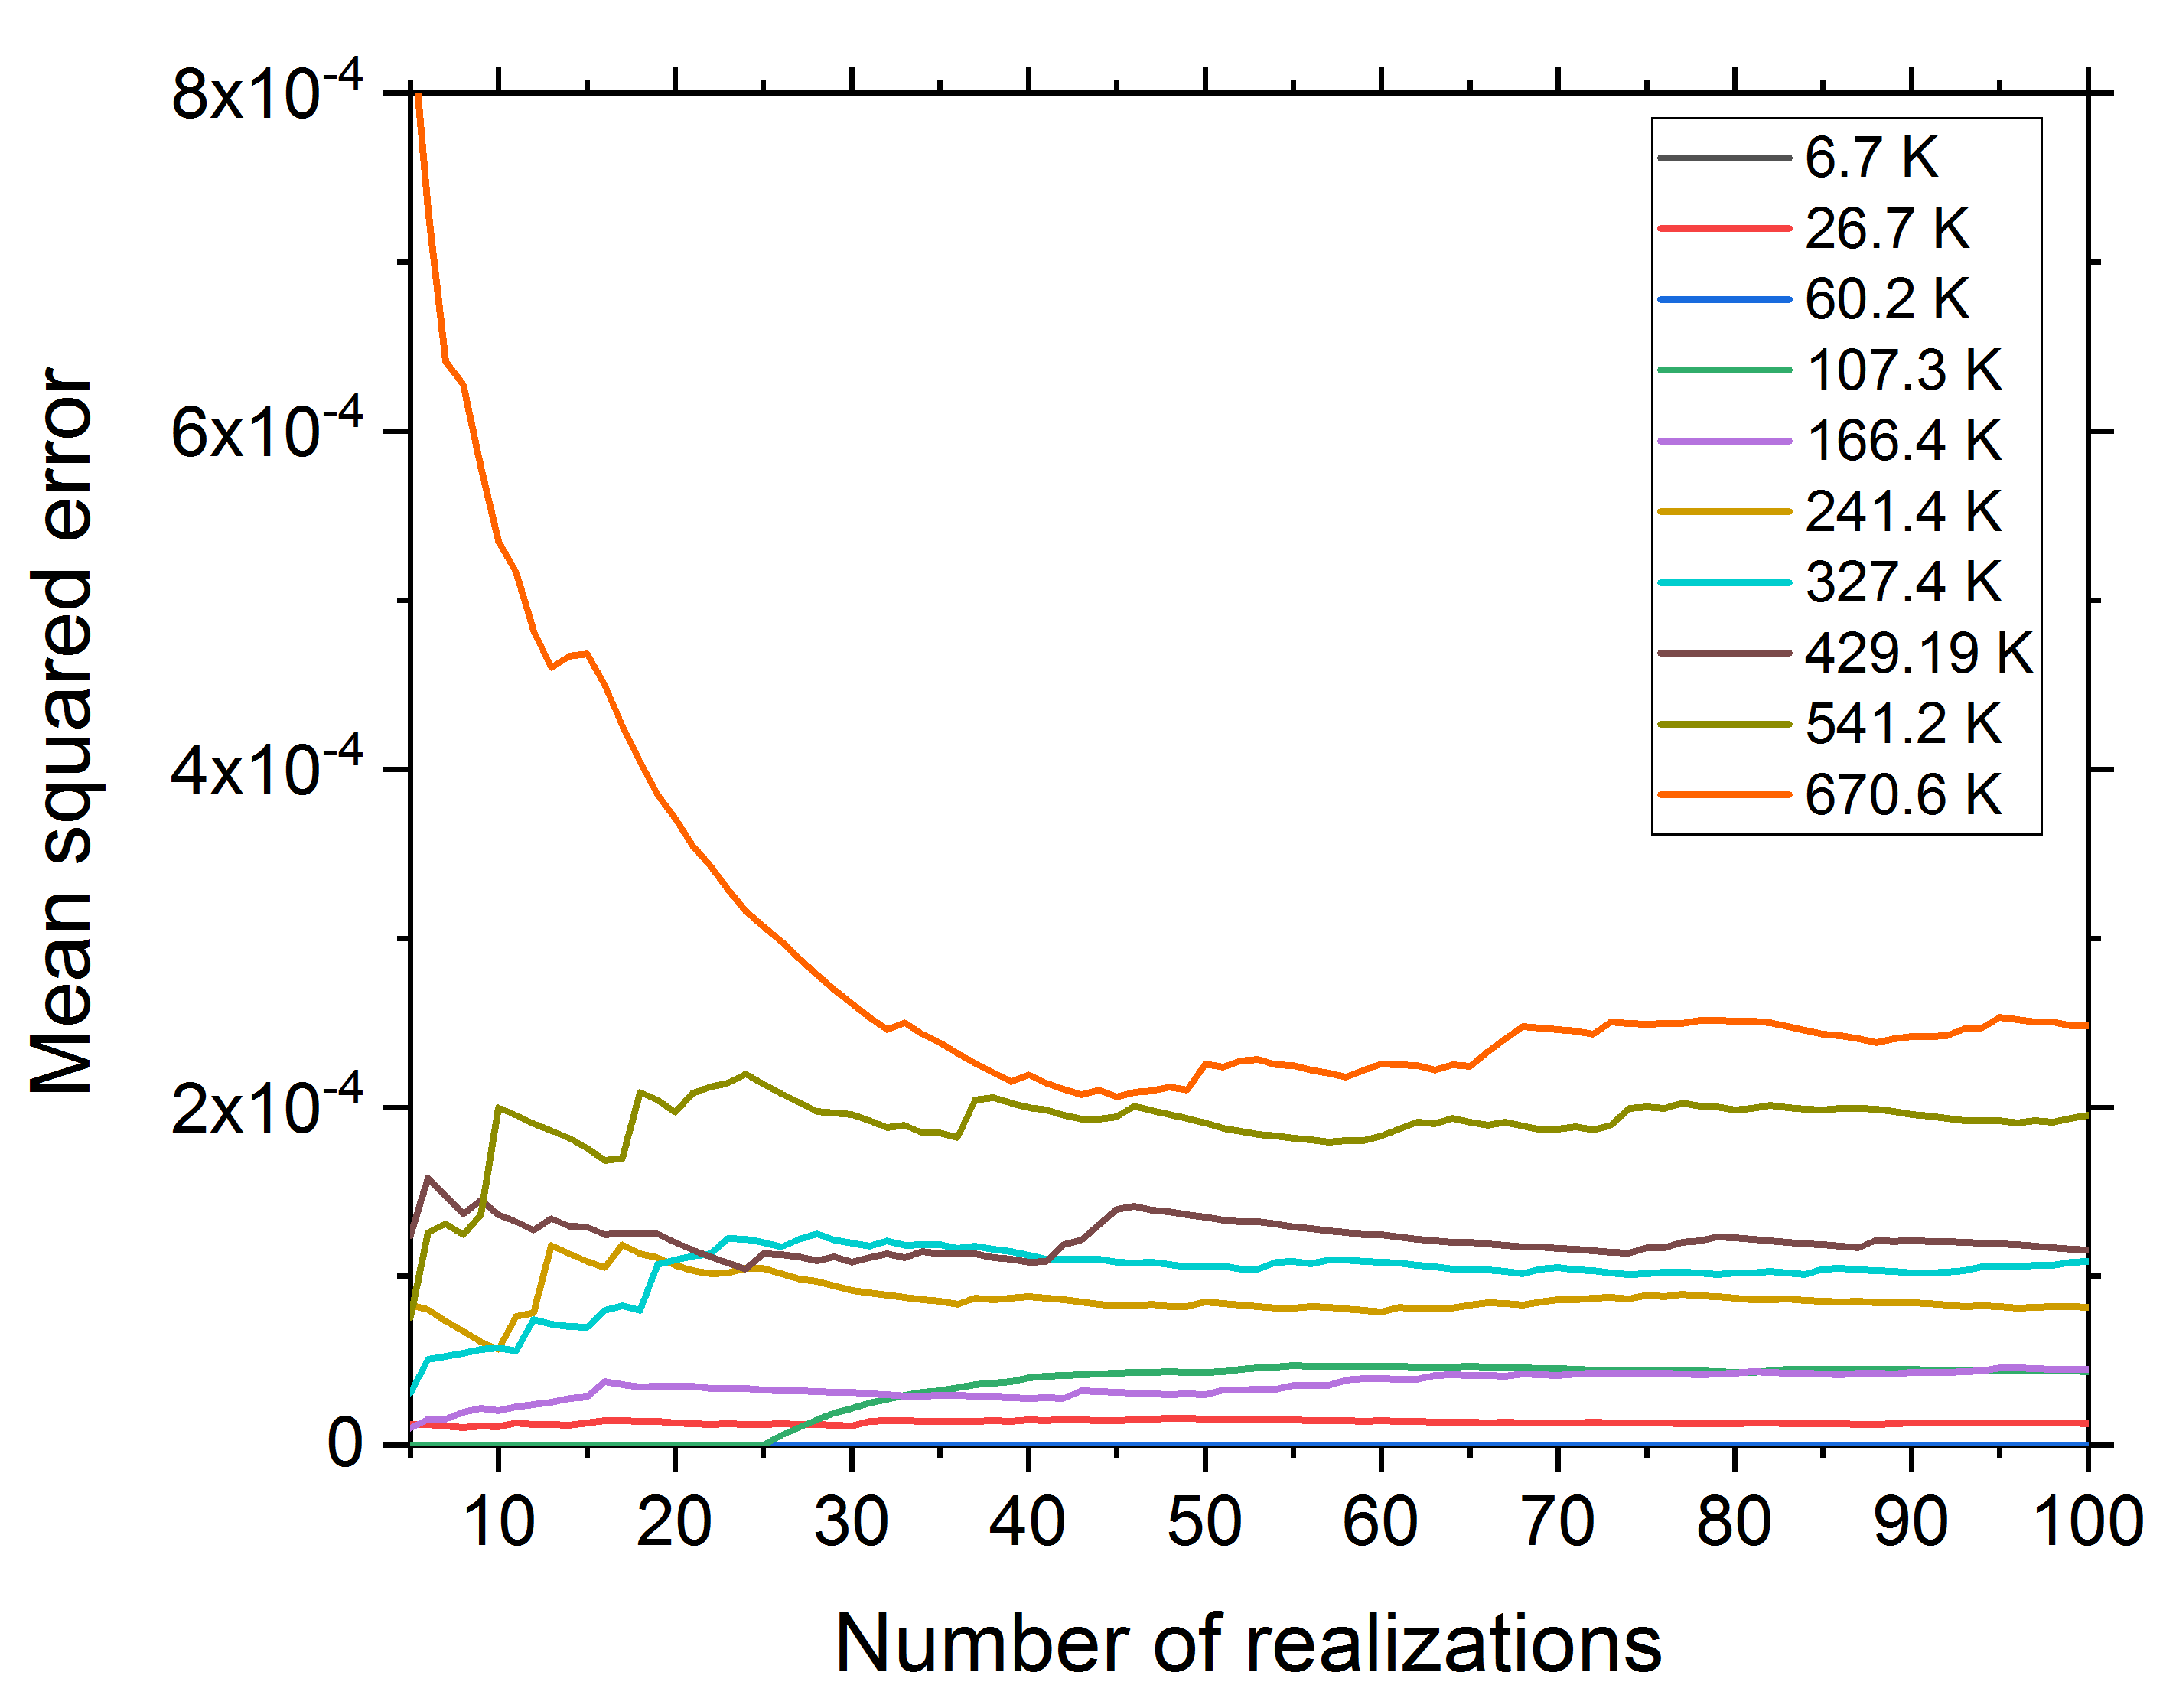
Wave packet propagation has been performed by solving the time-dependent Schrödinger equation numerically using the split-operator method Feit et al. (1982); Leforestier et al. (1991). For each temperature, 100 realizations have been performed, each with a different random atomic configuration obtained by following the above mentioned method. Each realization is finalized once the wave packet has crossed the material and the interaction potential affecting it is negligible. To ensure that there are no unphysical reflections at the boundaries of the numerical grid, an absorbing function has been considered, which removes possible outgoing flow without affecting the correct evolution of the wave-packet in the region of interest Kosloff and Kosloff (1986). Intensity distributions as a function of the parallel momentum transfer and diffraction patterns in momentum space have then been calculated by averaging the values at each grid point over all the realizations performed. In order to ensure convergence of the method, the mean squared error per grid point of the diffraction pattern,
| (5) |
has been calculated at each temperature for a number of realizations () ranging between 5 and 100. In Eq. (5), is the value at the grid point in the diffraction pattern of the th realization and is the value at the corresponding point in the average diffraction pattern. An average of the MSE has then been taken over all the grid points to obtain a single value. The results for each vibration amplitude shown in Table 1 are shown in Fig. 1.
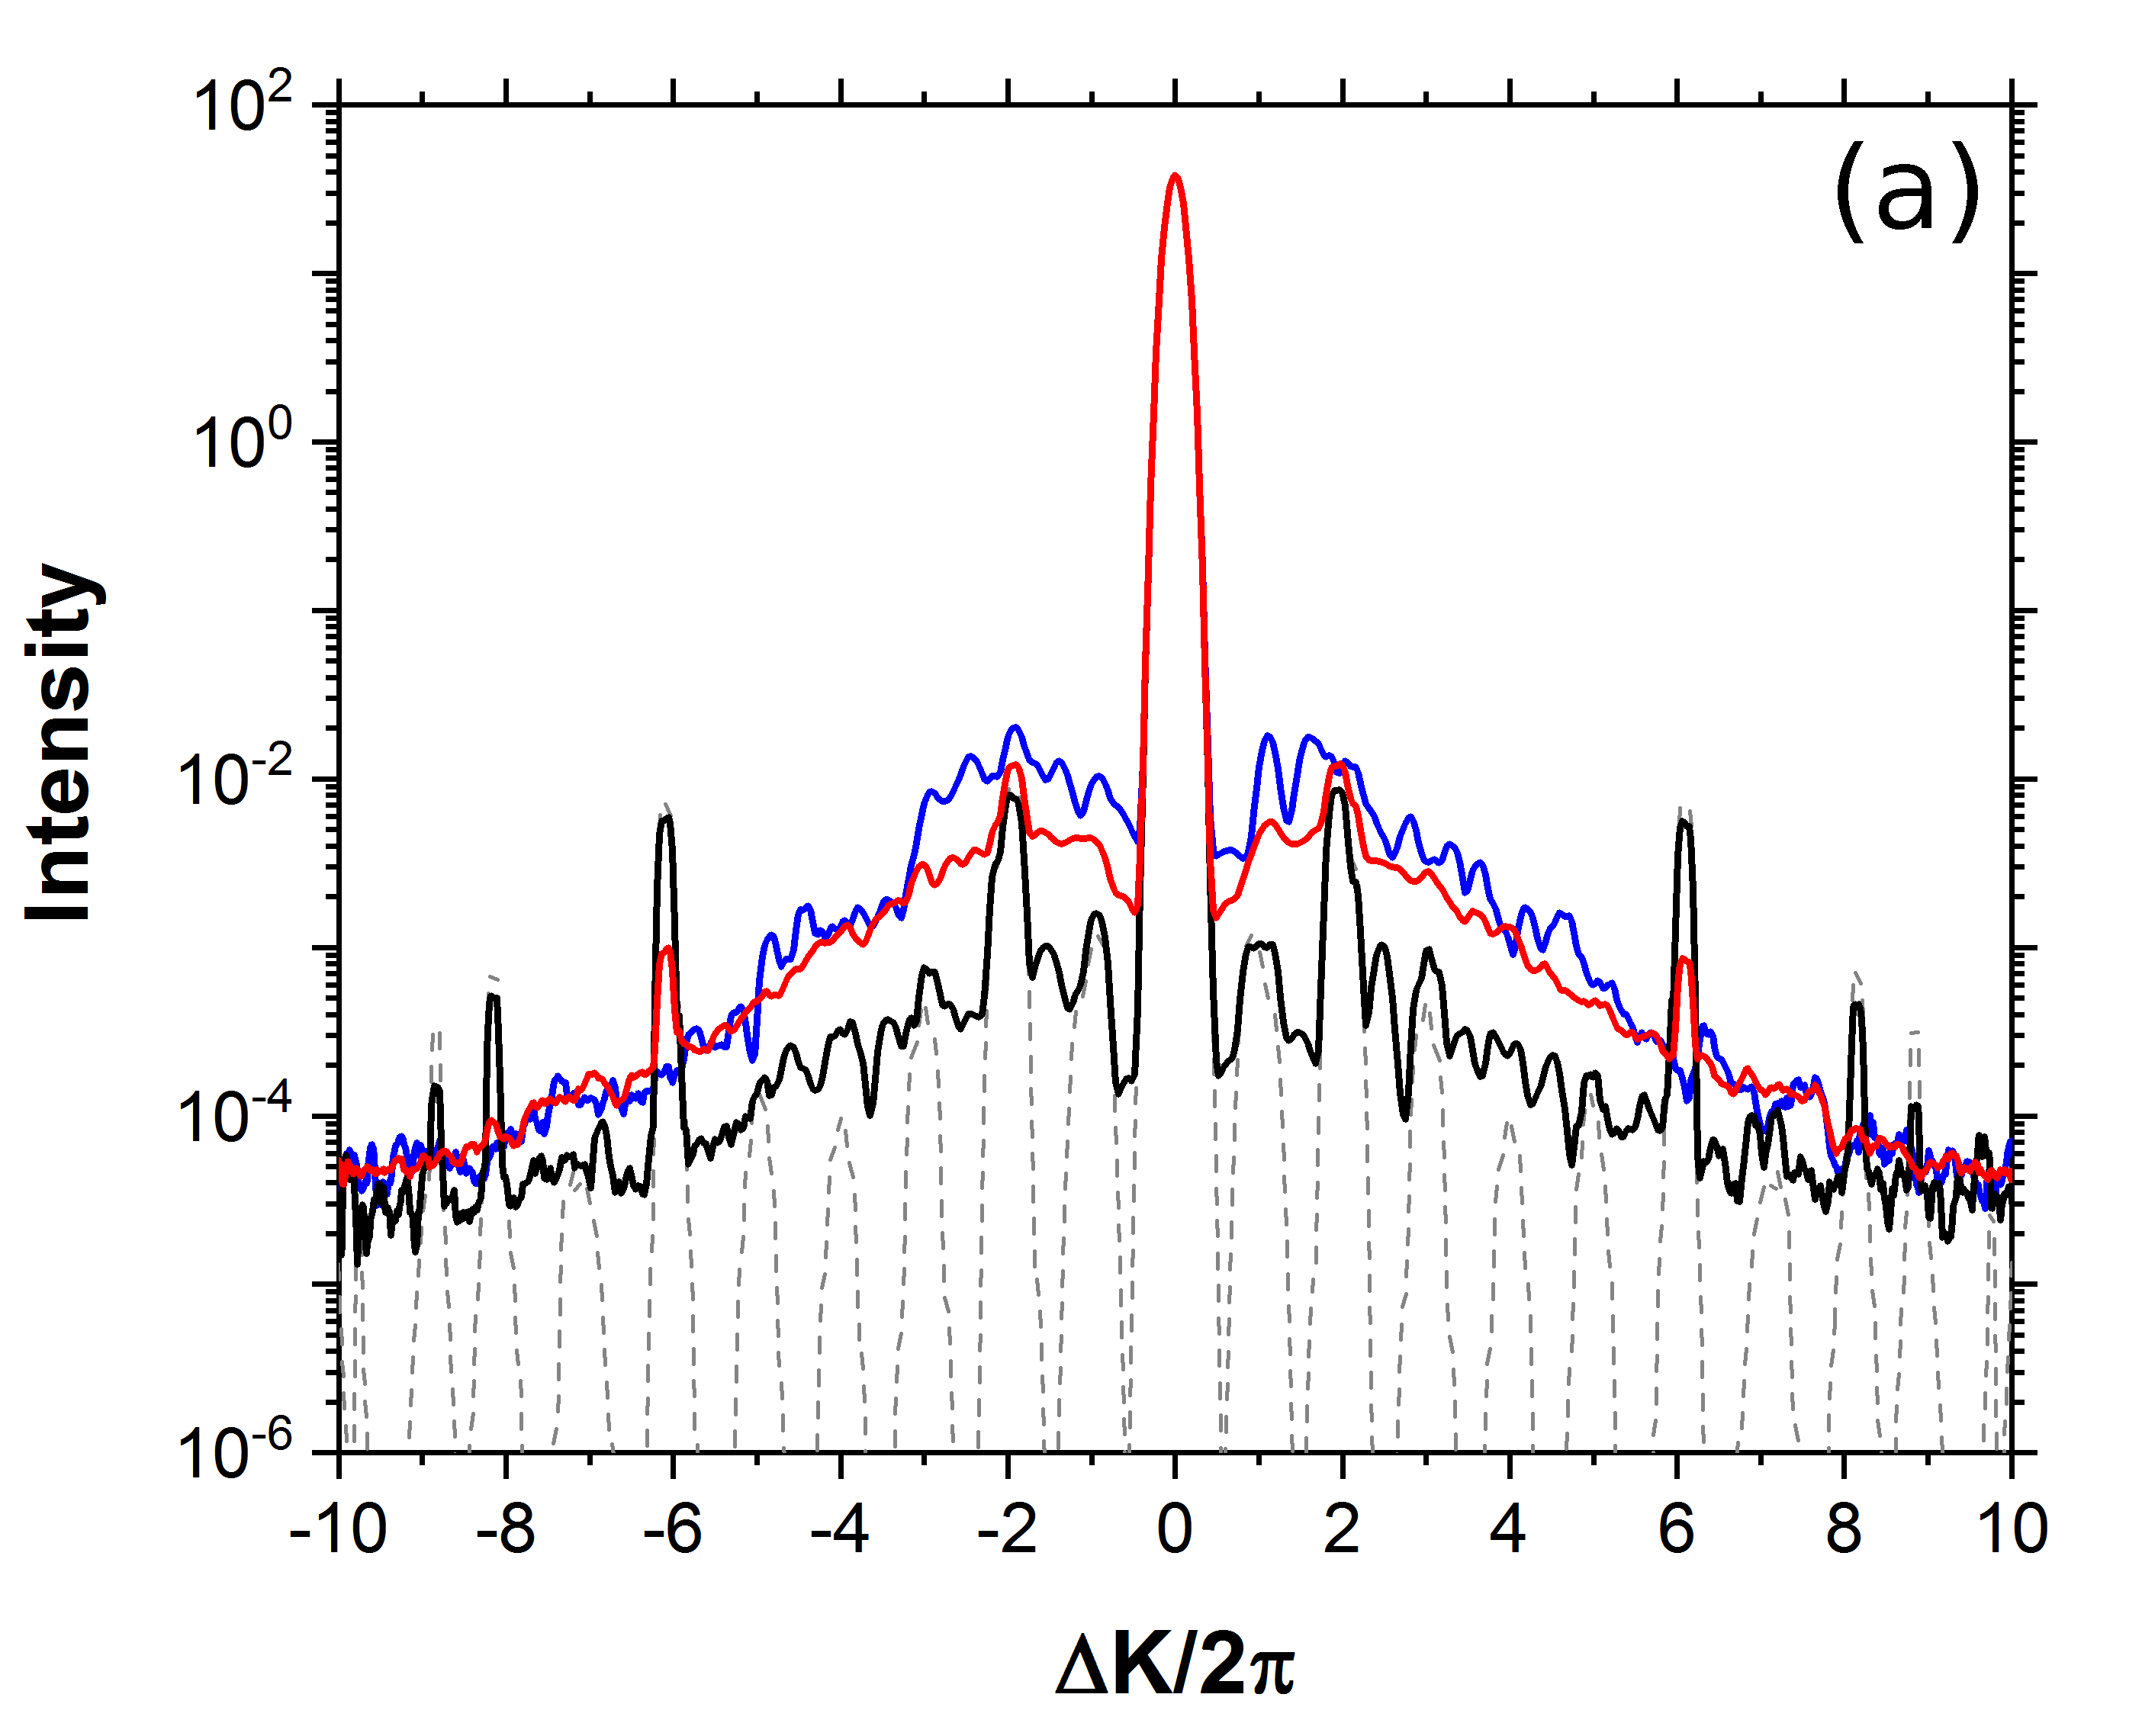
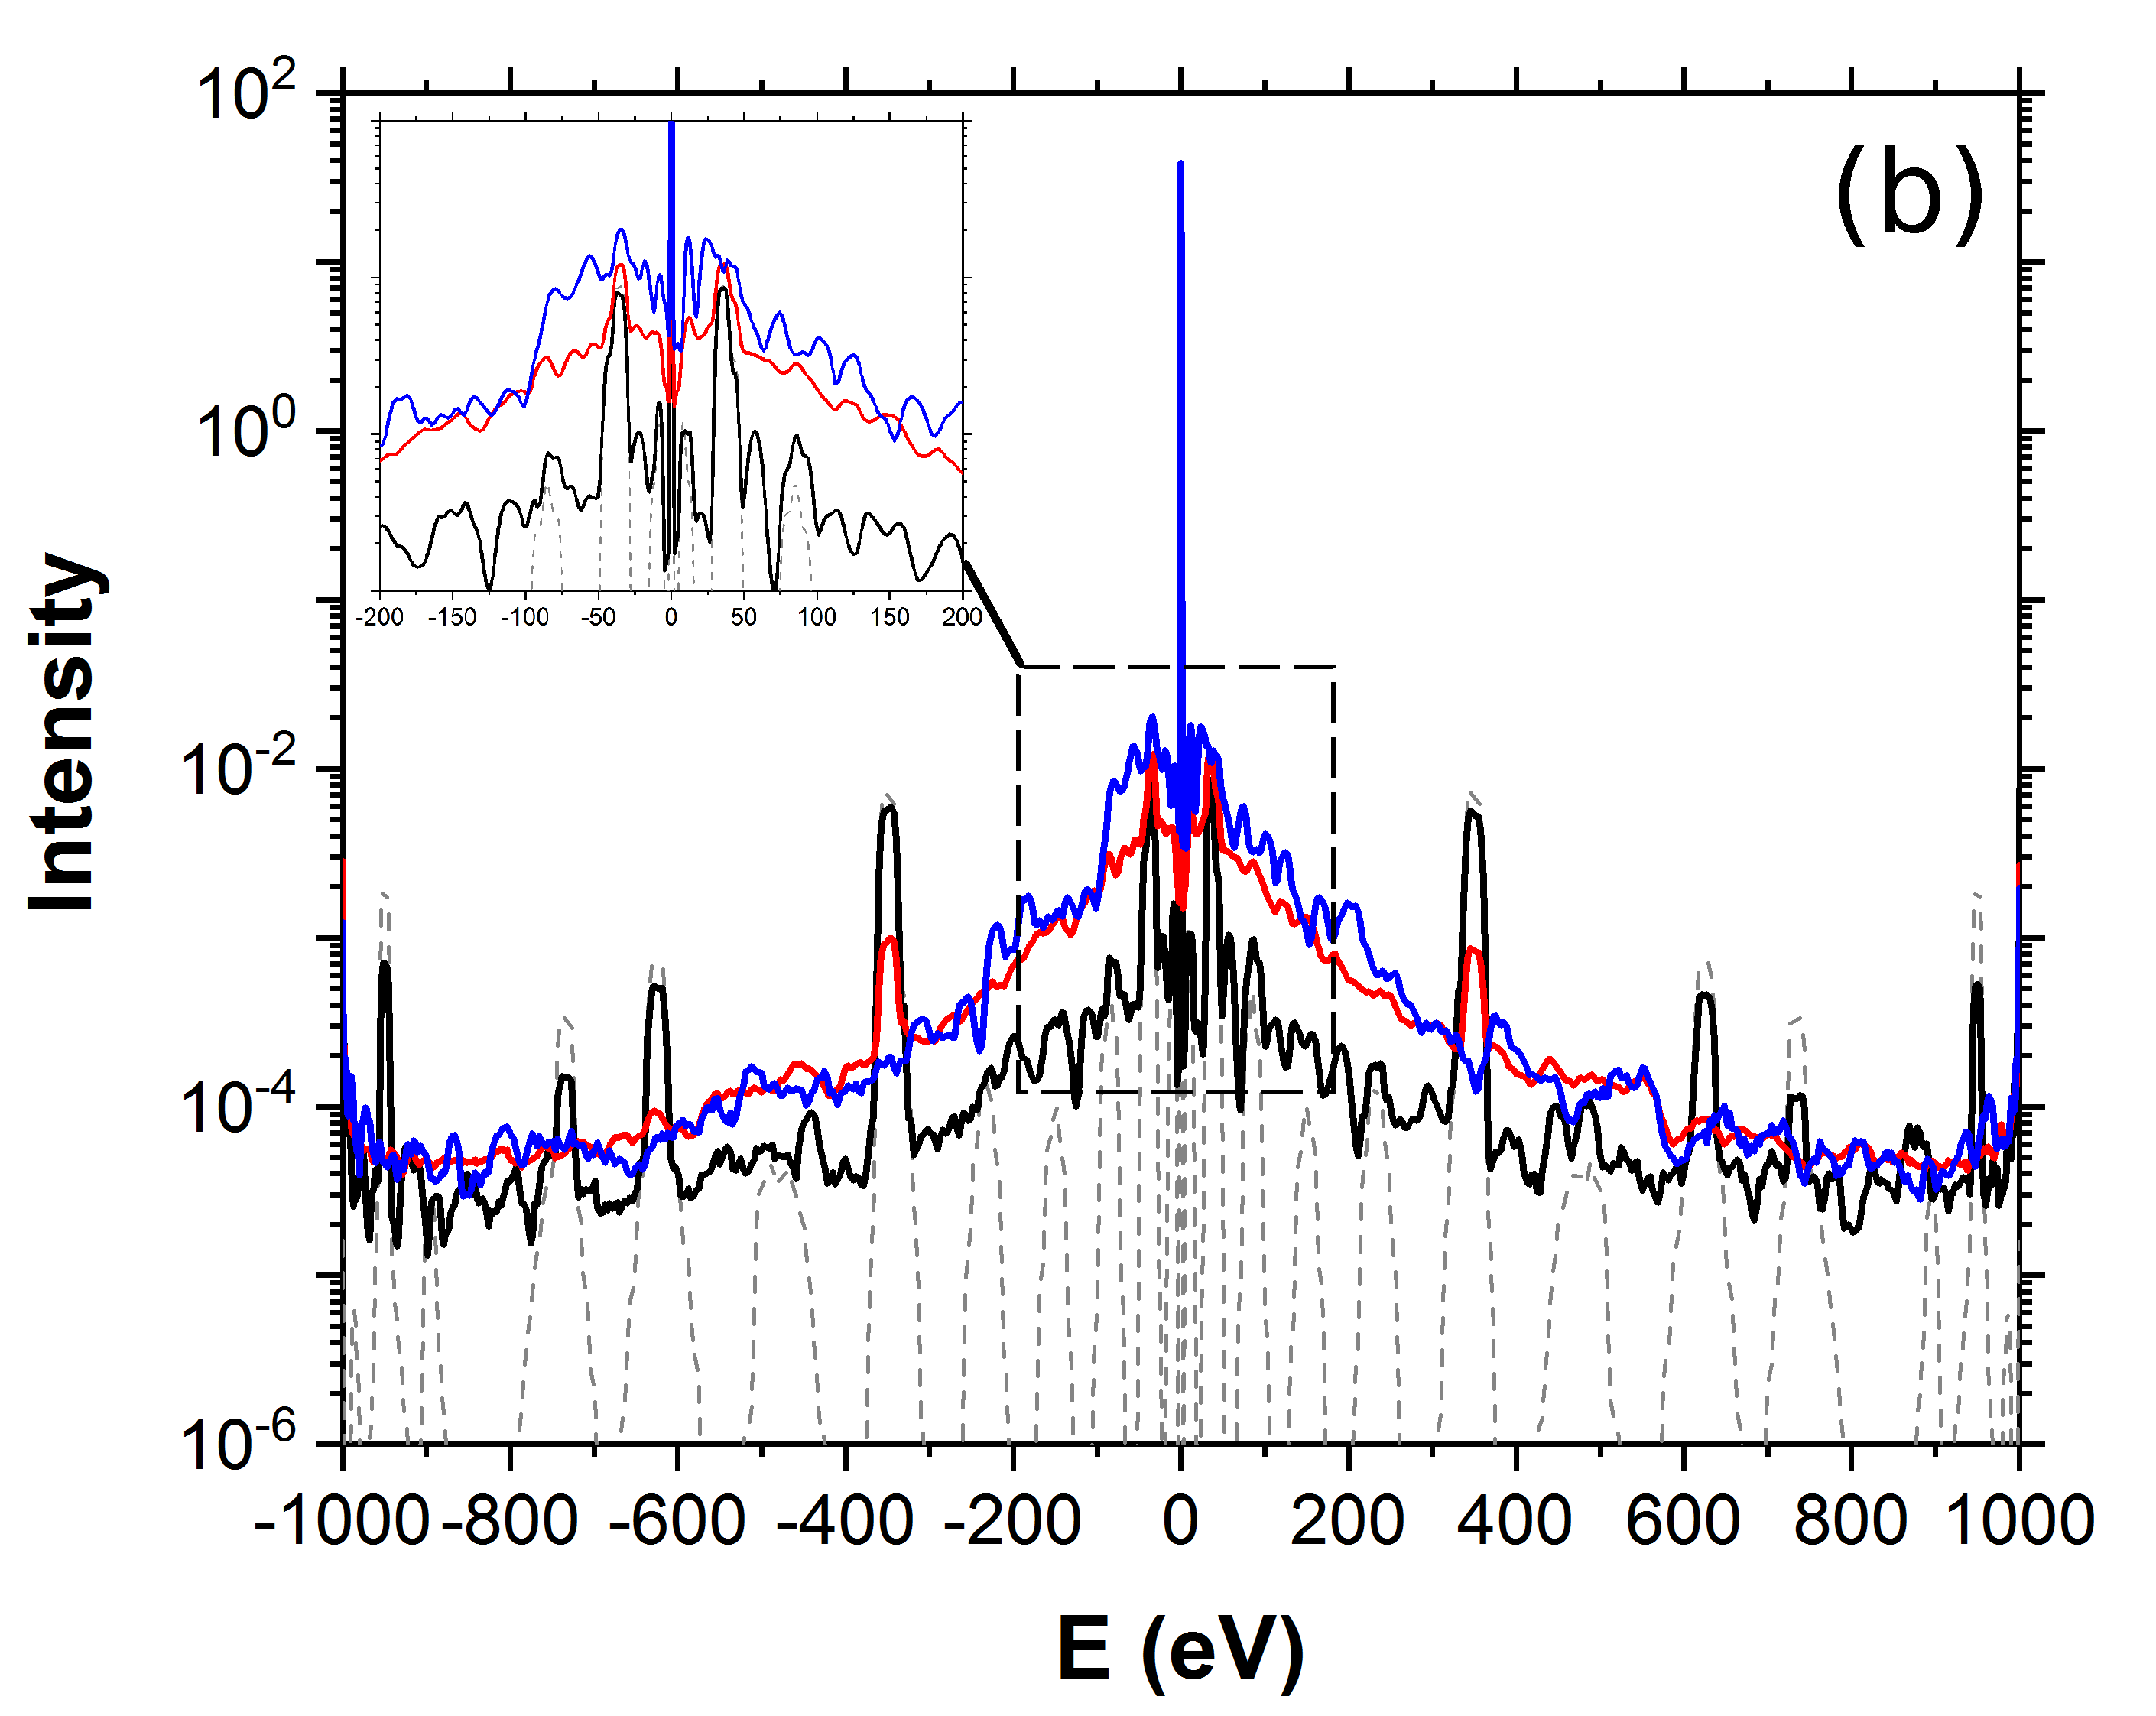
The intensity distribution as a function of the parallel momentum transferred to the film is shown in Fig. 2. The peak intensities for each wave vector can be clearly seen in the case of a static crystal. However, as temperature increases, the intensity distribution becomes increasingly diffuse. Notice that, because the simulations are performed at a relatively low energy, the scattering probability is high and incoherence can be easily seen even for such a thin specimen. Nevertheless, the crystal structure is not completely lost even at high temperatures, where we can see the persistence of the diffraction peaks for the orders , , , and , which are the most prominent ones in the zero temperature case. As would be expected, as temperature increases, they become relatively weaker and weaker. At K, for instance, only the and orders remain, and at K only kind of broad shoulders around remain.
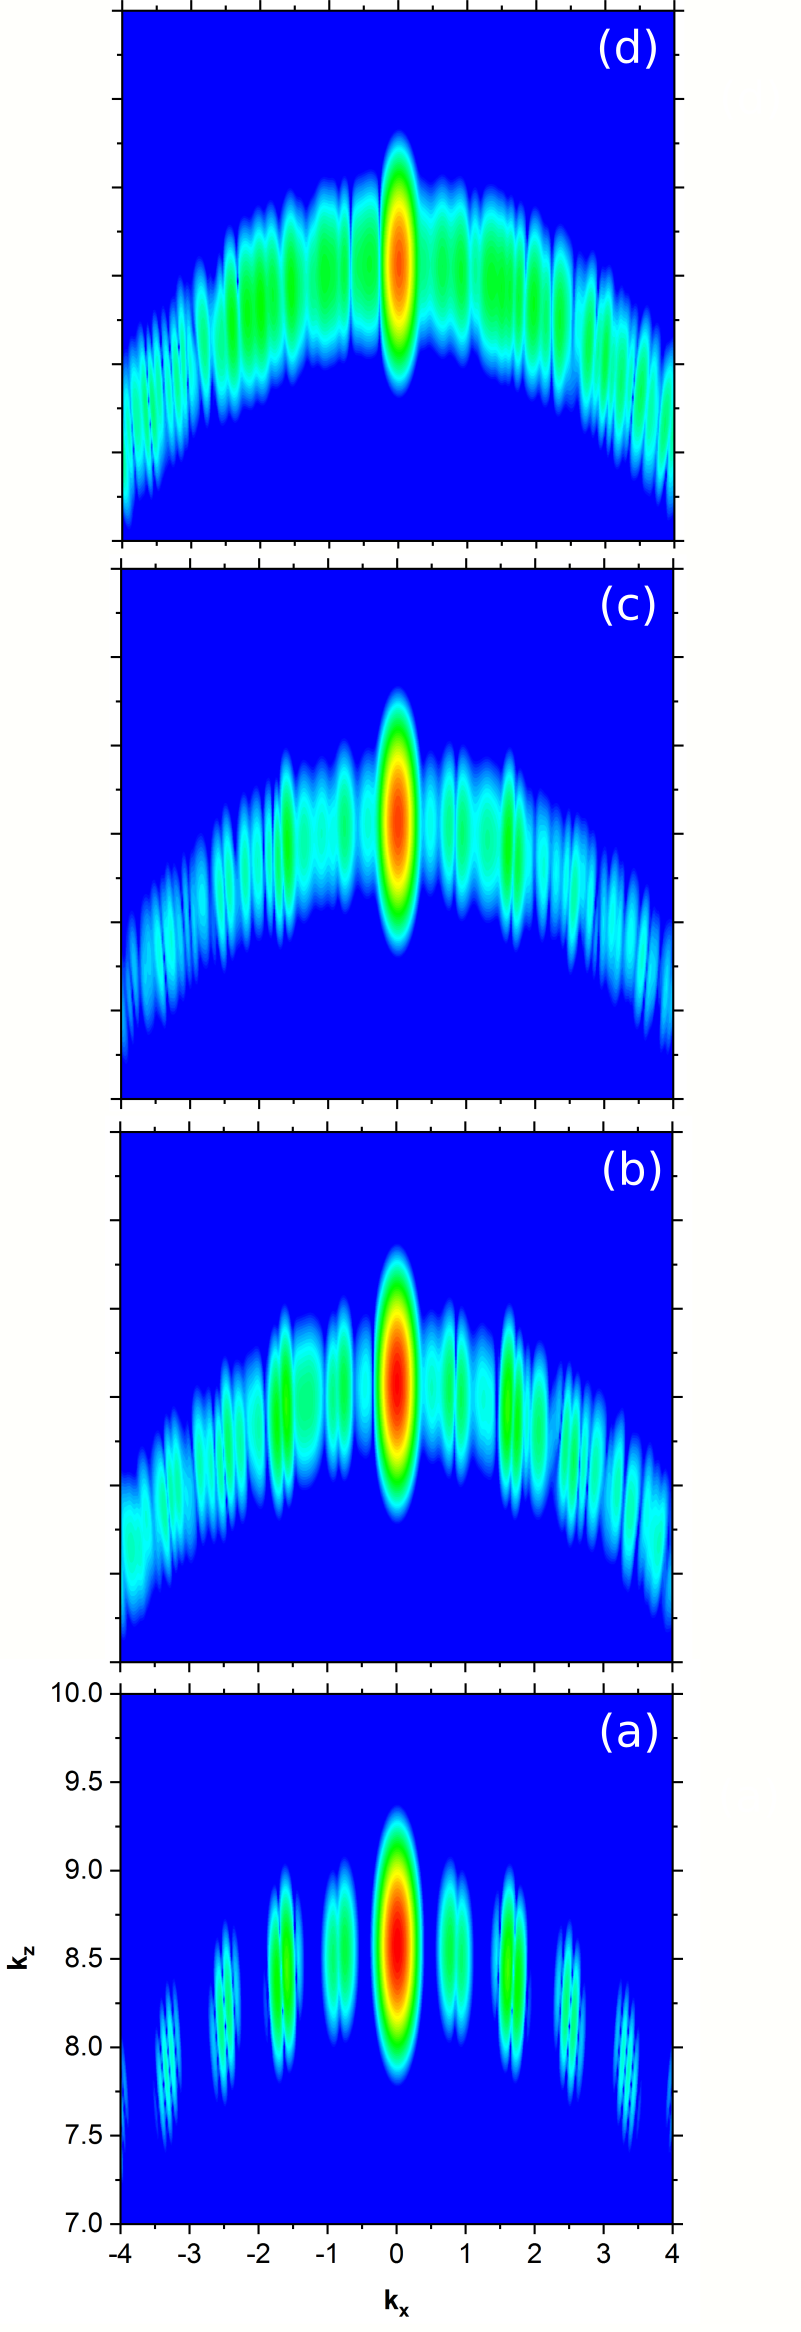
The intensity displayed in Fig. 2 is a reflection of the dynamics described by the associated density in the momentum representation. Asymptotically, the influence of the potential is negligible on the wave function, even if spatially it is still well inside the near field and does not display any of the recognizable features of diffraction patterns. However, from the momentum perspective it is already well converged and we can extract valuable information from its structure without going to the far field. Bearing this in mind, we have computed the diffraction patterns in the momentum representation for each vibration amplitude and compared them to that of the static crystal. Plots are displayed in Fig. 3, in particular, from bottom to top, for 0 K, 26.7 K, 241.4 K, and 670.6 K. As can be seen, the effects of TDS are already quite clear. When TDS is not incorporated into the model, clear diffraction spots unique to the crystal structure can be distinguished. However, as temperature and, consequently, vibration amplitude increase, such spots become less distinguishable and the resulting pattern is diffuse, resembling that of an amorphous material. In these types of materials, disorder in the atomic planes causes incoherent scattering of the wave function inside the material Williams and Carter (2009). In the case of the frozen phonon model, integrating over multiple different configurations replicates this incoherence Loane et al. (1992).
Figures 2 and 3 show that the frozen phonon model applied to time-dependent and low energy wave packet propagation reproduces TDS without the need of artificial modulation by Debye-Waller factors and complex potentials. This is because decreases in peak intensities farther from the primary beam and diffusivity of intensity between peaks arise naturally through this method. Integrating over many phonon configurations results in an exit wave function which seems to have interacted with a smeared potential, whose degree of smearing is a function of temperature. This simulates incoherent scattering of the wave function, which removes intensity from the portions which would otherwise be coherently scattered. Therefore, these peaks are less intense and intensities from angles between those of the wave vectors are present in the form of noise.
In our approach, for each single realization, the transmission process only involves elastic scattering regardless of the temperature. To confirm this fact, both the expectation value of the energy, , and its dispersion,
| (6) |
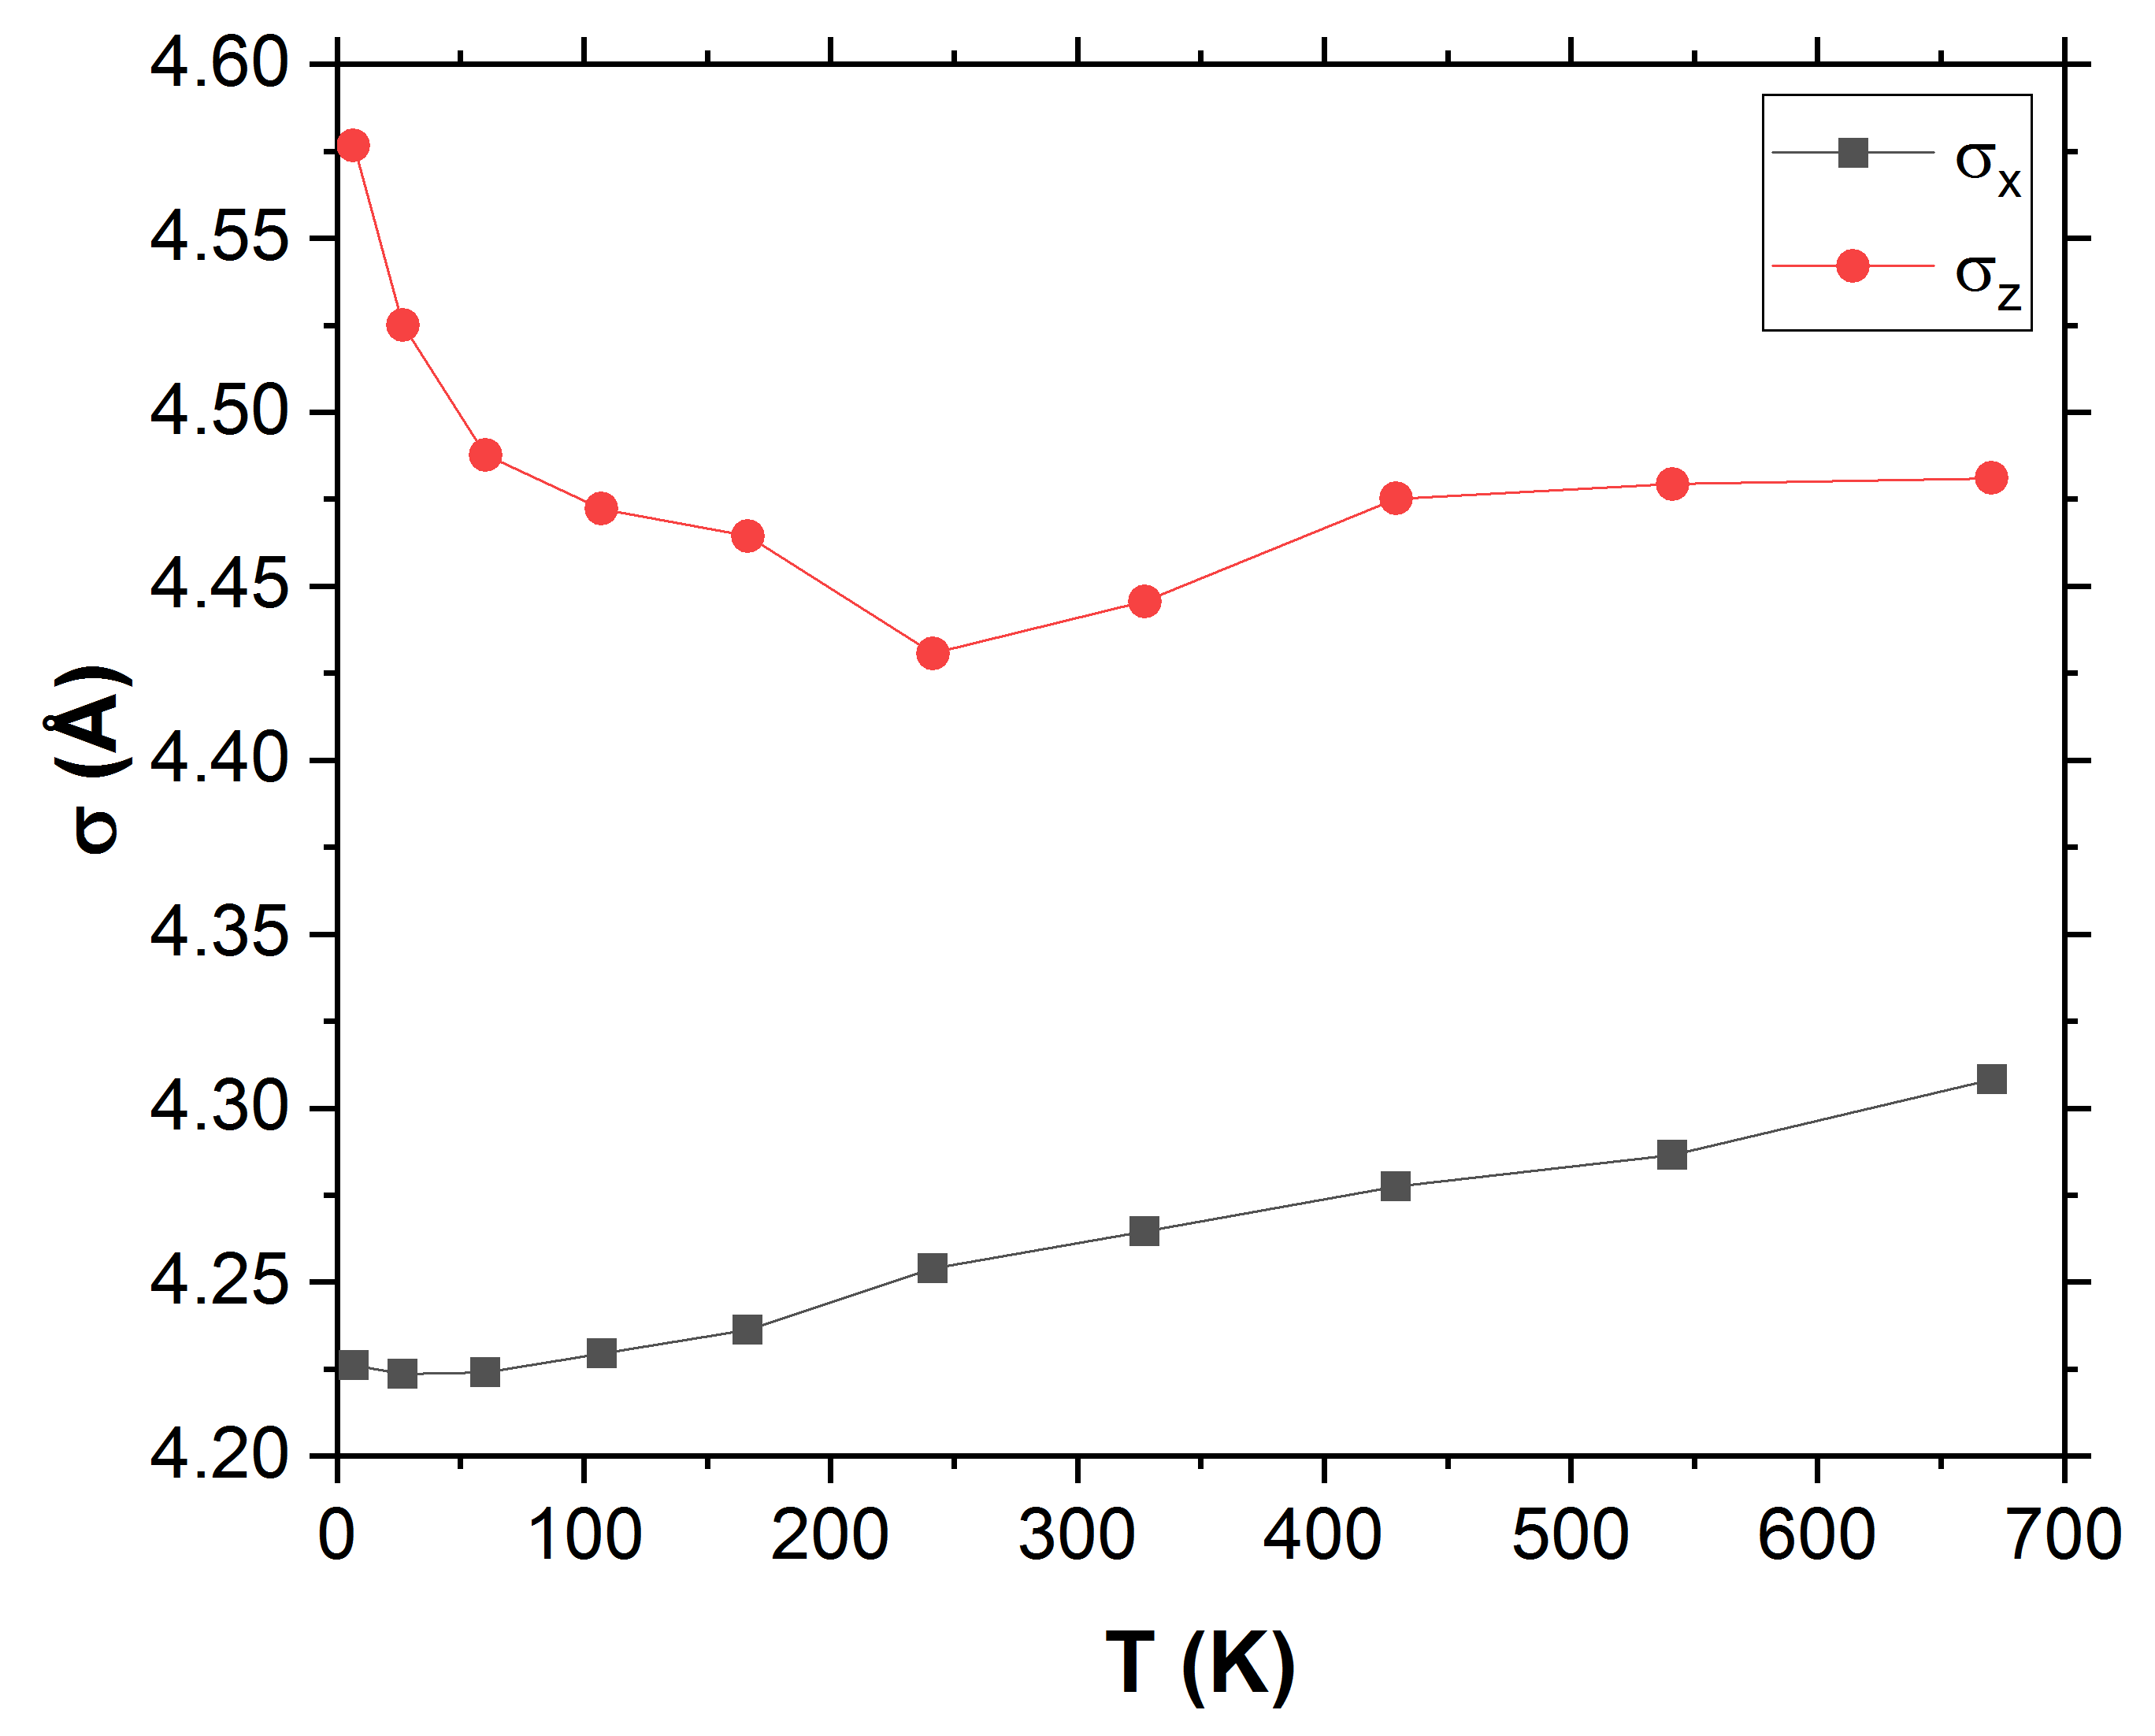
have been calculated. As expected, the expectation value of the energy for each temperature has remained equal to that of the incident particle, 1 keV; the same has been observed for the energy dispersion, which has remained equal to 0.054 keV. On the other hand, it is well known Gauvin and Rudinsky (2016); Cliff and Lorimer (1981) that when the wave packet is traveling through a material, it can also be affected by the number of scattering events occurring between the incident particle and the surrounding atoms, which will also be dependent on the thermal agitation of the latter. To quantify this effect, we have also computed the spatial dispersion along the and directions,
| (7) |
where , averaging it in the same way as the energy. The results as a function of temperature for the simulations done in this work are presented in Fig. 4. It is interesting to note that while the dispersion along the propagation direction is an increasing function (nearly linear) with temperature, along the transverse direction it decreases until approximately 250 K and then undergoes a very slight increase, which becomes constant for large temperatures.
In the case of the static lattice, it was shown previously that for time-dependent wave packet propagation through an 80 Å thick Al film with the same initial conditions, broadening in the lateral direction was unaffected by the material and followed that of a free particle Rudinsky et al. (2017). Figure 4 shows that in fact with the incorporation of TDS, lateral spreading increases with increasing temperature while longitudinal spreading decreases for an initial incorporation of disorder and then remains relatively constant. The variation in the -direction implies that scattering from an imperfect crystal increases beam broadening. In the above mentioned previous work, it was shown that upon exit of the material, the spread of the wave function was 1.02 times its initial size Rudinsky et al. (2017). Here, the spread of the final wave function varies from 1.055 Å to 1.08 Å. This increase in spread corresponds to the diffusivity and increased amount of high intensity regions between the diffraction spots of Fig. 3. In slicing methods, a 2D transmitted wave function is computed at each slice so that full transmission in is assumed and the rays are approximately parallel to the incident beam. Consequently, modulations in all spatial coordinates are unobtainable. Here, a time-dependent approach demonstrates that variations of the wave function in all dimensions occur with TDS and that broadening is increased with disorder of the crystal.
While computing particle diffraction intensities, such as in X-ray diffraction or electron microscopy, it is important to take into account the effect of thermal diffuse scattering by phonon excitations. In material properties calculations, such as thermodynamic properties, the Debye method is typically used to modulate the peak intensities while a constant complex potential term is included in the real potential to increase background. In transmission electron microscopy, the frozen phonon model is a common tool where averaging over various different phonon configurations reproducing the effects TDS will have on the transmission image. This method is commonly used in high energy modeling techniques but has not been applied to time-dependent, low-energy situations. Here, the frozen phonon model has been applied to a time-dependent solution of the Schrödinger equation of an electron beam transmitted through a thin aluminum film. Incoherent scattering was accurately reproduced in the computed intensity distributions and diffraction patterns by means of diffuse intensities about the Bragg spots. It was shown that the method conserves energy and that the spatial dispersion increases laterally with increasing temperature due to an increased amount of scattering events. Overall, such a method is not only reserved to slicing techniques and the physical consequences of phonon excitations can be reproduced without artificial modulation of diffraction intensities.
S.R. and R.G. would like to acknowledge the Aluminum group (REGAL) for their financial support. A.S. acknowledges financial support from the Spanish MINECO (grant No. FIS2016-76110-P).
References
- Sasaki et al. (2016) N. Sasaki, Y. Saitoh, R. K. Sharma, and K. Furusawa, International Journal of Biological Macromolecules 92, 240 (2016).
- Winkelmann et al. (2007) A. Winkelmann, C. Trager-Cowan, F. Sweeney, A. P. Day, and P. Parbrook, Ultramicroscopy 107, 414 (2007).
- Wang (1995) Z. Wang, Elastic and inelastic scattering in electron diffraction and imaging, Language of science (Plenum Press, 1995).
- Kirkland (2010) J. Kirkland, Advanced Computing in Electron Microscopy (Springer US, 2010).
- Peng (1999) L.-M. Peng, Micron 30, 625 (1999).
- Gilat and Nicklow (1966) G. Gilat and R. M. Nicklow, Phys. Rev. 143, 487 (1966).
- Nicklow and Young (1966) R. M. Nicklow and R. A. Young, Phys. Rev. 152, 591 (1966).
- McDonald (1967) D. L. McDonald, Acta Crystallographica 23, 185 (1967).
- Pryor and Sabine (1964) A. Pryor and T. Sabine, Journal of Nuclear Materials 14, 275 (1964).
- Chipman (1960) D. R. Chipman, Journal of Applied Physics 31, 2012 (1960).
- Peng et al. (1996) L.-M. Peng, G. Ren, S. L. Dudarev, and M. J. Whelan, Acta Crystallographica Section A 52, 456 (1996).
- Muller et al. (2001) D. A. Muller, B. Edwards, E. J. Kirkland, and J. Silcox, Ultramicroscopy 86, 371 (2001), ISSN 0304-3991, international Symposium on Spectroscopy of Materials.
- Allen et al. (2015) L. Allen, A. D׳Alfonso, and S. Findlay, Ultramicroscopy 151, 11 (2015), ISSN 0304-3991, special Issue: 80th Birthday of Harald Rose; {PICO} 2015 – Third Conference on Frontiers of Aberration Corrected Electron Microscopy.
- Loane et al. (1992) R. F. Loane, P. Xu, and J. Silcox, Ultramicroscopy 40, 121 (1992).
- Loane et al. (1991) R. F. Loane, P. Xu, and J. Silcox, Acta Crystallographica Section A 47, 267 (1991).
- Findlay et al. (2005) S. Findlay, M. Oxley, S. Pennycook, and L. Allen, Ultramicroscopy 104, 126 (2005), ISSN 0304-3991.
- Jesson and Pennycook (1995) D. E. Jesson and S. J. Pennycook, Proceedings of the Royal Society of London A: Mathematical, Physical and Engineering Sciences 449, 273 (1995).
- Cartz (1955) L. Cartz, Proceedings of the Physical Society. Section B 68, 957 (1955).
- Rudinsky et al. (2017) S. Rudinsky, A. S. Sanz, and R. Gauvin, Journal of Chemical Physics 146, 104702 (2017).
- Feit et al. (1982) M. Feit, J. Fleck, and A. Steiger, J. Comput. Phys. 47, 412 (1982).
- Leforestier et al. (1991) C. Leforestier, R. Bisseling, C. Cerjan, M. Feit, R. Friesner, A. Guldberg, A. Hammerich, G. Jolicard, W. Karrlein, H.-D. Meyer, et al., Journal of Computational Physics 94, 59 (1991).
- Kosloff and Kosloff (1986) R. Kosloff and D. Kosloff, Journal of Computational Physics 63, 363 (1986).
- Williams and Carter (2009) D. Williams and C. Carter, Transmission Electron Microscopy: A Textbook for Materials Science, no. v. 1 in Cambridge library collection (Springer, 2009).
- Gauvin and Rudinsky (2016) R. Gauvin and S. Rudinsky, Ultramicroscopy 167, 21 (2016).
- Cliff and Lorimer (1981) G. Cliff and G. W. Lorimer, Quantitative Microanalysis with High Spatial Resolution 277, 47 (1981).