The simultaneous discharge of liquid and grains from a silo
Abstract
The flow rate of water through an orifice at the bottom of a container depends on the hydrostatic pressure whereas for a dry granular material is nearly constant. But what happens during the simultaneous discharge of grains and liquid from a silo? By measuring the flow rate as a function of time, we found that: (i) different regimes appear, going from constant flow rate dominated by the effective fluid viscosity to a hydrostatic-like discharge depending on the aperture and grain size, (ii) the mixed material is always discharged faster than dry grains but slower than liquid, (iii) for the mixture, the liquid level drops faster than the grains level but they are always linearly proportional to one another, and (iv) a sudden growth in the flow rate happens during the transition from a biphasic to a single phase discharge. These results are associated to the competition between the decrease of hydrostatic pressure above the granular bed and the hydrodynamic resistance. A model combining the Kozeny-Carman, Bernoulli and mass conservation equations is proposed and the numerical results are in good agreement with experiments.
The clepsydra was an ancient device used to measure the passage of time based on the slow discharge of water through an orifice at the bottom of a graduated vessel. Its origin is unknown but presumably appeared in China about six thousands years ago Needham2000 . The markings in this antiquity are non-uniformly separated since the flow rate depends on the hydrostatic pressure due to the water column above the orifice. On the other hand, the clepsammia, or sandglass, appeared millennia later probably in Alexandria Benthuysen1870 although evidence of its origin only dates from the middle ages Balmer1978 . In this device, the flow rate of grains through the bottleneck is independent of the granular column height because the stress acting on the material is redirected towards the container walls through contact force chains. This fact attracted scientists during the last 60 years, being the discharge of dry granular materials from hoppers widely investigated Beverloo1961 ; Mills1996 ; Samadani1999 ; Zuriguel2005 ; Mankoc2007 ; Unac2012 ; Dorbolo2013 ; Pacheco2017 .
The flow rate of dry grains through an orifice can be estimated using the Beverloo equation Beverloo1961 :
| (1) |
where and are the aperture and particle diameters, and are dimensionless fitting parameters related to friction and particle shape, is the material density and is the acceleration of gravity. The above equation must be modified by introducing an exponential factor when the ratio is considerably increased Mankoc2007 . More recently, experiments performed at different ’s proved that the square root scaling proposed by Beverloo is relevant Dorbolo2013 . It has also been found that the initial packing fraction of the granular column does not affect considerably the flow rate Huang2006 ; Ahn2008 ; Pacheco2017 because the material under discharge is fluidized before reaching the silo aperturePacheco2017 . Even in unconventional systems of repelling particles, remains constant during the discharge Lumay2015 ; Hernandez2017 .
In all the above studies, the interstitial medium is air and its presence was neglected or assumed to be equivalent to the discharge of dry grains in vacuum. Only recently, the discharge of silos totally submerged in water was considered Wilson2014 ; Koivisto2017 ; Koivisto2017-2 . Under these conditions, the flow rate is not constant unless the filling height is very large, and increases as the hopper empties. An unexpected surge in the flow rate appears near the end of the discharge, which is attributed to a pumping effect produced by the interstitial fluid moving faster than the grains. In flow-controlled experiments the surge disappears and the flow rate becomes constant Koivisto2017 .
In this article, we study the simultaneous discharge of glass beads and water from a cylindrical silo. An important difference with previous works is that our system is not underwater but it hangs freely in air from a force sensor that allows us to determine the flow rate throughout the emptying process. We found that can be constant, increase or decrease as the silo empties depending on , and on the size of the liquid column above the granular bed. The surge previously reported in underwater systems is also observed and the difference between the flow rate of the mixed phase and the liquid phase reveals a change in the effective viscosity of the fluid. The liquid level always decreases proportionally to the grains level, and this dependence is introduced in the Kozeny-Carman and Bernoulli equations to model the discharge.
a) b) c) 0.0cm-1.5cm
Experimental setup: The silo consists of a transparent cylindrical container of 4.4 cm inner diameter and 60 cm high with an interchangeable acrylic flat bottom that allows us to vary the aperture size in four different values and () mm. The container hangs vertically from a fixed Force Gauge Omega DFG-335 as it is schematically shown in Fig. 1a. This array allows us to measure the system weight as a function of time during the discharge of dry silica grains (density g/cm3), pure water (density g/cm3), and grains sedimented in water (G&W). The experiments were performed using deionized water at room temperature and four different grain sizes : , , and m for each value of .
Before each experiment, the orifice is blocked with duct tape, the silo is hanged from the force gauge and filled with grains of a desired size. In the case of G&W, the container is first filled with water up to a height cm and then the grains are poured from the top until reaching a granular column of height cm. The displaced water escapes through a hole that was made on the lateral wall at 52 cm from the bottom of the silo to ensure that the water level at the beginning of each experiment is always the same. Once the granular material has settled, the duct tape is removed to start the discharge and the weight is recorded with the force gauge at 5 Hz until the process ends. The experiment was repeated five times for different grain size and apertures, and the equivalent procedure was followed using dry grains and water to compare the flow rate for the three situations.
The simultaneous discharge was filmed laterally with two cameras, one located in front of the silo to measure the decrease of the granular bed and water levels as a function of time (camera 1), and the other one filming the material flowing at the output (camera 2). Figure 1b shows montages obtained by superposing 10-pixels width vertical lines from snapshots captured with camera 1 for two different grain sizes. It can be noticed that the distance between the water level and the grains level is practically constant for particles of m. However, for larger grains of 480 m, decreases considerably faster than . Figure 1c taken with camera 2 shows that the filament of material that comes out starts dripping at shorter distances from the orifice as the grain size increases. The above results for different values of and are discussed in the following sections.
a)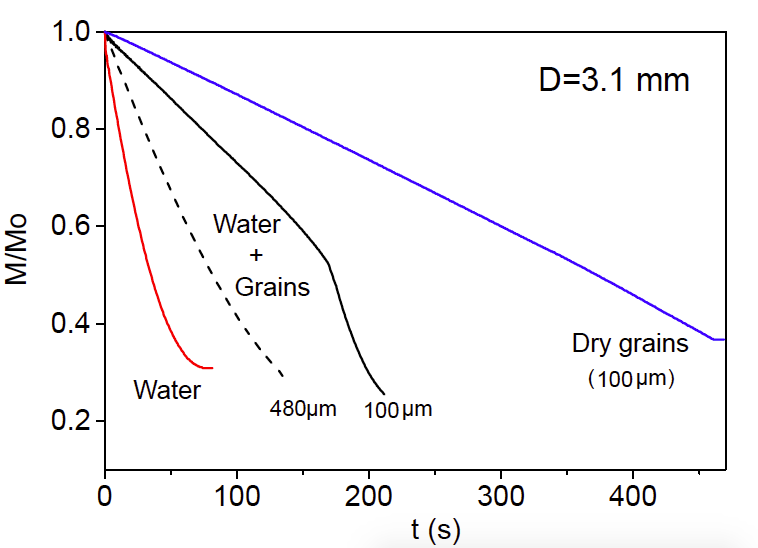 0.3cm-3.5cm
\topinset(b) Grains (c) Water
 0.0cm0cm
a) 0.3cm-8.5cm
\topinsetb)
 0.3cm-8.5cm
Results: In Fig. 2a, the mass registered by the force gauge, , normalized with the initial mass of the full silo, , is plotted as a function of time, , for the three situations described above. In the case of dry grains, decreases linearly with (blue line) indicating a constant flow rate of material. For the free water discharge, describes a non-linear dependence on time associated with the decrease of hydrostatic pressure (red line). On the other hand, the G&W discharge displays different dynamics depending on the grains size, going from a practically constant flow regime for grains of 100 m (continuous black line) to a more hydrostatic-like regime for 480 m (dashed black line). Note that the mixed material is discharged faster than dry grains of the same size but slower than pure water.
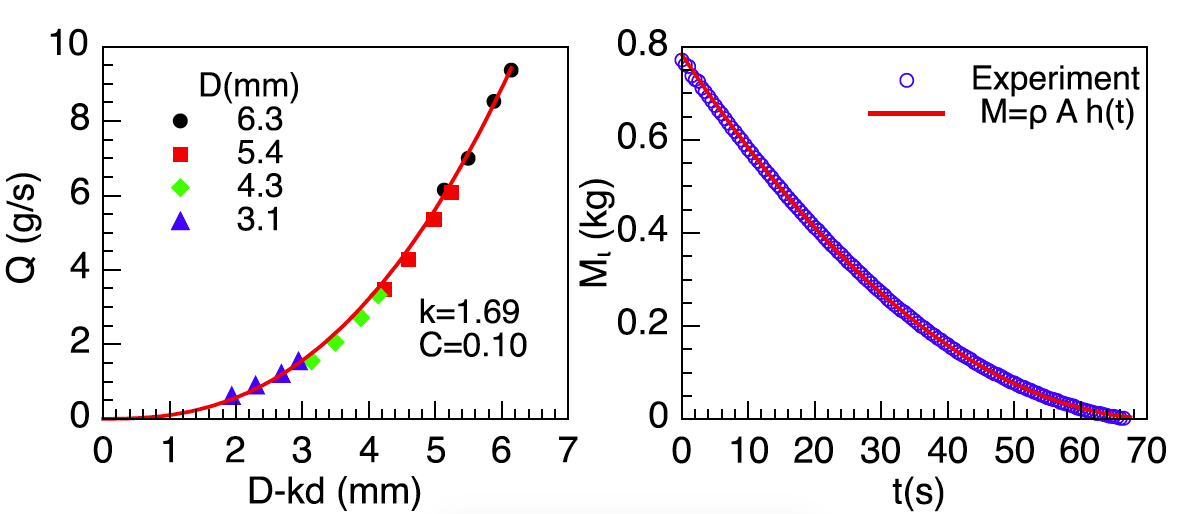
Individual discharges: The first two behaviors are expected according to the literature. In fact, the flow rate of dry grains is largely independent of the amount of material above the orifice as it is stated by the Beveloo law. We plot vs in Fig. 2b considering all the values of and used in our experiments (points) and the data are well fitted by Eq. (1) (red line). On the other hand, to model the discharge of liquid we used the equation of continuity, , combined with the Bernoulli’s theorem, , where and are the inner cylinder area and the liquid surface velocity, and and are the corresponding effective area and velocity at the output with discharge coefficient . By integrating one obtains an expression for the fluid mass remaining in the cylinder, which is given by:
| (2) |
Figure 2c shows the comparison of the numerical solution of Eq. (2) with (pink line) and the experimental results for the particular case mm (blue points), indicating an excellent agreement.
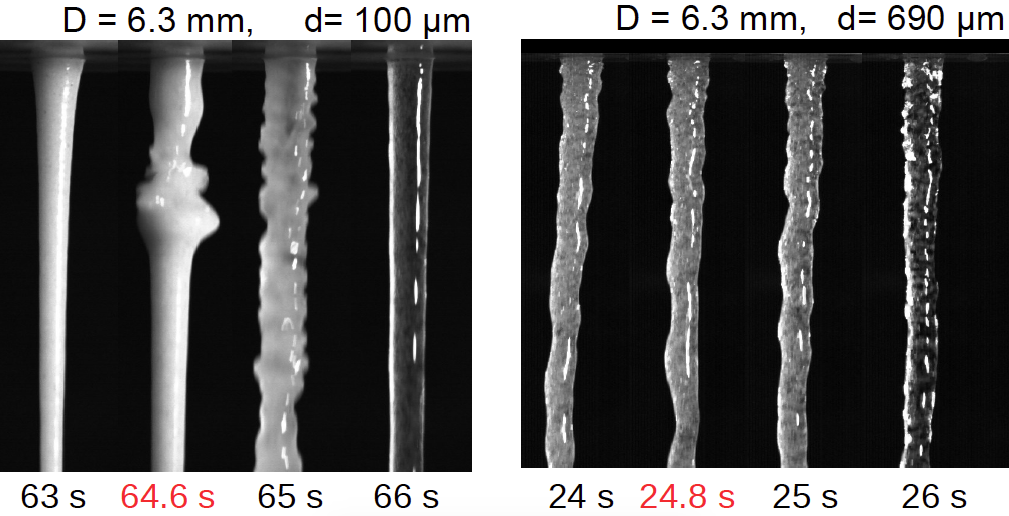
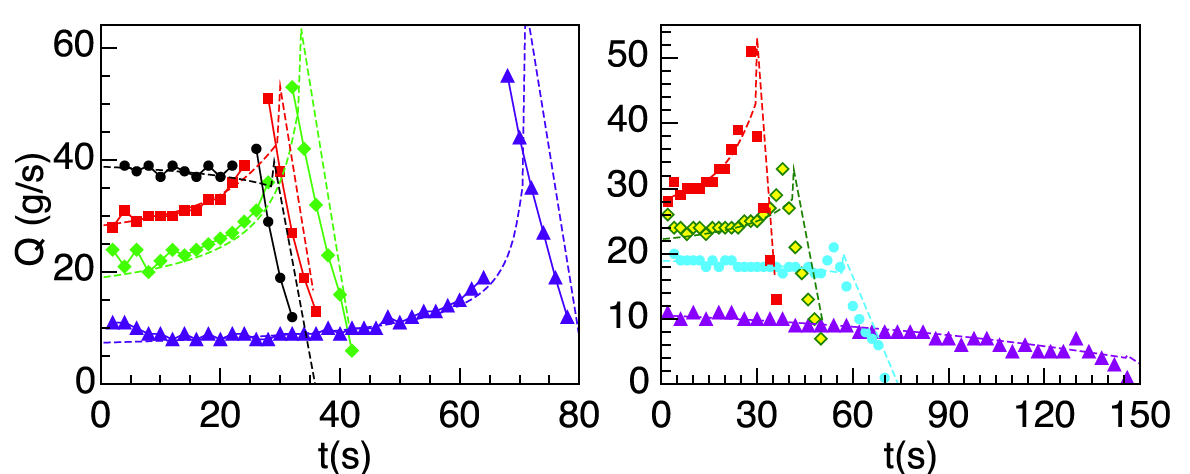
Simultaneous discharge: Figure 3 shows vs and the corresponding flow rate vs for all the values of and explored in this work. Depending on the combination of these two parameters, can decrease, increase or practically remain constant during the emptying process. Moreover, there is a considerable difference between flow rates for the mixed material and for pure water when the silo runs out of grains (sudden break in the curves). At that instant, Fig. 4a shows that and the difference increases with being almost four times greater for mm and m (). For these values, images of the filament taken with camera 2 (Fig. 4b) reveal that a plug of grains at the end of the discharge marks an abrupt reduction of grains concentration in the falling material, and therefore a dramatic decrease in the effective fluid viscosity Ambravaneswaran2004 . The concentration decreases gradually for larger grains and the filament shows more instability (Fig. 4c), which indicates that inertia dominates over viscosity.
a)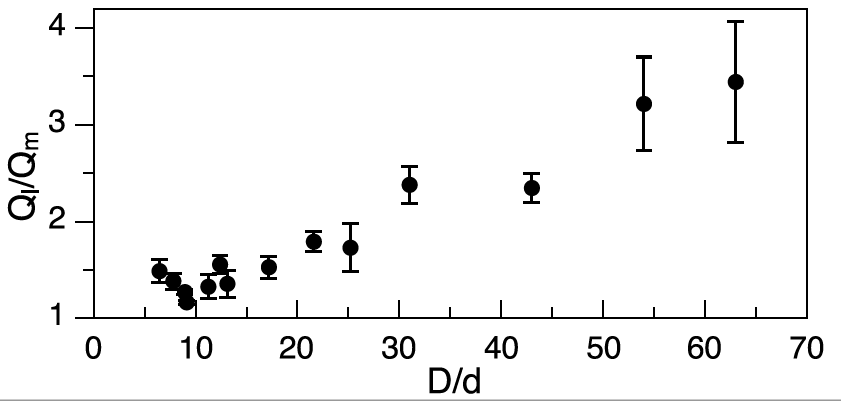 0cm-3.5cm
\topinsetb) c)
  0.3cm-1.85cm
Another remarkable feature of the simultaneous discharge is that the water level measured from the aperture always decreases linearly with the grains level . is plotted as a function of in Fig. 5a. The slopes and intercepts obtained by applying a linear fit of the form to each set of data was plotted as a function of in Fig. 5b (points). The main plot reveals that , and evaluating in the initial conditions ( cm and cm at s) one obtains [cm], which is plotted as a blue line in the inset. Since and are constants for a fixed and , from the first derivative over time one obtains that the velocities of the water level and the granular bed level are related by:
| (3) |
which indicates that the liquid is discharged faster than the grains. When , the liquid is discharged passively with the granular material.

Modelling the GW discharge: let us assume a liquid moving through a porous substrate of thickness . This generates a pressure drop between the top and the bottom of the granular column that can be estimated using the Kozeny-Carman model:
| (4) |
where is the relative velocity between fluid and grains. The porosity and the packing fraction of the bed are related by . Because the porous medium is moving, is a dynamic parameter that can be varying during the discharge. With the help of the sketch in Fig. 1a, we can notice that the net system mass is the sum of the mass of grains, the interstitial water and the mass of water above the granular substrate, then: . Solving for one obtains:
Using the experimental values of , and obtained from the force sensor and videos, we plot for different apertures and grains size in Fig. 6. Note that the packing is approximately constant during the discharge with an average value .

Let us now consider the Bernoulli’s principle applied to the liquid moving with velocity at the upper free surface and with velocity at the aperture:
| (5) |
Combining Eqs. (4) and (5) one obtains a second expression relating and :
| (6) |
Considering Eq. (3) and the continuity equation applied to the liquid: , where was introduced to take into account only the available porous space at the output, we can solve Eq. (6) for and then integrate numerically the continuity equation to obtain . Since and can be written in terms of , the resulting expression for is:
| (7) |
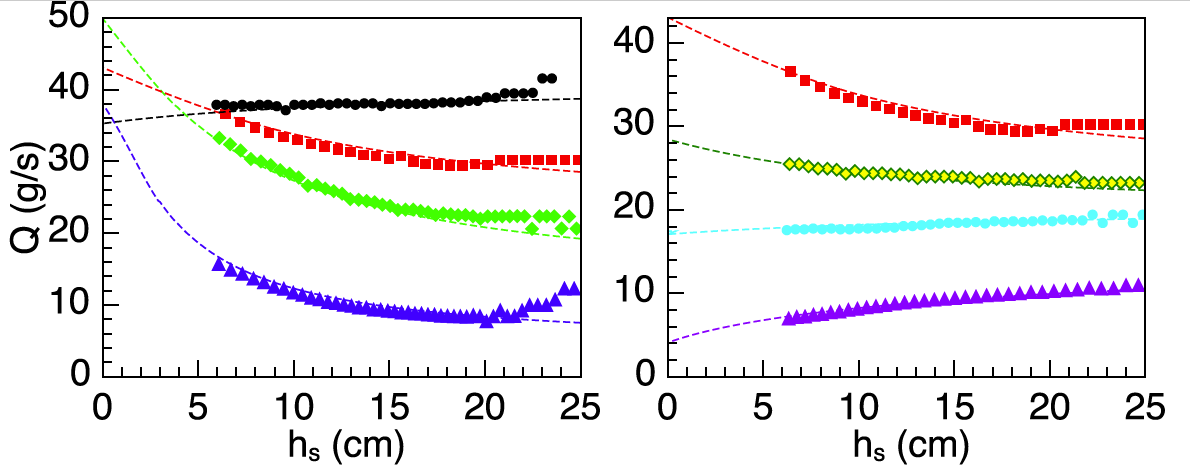
where contains all the information about the system. is plotted in dashed lines and compared with experiments in Fig. 7a for different values of particles and apertures sizes. Note that the main features of the dynamics are captured by the solution until the silo runs out of grains, where Eq. (7) is matched with Eq. (2). Finally, from the first derivative of we obtain and the corresponding implicit solution for , see Figs. 7b,c respectively. In the latter case, the model is able to describe well the experiment in the measured range and predicts for cm, which was not accessible experimentally due to set-up limitations.
a)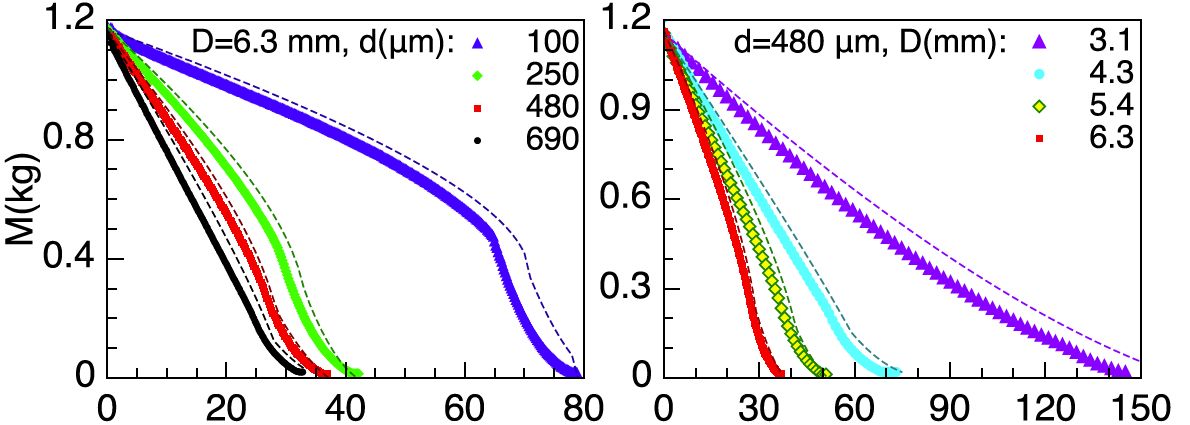 0.0cm-4.5cm
\topinsetb)
 0.0cm-4.5cm
\topinsetc)
 0.0cm-4.5cm
Discussion: In the Beverloo’s law, the square root dependence on gravity comes from the fact that the dry particles are assumed to start a free fall above the aperture in a region of size proportional to the opening diameter, this is . Since Eq. (3) can be written as for , we can assume that the liquid drags the particles increasing their velocity at the aperture, and therefore becomes larger respect to the value expected for dry grains. On the other hand, the grains work as a porous medium that generates hydrodynamic resistance to the liquid and reduces respect to the free liquid case which empties at a larger rate. This helps to understand why .
Furthermore, from Eq. (3) we have that , consequently, the height of the liquid column over the granular bed decreases during the discharge, i.e. the hydrostatic pressure. For m, liquid and grains levels decrease almost at the same velocity and the pressure above the granular bed remains nearly constant. Both scenarios coincides with the most marked behaviors of shown previously in Fig. 3b. Nevertheless, the observed surge of cannot be explained by the simple variation of hydrostatic pressure; we need to consider that is also decreasing, i.e., the hydrodynamic resistance. Therefore, the competition between the decrease of hydrostatic pressure and the hydrodynamic resistance given by the first and second term or Eq. (6) determines the whole dependence of . In the dry case, an analytical expression for is possible because the granular column height plays no role. In our experiments, Eq. (6) becomes a non-linear differential equation for after introducing the continuity equation, and only the numerical solution can be reported.
Finally, let us focus on the big difference between and at the end of the discharge. In Refs. (Furnbank2004, ; Furnbank2007, ), it was reported that microparticle-laden liquids can be described as an effective fluid, i.e. as a pure liquid with equivalent viscosity. It has been also found that dense granular suspensions show a diverging viscosity at increasing particle concentration Zarraga2000 ; Bonnoit2012 and that the transition from the effective fluid regime to an interstitial regime is given by the grain diameter and volume fraction (Bonnoit2012, ). This last conclusion was obtained by analyzing the detachment of drops of granular suspensions using particles ranging from 20 m to 140 m at different volume fractions. In our experiments, only the case m falls in this range. For this grain size , which means that the liquid and grains move as a whole and the mixture is discharged as a dense granular suspension. This framework helps us to associate the discontinuity in the flow rate observed in Fig. 3b with an abrupt decrease in the effective viscosity of the mixture. When the grains run out, the viscosity of the granular suspension suddenly decreases to the liquid viscosity, and the flow rate augments abruptly up to the expected value for inviscid water. Note in Fig. 3b that always behaves similarly for m in the studied range of , whereas for m the change in behavior is remarkable. This could be associated to the transition between two regimes, the first dominated by viscosity and the second one by inertia.
Conclusions: In a discharge race between a hourglass, a clepsydra and a combined device, the mixture of grains and liquid is faster than dry grains but slower than water. In the mixture, the competition of the hydrostatic pressure above the granular substrate and the hydrodynamic resistance produced by the latter determines the relative amounts of grains and liquid that are discharged, which are, unexpectedly, linearly proportional. In addition, by analyzing the thinning of the filament of material flowing from the silo we obtain some insights about the rheological properties of the mixture, at least qualitatively. A deeper analysis of the transition from a viscous to an inertial regime and the dripping to jetting phenomena depending on the will be considered in a further research.
Acknowledgements.
The authors acknowledge J. M. Salazar for helpful discussions and suggestions. This work was supported by CONACYT Mexico through the Sectorial Found for Research and Education CB-0242085 and VIEP-BUAP projects.∗ Corresponding author: fpacheco@ifuap.buap.mx
References
- (1) Needham, J. “Science and Civilisation in China. IV:2: Mechanical Engineering,” Cambridge University Press, (2000). ISBN 0-521-05803-1. OCLC 153247141
- (2) van Benthuysen, C., “Annual Report of the American Institute of the City of New York,” 104 (1870.)
- (3) Balmer, R. T. “The Operation of Sand Clocks and Their Medieval Development,” Technology and Culture 19, 4 (1978).
- (4) Beverloo, W. A., Leniger, H. A. and van de Velde, J., “The flow of granular solids through orifices,” Chem. Eng. Sci. 15, 260 (1961).
- (5) Mills, A. A. et. al., “Mechanics of the sandglass,” Eur. J. Phys. 17, 97 (1996).
- (6) Samadani, A., Pradhan, A., and Kudrolli, A.,“Size segregation of granular matter in silo discharges,” Phys. Rev. E 60, 7203 (1999).
- (7) Zuriguel, I., Garcimartín, A., Maza, D., Pugnaloni, L. A. and Pastor, J. M., “Jamming during the discharge of granular matter from a silo,” Phys. Rev. E 71, 051303 (2005).
- (8) Mankoc, C. et al., “The flow rate of granular materials through an orifice,” Granular Matter 9, 407 (2007).
- (9) Uñaca, R. O., Vidales A. M. and Pugnaloni, L. A., “The effect of the packing fraction on the jamming of granular flow through small apertures”, Journal of Statistical Mechanics: Theory and Experiment (2012).
- (10) Dorbolo, S. et al., “Influence of the gravity on the discharge of a silo,” Granular Matter 15, 263 (2013).
- (11) Pacheco-Vázquez, F., Ramos-Reyes, A. Y. and Hidalgo-Caballero, S., “Surface depression with double-angle geometry during the discharge of grains from a silo,” Phys. Rev. E 96, 022901(2017).
- (12) Ahn, H., Başaranoğlu, Z., Yilmaz, M., Buğutekin, A. and Zafer Gül, M., “Experimental investigation of granular flow through an orifice,” Powder Technol. 186, 65 (2008).
- (13) Huang, D., Sun, G.and Lu, K., “Relationship between the flow rate and the packing fraction in the choke area of the two-dimensional granular flow,” Phys. Rev. E 74, 061306 (2006).
- (14) Lumay, G. et al., “Flow of magnetic repelling grains in a two-dimensional silo,” Pap. Phys. 7, 070013 (2015). http://dx.doi.org/10.4279/pip.070013
- (15) Hernández-Enríquez, D., Lumay, G. and Pacheco-Vazquez, F., “Discharge of repulsive grains from a silo: experiments and simulations,” EPJ Web Conf. 140, 03089 (2017).
- (16) Wilson, T., Pfeifer, C., Mesyngier, N. and Durian, D., “Granular discharge rate for submerged hoppers,” Pap. Phys. 6, 060009 (2014). http://dx.doi.org/10.4279/pip.060009
- (17) Koivisto, J. and Durian, D. J., “The sands of time run faster near the end,” Nat. Commun. 8, 15551 (2017). doi: 10.1038/ncomms15551
- (18) Koivisto, J., Korhonen, M., Alava, M., Ortiz, C. P., Durian D. J. and Puisto, A., “Friction controls even submerged granular flows,” Soft Matter 13, 7657 (2017).
- (19) Ambravaneswaran, B., Subramani, H. J., Phillips, S. D. and Basaran, O. A., “Dripping-Jetting Transitions in a Dripping Faucet,” Phys. Rev. Lett. 93, 034501 (2004).
- (20) Furbank, R. J. and Morris, J. F., “An experimental study of particle effects on drop formation,” Phys. Fluids 16 (5), 1777-1790 (2004).
- (21) Furbank, R. J. and Morris, J. F., “Pendant drop thread dynamics of particle-laden liquids,”Int. J. Multiphase Flow 33(4), 448-468 (2007).
- (22) Zarraga, I. E., Hill, D. A. and Leighton, D. T., “The characterization of the total stress of concentrated suspensions of noncolloidal spheres in Newtonian fluids,” J. Rheol. 44, 185 (2000).
- (23) Bonnoit, C., Bertrand, T. , Clément, E. and Lindner, A., “Accelerated drop detachment in granular suspensions,” Phys. Fluids 24, 043304 (2012).