Widom delta of supercritical gas-liquid coexistence
Abstract
We report on the coexistence of liquid-like and gas-like structures in supercritical fluid (SCF). The deltoid coexistence region encloses the Widom line, and may therefore be termed the “Widom delta”. Machine learning analysis of simulation data shows continuous transition across the delta, from liquid-like to gas-like states, with fractions following a simplified two-state model. This suggests a microscopic view of the SCF as a mixture of liquid-like and gas-like structures, where the anomalous behavior near the critical point originates from fluctuations between the two types.
Introduction.– Ever since its discovery, the liquid-gas critical point (LGCP) has been central to the progress of thermodynamics and statistical physics stanley1971phase . At the LGCP, the boiling curve – separating the liquid and gas phases – ends, and the two phases merge into a single phase of supercritical fluid (SCF). Understanding the SCF has also practical implications, since the blend of liquid-like and gas-like traits renders it particularly useful in chemical engineering Eckert1996SupercriticalProcessing ; Reverchon1997SupercriticalProducts ; Savage1995ReactionsFundamentals ; Niessen2007 .
In the pressure-temperature phase diagram, a bypass around the LGCP via the SCF will continuously transform liquid into gas, thereby avoiding a first-order boiling transition. The SCF was therefore regarded as a homogeneous state of matter. But recently, a series of seminal works have accumulated mounting evidence of non-monotonic behavior and detectable crossovers in salient features of the SCF Xu2005RelationTransition ; McMillan2010FluidSupercritical ; Simeoni2010TheSupercriticalfluids ; Brazhkin2011WidomSystem ; Gallo2014WidomWater. . All this suggested the existence of a boundary separating the SCF into gas-like and liquid-like regions.
A prominent candidate boundary is the Widom line, introduced by Stanley et al. as the locus of maximum correlation length Xu2005RelationTransition ; McMillan2010FluidSupercritical . At the Widom line, thermodynamic response functions show local maxima Brazhkin2011WidomSystem ; Xu2005RelationTransition , and the dispersion of sound undergoes a sharp transition Simeoni2010TheSupercriticalfluids . These hallmarks are reminiscent of the divergent discontinuity at the vapor-liquid equilibrium (VLE) line. Hence, the Widom line is often regarded as an extension of the VLE line into the SCF. In this viewpoint, the Widom line divides the SCF into two distinct bulk states, which are entirely liquid-like or gas-like, though the singularity at the transition is weaker than that of first and second-order phase transitions. The questions regarding the physical nature of the boundary and of the states it defines – in particular their structural features – remain open.
This Letter addresses these questions and proposes an alternative picture: In contrast to the view that liquid and gas can only be mingled during the non-equilibrium boiling process along the VLE line Jeong2015Micro-structuralMorphology , we demonstrate the coexistence of two local states of molecules, liquid-like and gas-like, within a wide region of the SCF enclosing the Widom line. The SCF appears as an inhomogeneous mixture of liquid-like and gas-like particles, and the continuous transition from SCF to pure liquid or gas can be understood as the gradual vanishing of this liquid-gas coexistence.
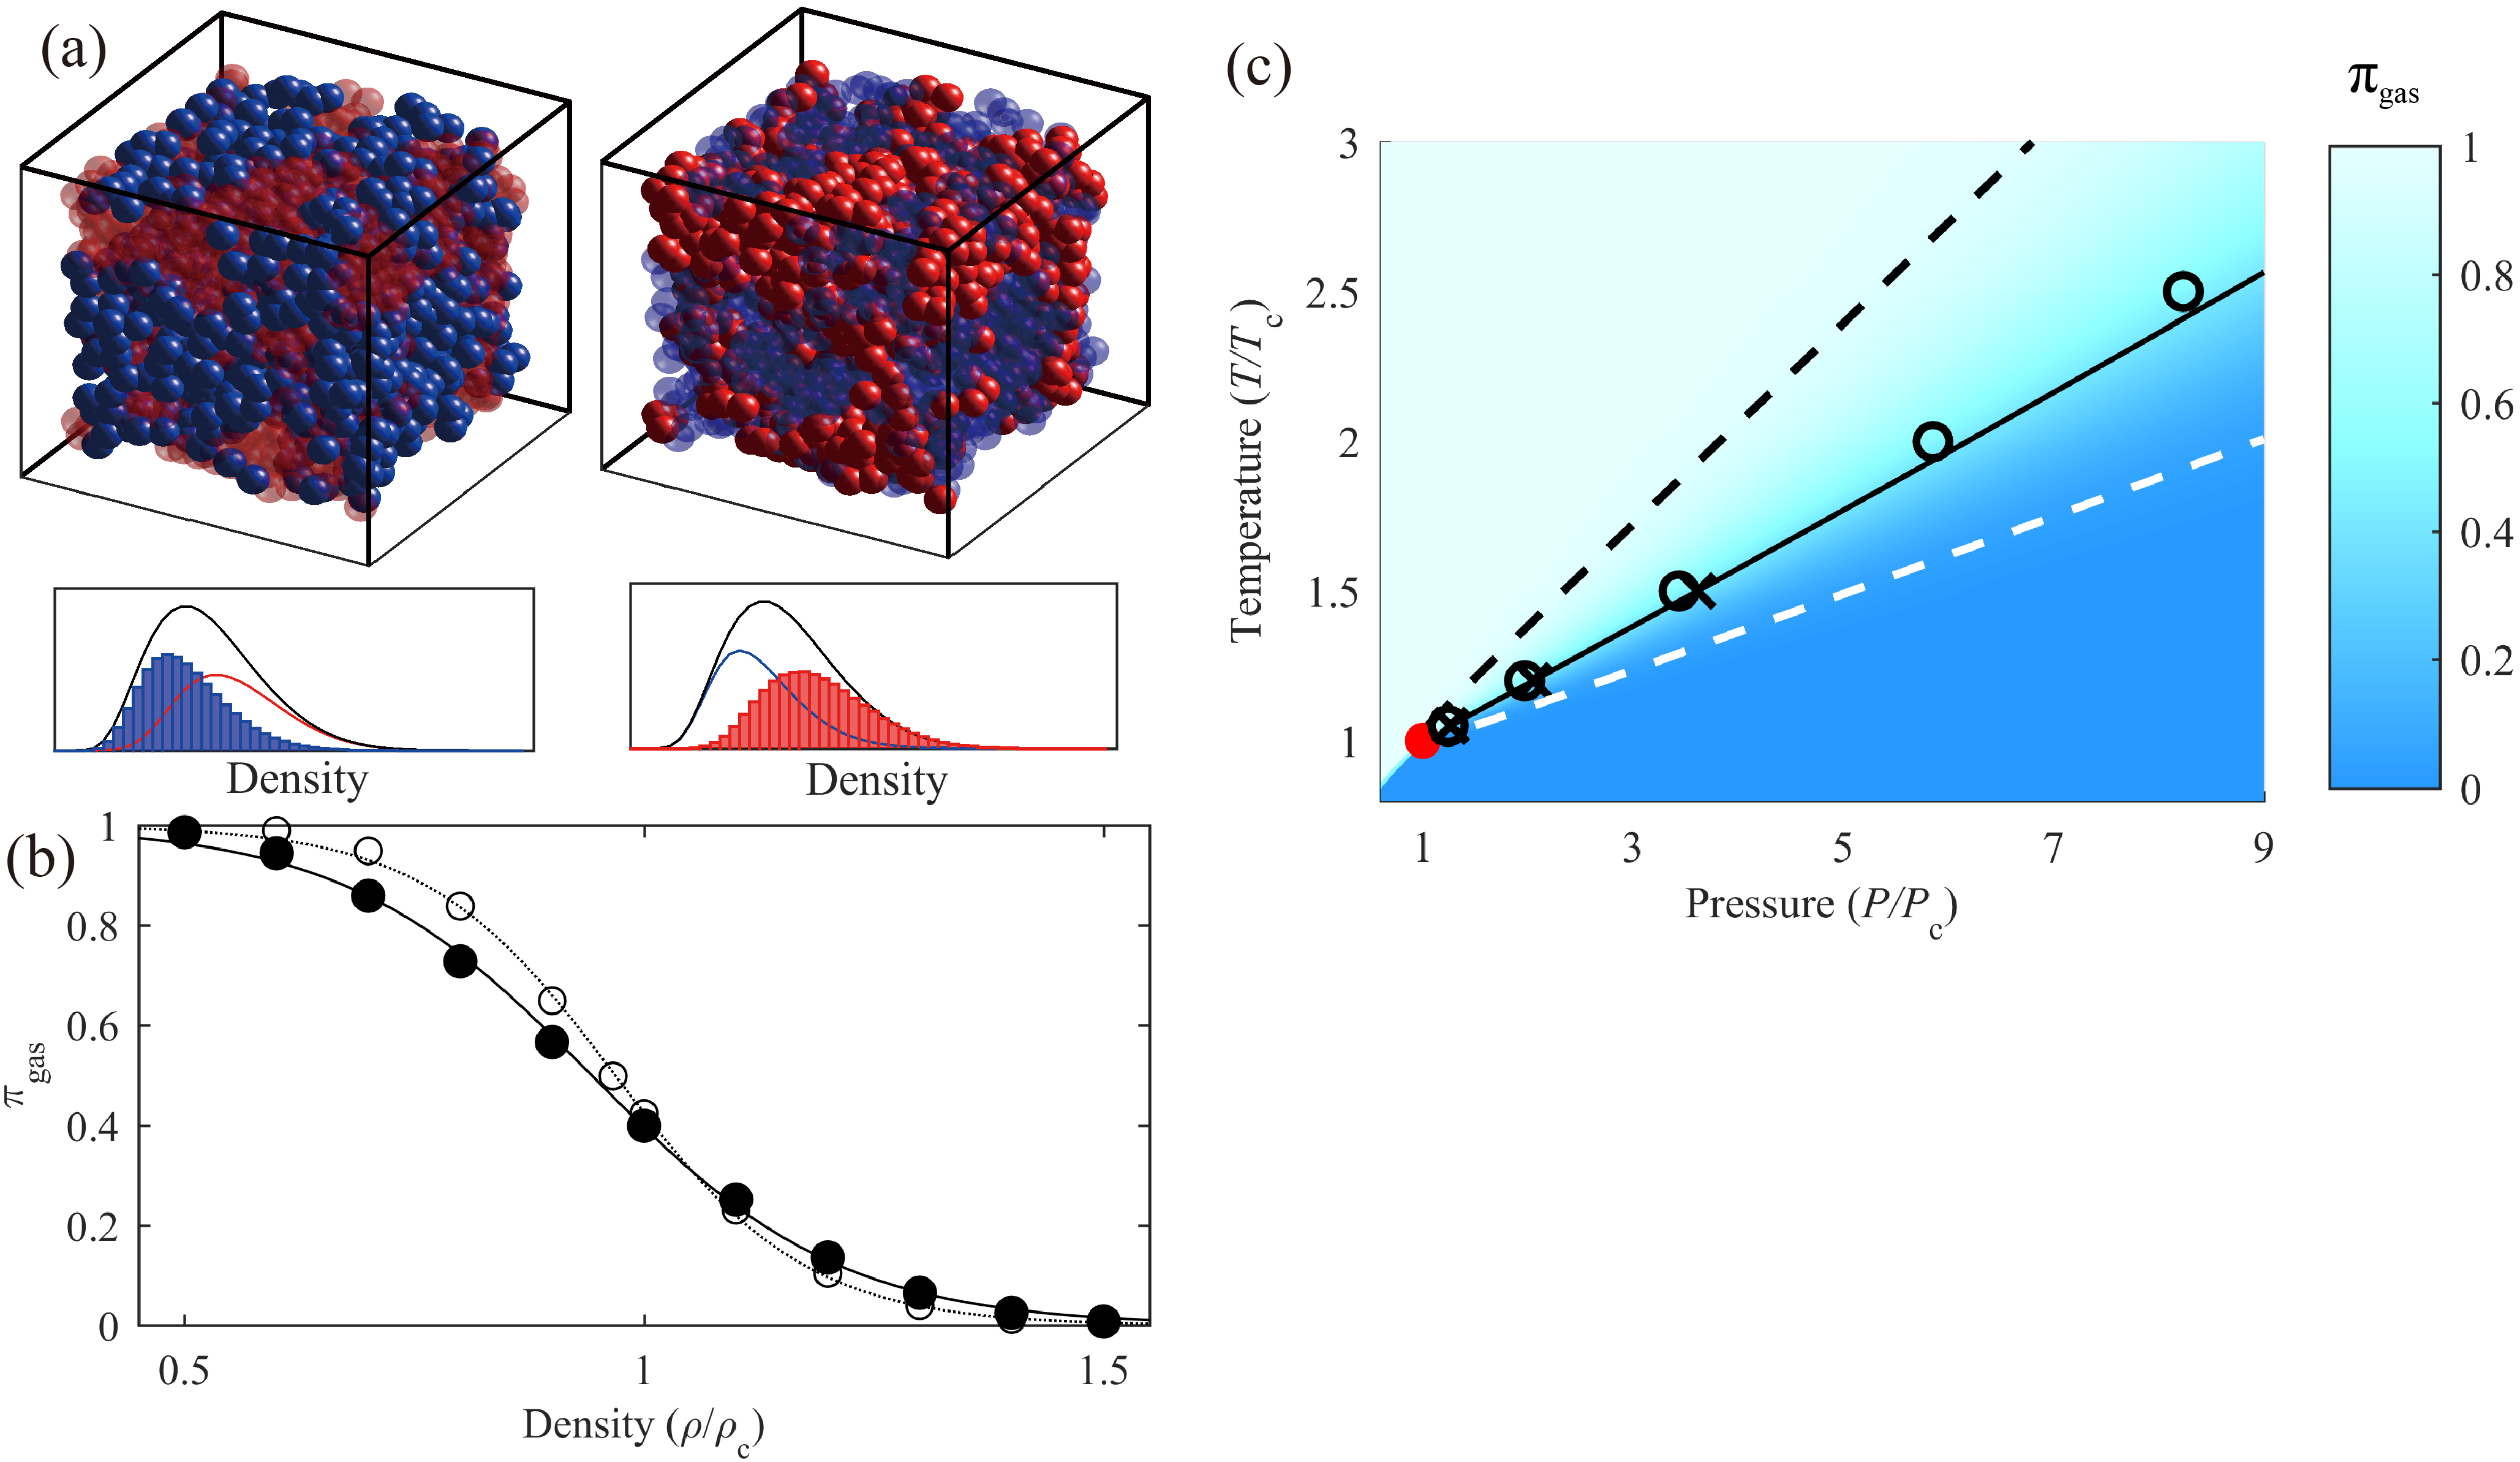
The deltoid coexistence region emanates from the critical point, akin to a river delta emanating at the river mouth. One may therefore call it the “Widom delta”, and a representative example is shown in Fig. 1(c). We propose that the anomalous behavior of the SCF at the tip of the delta, close the LGCP, has its roots in the fluctuation between liquid-like and gas-like microstates.
Methods: Machine learning.– Since liquid-like and gas-like particles are mixed in a single phase of SCF, the local states cannot be classified by standard order parameters, such as the density in liquid-vapor phase transition. To overcome this obstacle, we adopted a machine learning approach using deep neural networks (DNN), which allows us to capture subtle structural features by combining multiple parameters of local arrangement Behler2007GeneralizedSurfaces ; Cubuk2015IdentifyingMethods ; Schoenholz2015ALiquids ; Carrasquilla2016MachineMatter ; vanNieuwenburg2017LearningConfusion . The DNN was trained with local structure data of near-critical liquid and gas particles, acquired from molecular dynamics (MD) simulation of Lennard-Jones (LJ) fluid at . The training and validation accuracies were , implying effective training and generalization (see further details in the Supplementary Material).
Results: the Widom delta.– To map and characterize the coexistence region, we employed the trained DNN to label individual particles in supercritical LJ fluid as liquid-like or gas-like. A representative snapshot is shown in Fig. 1(a), where the two types of particles form distinct domains: microstates of intertwined clusters, which are not phase-separated nor uniformly mixed. Keeping in mind that no collective input was used to train the DNN, but only the labels of individual particles, the patterns observed in the simulation hint for an underlying physical origin of the particle-based classification. Moreover, these structural patterns suggest that liquid-like clusters are the origin of local density augmentation, a hallmark of the SCF lewis2001local .
We further examined the supercritical coexistence in terms of a simplified two-state model: The SCF is partitioned into fractions of gas-like particles and of liquid-like particles. The overall free energy of the SCF, , augments the energy with the entropy of mixing,
| (1) |
where and are the energies of the two states. In equilibrium, minimization of yields the familiar Fermi-Dirac distribution,
| (2) |
where . Near the critical point, we may expand around the critical pressure and density (at constant temperature), and obtain a sigmoidal curve of the fraction as a function of the bulk density, ,
| (3) |
where and are fit parameters (Fig. 1(b)). Despite the simplicity of the coarse-grained two-state model, it exhibits excellent fit () up to a temperature . This demonstrates a well-defined dependence of and on the density (or the pressure).
We note that we previously applied a statistical mixture model to examine the possibility of supercritical coexistence in Yoon2017MonteTessellation ; Yoon2017MolecularNaphthalene . However, we could not directly observe any inhomogeneity because we were unable to assign individual molecules to microstates. In contrast, the present machine-learning approach can label every molecule as liquid-like or gas-like, and both thermodynamic and kinetic characteristics of the microstates can be quantified and compared:
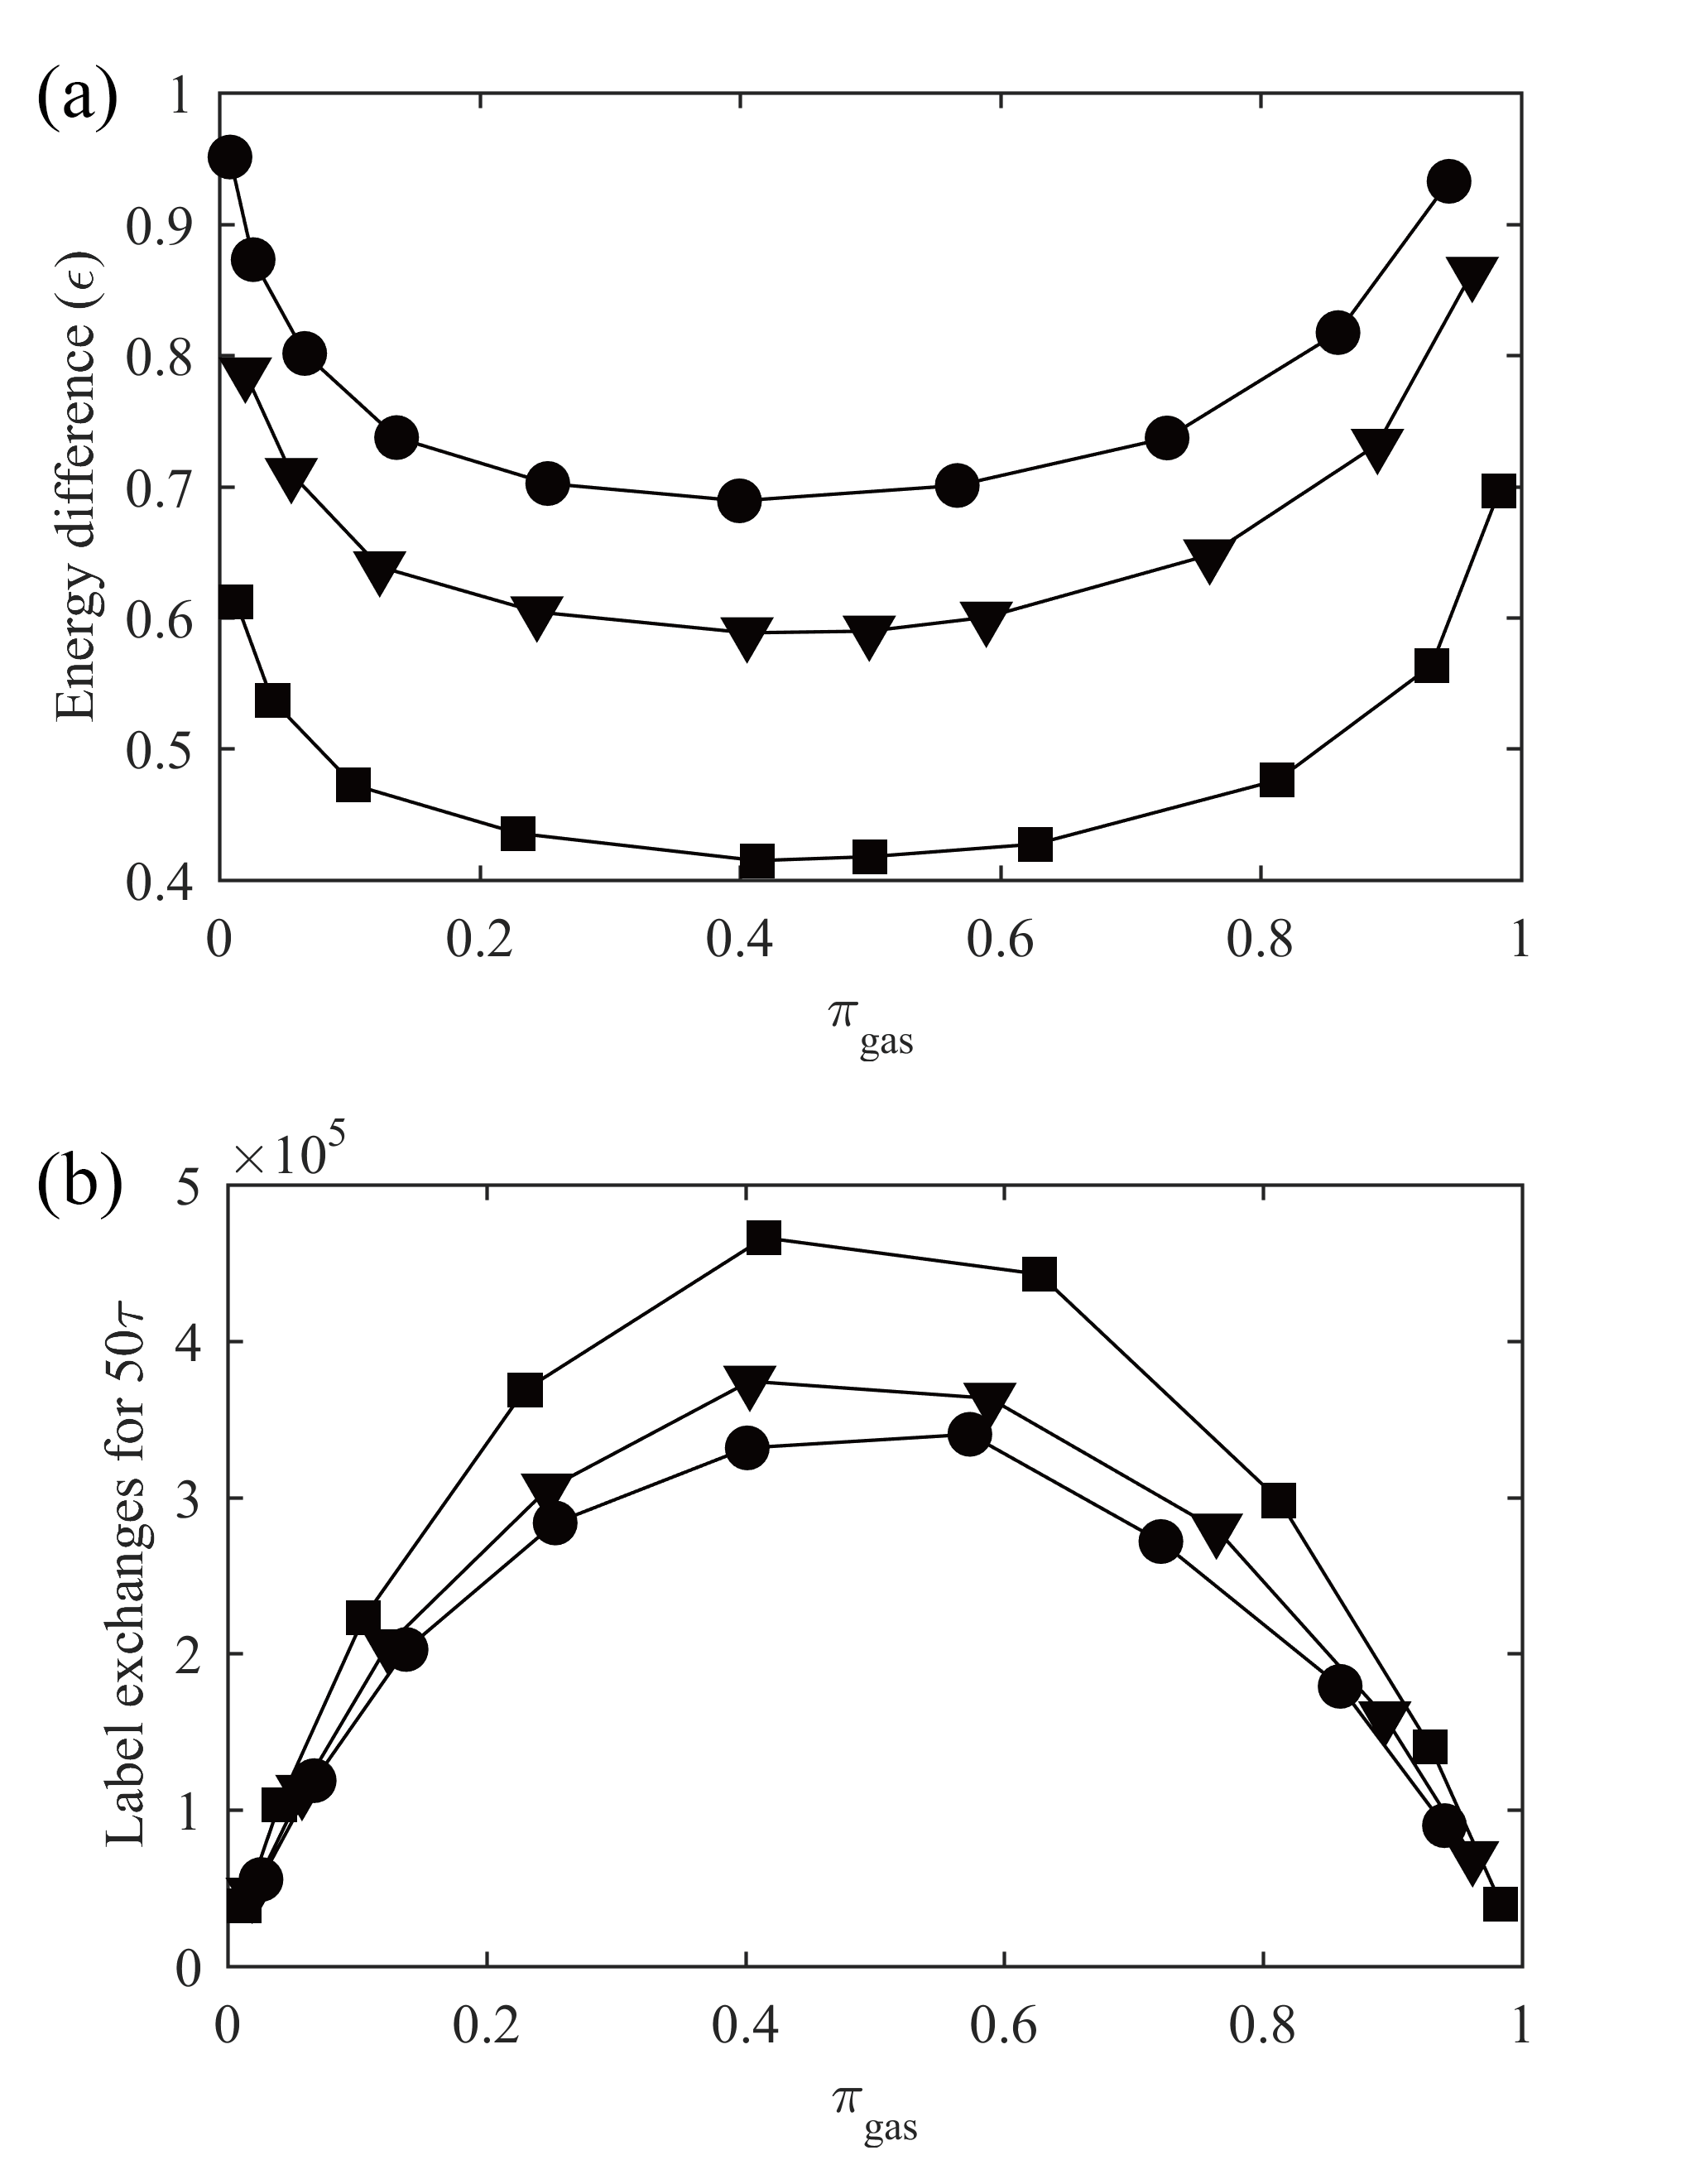
Isotherms of the potential energy difference between liquid-like and gas-like particles exhibit minima near (Fig. 2(a)). The lower energy barrier induces higher rates of exchange between liquid-like and gas-like particles, which are indeed most frequent in this region (Fig. 2(b)). The fluctuations between the supercritical microstates are most vigorous at the loci of , and decay towards the pure states, (liquid) or (gas). Owing to the low energy barrier at the point, the fluid becomes most susceptible to perturbations.
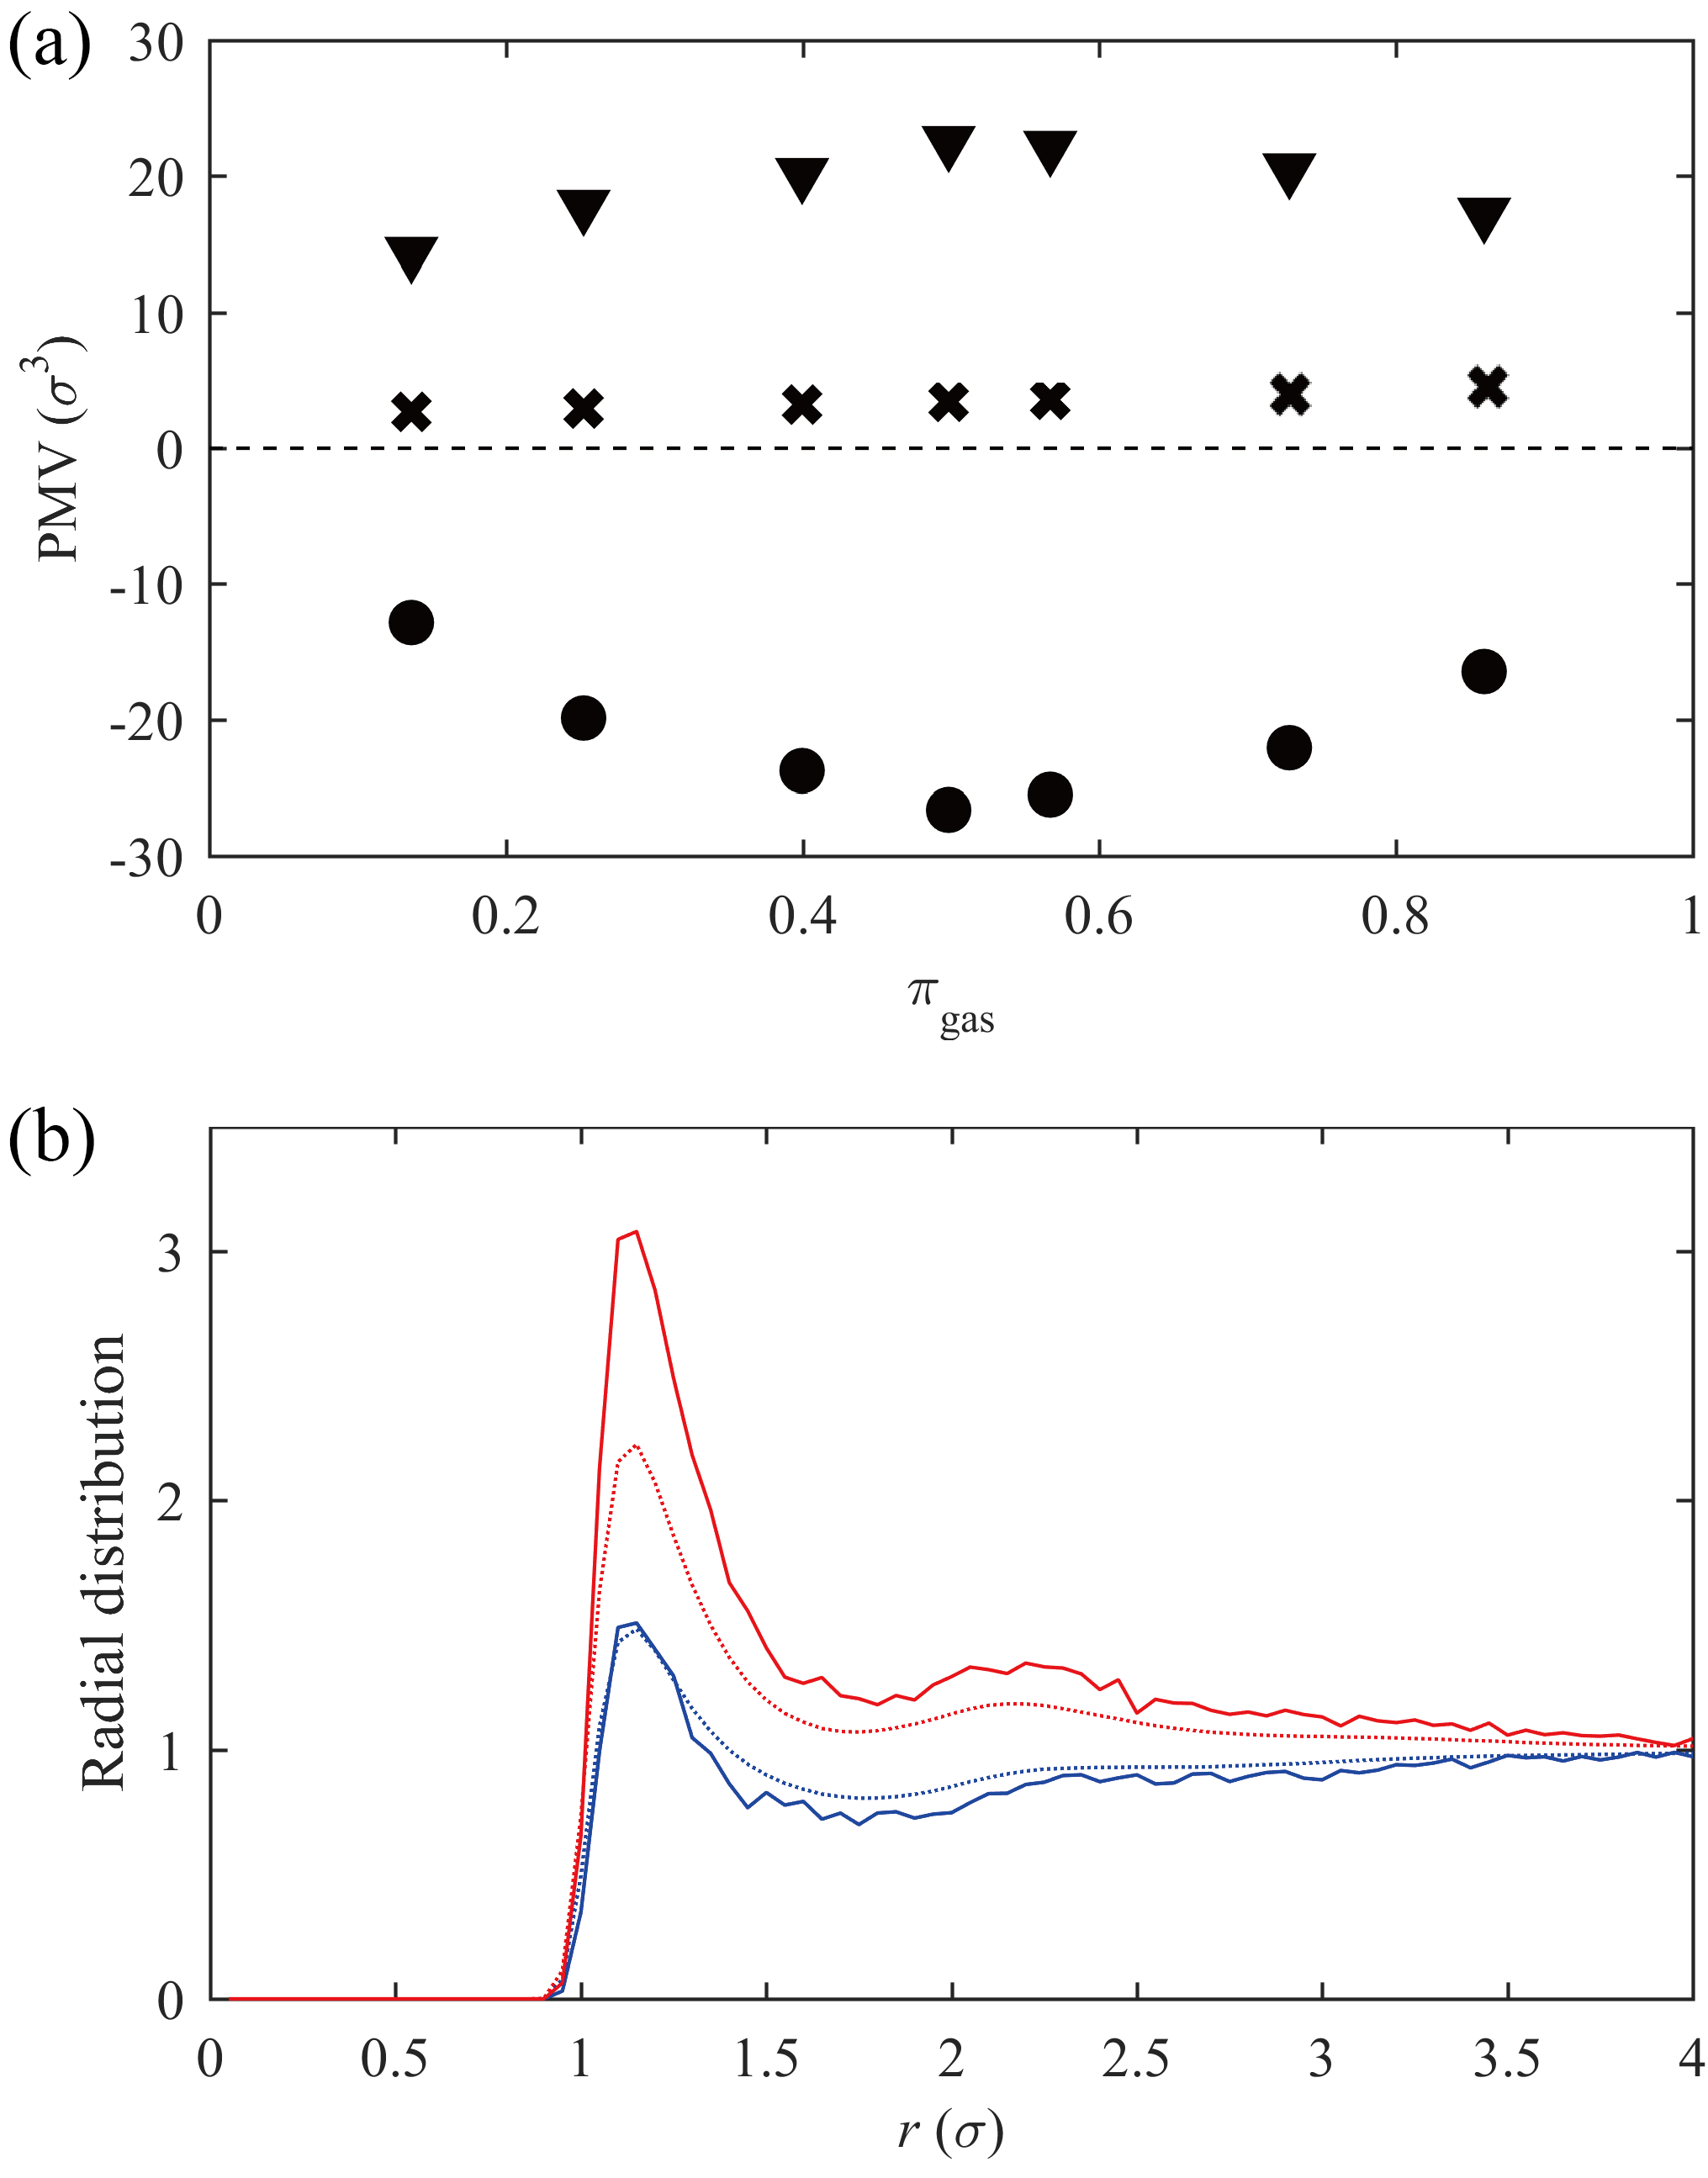
Next, we test the possible link between the coexistence and anomalous behavior of the SCF. One such hallmark of supercritical solutions is the divergence of the solute’s partial molar volume (PMV) close to the critical point Eckert1986SoluteFluids ; Petsche1989Solute-solventInvestigation ; Zhang2002StudyCompressibility ; Zhang2002Effect ; Stubbs2005PartialStudy . In particular, the PMV of attractive solutes is known to exhibit largely negative PMV, i.e. the total volume of the solution substantially decreases upon the addition of solute. Within the supercritical coexistence scenario, one may interpret this phenomenon as the transition between microstates induced by an external perturbation, namely, the addition of solutes. Thus, we expect to observe extrema of PMV around . Fig. 3(a) is consistent with this prediction, and shows that the PMV magnitude of both the attractive and repulsive solutes are indeed maximal at .
The anomalous behavior shows also a structural manifestation in the radial distribution functions (RDF) of liquid-like and gas-like solvent particles around solvent and solute particles (Fig. 3(b)). The concentration of liquid-like particles was greatly enriched around an attractive solute. This could be the result of an effective pressure exerted by the solute, which may induce the transformation of nearby gas-like solvent particles into liquid-like particles. This mechanism induces negative PMV and increases the density.
To conclude, it appears that the point of is where (i) the fluctuation between microstates is most vigorous, and as a result (ii) the fluid is most susceptible. The latter implies that the thermodynamic response functions should have their local maxima at . This leads us to suggest an alternative, practical definition of the the Widom line as the locus of . Fig. 1(c) depicts the phase diagram of LJ fluid, where the -Widom line (maximal isobaric specific heat), the critical isochore, and the line of are shown. It was previously demonstrated that the -Widom line of LJ fluid follows its critical isochore Brazhkin2011WidomSystem ; Artemenko2017TheFluids , and the newly defined Widom line lies close to both. However, unlike the -Widom line which is rapidly smeared out at high temperature, the line remains observable even in the deeply supercritical region, which allows us to draw a global line in the phase diagram.
The SCF-gas and SCF-liquid boundaries can be marked by the (effective) disappearance of the liquid-gas coexistence. In Fig. 1(c), these borders are marked by the lines of (SCF-liquid) and (SCF-gas). We emphasize, however, that these values were chosen since the training accuracy was approximately , and classification beyond these lines is not robust enough. We therefore cannot exclude the possibility that the supercritical coexistence region, i.e. the Widom delta, further extends. Within the supercritical coexistence model, liquid and gas can be continuously transformed into each other by detouring the critical point. Along this pathway, the system crosses two mild boundaries without latent heat, where the smooth change of and allows one to avoid the abrupt first-order transition.
Discussion.– In the present Letter, the application of machine learning techniques demonstrates that supercritical fluid (SCF) can be seen as an inhomogeneous mixture of liquid-like and gas-like particles. Below the critical point, the liquid-gas mixture would be unstable due to large surface energy, and the vapor-liquid equilibrium (VLE) line completely separates the two phases after equilibration. But as the temperature exceeds the critical point, the VLE line broadens into a two-dimensional region (the “Widom delta”) in which the SCF emerges as an inhomogeneous mixture of coexisting liquid-like and gas-like molecules. In the Widom delta, instead of undergoing macroscopic phase separation, liquid-like and gas-like particles form microscopically intertwined domains. Hence, the emergent SCF shows mild and continuous responses to temperature and pressure variations, without latent heat or jump discontinuities.
The Widom line can be reinterpreted on a microscopic basis, as a collection of points where the proportion of liquid-like and gas-like molecules is even. Moreover, the Widom line is where the transitions between microstates are strongly enhanced, and the fluid is therefore maximally susceptible to external perturbations. This may be the origin of the bulk crossover phenomena and the local maxima of the response functions, which are reminiscent of the subcritical VLE line.
Finally, the proposed microscopic understanding of the SCF may provide insights into critical phenomena, and trigger further theoretical developments. One possible future direction is the examination of liquid-liquid criticality. The machine learning scheme can be used to capture the high-density and low-density domains in supercooled liquid, which may advance the understanding of exotic properties of ambient water.
Acknowledgements.
This work was supported by National Research Foundation of Korea, grants NRF-2015R1A2A2A01007379 and NRF-2017H1A2A1044355 (Global Ph.D. Fellowship Program), and by the Institute for Basic Science, grant IBS-R020.References
- (1) H. E. Stanley, Introduction to Phase Transitions and Critical Phenomena (Oxford University Press, 1971)
- (2) C. A. Eckert, B. L. Knutson and P. G. Debenedetti, Supercritical fluids as solvents for chemical and materials processing, Nature 383, 313–318 (1996).
- (3) E. Reverchon, Supercritical fluid extraction and fractionation of essential oils and related products, J. Supercrit. Fluid. 10, 1–37 (1997).
- (4) P. E. Savage, S. Gopalan, T. I. Mizan, C. J. Martino and E. E. Brock, Reactions at supercritical conditions: Applications and fundamentals, AIChE J. 41, 1723–1778 (1995).
- (5) H. G. Niessen and K. Woelk, ”Investigations in Supercritical Fluids”, in In situ NMR Methods in Catalysis, edited by J. Bargon and L. T. Kuhn (Springer, Berlin, Heidelberg, 2005) pp. 69–110.
- (6) L. Xu, P. Kumar, S. V. Buldyrev, S.-H. Chen, P. H. Poole, F. Sciortino and H. E. Stanley, Relation between the Widom line and the dynamic crossover in systems with a liquid-liquid phase transition, Proc. Natl. Acad. Sci. U.S.A. 102, 16558–16562 (2005).
- (7) P. F. McMillan and H. E. Stanley, Fluid phases: Going supercritical, Nat. Phys. 6, 479–480 (2010).
- (8) G. G. Simeoni, T. Bryk, F. A. Gorelli, M. Krisch, G. Ruocco, M. Santoro and T. Scopigno, The Widom line as the crossover between liquid-like and gas-like behaviour in supercritical fluids, Nat. Phys. 6, 503–507 (2010).
- (9) V. V. Brazhkin, Y. D. Fomin, A. G. Lyapin, V. N. Ryzhov and E. N. Tsiok, Widom line for the liquid-gas transition in Lennard-Jones system, J. Phys. Chem. B 115, 14112-14115 (2011).
- (10) P. Gallo, D. Corradini and M. Rovere, Widom line and dynamical crossovers as routes to understand supercritical water, Nat. Commun. 5, 5806 (2014).
- (11) S. Jeong, Y. S. Jho and X. Zhou, Micro-structural change during nucleation: From nucleus to bicontinuous morphology, Sci. Rep. 5, 15955 (2015).
- (12) J. Behler and M. Parrinello, Generalized neural-network representation of high-dimensional potential-energy surfaces, Phys. Rev. Lett. 98, 146401 (2007).
- (13) E. D. Cubuk, S. S. Schoenholz, J. M. Rieser, B. D. Malone, J. Rottler, D. J. Durian, E. Kaxiras and A. J. Liu, Identifying structural flow defects in disordered solids using machine-learning methods, Phys. Rev. Lett. 114, 108001 (2015).
- (14) S. S. Schoenholz, E. D. Cubuk, D. M. Sussman, E. Kaxiras and A. J. Liu, A structural approach to relaxation in glassy liquids, Nat. Phys. 12, 469–471 (2016).
- (15) J. Carrasquilla and R. G. Melko, Machine learning phases of matter, Nat. Phys. 13, 431–434 (2017).
- (16) E. P. L. van Nieuwenburg, Y.-H. Liu and S. D. Huber, Learning phase transitions by confusion, Nat. Phys. 13, 435–439 (2017).
- (17) J. E. Lewis, R. Biswas, A. G. Robinson and M. Maroncelli, Local density augmentation in supercritical solvents: Electronic shifts of anthracene derivatives, J. Phys. Chem. B 105, 3306-3318 (2011).
- (18) T. J. Yoon, M. Y. Ha, W. B. Lee and Y.-W. Lee, Monte Carlo simulations on the local density inhomogeneities of sub- and supercritical carbon dioxide: Statistical analysis based on the Voronoi tessellation, J. Supercrit. Fluid. 119, 36–43 (2017).
- (19) T. J. Woon, M. Y. Ha, W. B. Lee and Y.-W. Lee, Molecular dynamics simulations on the local density distribution and solvation structure of supercritical around naphthalene, J. Supercrit. Fluid. 130, 364–372 (2017).
- (20) C. A. Eckert, D. H. Ziger, K. P. Johnston and S. Kim, Solute partial molar volumes in supercritical fluids, J. Phys. Chem. 90, 2738–2746 (1986).
- (21) I. B. Petsche and P. G. Debenedetti, Solute-solvent interactions in infinitely dilute supercritical mixtures: A molecular dynamics investigation, J. Chem. Phys. 91, 7075–7084 (1989).
- (22) J. Zhang, X. Zhang, B. Han, J. He, Z. Liu and G. Yang, Study on intermolecular interactions in supercritical fluids by partial molar volume and isothermal compressibility, J. Supercrit. Fluid. 22, 15–19 (2002).
- (23) X. Zhang, L. Gao, Z. Liu, J. Zhang and B. Han, Effect of size and polarity of solutes on partial molar volumes and intermolecular interaction in supercritical fluids, J. Supercrit. Fluid. 23, 233–241 (2002).
- (24) J. M. Stubbs, D. D. Drake-Wilhelm and J. I. Siepmann, Partial molar volume and solvation structure of naphthalene in supercritical carbon dioxide: A Monte Carlo simulation study, J. Phys. Chem. B 109, 19885–19892 (2005).
- (25) S. Artemenko, P. Krijgsman and V. Mazur, The Widom line for supercritical fluids, J. Mol. Liq. 238, 122–128 (2017).