Magnetic Flux Cancelation as the Trigger of Solar Coronal-Hole Coronal Jets
Abstract
We investigate in detail the magnetic cause of minifilament eruptions that drive coronal-hole jets. We study 13 random on-disk coronal hole jet eruptions, using high resolution X-ray images from Hinode/XRT, EUV images from SDO/AIA, and magnetograms from SDO/HMI. For all 13 events, we track the evolution of the jet-base region and find that a minifilament of cool (transition-region-temperature) plasma is present prior to each jet eruption. HMI magnetograms show that the minifilaments reside along a magnetic neutral line between majority-polarity and minority-polarity magnetic flux patches. These patches converge and cancel with each other, with an average cancelation rate of 0.6 1018 Mx hr-1 for all 13 jets. Persistent flux cancelation at the neutral line eventually destabilizes the minifilament field, which erupts outward and produces the jet spire. Thus, we find that all 13 coronal-hole-jet-driving minifilament eruptions are triggered by flux cancelation at the neutral line. These results are in agreement with our recent findings (Panesar et al., 2016b) for quiet-region jets, where flux cancelation at the underlying neutral line triggers the minifilament eruption that drives each jet. Thus from that study of quiet-Sun jets and this study of coronal hole jets, we conclude that flux cancelation is the main candidate for triggering quiet region and coronal hole jets.
1 INTRODUCTION
Solar coronal jets are dynamic, evanescent and beam-like structures that often appear bright in coronal images (Raouafi et al., 2016). Regardless of the solar cycle jets are a pervasive solar phenomena, with some reaching heights of several hundred km in EUV and X-ray images (Shimojo et al., 1996; Savcheva et al., 2007; Shibata et al., 2007). White light jets, at least some of which are correlated with coronal jets, can reach several (e.g. Wang et al., 1998; Ko et al., 2005). They occur in all types of solar environments: active regions (Shibata et al., 1992; Panesar et al., 2016a; Sterling et al., 2016), quiet regions (Innes et al., 2016; Panesar et al., 2016b) and coronal holes (Nisticò et al., 2009; Sterling et al., 2015). Jets are more prominent and often seen best in coronal-hole regions because the jet plasma is observed in emission against a dark coronal background in EUV and X-ray images (Cirtain et al., 2007; Sterling et al., 2015).
| Event | Date | TimeaaApproximate time of JBP brightening in AIA 94 Å images. | LocationbbApproximate location of the jet-base region during the eruption onset. | Jet SpeedccPlane-of-sky speed along the jet spire. Speeds and uncertainties are measured from AIA 171Å time-distance maps. | Jet Dur.ddDuration of jet spire visibility in 211 Å images. | Jet-BaseeeMeasured within 30–60 minutes before the jet eruption. | XRTffHinode/XRT jet data coverage. | valuesgg Average flux () values of the minority flux clumps 3-4 hours before jet eruption. | % of hhFlux change between 3-4 hours before jet eruption and 0-2 hours after eruption. |
|---|---|---|---|---|---|---|---|---|---|
| No. | (UT) | Helio. Cord. | (km s-1) | (minutes) | Width (km) | Coverage | 1019 Mx | Reduction | |
| J1 | 2012 Jul 02 | 02:11 | N21, W07 | 651.5 | 102 | 225001500 | No | 1.5 | 334.5 |
| J2 | 2015 Aug 18 | 13:07 | N27, E02 | 4020 | 123 | 97001000 | Yes | 0.9 | 3110 |
| J3 | 2015 Dec 28 | 09:54 | N36, E19 | 11040 | 71 | 13000900 | No | 0.9 | 48 9.0 |
| J4 | 2015 Dec 28 | 16:02 | N37, E03 | 357 | 111 | 120002500 | No | 1.2 | 525.0 |
| J5 | 2015 Dec 30 | 15:14 | N36, W23 | 7030 | 71 | 67001000 | No | 0.7 | 43 10 |
| J6 | 2015 Dec 31 | 19:04 | N43, W34 | 274 | 61 | 6600500 | No | 0.6 | 41 8.5 |
| J7 | 2016 Jan 01 | 11:45 | N08, E30 | 305 | 81 | 185003500 | No | 0.7 | 52 6.5 |
| J8 | 2016 Jan 01 | 18:11 | N41, E39 | 20470 | 41 | 1200500 | No | 0.5 | 37 10 |
| J9 | 2016 Apr 21 | 06:15 | S01, E12 | 24070 | 81iiSpire is clearly visible in XRT images but not visible in the AIA images. The given duration and speed is measured from the XRT images. | 10500700 | Yes | –jjfootnotemark: | – |
| J10 | 2016 Sep 15 | 23:36 | S06, E00 | –kkSpire is too faint to measure the speed. | 61ll The given duration is based on both XRT and AIA images. | 190002000 | Yes | –mmfootnotemark: | – |
| J11 | 2017 Jan 03 | 14:59 | N20, E02 | 10530 | 61 | 187006000 | Yes | 1.6 | 335.5 |
| J12 | 2017 Jan 04 | 09:26 | N24, W03 | 9230 | 153 | 95001000 | Yes | 2.0 | 73 5.0 |
| J13 | 2017 Jan 04 | 17:08 | N19, W10 | 10330 | 41 | 7000500 | Yes | 0.9 | 218.0 |
Recent observations by Sterling et al. (2015) show that polar coronal-hole jets are driven by minifilament eruptions, and a jet bright point (JBP) appears at the location from where the minifilament erupted. Later, Panesar et al. (2016b) studied 10 on-disk quiet-region jets and found that the same minifilament-eruption idea also holds for coronal jet generation in quiet-regions. They also investigated the triggering mechanism of their quiet Sun coronal jets, and found strong evidence that progressive magnetic flux cancelation at a neutral line under the minifilament between majority-flux and minority-flux clumps eventually destabilizes the field holding the minifilament material, resulting in an outward eruption of the minifilament. In each of the 10 events Panesar et al. (2016b) found clear evidence of ongoing flux cancelation at the neutral line.
Very recently, Panesar et al. (2017) investigated the formation mechanism of quiet region pre-jet minifilaments that erupted to generate the jets that they analyzed in Panesar et al. (2016b). In (Panesar et al., 2017), they mainly investigated the longer-term magnetic field evolution that led to the formation of the pre-jet minifilaments. They found that oppositely-polarity flux patches converged and partially canceled, before and during the formation of the minifilaments over the neutral line between the converging flux patches. Continuous flux cancelation over several hours resulted in thickening and increased prominence of the minifilaments at the neutral line. Eventually, flux cancelation between the oppositely-polarity flux patches triggered each minifilament eruption, leading to the jet. In summary, from our previous study of quiet-region jets (Panesar et al., 2016b, 2017), we infer that in quiet regions magnetic flux cancelation is the main process for the build-up of the sheared and twisted field of the pre-jet minifilament, and is also the trigger of the minifilament’s eruption that makes the jet. In addition, Sterling et al. (2016, 2017) found that, at least in most cases they examined, flux cancelation resulted in active region jets.
Because Sterling et al. (2015) studied polar coronal-hole jets, their events were too close to the polar limb for reliable magnetic field investigations. Thus, from the study of polar coronal-hole jets by Sterling et al. (2015), the question of whether coronal-hole jets follow the flux cancelation idea (that flux cancelation triggers the minifilament jet eruptions) remained open. In Panesar et al. (2016b), we found in on-disk quiet regions that coronal jets originate at a neutral line between dominant-polarity flux and a patch of canceling minority-polarity flux. Because we expect to have this same arrangement of canceling dominant-polarity and minority-polarity flux at each jet base in coronal holes, we expect that on-disk coronal-hole jets work in the same fashion as on-disk quiet-region coronal jets. To test this hypothesis, here we investigate the on-disk coronal jet eruptions.
In this paper, we study the triggering mechanism of 13 randomly selected on-disk coronal-hole jets, using images from the Hinode/X-ray telescope (XRT) and from the Solar Dynamics Observatory (SDO)/Atmospheric Imaging Assembly (AIA), and using photospheric magnetograms from the SDO/Helioseismic and Magnetic Imager (HMI). We systematically track the photospheric magnetic field evolution that leads to coronal-hole jets. We find that flux cancelation is the main process that triggers the coronal-hole jet eruptions, as in quiet-region jets.
2 INSTRUMENTATION AND DATA
SDO/AIA provides full Sun images with high spatial resolution (0″.6 pixel-1, 430 km) and temporal cadence (12 s) in seven EUV wavelength bands (Lemen et al., 2012). For our investigations we use SDO/AIA EUV images (304, 171, 193, 211 and 94 Å) to view the transition-region-temperature and coronal-temperature jet plasma structures.
To study the longer-term photospheric magnetic field evolution of the jet-base region, we use line-of-sight magnetograms from the SDO/Helioseismic and Magnetic Imager (HMI; Schou et al. 2012), with high spatial resolution of 0″.5 pixel-1 and temporal cadence of 45 s (Scherrer et al., 2012).
We also use Hinode/XRT (Golub et al., 2007) data, when available, data to view the coronal-temperature jet structures. Our XRT images have a limited field-of-view and a spatial resolution of 1″.02 pixel-1, and with differing temporal cadences. XRT is sensitive to hot coronal emissions, detecting features of temperature 1.0 106 K.
We randomly selected 13 on-disk coronal-hole jets by using AIA and XRT images from JHelioviewer software (Mueller et al., 2017). All of the events and their measured parameters are listed in Table 1. Out of the 13 jets, only 6 of them (Table 1) were observed by XRT. Also, two jets (J9 and J10) were located at the boundary of a coronal-hole. The remaining 11 jets were fully inside of coronal-holes. In this paper, we will provide detailed analysis of two jets from our list of 13 jets. In Section 3, we show EUV and XRT observations for jet J11, and EUV observations for J1. The pre-jet magnetic field evolution of these two jets is discussed in Section 4.
3 Triggering of Minifilaments and Jets
3.1 Jet (J11)
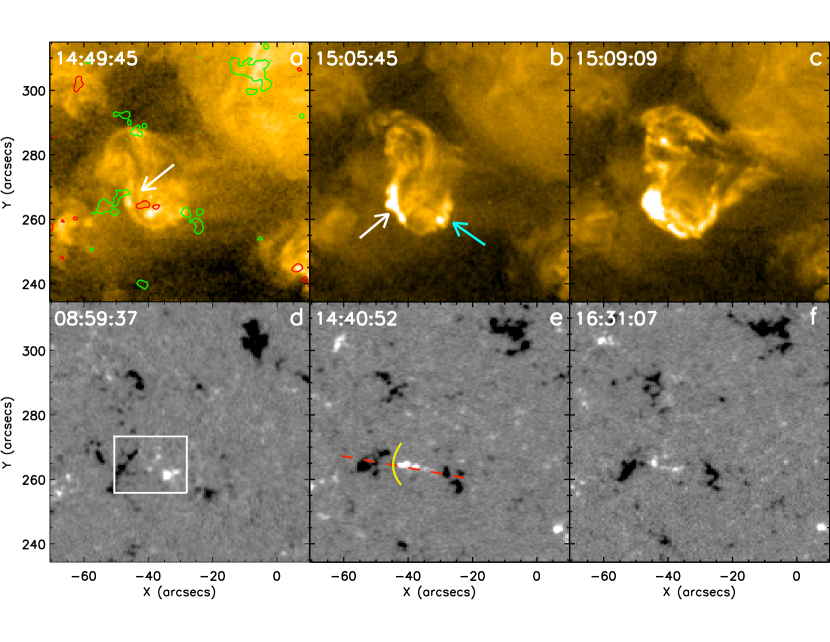
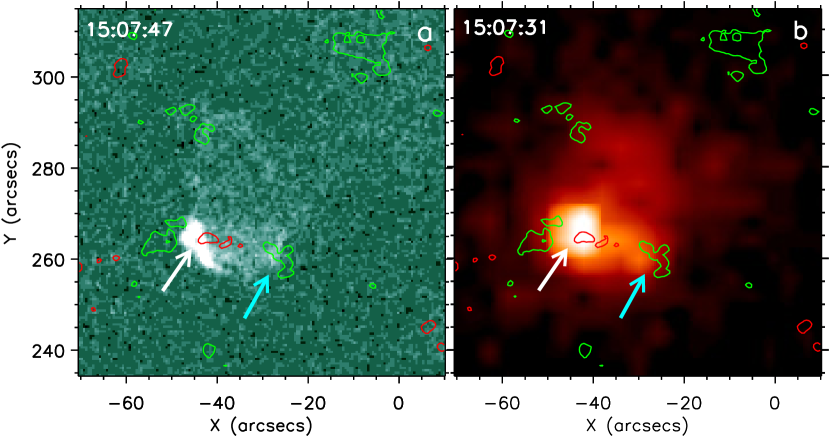
Figures 1(a)-(c) show 171 Å AIA images of the jet region with and without HMI contours. Figures 1(d)-(f) display the HMI photospheric magnetic field of the jet region. The accompanying movies (MOVIE1a and MOVIE1b) show the complete evolution of the pre-jet region. We first examine this pre-jet region in detail using AIA and XRT images. From the AIA images, we see that the minifilament was present at the neutral line at least 1-hr before the eruption onset. This coronal-hole has a dominant negative polarity, and prior to eruption (Figure 1) the minifilament resides on the neutral line (yellow line in 1e) between majority-polarity (negative) and minority-polarity (positive) flux clumps (Figures 1(a) and (d)). From about 14:59 UT, the minifilament starts moving outward from the solar surface and then a JBP (white arrow in Figure 1b) appears underneath the rising minifilament. At the same time, a JBP appears in the XRT and 94 Å AIA images (Figure 2). After 15:04 UT, the minifilament is completely ejected and becomes a part of the jet spire (Figure 1c and MOVIE1a). The minifilament moves outward with an average speed of 10530 km s-1. During the rise of the minifilament external brightenings start to appear at the far-side of the majority-polarity (negative) flux clump. The AIA hotter channels (e.g. 94 Å) and XRT images also show the signature of external brightenings at the majority-polarity negative flux clump (Figure 1(b) and Figure 2). This situation is broadly consistent with the polar coronal jet observations and schematic picture of Sterling et al. (2015). The magnetic evolution of this jet is shown in Figure 3, and will be discussed in Section 4.

3.2 Jet J1
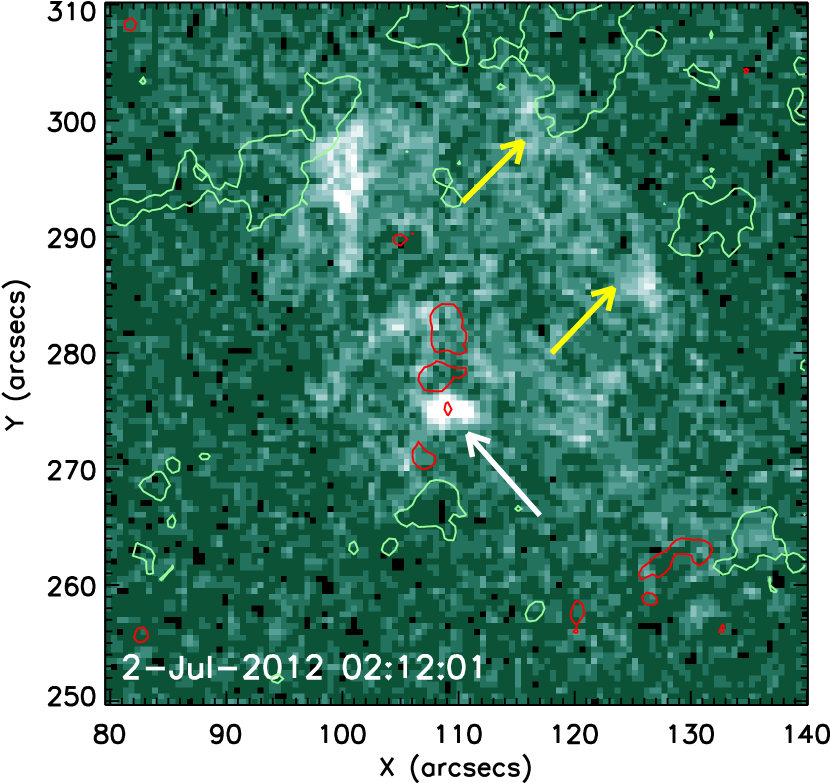
In Figure 4, we show our second detailed example of a jet, J1 from Table 1. The high cadence AIA movie (MOVIE2a) accompanying Figure 4(a)-(c) shows the evolution of the minifilament eruption and jet. This is also a dominant negative-polarity coronal-hole region. For this jet we do not have XRT coverage so in Figure 5 we only show an AIA 94 Å image during the minifilament eruption. The white arrow in Figure 4(a) points to the minifilament, which clearly lies along a neutral line between majority-polarity (negative) and minority-polarity (positive) flux clumps (Figures 4(d)-(f)). The pre-jet minifilament was seen to be at this neutral line for more than 12 hrs. A noticeable rising of the minifilament body is underway at 02:05 UT. After that the minifilament erupts abruptly from the solar surface, with an average speed of 651.5 km s-1, and the JBP turns on. Figure 4(b) and Figure 5 show that the JBP sits the neutral line where the minifilament was rooted before the eruption. Within 10 minutes, the AIA 171 Å images show that the cool minifilament material has been completely ejected along a broad spire. Thus this jet, and also the other remaining jets of Table 1, consistent with the definition of blowout jets given by Moore et al. (2010, 2013). This jet has the largest jet-base width (225001500 km, Table 1) among the 13 jets. Moreover, a huge external brightening also appears at the (negative) majority-polarity flux clump (shown by the turquoise arrows in Figure 4b and yellow arrows in Figure 5). The magnetic evolution of this jet is shown in Figure 6, and will be discussed in Section 4.
4 Magnetic Flux cancelation under the Minifilaments
Figures 1(d)-(f) present line of sight magnetograms of the jet J11 region: (d) 6 hr before the eruption onset, (e) during the eruption onset, and (f) after the eruption onset of jet J11. The HMI magnetograms and movie (MOVIE1b) clearly show flux convergence and cancelation at the neutral line throughout the observation period.
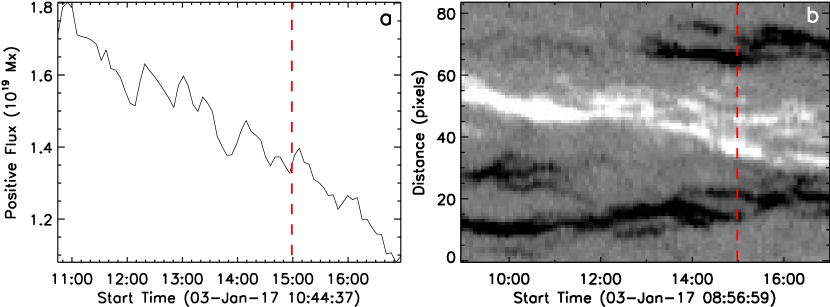
To see the longer-term evolution of the magnetic flux quantitatively we measure the (positive) minority-polarity flux of the jet region (J11) as a function of time, in the white box region of Figure 1d. Here, and with all our jets, we only measured the minority-polarity flux because it could be well isolated to avoid flows of flux of the selected polarity across the boundaries of the box. Figure 3a shows the integrated magnetic flux curve as a function of time. It shows a trend of continuous decrease in the positive flux for 6 hr, which is clear evidence of flux cancelation. The persistent flux cancelation at the neutral line finally triggers the minifilament eruption at 14:59 UT; the eruption time is indicated with the red dashed line in Figure 3a. We notice that in weak field regions, tiny grains of flux coalesce to make dense flux clumps; these likely are the cause of the small bumps in the flux curve (e.g. at 12:10 UT).
Figure 3b displays the magnetic field evolution of the jet region over a time period of 8 hr, as a time-distance map of the magnetic field along the red dashed line of Figure 1e. One can clearly see that the two polarities converge towards the neutral line and cancel with each other. In addition, there are some weak flux clumps close to the neutral line (that are not visible in the time-distance map) where flux cancelation goes on throughout the time period (e.g. at 10:49, 11:47, and 12:24 UT in MOVIE1b). Apparently, this continuous flux cancelation destabilizes the field holding the minifilament, resulting in its eruption. This behavior is in agreement with the quiet region jet eruptions presented by Panesar et al. (2016b).
We can see in Figures 3a and 3b that the flux continues to cancel even after the jet eruption; it goes on until the minority-polarity flux has completely disappeared. In cases where minority-polarity flux remains after a jet and continues to cancel, there is a possibility of reformation of the minifilament. For example in jet J3 the eruption occurs at 09:54 UT, and after that flux continued to cancel, resulting in the reformation/reappearance of the minifilament at the same neutral line and a second eruption at 11:30 UT (the second jet eruption is not included in Table 1). The jetting stops only when the minority-polarity flux patch has fully canceled (Panesar et al., 2017).
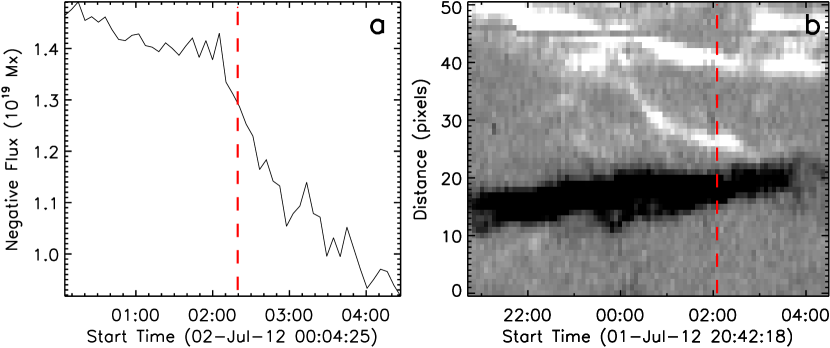
Figure 6a shows the integrated negative flux curve as a function of time for jet (J1). In this case we have measured the negative flux that was embedded inside the white box region of Figure 4e. There is a continuous drop in the negative flux, especially over 02:00 - 03:00 UT (Figure 6a and MOVIE2b), which is a clear indication of flux cancelation between the opposite polarity flux patches. Similarly, the flux cancelation is apparent in the HMI time-distance flux map of Figure 6b, leading to the minifilament eruption and jet onset at 02:11 UT (red dashed line of Figure 6).
4.1 Flux Reduction
Each of the 13 coronal jets clearly shows progressive flux cancelation, and this apparently triggers the minifilament eruptions leading to the jets. The opposite-polarity flux patches were seen to approach the neutral line beginning several hours (at least 3-4 hours, in some cases more than 3-4 hours e.g. in jet J11) before the eruptions. In order to obtain an estimate of the flux-reduction percentage for each eruption, we measured the average flux values 3-4 hours before the eruption and 0-2 hr after the eruption (Table 1). We find that the flux clumps cancel with a flux loss of 20% - 75% from before to after the jet eruption. For quiet-region jets (Panesar et al., 2016b), the flux reduction was similar, 20% - 60% from before to after the jet eruption.
We also calculated the average cancelation rate for our 13 events and found it to be 0.6 1018 Mx hr-1. We can compare this with the quiet region jets of Panesar et al. (2016b) by revisiting the flux data of Panesar et al. (2016b). We examined flux plots of all events of Table 1 of that paper, using the same procedure as above and we find that the average cancelation rate is 1.5 1018 Mx hr-1 for quiet region jets. In active region jet eruptions the flux cancelation rate was higher yet, 1.5 1019 Mx hr-1 (Sterling et al., 2017).
5 SUMMARY AND DISCUSSION
We have examined the triggering mechanism of 13 on-disk coronal-hole jets. In each of the 13 events we find that a minifilament is present at a neutral line where the jet occurs, and that flux cancelation at that neutral line apparently triggers the minifilament eruption driving the jet. These observations confirm that ondisk coronal-hole jets behave similar to ondisk quiet-region jets, which are also seen to erupt due to continuous flux cancelation at a neutral line underneath a minifilament that erupts to drive them (Panesar et al., 2016b). Thus the schematic proposed by Panesar et al. (2016b) is also valid for the coronal-hole pre-jet minifilament eruptions because the overall idea is the same.
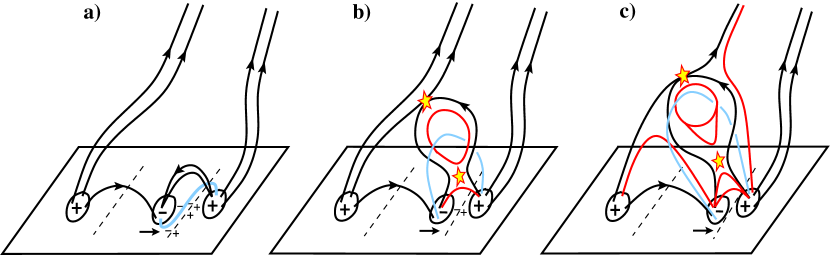
Figure 7 shows an embellished version of the schematic from Panesar et al. (2016b) for the trigger of quiet region pre-jet minifilament eruptions. A minority-polarity (negative field) flux patch resides in the dominant majority-polarity (positive) flux region and a minifilament (shown in blue color) sits at the neutral line of a small bipole (right hand side). The small (explosive) bipole contains a highly sheared and twisted field that holds the cool-minifilament material. In Figure 7a, the minority-polarity and majority-polarity flux patches are well separated from each other, as in the HMI magnetograms well before the jet occurrence (Figures 1 and 4). But flux cancelation is already occurring continuously among weak flux grains that are closer to the neutral line (this is the embellishment of the schematic of Panesar et al. 2016b) than are the large flux patches. Eventually, the large flux patches also start to converge, and the continuous flux convergence and cancelation at the neutral line eventually destabilizes the field that carries the minifilament material and it erupts outward. This drives the internal reconnection (lower star in (b) and (c)) that occurs in the legs of the erupting minifilament field, forming a JBP (low-lying red loop in (b) and (c)). The JBP appears at the location of the minifilament before the eruption (also see Figures 2 and 5). The outer envelope of the erupting minifilament field undergoes driven reconnection (known as external/interchange reconnection) with the impacted oppositely-directed open (or far-reaching) coronal field lines (upper star in (b) and (c)). The external reconnection produces two new magnetic connections: the red closed loop over the large bipole in (c) and the red open field line in (c). Hot material (heated in the reconnection process) and cool minifilament material escape along the newly-reconnected open field lines and appear as the jet spire. The EUV and X-ray images also show the signature of external brightenings at the far end of the majority-polarity flux clump (Figures 2 and 5).
We now consider the origin of the minority-polarity flux patch that undergoes cancelation at the neutral line to build the magnetic field holding the minifilament. We find that either flux coalesces to form the minority flux clump; or there is an emergence of new bipole, and the minority-polarity foot of the bipole starts canceling with nearby pre-existing majority-polarity flux. The continuous cancelation between the opposite-polarity flux patches and flux grains eventually destabilizes the field holding the minifilaments resulting in the minifilament eruption that generates the jet. This matches the picture presented by Moore & Roumeliotis (1992) for the triggering of filament eruptions in flares and CMEs by flux cancelation at the filament’s neutral line. Often, flux continues to cancel even after the jet occurs and only stops when the minority flux patch has completely canceled. These results are consistent with other recent observations of jets resulting from magnetic flux cancelation (e.g. Hong et al., 2011; Huang et al., 2012; Adams et al., 2014; Sterling et al., 2016, 2017).
Among the six of our jets with XRT coverage, all except jet J9 have a corresponding EUV jet. Jet J9 is the only one that lacks a detectable corresponding EUV jet in any of the AIA channels; in the AIA images, only the JBP is visible. The observed jet speed (24070 km s-1, from XRT images) for J9 is higher than the speeds measured from AIA 171 Å images for the remaining jets. That XRT-measured speed for jet J9 is in agreement with the speeds of XRT coronal-hole jets observed by Cirtain et al. (2007). We do not have enough temporal cadence for the remaining XRT jets to measure their speeds in the X-ray images.
The jets erupt outwards with an average speed and a standard deviation of 9560 km s-1 (about the same as for the quiet region jets of Panesar et al. (2016b)) and the average duration of the studied jets is 83 minutes. The observed jet durations are similar to those of the coronal-hole jets of Shimojo et al. (1996) and Savcheva et al. (2007). The average jet-base width is 119006000 km, which is marginally smaller than the quiet region jet-base widths (170005000111The uncertainty was misstated in Panesar et al. (2016b) as 600 km; the correct value is 5000 km. km) obtained by Panesar et al. (2016b).
Thus, our observations from this study show that flux cancelation is the trigger of coronal-hole jet eruptions. In summary, from our present study and previous studies (Panesar et al., 2016b, 2017), we conclude that in coronal-holes, as in quiet regions, flux cancelation is the fundamental process for the buildup of the sheared and twisted magnetic field in and around the pre-eruption minifilament, and for the triggering the jet-driving minifilament eruption.
References
- Adams et al. (2014) Adams, M., Sterling, A. C., Moore, R. L., & Gary, G. A. 2014, ApJ, 783, 11
- Alexander & Fletcher (1999) Alexander, D., & Fletcher, L. 1999, Sol. Phys., 190, 167
- Cirtain et al. (2007) Cirtain, J. W., Golub, L., Lundquist, L., et al. 2007, Science, 318, 1580
- Golub et al. (2007) Golub, L., Deluca, E., Austin, G., et al. 2007, 243, 63
- Hong et al. (2011) Hong, J., Jiang, Y., Zheng, R., et al. 2011, ApJ, 738, L20
- Huang et al. (2012) Huang, Z., Madjarska, M. S., Doyle, J. G., & Lamb, D. A. 2012, A&A, 548, A62
- Innes et al. (2016) Innes, D. E., Bučík, R., Guo, L.-J., & Nitta, N. 2016, Astronomische Nachrichten, 337, 1024
- Ko et al. (2005) Ko, Y.-K., Raymond, J. C., Gibson, S. E., et al. 2005, ApJ, 623, 519
- Lemen et al. (2012) Lemen, J. R., Title, A. M., Akin, D. J., et al. 2012, Sol. Phys., 275, 17
- Moore et al. (2010) Moore, R. L., Cirtain, J. W., Sterling, A. C., & Falconer, D. A. 2010, ApJ, 720, 757
- Moore & Roumeliotis (1992) Moore, R. L., & Roumeliotis, G. 1992, in Lecture Notes in Physics, Berlin Springer Verlag, Vol. 399, IAU Colloq. 133: Eruptive Solar Flares, ed. Z. Svestka, B. V. Jackson, & M. E. Machado, 69
- Moore et al. (2013) Moore, R. L., Sterling, A. C., Falconer, D. A., & Robe, D. 2013, ApJ, 769, 134
- Mueller et al. (2017) Mueller, D., Nicula, B., Felix, S., et al. 2017, ArXiv e-prints
- Nisticò et al. (2009) Nisticò, G., Bothmer, V., Patsourakos, S., & Zimbardo, G. 2009, Sol. Phys., 259, 87
- Panesar et al. (2016a) Panesar, N. K., Sterling, A. C., & Moore, R. L. 2016a, ApJ, 822, L23
- Panesar et al. (2017) —. 2017, ApJ, 844, 131
- Panesar et al. (2016b) Panesar, N. K., Sterling, A. C., Moore, R. L., & Chakrapani, P. 2016b, ApJ, 832, L7
- Raouafi et al. (2016) Raouafi, N. E., Patsourakos, S., Pariat, E., et al. 2016, Space Sci. Rev., 201, 1
- Savcheva et al. (2007) Savcheva, A., Cirtain, J., Deluca, E. E., et al. 2007, PASJ, 59, 771
- Scherrer et al. (2012) Scherrer, P. H., Schou, J., Bush, R. I., et al. 2012, Sol. Phys., 275, 207
- Schou et al. (2012) Schou, J., Scherrer, P. H., Bush, R. I., et al. 2012, Sol. Phys., 275, 229
- Shibata et al. (1992) Shibata, K., Ishido, Y., Acton, L. W., et al. 1992, PASJ, 44, L173
- Shibata et al. (2007) Shibata, K., Nakamura, T., Matsumoto, T., et al. 2007, Science, 318, 1591
- Shimojo et al. (1996) Shimojo, M., Hashimoto, S., Shibata, K., et al. 1996, PASJ, 48, 123
- Shimojo et al. (1998) Shimojo, M., Shibata, K., & Harvey, K. L. 1998, Sol. Phys., 178, 379
- Sterling et al. (2015) Sterling, A. C., Moore, R. L., Falconer, D. A., & Adams, M. 2015, Nature, 523, 437
- Sterling et al. (2016) Sterling, A. C., Moore, R. L., Falconer, D. A., et al. 2016, ApJ, 821, 100
- Sterling et al. (2017) Sterling, A. C., Moore, R. L., Falconer, D. A., Panesar, N. K., & Martinez, F. 2017, ApJ, 844, 28
- Wang et al. (1998) Wang, Y.-M., Sheeley, Jr., N. R., Socker, D. G., et al. 1998, ApJ, 508, 899