The T2K Collaboration
Measurement of inclusive double-differential charged-current cross section with improved acceptance in the T2K off-axis near detector
Abstract
We report a measurement of the flux-integrated cross section for inclusive muon neutrino charged-current interactions on carbon. The double differential measurements are given as function of the muon momentum and angle. Relative to our previous publication on this topic, these results have an increased angular acceptance and higher statistics. The data sample presented here corresponds to protons-on-target. The total flux-integrated cross section is measured to be and is consistent with our simulation.
I INTRODUCTION
T2K is an experiment located in Japan with the primary aim of studying neutrino oscillations Abe et al. (2011). It was designed to measure with high precision the disappearance channel and to discover the appearance channel.
In addition to the oscillation measurements, T2K has an ongoing program to study neutrino interactions using the near detector complex in order to improve the understanding and modeling of these interactions. Results from this program, as exemplified by those presented in this paper, are interesting in their own right and can be used to constrain and reduce the systematic errors arising from cross section uncertainties in the extraction of neutrino oscillation parameters. Inclusive measurements provide a clear signals which are very valuable to test different models.
Previously, T2K reported the measurement of the flux-integrated double differential cross section for muon neutrino charged- current interactions on carbon Abe et al. (2013a). Since that time, many improvements have been made in the analysis. The results presented in this paper were obtained with more data, reduced neutrino flux uncertainties (thanks to new NA61/SHINE measurements Abgrall et al. (2016)), increased angular acceptance, reduced background contamination and a different unfolding method. All the improvements are described in more detail below.
The paper is organized as follows: we first summarize the experimental setup in Sec. II, which contains the description of the off-axis beam, the near detector and the neutrino event generators used in the present analysis. The selection of the muon neutrino interaction samples is presented in Sec. III together with the summary of the detector systematic uncertainties. The analysis method is explained in Sec. IV and the results are given in Sec. V.
II EXPERIMENTAL APPARATUS
II.1 T2K beamline and flux prediction
The neutrino beam used by T2K is produced at the J-PARC Laboratory in Tokai, Japan. In this process, 30 GeV/c protons are extracted from the main ring accelerator at J-PARC onto a graphite target, producing secondary particles consisting primarily of pions and kaons. The hadrons exiting the target are focused by three magnetic horns and allowed to decay in a decay volume. The decaying hadrons produce neutrinos (primarily of muon flavor) that continue to the near and far detectors while the other particles range out. Depending on the polarity of the electric current in the horns, a beam composed of mostly neutrinos (-mode) or antineutrinos (-mode) and with energy peaked at 0.6 GeV is produced. The T2K beamline hardware has been described in detail elsewhere Abe et al. (2011).
The simulation that is used to predict the neutrino flux and its associated uncertainty is described in detail in Abe et al. (2013b). The uncertainties are dominated by the hadron production model and, to second order, by the beamline configuration. Currently, the uncertainty on the beam flux at the near detector varies from 10 to 15 depending on the neutrino energy. The error associated with the flux in the results presented here has been reduced with respect to that used in the previous analysis Abe et al. (2013a), in part, because the model of hadron production from the target is tuned using the full 2009 thin-target dataset by the NA61/SHINE experiment Abgrall et al. (2016). The previous analysis used the 2007 dataset Abgrall et al. (2012).
II.2 The off-axis near detector
The off-axis near detector (ND280) is made-up of two main components, the detector (P0D Assylbekov et al. (2012)) and the Tracker region. Both parts are contained in a metal basket box surrounded by electromagnetic calorimeters (ECal Allan et al. (2013)) and a warm dipole magnet. The magnet provides a 0.2 T field allowing for momentum measurement and charge separation. Outside the ECal and magnet coil is the magnet flux return yoke and the side muon range detector (SMRD Aoki et al. (2013)).
The Tracker region contains two fine-grained detectors (FGDs Amaudruz et al. (2012)) sandwiched between three gas time projection chambers (TPCs Abgrall et al. (2011)). The TPCs contain a drift gas mixture which is ionized when a charged particle crosses it. The TPCs provide excellent track and momentum reconstruction. The observed energy loss in the TPCs, combined with the measurement of the momentum, is used for particle identification.
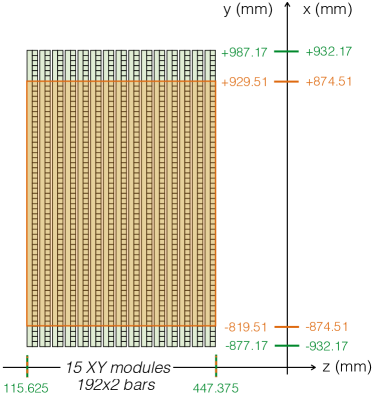
The most upstream FGD (FGD1) consists of polystyrene scintillators bars, which are oriented vertically and horizontally and perpendicular to the beam direction. FGD1 is comprised of carbon (), hydrogen () and oxygen (), where the percentages represent the mass fraction of each element. The most downstream FGD (FGD2) is similar to FGD1 except that the scintillators layers are interleaved with water layers. FGD1 is the active target in this analysis. The fiducial volume (FV) begins 58 mm inward from the lateral edges as shown in Fig. 1.
The P0D region of ND280, located upstream the Tracker region, is made of layers of plastic scintillator, water, brass and lead. In this analysis, it is used to veto interactions happening upstream of the active target.
The SMRD consists of 440 scintillator modules inserted in the air gaps between sections of the magnet flux return yoke. Horizontal (vertical) modules are composed of four (five) plastic scintillation counters. In this analysis, the SMRD is used to identify and measure the range of muons at high angles with respect to the beam direction. The range provides information about the muon momentum.
The ECal consist of 13 modules surrounding the inner detectors. The tracker module is covered by six modules in the sides (BarrelECal) and one module downstream (DsECal). The modules are made up of plastic scintillator bars interleaved with lead sheets. In this analysis, the ECal is used to complement the reconstruction of the inner detectors. As with the SMRD, it is used to measure the range/momentum of muons escaping, from inner detectors, at high angles with respect to the beam direction. In addition, electromagnetic showers and minimally ionizing tracks passing through the ECal can be identified using a multivariate analysis quantity determined by the features of the reconstructed clusters in the ECal Abe et al. (2014).
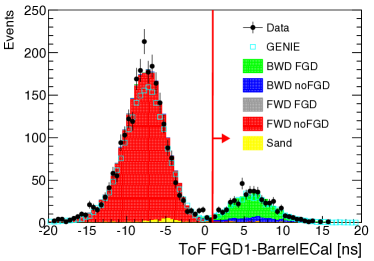
In this analysis, the timing information for particles crossing the different detectors of ND280 is used for the first time. When a particle crosses a detector composed by scintillators, the time information from each individual hit is corrected for the light propagation time inside the fibers and for the time offset of each slave clock module Abe et al. (2011). Then, the corrected time and position of the hits are used to define an average time (). Finally, the time of flight (ToF) variable (ToF) between two detectors X and Y is constructed. This information is used to determine the direction of tracks crossing the following pairs of detectors: FGD1-FGD2, FGD1-P0D, and FGD1-BarrelECal (see Fig. 2).
II.3 Event generators
Two event generators, NEUT 5.3.2 Hayato (2009) and GENIE 2.8.0 Andreopoulos et al. (2010), are used to simulate the interaction of neutrinos in the near detector and the effect of the nuclear medium on the produced particles. The modeling of the main interaction channels and their associated uncertainties is described below.
II.3.1 Charged-current interactions without pion production
Charged-current (CC) interactions without pion production are referred to here as charged-current quasi-elastic-like, or CCQE-like, interactions. The sample of such interactions is composed mainly of CCQE reactions. However, nuclear effects can cause other processes to be included in this category.
For the CCQE channel, the primary neutrino-nucleon interaction is modeled in a similar fashion by both generators. Each uses an implementation of the Llewellyn-Smith formalism Smith (1972) through Lorentz-invariant form factors (FFs). Both generators relate the vector FF to the electromagnetic FFs, for which the parametrization BBA2005 is used Bradford et al. (2006). For the axial FF, a dipole shape with =1.267 is used in both generators. However, the default axial mass parameter, , used in each generator differs. In NEUT, GeV/c2, while in GENIE, GeV/c2. Finally, they use the same pseudo-scalar FF suggested by the partially conserved axial current (PCAC) hypothesis.
The majority of the CCQE interactions take place on bound nucleons. The nuclear model differs between the two generators. In the case of GENIE, the Bodek-Richie version of the Relativistic Fermi Gas (RFG) model is used, which incorporates short range nucleon-nucleon correlations Bodek and Ritchie (1981). For NEUT, a different nuclear model is used based on the spectral functions from Benhar and Fabrocini (2000). Moreover, NEUT includes the multi-nucleon interaction (2p2h) model from Nieves et al. Nieves et al. (2011), as it is thought that interactions on more than one bound nucleon contribute significant strength to the signal relative to the single particle CCQE interaction. Pauli blocking is implemented equally in both generators (reject events with the momentum of the outgoing nucleon below the Fermi momentum of the nucleus).
The CCQE and 2p2h interactions are parametrized in NEUT with several target-dependent parameters (superscripts “C” and “O” represent parameters for carbon and oxygen targets, respectively): the quasielastic axial mass ( GeV/c2), the binding energy ( MeV and MeV), the Fermi momentum ( MeV/c and MeV/c) and the 2p2h cross-section normalization ( and ). The nominal values for these parameters and the associated uncertainties were chosen based on a study of the MINERvA and MiniBooNE datasets Wilkinson et al. (2016). Large uncertainties without correlations were assigned in order to cover the tensions between the two datasets and different nuclear models.
II.3.2 CC interactions with pion production
Pion production is treated differently in the two event generators. NEUT generates interactions with single pion production using a resonant model when GeV/c2. Single pion production above that value and the rest of pion production channels are generated with a DIS model. In contrast, GENIE does not restrict the resonant model to the single pion decay channel. This model is switched off when GeV/c2 (to avoid double counting with its DIS model). Below that value, the normalization of the single pion and two pions production channels from its DIS model are tuned.
Resonant pion production is based on the Rein-Sehgal model for both generators Rein and Sehgal (1981). In NEUT, the model uses 18 resonances taking into account their interferences. The default parameters for the FFs are taken from Graczyk and Sobczyk (2008). In contrast, GENIE incorporates 16 resonances without including interference terms and the default FFs are taken from Kuzmin et al. (2006).
The resonant model has three parameters in NEUT: the resonant axial mass ( GeV/c2), the normalization of the axial form factor for resonant pion production () and the normalization of the isospin non-resonant component predicted in the Rein-Sehgal model (). Their nominal values and associated uncertainties, with no correlation assumed, were obtained by comparison with available low energy neutrino-deuterium single pion production data Wilkinson et al. (2014).
Both NEUT and GENIE model deep inelastic scattering using the same GRV98 PDF parametrization Glück et al. (1998) including a Bodek-Yang correction to describe scattering at low . The Bodek-Yang correction differs slightly between the two generators, as NEUT uses Bodek and Yang (2003) and GENIE uses Bodek and Yang (2005). An energy dependent normalisation uncertainty ( at 4 GeV) is used based on MINOS CC-inclusive data Adamson et al. (2010).
For coherent reactions, both generators use the Rein-Sehgal model Rein and Sehgal (1983) including a correction that takes into account the lepton mass Rein and Sehgal (2007). However, the implementation of the model differs slightly. NEUT follows the prescriptions and data fit of pion scattering from Rein and Sehgal (1983), leading to different cross sections for low momentum pions. The MINERvA experiment has reported results which are consistent with coherent pion production at energies around 1 GeV Higuera et al. (2014). Considering that result, a normalization uncertainty in CC coherent interactions is included.
II.3.3 Neutral-current interactions
Neutral-current (NC) interactions affect the background prediction in this analysis. Therefore, an NC normalization parameter was included that scales elastic, resonant kaon and eta production, and DIS events. A 30 uncertainty is assigned for those channels, motivated by poor constraints from external data.
II.3.4 Hadronization and final state interactions
Hadron production and transport inside the nuclear medium are also simulated by the event generators. In this analysis, the prediction of this processes is particularly important for pions, as they contribute the main background.
The hadronization model (or fragmentation model) determines the kinematics of the primary outgoing hadrons, prior to final state interactions (FSI), given a particular interaction. In the high invariant mass region ( GeV/c2 and GeV/c2), the hadronization is simulated using the PYTHIA5 and PYTHIA6 predictions Sjöstrand (1994) in NEUT and GENIE, respectively. These predictions are unsatisfactory near the pion production threshold. So, both generators include a different phenomenological description based on Koba-Nielsen-Olesen (KNO) scaling Koba et al. (1972) in the low invariant mass region. Moreover, the transition between the two regions is handled differently between the two generators. Specifically, GENIE includes the AGKY model Yang et al. (2009) for GeV/c2 and the transition region (2.3 GeV/c2 3 GeV/c2) in which the PYTHIA model is turned on gradually.
In GENIE, several parameters affect pion kinematics. In particular, for single pion states four parameters are notable: the nucleon (), PDFs for hadronic states, the nuclear formation zone, and the pion angular distribution in resonant pion production. Their nominal values and associated uncertainties are estimated based on recommendations from the GENIE Collaboration Andreopoulos et al. (2010). These parameters are treated as uncorrelated.
Near an energy of 1 GeV, pions immersed in a highly dense nuclear medium are very likely to interact. Both generators simulate pion FSI using the intra-nuclear cascade approach, though they use different predictions for the interaction probabilities. In the case of NEUT, pion interaction probabilities are dependent on the momentum of the pion: if MeV/c, NEUT uses a density dependent model Salcedo et al. (1988) and if MeV/c the probabilities are extracted from pion-nuclear scattering experiments Ashery et al. (1981). GENIE uses a model called INTRANUKE hA which extracts the interaction probabilities from several experiments up to 300 MeV/c, while for higher energies it is based on the CEM03 predictions Mashnik et al. (2006). The uncertainties associated with the pion interaction probabilities and their correlations are estimated using the same methodology as in Abe et al. (2015).
III CC SAMPLES
This analysis uses data collected in -mode between November 2010 and May 2013. The total sample comes from protons on target (POT), which is a factor of five larger than that used in the similar previously published analysis from T2K Abe et al. (2013a).
Simulated Monte Carlo (MC) interactions within the ND280 subdetectors and magnet were generated using both NEUT and GENIE. The background interactions in the materials surrounding ND280, so-called sand interactions, were generated using NEUT. Both interactions in ND280 and in the surrounding material were generated using the same neutrino beam simulation, detector simulation and reconstruction.
In this analysis, events containing muons emanating from interactions that occur in the fiducial volume (FV) of FGD1 are selected. These events are candidate CC interactions. The events within this sample that are true CC events belong to the category referred to here as CC-.
Background events in the initial selection include: interactions not happening in the FV (either inside or outside the magnet volume, referred to as ‘out FV’ and ‘sand ’, respectively); interactions happening in the FV but not actually a CC event, referred to as noCC; or being CC but where the muon candidate track is not the outgoing muon, herein called CC-no.
The cross-section results presented here are based on the kinematics of the outgoing muon. Specifically, the results are given as a function of the muon momentum, , and the cosine of the muon emission angle with respect to the neutrino direction, . The event selection criteria and performance, as well as the systematic uncertainties associated with the detector response are described below.
III.1 Event selection
In previous T2K work on this topic, the analysis was optimized to select forward-going muons originating from FGD1 and making a long track (at least 19 clusters as described in section III.1.1) through TPC2, which is downstream of FGD1 Abe et al. (2013a). The current work aims to include the so-called high-angle tracks which miss or barely cross the TPCs, as well as long backward-going tracks in TPC1 (upstream of FGD1). The addition of backward-going muon candidates in the event selection is possible only with the introduction of timing information correlated between subdetectors.
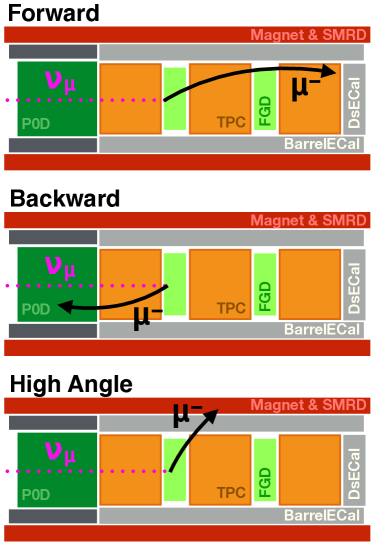
In this analysis, events are broken into samples according to the muon direction. If the muon candidate in the event goes forward (in the direction downstream of FGD1 into TPC2), the event is part of the forward (FWD) sample. If the muon goes backward (in a direction upstream of FGD1 into TPC1), the event is part of the backward (BWD) sample. Similarly, if the muon candidate in the event is at a high angle in the forward or backward direction, the event is categorized as high-angle forward (HAFWD) or high-angle backward (HABWD), respectively. In the FWD/BWD selections, the muon candidate must have long TPCs segments, while tracks with short or no TPC segment are used in the HAFWD/HABWD (see Fig. 3).
For events to be considered in this analysis, they must occur within the time window of one of the 8 beam bunches per 5 spill RF structure of the beam. The full spill is required to be of good quality. Events are resolved in time by bunch and then processed. Given the beam intensity for these runs, the frequency of multiple neutrino interactions happening in the same beam spill (so-called pile-up events) is very low. This is ignored in the sample selection and included in the systematic error treatment.
In order to avoid having multiple muon candidates, the analysis looks for candidates sequentially in the different event selections. The ordering for this process is FWD, BWD, and then the high angle categories. FWD and BWD have a higher priority than the high angle categories because the muon PID from the TPCs is more accurate than in the ECals. The FWD(HAFWD) selection has a higher priority than the BWD(HABWD) because forward-going muon happen much more often than backward-going ones.
Additionally, two control regions are selected to constrain neutral current event rates and pion final state interactions. The control regions are non-signal regions of phase space close enough to the signal region that the backgrounds are similar to that in the signal region. The backgrounds used in the model are tuned using the data observed in the control regions. The control region selection is described in section III.1.4.
III.1.1 Forward selection
The selection criteria for the FWD sample are very similar to those used previously, though some further optimization has been performed. The cuts used to extract the FWD sample are described below.
-
•
Quality and FV: This selection considers negatively charged tracks originating in the FGD1 FV which have TPC track segments containing more than 18 clustered hits in the TPC. If multiple tracks satisfy these criteria, the muon candidate is the one with highest momentum and going forward (by timing). In order to reduce the contamination from events occurring outside the FV, tracks starting in the most upstream layer of FGD1 are rejected.
-
•
Muon PID: This cut is applied to the muon candidate using discriminator functions calculated for muon, pion and proton hypotheses based on the energy loss and momentum measurement of the TPC. These functions are the same as used in the previous analysis Abe et al. (2013a). This cut rejects protons, pions and low momentum electrons (below 500 MeV/c). Moreover, two new PID cuts below have been developed in order to reduce the pion contamination of this sample (which is the main background in this analysis).
-
–
Muon FGD2 PID: High energy pions are more likely to stop in FGD2 than muons. Therefore, it is required that the muon candidate leave the FGD2 active volume with a momentum above 280 MeV/c. This is expected to reduce the pion contamination by while leading to a loss of of the muons.
-
–
Muon ECal PID: For tracks entering the BarrelECal or DsECal modules, the multivariate analysis quantity (based on the features of the reconstructed clusters in the ECal Abe et al. (2014)) is used. These tracks must have , which is estimated to reduce the pion contamination by while removing of the muons.
-
–
-
•
Veto: One of the main backgrounds in this analysis are interactions happening outside the FV. This contamination can be reduced further by using the two cuts described below:
-
–
Upstream background veto: Due to reconstruction failures and multiple scattering, a reconstructed track can be broken into two unmatched segments. One of those can have its beginning in the FV, mimicking an interaction that originates in the FV. In the previous analysis, such events were rejected if the second highest momentum track started more than 150 mm upstream of the muon candidate. This cut was found to be too restrictive because it removed events with a forward going muon and a second particle going backward. In the current analysis, the ratio between the momentum of the muon candidate and the other track is used. Ideally, if the muon candidate is a broken track, this ratio should be bigger than one since the first segment of the track has a higher momentum than the second segment. Therefore, the distance between both tracks, or segments, as well as their momentum ratio are used. Cut values are chosen that give the highest purity times efficiency.
-
–
Broken track cut: This cut rejects events where the reconstruction procedure mistakenly breaks a single track into two tracks where the first is a FGD1 segment and the second is reconstructed to begin in the last layers of FGD1 and goes through the downstream TPC module. In this mis-reconstruction pathology, the second track is considered a muon candidate. For such events, the start position of muon candidate track is within the two most downstream layers of FGD1. The broken track cut rejects these events by requiring that there be no reconstructed track with only a FGD1 segment when the start position of the muon candidate is in one of the last two layers of FGD1.
-
–
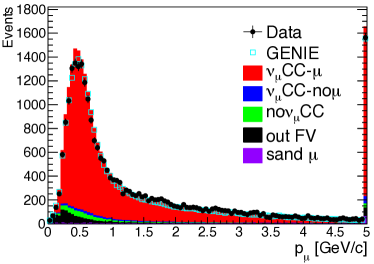
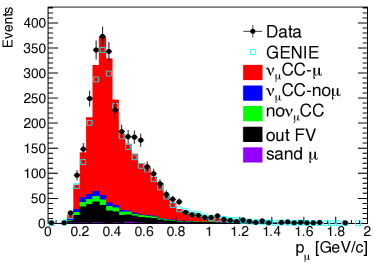
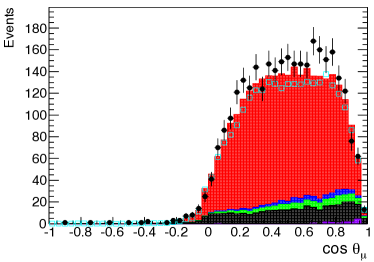
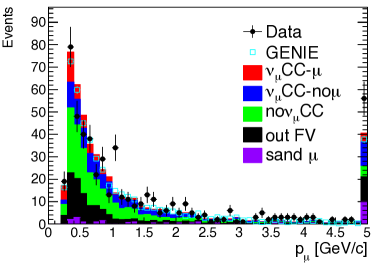
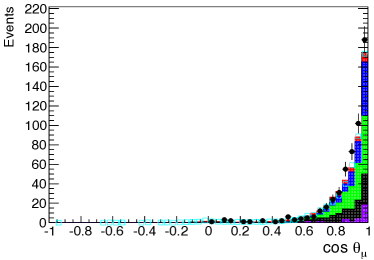
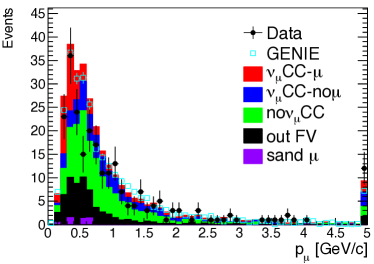
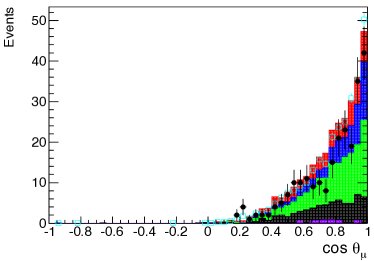
Fig. 4 shows the reconstructed kinematics for muon candidates in the FWD sample in the data together with the prediction from NEUT and GENIE.
III.1.2 Backward selection
The selection criteria for the BWD sample are described below:
-
•
Quality and FV: This selection considers negatively charged tracks originating in the FGD1 FV which have TPC track segments containing more than 18 clusters. If the event contains multiple tracks of this type, the muon candidate is the one with highest momentum and backward sense (by timing). In order to reduce the contamination from events occurring outside the FV, tracks starting in the most upstream layer of FGD1 are rejected.
-
•
Muon PID: For muon candidates in the BWD sample, the PID is based entirely on the energy loss in the TPC. The value of the cut applied is the same as that in the FWD selection. However, in this angular region the electron contamination is very low and the discriminator function used to reduce the low momentum electrons is not applied.
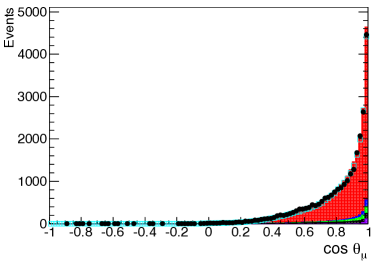
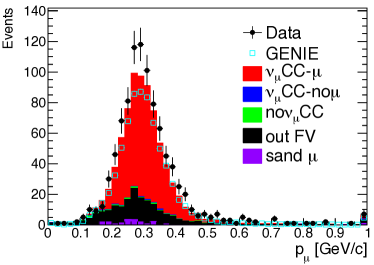
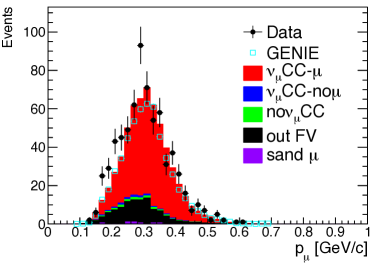
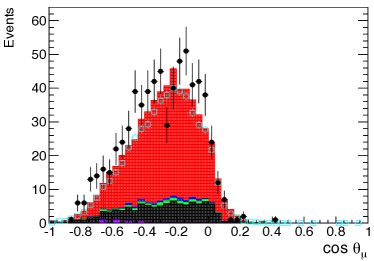
Fig. 5 shows the reconstructed kinematics for muon candidates in the BWD sample in the data together with the prediction from NEUT and GENIE.

III.1.3 High Angle selection
In the selection for the high angle samples (HAFWD and HABWD), the muon candidates are mostly (or all) contained in the FGD1, ECal and SMRD subdetectors. A detailed explanation of the selection criteria is shown below.
-
•
Quality and FV: High angle tracks starting in FGD1 FV and stopping either in SMRD or BarrelECal are considered. The stopping requirement is needed in order to compute the momentum of the track by range. The contamination from events occurring outside the FV is reduced by rejecting tracks starting in the most upstream or downstream layers of FGD1.
-
•
Muon PID: The TPC PID information is not reliable for high angle tracks since they have no (or short) TPC segments. The SMRD and BarrelECal information forms the basis of the high angle track PID. Tracks that reach the SMRD in the HAFWD sample are good muon candidates (1200 tracks). In the HABWD sample, most tracks reaching the SMRD come from out of the FV. Consequently, tracks reaching the SMRD in the HABWD sample are rejected (70 tracks). Tracks not reaching the SMRD and stopping in the BarrelECal region of the detector (4250 and 1250 tracks for HAFWD and HABWD respectively) are considered as muon candidates if the multivariate analysis quantity . Besides, we reduce the contamination of protons rejecting events that release high amount of energy in short distances within the BarrelECal.
-
•
Veto: The upstream background veto, introduced in the FWD selection, is used for the high angle samples. For this veto, the distance and momentum ratio relation was optimized for forward going and backward going candidates independently.
Fig. 6 and Fig. 7 show the reconstructed kinematics for the muon candidates in the HAFWD and HABWD samples in the data together with the prediction from NEUT and GENIE.
III.1.4 Control regions selection
As mentioned earlier, uncertainties associated with the modeling of backgrounds and pion kinematics, neutral current normalization and pion final state interactions can be minimized using control regions. The backgrounds used in the model are tuned using the data observed in the control regions.
Events that do not fulfill the muon ECal PID and muon FGD2 PID in the FWD selection constitute the control region samples, CSECAL and CSFGD2, respectively. Fig. 8 and Fig. 9 show the reconstructed kinematics for muon candidates in the control region samples in data as well as the expectation from NEUT and GENIE. A relative good agreement is observed within systematic uncertainties, which are particularly large in these samples (mainly affected by detector response). The main contribution (70) in both control samples are negative pions formed in NC or CC deep inelastic interactions. The fraction of signal events in each control sample is below 20.
III.2 Signal and background compositions of the selection
Table 1 summarizes how each step in the selection affects the number of events and purity in each sample in both data and MC. Both the PID and veto cuts play a significant role in increasing the purity in each sample.
| Cut | FWD | BWD | HAFWD | HABWD | ||||
|---|---|---|---|---|---|---|---|---|
| DATA | NEUT | DATA | NEUT | DATA | NEUT | DATA | NEUT | |
| Quality | 82155 | 81222 | 1861 | 1050 | 7225 | 7121 | 1582 | 1566 |
| 32.3 | 58.5 | 41.8 | 48.9 | |||||
| FV | 50519 | 51648 | 1165 | 1025 | 5669 | 5764 | 1356 | 1360 |
| 48.7 | 58.8 | 49.2 | 54.1 | |||||
| PID | 29140 | 29750 | 940 | 799 | 3712 | 3487 | 779 | 684 |
| 81.6 | 73.6 | 71.7 | 72.7 | |||||
| Veto | 25669 | 26656 | 940 | 799 | 3270 | 3107 | 730 | 645 |
| 89.4 | 73.6 | 79.2 | 75.9 | |||||
| Ordering | 25669 | 26656 | 940 | 799 | 3082 | 2857 | 682 | 591 |
| CC | 89.4 | 73.6 | 81.9 | 78.9 | ||||
Table 2 breaks down each sample in the different reaction channels. In the low angle selections, the dominant background is associated with negative pions which are mis-identified as muons in the TPC. In the high angle selections, in which there are no TPC segments, positive pions are the dominant background because the charge of the track is not reconstructed. Those pions are coming mainly from NC interactions or CC-DIS interactions. For the out of FV events, a primary contribution arises from interactions taking place in the borders of FGD1, where the hits closest to the interactions are not reconstructed. In the case of interactions in BarrelECal, backgrounds arise when FGD and BarrelECal reconstructed segments are not matched. Finally, the contribution from interactions in the P0D is composed primarily by neutral particles that scatter inside FGD1.
| FWD | BWD | HAFWD | HABWD | |
| CC- | 89.4 | 73.6 | 81.9 | 78.9 |
| QE | 44.7 | 82.0 | 67.3 | 83.2 |
| 2p2h | 7.5 | 5.5 | 7.2 | 5.5 |
| RES | 25.4 | 8.6 | 17.6 | 8.0 |
| DIS | 19.9 | 3.8 | 7.2 | 3.4 |
| COH | 2.5 | 0.0 | 0.7 | 0.0 |
| CC-no | 2.2 | 1.1 | 2.6 | 1.6 |
| QE | 1.8 | 4.5 | 6.3 | 3.0 |
| 2p2h | 0.3 | 0.0 | 1.6 | 0.6 |
| RES | 6.3 | 24.6 | 59.1 | 60.8 |
| DIS | 91.4 | 70.3 | 31.7 | 35.6 |
| COH | 0.3 | 0.6 | 1.3 | 0.0 |
| noCC | 3.3 | 1.4 | 3.7 | 1.9 |
| NC | 75.5 | 67.2 | 51.4 | 69.1 |
| 15.8 | 15.8 | 39.3 | 15.4 | |
| 8.7 | 17.0 | 9.3 | 15.5 | |
| Out of FV | 4.4 | 21.5 | 11.3 | 16.9 |
| CC (in FGD1) | 12.4 | 16.4 | 33.3 | 34.6 |
| CC (out FGD1) | 65.2 | 69.2 | 51.7 | 55.9 |
| NC | 17.0 | 11.0 | 11.3 | 7.5 |
| Other | 5.4 | 3.4 | 3.8 | 2.0 |
| Sand | 0.8 | 2.3 | 0.4 | 0.7 |
III.3 Reconstruction efficiencies
The reconstruction efficiency for CC events as a function of the kinematics of the outgoing muon is shown in Fig. 10. For low momentum muons (below 500 MeV/c) the efficiency drops drastically because such low momentum particles are unlikely to exit the FGD and pass the selection criteria. The stopping requirement, necessary to determine muon momentum by range and the timing, poses a significant limitation for high angle muons. This is particularly true for backward going muons, which occur typically at very low momentum and stop in the passive edges of material between subdetectors.
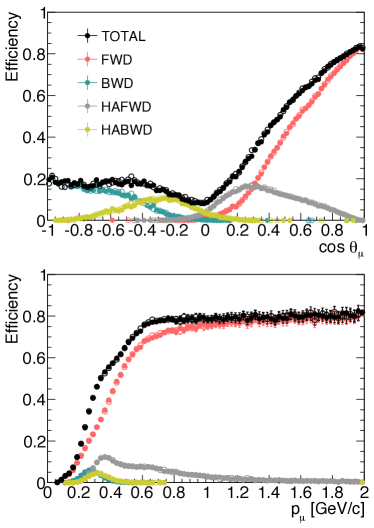
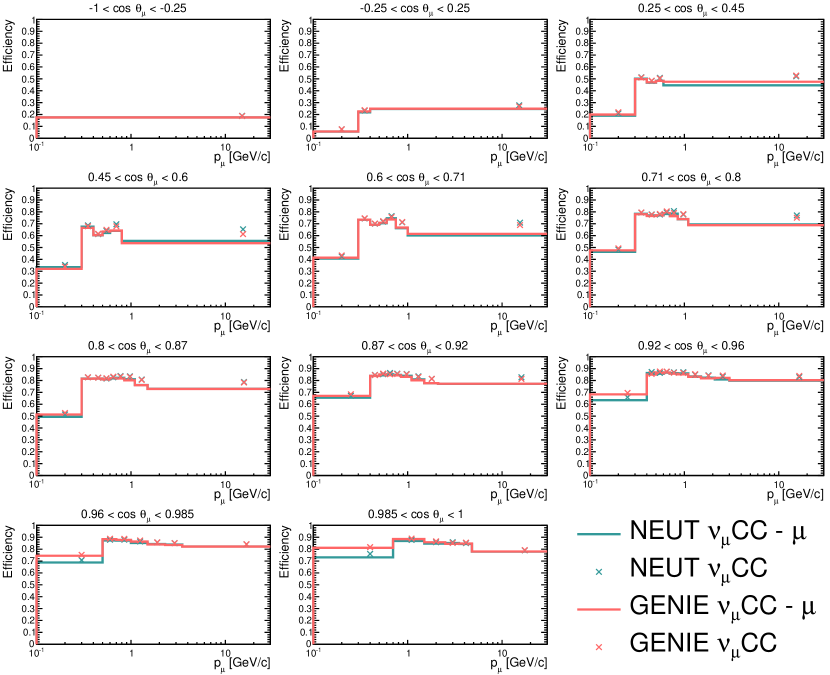
Fig. 11 shows the signal reconstruction efficiency using the same binning in and as in the cross-section result (see Table 4). The efficiency for high multiplicity events is reduced by the fact that CC events in which the muon candidate is not the true muon (the so called CC-no sample) are not included as signal.
The efficiency as calculated in NEUT and GENIE is generally in agreement. However, the predicted efficiency is different for low momentum muons going very forward with respect to the neutrino direction. While generators are in principle only used to correct for detector effects, this difference highlights how the simulation of final state particles is important even for an inclusive selection. In that region of phase space the two generators differ in their predictions for CC deep inelastic and CC resonance channels, particularly in the kinematics of the muon and hadrons.
III.4 Detector systematic uncertainties
The uncertainties associated with the prediction of each subdetector response (TPCs, FGDs, ECal modules, P0D and SMRD) are evaluated using dedicated control samples in the data. This works since the events in the control samples share many of the properties of the events in the CC selection.
The tracker systematic uncertainties are divided into four classes: selection efficiency (TPC cluster finding, TPC track finding and charge assignment), TPC momentum resolution, TPC PID, and TPC-FGD matching efficiency. They are all assessed as in previous analyses from T2K using different control samples of through-going muons Abe et al. (2015).
Uncertainties associated with the ECal modules are computed for the ECal PID, the energy resolution and scale, and the efficiency with which ECal objects are reconstructed and matched to TPC tracks. The method to evaluate those errors is unchanged with respect to Abe et al. (2014), using high purity control samples of muons crossing the TPCs and ECals.
Relative to the previous analysis, this work includes six additional systematic errors. The new errors incorporated in this analysis are associated with the ToF; the matching efficiency between TPC-P0D and FGD-ECal(SMRD); the resolution of the momentum determined by range; vertex migration; and the neutrino parent direction.
The ToF between FGD1 and FGD2 or BarrelECal or P0D is used to determine if the track starts or ends in the FGD1, and infer the charge of the track. The uncertainty is evaluated by comparing the ToF distribution in control samples of tracks crossing the relevant subdetectors and starting/stopping in FGD1 for data and MC. The ToF distributions are fit with Gaussian distributions for data and simulation. To account for the differences in the means and widths of the distributions between data and simulation, corrections are applied to the simulation and the error is set to be equal to the maximum bias or resolution correction. The error is not higher than for the Gaussian parameter in any of the distributions.
The TPC-P0D matching efficiency is estimated using a control sample of cosmic muons passing through part of the P0D and having a reconstructed segment in TPC1. The efficiency is defined as the ratio between the number of events with a matched TPC1-P0D segment and the total number of events in the control sample. This efficiency is evaluated as function of the momentum of the track. The data and MC are less than different when the momentum of the cosmic is higher than 200 MeV/c.
To compute the FGD-ECal(SMRD) matching efficiency, a control sample is used that contains through-going muons with a BarrelECal (SMRD) segment that points to FGD. In order to mimic the kinematics of the muon candidate, it is required that the muon stops within the FGD. The matching efficiency is computed from the ratio between the number of events with a matched FGD-BarrelECal (or FGD-BarrelECal-SMRD) segment and the total number of events in the relevant control sample. The FGD-BarrelECal (FGD-BarrelECal-SMRD) efficiency is found to be () for simulation and () for data. A correction is applied to the simulation to account for this and the correction uncertainty is included in the overall detector uncertainty.
The momentum by range resolution is studied using particles in a control sample that are fully contained in ND280, stopping inside the FGD and BarrelECal (or SMRD), and crossing at least one TPC. The distribution of the difference between the momentum determined by curvature using the TPC segment and the momentum by range are compared in data and MC. No bias is observed in such distributions but some difference is seen in the width of the distributions; this is used to set the uncertainty. In the case of the BarrelECal (SMRD), the systematic uncertainty is around ().
The vertex of the interaction is defined as the reconstructed position of the start of the muon candidate inside the FGD. When the multiplicity of particles increases, the reconstruction of the vertex becomes more difficult and the vertex position can migrate. These migrations have a non negligible impact on the BWD sample event vertices because back-to-back topologies are common in that sample. The main effect is on the reconstructed momentum of the muon candidate inside the FGD because it is proportional to track length. The difference between the data and simulation for these migrations is difficult to interpret since it is sensitive to the modeling of hadrons. An uncertainty of 7 MeV/c (or 3 FGD layers), which was computed comparing the length of the tracks inside the FGD1 for data and MC, is applied to the reconstructed momentum of the muon candidate.
In this analysis, the angle of the outgoing muon is defined with respect to the neutrino direction. The neutrino direction is determined from the position of the vertex in FGD1 and the parent hadron decay point of the neutrino in the decay tunnel. The mean position of hadron decays in the decay tunnel has an associated uncertainty. This is taken into account by varying the mean parent decay point according to the decay distribution in the beam simulation.
The detector systematic uncertainties are propagated in order to check their impact in the rate of reconstructed events in and . This analysis follows the methodology described in Abe et al. (2015). The expected number of events are scaled using a vector of systematic parameters. Then, the uncertainties in each reconstructed bin and their correlations are computed using toy experiments in which the systematics are varied simultaneously. Table 3 shows the full list of detector systematic effects considered and the associated uncertainty in each.
| FWD | BWD | HAFWD | HABWD | |
| Efficiency-like | ||||
| TPC charge ID eff. | 0.1 | 0.2 | 0 | 0 |
| TPC cluster eff. | 0.002 | 0.002 | 0.002 | 0.002 |
| TPC tracking eff. | 0.8 | 0.4 | 0.05 | 0.02 |
| ECal tracking eff. | 0.2 | 0.2 | 4.1 | 4.9 |
| ECal PID eff. | 1.3 | 0 | 0.5 | 0.3 |
| TPC-FGD match. eff. | 0.1 | 0.1 | 0.004 | 0.005 |
| TPC-ECal match. eff. | 0.5 | 0.8 | 0.2 | 0.1 |
| TPC-P0D match. eff. | - | 3.9 | - | - |
| FGD-ECal match. eff. | - | - | 4.7 | 6.5 |
| FGD-SMRD match. eff. | - | - | 11.6 | - |
| Normalization-like | ||||
| Pileup | 0.2 | - | 0.2 | 0.2 |
| Out of fiducial volume | 0.5 | 1.9 | 1.0 | 2.0 |
| Sand mu | 0.1 | 0.1 | 0.02 | 0.03 |
| Pion secondary int | 0.3 | 0.3 | 0.4 | 0.3 |
| Proton secondary int | 0.01 | 0.001 | 0.2 | 0.01 |
| Observable variation | ||||
| TPC Field Distortions | 0.007 | 0.008 | 0.001 | 0.004 |
| TPC momentum scale | 0.007 | 0 | 0.004 | 0.01 |
| TPC momentum res. | 0.02 | 0.015 | 0.01 | 0.01 |
| Vertex migration | 0.003 | 0 | 0.01 | 0.01 |
| TPC PID | 0.2 | 0.4 | 0.02 | 0.02 |
| Momentum range res. | - | - | 0.1 | 0.1 |
| ECal energy resolution | - | - | 0.1 | 0.2 |
| ECal energy scale | - | - | 0.8 | 1.5 |
| Time of flight | 0.1 | 2.6 | 2.4 | 7.3 |
| direction | 0 | 0 | 0 | 0 |
| Total | 1.8 | 5.9 | 14.3 | 14.3 |
The uncertainty associated to the matching among FGD, ECal and SMRD subdetectors is dominant in both the HAFWD and HABWD selections. The reason is that the misalignment between both subdetectors has not been properly corrected in data, leading to discrepancies in the matching efficiency for segments contained in those subdetectors. In the case of the BWD sample, the matching between the TPC and P0D subdetectors and the ToF resolution dominates. Meanwhile, in the FWD selection the uncertainty associated with the particle identification in the BarrelECal and DsECal dominates.
IV CROSS-SECTION ANALYSIS
The following section describes the procedure to unfold the measured muon kinematic distributions and to propagate uncertainties in the cross-section measurement. After this, the flux-integrated, double-differential cross section results for CC interactions are presented.
IV.1 Methodology
The flux-integrated, double-differential cross section is expressed as
| (1) |
where is the number of signal events with momentum and angle bins and , respectively. is the signal reconstruction efficiency with momentum bin and angle bin . and represent the bin widths. Finally, the normalization factors are the total integrated flux and the number of target nucleons in the FV.
The number of nucleons is computed using the areal density of the different elements composing the FV () Amaudruz et al. (2012). The integrated muon neutrino flux is cm-2.
The reconstructed momentum and cosine of emission angle of the muon candidate are not an exact representation of the true initial muon kinematics. Therefore, an unfolding method is used to remove the detector effects in the measurement. In this analysis, we unfold the muon kinematic quantities using a binned likelihood fit as in Abe et al. (2016). We vary the true spectrum of the simulation (so called prior) and propagate its effect to the rate of events in each reconstructed bin. Then, the predicted rate is compared with the values from data. The variation of the true spectrum is performed scaling up or down the rate of signal events simultaneously in the four signal and two control regions for each true bin. Two of the parameters associated to the background modeling (the normalizations of the neutral current cross section and pion final state interactions) are included in the fit as nuisance parameters.
This unfolding method is unregularised, which leads to strong anticorrelations between neighboring bins if the binning is not properly defined. The different samples described in Sec. III are well separated in the angular phase space. In fact, the detector response is different for the selected events in each sample. Thus, the angular binning is chosen (i.e. ) to separate the contribution from each sample as much as possible. The momentum binning reflects the resolution of the detector and is chosen to maintain sufficient statistics in each bin. Table 4 shows the binning used in this analysis for the chosen muon kinematic variables.
| [GeV/c] | |
|---|---|
| -1, -0.25 | 0, 30 |
| -0.25, 0.25 | 0, 0.3, 0.4, 30 |
| 0.25, 0.45 | 0, 0.3, 0.4, 0.5, 0.6, 30 |
| 0.45, 0.6 | 0, 0.3, 0.4, 0.5, 0.6, 0.8, 30 |
| 0.6, 0.71 | 0, 0.3, 0.4, 0.5, 0.6, 0.75, 1, 30 |
| 0.71, 0.8 | 0, 0.3, 0.4, 0.5, 0.6, 0.7, 0.85, 1.1, 30 |
| 0.8, 0.87 | 0, 0.3, 0.4, 0.5, 0.6, 0.7, 0.85, 1.1, 1.5, 30 |
| 0.87, 0.92 | 0, 0.4, 0.5, 0.6, 0.7, 0.85, 1.1, 1.5, 2.1, 30 |
| 0.92, 0.96 | 0, 0.4, 0.5, 0.6, 0.7, 0.85, 1.1, 1.5, 2.1, 3, 30 |
| 0.96, 0.985 | 0, 0.5, 0.7, 1, 1.5, 2.3, 3.5, 30 |
| 0.985, 1 | 0, 0.7, 1.5, 2.5, 3.5, 4.8, 30 |
IV.2 Error propagation
Analytical computation for most of the uncertainties in this analysis is not possible. So toy experiments are used to study their impact and determine errors. In the toy experiments, some aspect of the simulated or real data is changed depending on the source of uncertainty as described below.
To evaluate the uncertainty due to data statistics, toy experiments are produced applying a Poisson fluctuation to the number of reconstructed events in the data for each bin and sample. For each toy, the fluctuated data are unfolded using as prior the nominal MC and the cross section is computed using Eq. 1. The statistical error in each bin is taken as width of the cross section distribution for many toys.
The methodology used to estimate systematic uncertainties involves reweighting the MC prediction for each toy experiment. Parameters associated to each systematic error are thrown according to a Gaussian distribution around the nominal value, following the prior errors and taking into account correlations. Then, for each toy, the data is unfolded using as prior the reweighted MC. In addition, , and are also weighted using the thrown value of the parameters. Finally, the cross section is computed using Eq. 1 for each toy. The uncertainty in each bin is taken as width of the cross section distribution for many toys.
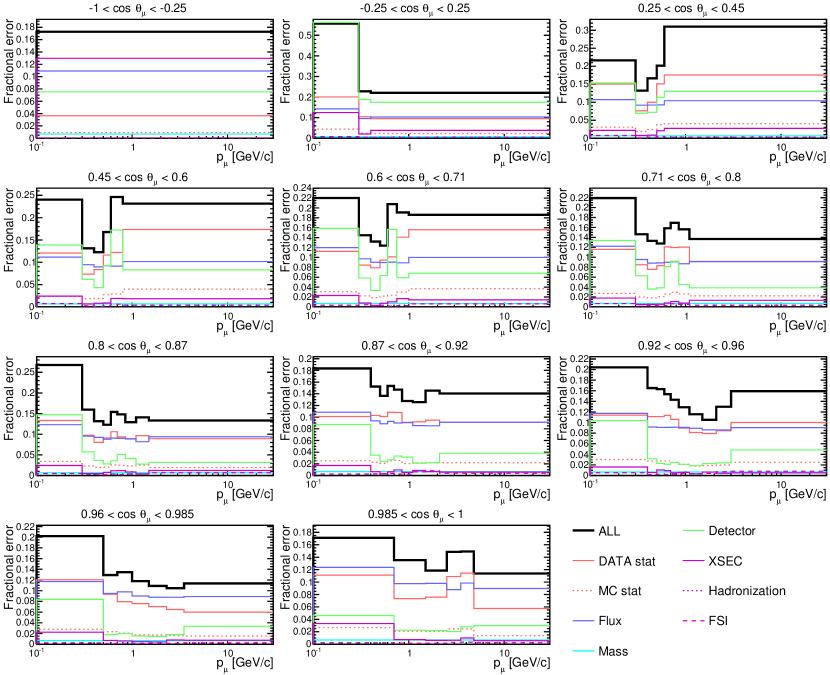
Fig. 12 shows a comparison of the fractional error associated to each source of uncertainty using 1500 toy models. Throughout most of the phase space, the dominant systematic uncertainty is the flux. In the backward region, the neutrino interaction modeling dominates, with the largest contribution coming from the uncertainty assigned to the parameter. The detector systematic becomes relevant in the high angle region () due to the large uncertainties in FGD-ECal(SMRD) matching efficiencies, and at very low momentum where the out of FV contribution is more pronounced. The statistical uncertainty is dominant in the high momentum region where the number of reconstructed events is lower (except at low angles in the forward direction).
It is interesting to note that the systematic uncertainties associated with the signal and background modeling give a relatively unimportant contribution to the overall inclusive cross section uncertainty because of the high purity and efficiency for the signal sample. The systematic uncertainties associated with the modeling of neutral-current interactions and pion final state interactions are reduced by a factor of 2 thanks to the use of the control samples.
V RESULTS AND CONCLUSIONS
The flux-integrated total cross section is computed by integrating both the number of signal events and the signal efficiency over the muon phase space.
This is compatible with predictions from the two event generators: and . It is known that the detector performance varies substantially as a function of the momentum and angle of the outgoing muon. Therefore, the extracted value using the total cross section must be interpreted cautiously. This result shows good agreement with the one obtained in Abe et al. (2013a).
The flux-integrated, double-differential cross section is computed as function of the outgoing muon kinematics using the methodology described in Sec. IV.1 and Sec. IV.2 using two independent MC generators detailed in Sec. II.3. Fig. 13 shows the results for the unfolded data as well as the NEUT and GENIE predictions. A small disagreement is observed in the low momentum and very forward regions when using different event generators as prior. This bias is not due to unfolding but due to the different efficiency corrections in that region of the phase space for NEUT and GENIE as shown in Fig. 11. The muon neutrino flux used in this analysis and the measured cross section values, errors and correlation matrix can be found in Abe et al. .
This result is compared to the NEUT and GENIE predictions, showing in both cases high values with respect to the total number of bins, 71. In the new regions of phase space (high angle and backward-going muons) there is good agreement but uncertainties are still large. For forward-going muons the binning is finer and interesting structures are observed.

ACKNOWLEDGEMENTS
We thank the J-PARC staff for superb accelerator performance. We thank the CERN NA61/SHINE Collaboration for providing valuable particle production data. We acknowledge the support of MEXT, Japan; NSERC (Grant No. SAPPJ-2014-00031), NRC and CFI, Canada; CEA and CNRS/IN2P3, France; DFG, Germany; INFN, Italy; National Science Centre (NCN) and Ministry of Science and Higher Education, Poland; RSF, RFBR, and MES, Russia; MINECO and ERDF funds, Spain; SNSF and SERI, Switzerland; STFC, UK; and DOE, USA. We also thank CERN for the UA1/NOMAD magnet, DESY for the HERA-B magnet mover system, NII for SINET4, the WestGrid and SciNet consortia in Compute Canada, and GridPP in the United Kingdom. In addition, participation of individual researchers and institutions has been further supported by funds from ERC (FP7), H2020 Grant No. RISE-GA644294-JENNIFER, EU; JSPS, Japan; Royal Society, UK; the Alfred P. Sloan Foundation and the DOE Early Career program, USA.
References
- Abe et al. (2011) K. Abe et al. (T2K Collaboration), Nucl. Instrum. Methods Phys. Res., Sect. A 659, 106 (2011).
- Abe et al. (2013a) K. Abe et al. (T2K Collaboration), Phys. Rev. D 87, 092003 (2013a).
- Abgrall et al. (2016) N. Abgrall et al. (NA61/SHINE Collaboration), Eur. Phys. J. C 76, 84 (2016).
- Abe et al. (2013b) K. Abe et al. (T2K Collaboration), Phys. Rev. D 87, 012001 (2013b).
- Abgrall et al. (2012) N. Abgrall et al. (NA61/SHINE Collaboration), Phys. Rev. C 85, 035210 (2012).
- Assylbekov et al. (2012) S. Assylbekov et al., Nucl. Instrum. Methods Phys. Res., Sect. A 686, 48 (2012).
- Allan et al. (2013) D. Allan et al., J. Instrum. 8, P10019 (2013).
- Aoki et al. (2013) S. Aoki et al., Nucl. Instrum. Methods Phys. Res., Sect. A 698, 135 (2013).
- Amaudruz et al. (2012) P. Amaudruz et al., Nucl. Instrum. Methods Phys. Res., Sect. A 696, 1 (2012).
- Abgrall et al. (2011) N. Abgrall et al., Nucl. Instrum. Methods Phys. Res., Sect. A 637, 25 (2011).
- Abe et al. (2014) K. Abe et al. (T2K Collaboration), Phys. Rev. D 89, 092003 (2014).
- Hayato (2009) Y. Hayato, Acta Phys. Pol. B 40, 2477 (2009).
- Andreopoulos et al. (2010) C. Andreopoulos et al., Nucl. Instrum. Methods Phys. Res., Sect. A 614, 87 (2010).
- Smith (1972) C. L. Smith, Phys. Rep. 3, 261 (1972).
- Bradford et al. (2006) R. Bradford et al., Nucl. Phys. B Proc. Suppl. 159, 127 (2006).
- Bodek and Ritchie (1981) A. Bodek and J. L. Ritchie, Phys. Rev. D 23, 1070 (1981).
- Benhar and Fabrocini (2000) O. Benhar and A. Fabrocini, Phys. Rev. C 62, 034304 (2000).
- Nieves et al. (2011) J. Nieves et al., Phys. Rev. C 83, 045501 (2011).
- Wilkinson et al. (2016) C. Wilkinson et al., Phys. Rev. D 93, 072010 (2016).
- Rein and Sehgal (1981) D. Rein and L. M. Sehgal, Ann. Phys. (N.Y.) 133, 79 (1981).
- Graczyk and Sobczyk (2008) K. M. Graczyk and J. T. Sobczyk, Phys. Rev. D 77, 053001 (2008).
- Kuzmin et al. (2006) K. S. Kuzmin et al., Acta Phys. Pol. B 37, 2337 (2006).
- Wilkinson et al. (2014) C. Wilkinson et al., Phys. Rev. D 90, 112017 (2014).
- Glück et al. (1998) M. Glück et al., Eur. Phys. J. C 5, 461 (1998).
- Bodek and Yang (2003) A. Bodek and U. K. Yang, AIP Conf. Proc. 670, 110 (2003).
- Bodek and Yang (2005) A. Bodek and U. Yang, AIP Conf. Proc. 792, 257 (2005).
- Adamson et al. (2010) P. Adamson et al. (MINOS Collaboration), Phys. Rev. D 81, 072002 (2010).
- Rein and Sehgal (1983) D. Rein and L. M. Sehgal, Nucl. Phys. B223, 29 (1983).
- Rein and Sehgal (2007) D. Rein and L. Sehgal, Phys. Lett. B 657, 207 (2007).
- Higuera et al. (2014) A. Higuera et al. (MINERvA Collaboration), Phys. Rev. Lett. 113, 261802 (2014).
- Sjöstrand (1994) T. Sjöstrand, Comput. Phys. Commun. 82, 74 (1994).
- Koba et al. (1972) Z. Koba et al., Nucl. Phys. B40, 317 (1972).
- Yang et al. (2009) T. Yang et al., Eur. Phys. J. C 63, 1 (2009).
- Salcedo et al. (1988) L. Salcedo et al., Nucl. Phys. A484, 557 (1988).
- Ashery et al. (1981) D. Ashery et al., Phys. Rev. C 23, 2173 (1981).
- Mashnik et al. (2006) S. G. Mashnik et al., J. Phys. Conf. Ser. 41, 340 (2006).
- Abe et al. (2015) K. Abe et al. (T2K Collaboration), Phys. Rev. D 91, 072010 (2015).
- Abe et al. (2016) K. Abe et al. (T2K Collaboration), Phys. Rev. D 93, 112012 (2016).
- (39) K. Abe et al., “T2k public data,” http://t2k-experiment.org/results.