Debugging Static Analysis
Abstract.
To detect and fix bugs and security vulnerabilities, software companies use static analysis as part of the development process. However, static analysis code itself is also prone to bugs. To ensure a consistent level of precision, as analyzed programs grow more complex, a static analysis has to handle more code constructs, frameworks, and libraries that the programs use. While more complex analyses are written and used in production systems every day, the cost of debugging and fixing them also increases tremendously.
To better understand the difficulties of debugging static analyses, we surveyed 115 static analysis writers. From their responses, we extracted the core requirements to build a debugger for static analysis, which revolve around two main issues: (1) abstracting from two code bases at the same time (the analysis code and the analyzed code) and (2) tracking the analysis internal state throughout both code bases. Most current debugging tools that our survey participants use lack the capabilities to address both issues.
Focusing on those requirements, we introduce Visuflow, a debugging environment for static data-flow analysis that is integrated in the Eclipse development environment. Visuflow features graph visualizations that enable users to view the state of a data-flow analysis and its intermediate results at any time. Special breakpoints in Visuflow help users step through the analysis code and the analyzed simultaneously. To evaluate the usefulness of Visuflow, we have conducted a user study on 20 static analysis writers. Using Visuflow helped our sample of analysis writers identify 25% and fix 50% more errors in the analysis code compared to using the standard Eclipse debugging environment.
1. Introduction
Software is getting more complex, with new features added every day to already-existing large code bases. To avoid coding errors, bugs, and security vulnerabilities, companies use various automated tools such as Google Tricorder (Sadowski et al., 2015), Facebook Infer (Calcagno and Distefano, 2011), or HP Fortify (Fortify, 2017). One approach that is commonly used in these tools is static analysis, a method of automatically reasoning about the runtime behaviour of a program without running it.
As more complex software is produced, more complex analyses are also written to efficiently support bug finding. Prior static-analysis research has yielded many novel algorithms (Bodden, 2012; Ryder, 1983; Liang et al., 2012), analyses (Xie et al., 2012; Nguyen Quang Do et al., 2017a), and analysis tools (Ko and Myers, 2006; Shen et al., 2011) to better support code developers. However, standard debugging tools (home page, 2017a, d; Debugger, 2017) are often ill-suited to help analysis writers debug their own analyses. Writing an analysis is often more complex than writing general application code, because it requires thorough knowledge of both the analysis code and the analyzed code. Such knowledge enables the analysis writer to handle specific corner cases, while also ensuring soundness and precision. Precisely understanding what an analysis does is hard and time consuming, making the development of new analyses cumbersome in academia and industry.
In this paper, we investigate the need for better debugging tools for static analysis code through a large-scale survey of 115 static analysis writers. The survey aims to identify (1) common types of static analysis, (2) common bugs in static analysis code compared to application code, (3) popular debugging tools used for static analysis code and application code, (4) the limitations of those tools with respect to debugging static analysis code, and (5) desirable features for a static analysis debugger.
Based on the debugging features that we have identified in the survey, we present Visuflow, an Eclipse-based debugging environment for data-flow analysis written on top of Soot (Vallée-Rai et al., 2000). Visuflow helps analysis writers better visualize and understand their analysis code while debugging it. A focused user study with 20 participants shows that the debugging features of Visuflow help analysis writers identify 25% and fix 50% more errors in analysis code compared to using the standard Eclipse debugging environment. The participants found the debugging features in Visuflow more useful than their own coding environment for debugging static analysis.
In summary, this paper makes the following contributions:
-
•
Through a comprehensive survey, we motivate the need for better tools to debug static analyses, and identify desirable features such tooling should provide.
-
•
We present Visuflow, an Eclipse-based debugging environment for static data-flow analysis.
-
•
Through a user study, we evaluate the usefulness of Visuflow for debugging static analysis. We also determine which of the desirable features that we extracted from the survey are, in fact, useful for debugging static analysis.
Visuflow is available online, along with a video demo, the anonymized survey answers, and the results of the user study (Nguyen Quang Do et al., 2017b).
2. Survey
We conducted a large-scale survey of 115 static-analysis writers to understand the differences between debugging static analysis code and general application code. Our goal is to provide better support for the former through answering the following research questions:
-
RQ1:
Which types of static analysis are most commonly written?
-
RQ2:
Do analysis writers think that static analysis is harder/easier to debug than application code, and why?
-
RQ3:
Which errors are most frequently debugged in static analysis and application code?
-
RQ4:
Which tools do analysis writers use to support debugging of static analysis and application code?
-
RQ5:
What are the limitations of those tools?
2.1. Survey Design
The survey contains 32 questions that we refer to as Q1-Q32, in the order in which they were presented to participants. The survey questions and anonymized answers are available online (Nguyen Quang Do et al., 2017b). We group the survey questions into the following 8 sections:
-
(1)
Participant information: Through multiple-choice questions, we asked participants how long they have been writing static analysis (Q3), for which languages (Q4), and which branches (Q6) and frameworks (Q9) of static analysis they have experience with.
-
(2)
Debugging static analysis compared to application code: Q11 asks participants which type of code is easier to debug on a scale from 1 (application code) to 10 (static analysis). Q12 asks them why in free text.
-
(3)
Debugging static analysis: Q13 asks participants how long they spend on writing static analysis compared to debugging it on a scale from 0 (100% coding, 0% debugging) to 10 (0% coding, 100% debugging). In free text, Q15 asks for the typical causes of bugs they find in analysis code.
-
(4)
Tools for debugging static analysis: In free text, we asked participants which features of their coding environments they like (Q17), dislike (Q18), and would like to have (Q19) when debugging static analysis.
-
(5)
Debugging application code: Q20 and Q21 are similar to Q13 and Q15, but specific to application code.
-
(6)
Tools for debugging application code: Q23-Q25 are similar to Q17-Q19, applied to application code.
-
(7)
Specific debugging features: Q26 asks participants to rate the importance of some debugging features on the following scale: Not important - Neutral - Important - Very important - Not applicable.
-
(8)
Coding environment: In a closed-choice question, Q28 asks participants if they primarily code using a text editor (e.g., Vim, Emacs) or an IDE (e.g., Eclipse, IntelliJ). Q29 asks them in free text which specific software they use.
First, we sent a pilot survey to 10 participants. Based on the feedback, we refined the questions as shown above.
2.2. Result Extraction
We manually classified the answers to the free-text questions using an open card sort (Hudson, 2013). Two authors classified the answers into various categories, which were derived during the classification process. Responses that do not answer the question were classified in an “Others” category (e.g., “n/a”).
To verify the validity of our classification, another author, who had not been part of the classification phase nor seen the answers before, sorted the answers in the categories derived during the first classification. We then compared the agreement between the two classifications. Since one answer could match multiple categories (e.g., “I use breakpoints and stepping.” matched the categories “Breakpoint” and “Stepping”), we calculated a percent agreement for each category of each question. The average percent agreement over all categories for all questions is 96.3% (median = 98%, min = 65.2%, max = 100%, standard deviation = 0.05). Because of the imbalance in the distribution of the answers, we ran into a paradox of inter-rater agreement (Viswanathan and Shrikant, 2014), making the Cohen’s Kappa (Landis and Koch, 1977) an unreliable statistic for this survey (average , median , , , ).
Due to optional questions and participants who did not finish the survey, some questions received fewer answers than others. Figure 1 reports the number of classified (gray) and unclassified (white) answers per question. In the following sections, the percentages reported for each question are based on the number of classified answers for the particular question and not on all 115 answers. Participants could choose multiple answers to the same multiple-choice question, and an answer to a free-text question could match multiple categories. Therefore, the percentages for each question may add up to more than 100%.
2.3. Participants
We contacted 450 researchers from the authors of static analysis papers published between 2014 and 2016 at the following conferences and their co-located workshops: ICSE, FSE, ASE, OOPSLA, ECOOP, PLDI, POPL, SAS. We received responses from 115 researchers, 85.2% from academia and 15.7% from industry (Q1).
Most participants are experienced static analysis writers. Approximately 31.3% of the participants have 2–5 years of experience writing static analysis, 22.3% have 5–10 years of experience, 26.8% have more than 10 years of experience, and only 9.8% have less than 2 years of experience (Q3).
2.4. Results
2.4.1. RQ1: Which types of static analysis are most commonly written?
We asked participants which programming language they analyzed the most (Q4), and received 3 main answers: Java (62.3%), C/C++ (59.4%), and JavaScript (23.6%). There were 34 other named languages, each analyzed by less than 8% of the participants.
We also asked participants what branches of static analysis they wrote for (Q6). Data-flow analysis is the most popular (74.5%), followed by abstract interpretation (65.1%), symbolic execution (36.8%), and model checking (21.7%). The remaining 9 categories are each used by less than 4% of the participants.
Finally, we asked participants about the most popular frameworks they used to write static analysis (Q9). Soot (Vallée-Rai et al., 2000) is first (55.4%), followed by WALA (home page, 2017g) and LLVM (home page, 2017e) as second and third (31.1% and 21.6%, respectively). The participants named 32 other frameworks, each is used by less than 10% of them.
2.4.2. RQ2: Do analysis writers think that static analysis is harder/easier to debug than application code, and why?
Q11 asks participants to rate how hard debugging static analysis is compared to debugging application code on a scale from 1 (static analysis is harder to debug) to 10 (application code is harder to debug). The average ranking is 4.0 (standard deviation ). Figure 2 shows that 50.5% of the participants find static analysis harder to debug than application code, 28.2% are neutral, and 9.5% think that application code is harder to debug. Q13 and Q20 confirm this result. Participants reported that they spent more time debugging a piece of static analysis code than writing it, and the contrary for a piece of application code. On average, participants estimate spending 46.8% of their time writing static analysis code compared to 57.5% writing application code. A test of independence does not detect a significant correlation () between the rating of Q11 and the participant background (seniority, coding languages, editor type, or analysis frameworks).
| Harder | Reason | % |
| SA | Abstracting two types of code | 15.67% |
| Greater variety of cases | 15.7% | |
| More complex structure of static analysis tools | 6.0% | |
| Evaluating correctness is harder | 6.0% | |
| Soundness is harder to achieve | 3.6% | |
| Intermediate results are not directly accessible | 4.8% | |
| Static analysis is harder to debug | 3.6% | |
| EQ | Both are application code | 13.3% |
| They cannot be compared | 7.2% | |
| No opinion | 3.6% | |
| AC | Used to developing static analysis | 6.0% |
| Application code is more complex | 2.4% |
Table 1 classifies the reasons that participants gave when asked why they found one type of code harder to debug than the other (Q12). Due to space limitations, we only report the reasons mentioned by more than one participant. The main reason that participants find static analysis harder to debug is the complexity of handling two code bases (i.e., the analysis code and the analyzed code) at the same time: “Static Analysis requires to switch between your analysis code and the Intermediate Representation which you actually analyse”. This complexity creates more corner cases that the analysis writer has to handle. Another reason is that correctness is harder to define for a static analysis. To quote a participant: “‘correct’ is better defined [in application code]”. The final reason is that analysis intermediate results are not directly verifiable, as opposed to the output of application code that can be directly validated: “Static analysis code usually deals with massive amounts of data. […] It is harder to see where a certain state is computed, or even worse, why it is not computed.”
Participants who find static analysis and application code equally hard to debug have two main arguments. First, both are application code: “a static analyzer is an application, albeit a sophisticated one”. Second, they are so different that they cannot be compared: “These two difficulties are qualitatively different and hence incomparable.”
Participants who find application code more difficult to debug argue that it is more complex than static analysis code. Depending on the degree of complexity of the application and the analysis, application code may contain a huge number of corner cases that the application writer has to comprehend: “Static analysis code usually includes very limited number of possible cases.” Some participants also wrote that the reason why they find application code harder to debug is that they are used to developing static analysis.
2.4.3. RQ3: Which errors are most frequently debugged in static analysis and application code?
We asked the participants for the typical root causes of errors they find when debugging static analysis (Q15) and application code (Q21). We categorize the results in the six categories shown in Figure 3. When debugging static analysis, the main cause of errors is handling corner cases, which is 2 more prevalent than when writing application code. This category includes overlooked cases that the developer normally knows of (“Forgot to consider the effect of certain, rare instructions”). The domain knowledge category refers to code behaviour that the developer is unaware of (“Unexpected values returned by an API”).
Programming errors occur 2 more often in application code than in static analysis code. This category includes implementation errors such as “wrong conditions, wrong loops statements”. The category algorithmic errors contains errors due to a wrong design decision in the program’s algorithm such as a “non-convergence” of the analysis (Q15) or an issue with “the algorithms I’m implementing” (Q21). Participants debug such algorithmic errors 3.5 more often in static analysis than in application code.
Semantics mismatch and underlying infrastructure are specific to static analysis. The former refers to how the analysis interprets the analyzed code (e.g., “The code does not take [into] account the abstract semantics correctly”). The latter is similar to domain knowledge, but instead of the knowledge of the analyzed code, it is about the analysis framework (e.g., “Can’t load classes/methods successfully.”).
While bugs in application code are mainly due to programming errors, static analysis bugs are distributed over multiple categories. We attribute this to the heightened interest of analysis writers to produce correct analyses. Testing functional correctness typically requires validating input/output relationships. For static analysis, those relationships are always imperfect due to necessary approximations. Hence, it is very hard to define functional correctness for static analysis. Moreover, handling two code bases is also the cause of analysis-specific errors: semantics mismatch and underlying infrastructure. Because of the specific requirements of static analyses, the bugs that developers investigate in application code have different causes compared to analysis code. Therefore, there is a dire need to support debugging static analysis for the specific kind of errors that are of interest to analysis writers.
2.4.4. RQ4: Which tools do analysis writers use to support debugging of static analysis and application code?
In Q28 and Q29, 56% of the participants answered that to write static analysis, they use an Integrated Development Environment (IDE) such as Eclipse (home page, 2017a) (used by 28%) or IntelliJ (home page, 2017d) (17.3%), while 42.7% use text editors such as Vim (home page, 2017f) (33.3%) or Emacs (home page, 2017b) (21.3%). Each of the other 21 tools is used by less than 10% of the participants.
| SA/IDE | SA/TE | AC/IDE | AC/TE | |
| Printing | ✓ | ✓ | ✓ | ✓ |
| Breakpoints | ✓ | ✓ | ✓ | ✓ |
| Debugging tools | ✓ | ✓ | ✓ | ✓ |
| Coding support | ✓ | ✓ | ✓ | ✓ |
| Variable inspection | ✓ | ✓ | ✓ | ✓ |
| Automated testing | ✓ | ✓ | ✓ | ✓ |
| Expression mode | ✓ | ✓ | ✓ | ✓ |
| Memory tools | ✓ | ✓ | ✓ | |
| Graph visualizations | ✓ | ✓ | ||
| Stepping | ✓ | ✓ | ||
| Type checker | ✓ | ✓ | ||
| Hot-code replacement | ✓ | ✓ | ||
| Visualizations | ✓ | |||
| Stack traces | ✓ | |||
| Drop frames | ✓ | |||
| Documentation | ✓ |
We asked the participants about the most useful features of their coding environments when debugging static analysis (Q17) and application code (Q23). Table 2 shows the features mentioned by more than one participant. The most popular debugging feature is Breakpoints, used by 35.2% of participants when debugging application code and 28.2% for static analysis. Coding support (e.g., auto-completion) is appreciated by 29.6% when writing static analysis, and 20.4% for application code. Variable inspection is used by 27.8% of the application code writers and 19.7% of the analysis writers. Debugging tools (e.g., “GDB/JDB”) are used by 20.4% when writing application code, and 16.9% for analysis code. Printing intermediate results is used by 21.1% to debug analysis code, compared to 13.0% for application code. IDE users highlighted IDE-specific features such as type checkers, stepping, and hot-code replacement.
A test of independence shows a strong correlation between the type of editor used (IDE or text editor) and the most useful features of the coding environment () for application code. The test does not find such a correlation for static analysis.
2.4.5. RQ5: What are the limitations of the existing debugging tools?
| SA/IDE | SA/TE | AC/IDE | AC/TE | |
| Debugging tools | ✗ | ✗ | ✗ | ✗ |
| Immediate feedback | ✗ | ✗ | ✗ | ✗ |
| Coding support | ✗ | ✗ | ✗ | ✗ |
| Multiple environments | ✗ | ✗ | ✗ | |
| Intermediate results | ✗ | ✗ | ||
| Handling data structures | ✗ | ✗ | ||
| Support for system setup | ✗ | ✗ | ||
| Scalability | ✗ | |||
| Visualizations | ✗ | |||
| Conditional breakpoints | ✗ | |||
| Memory tools | ✗ | |||
| Bad documentation | ✗ |
Q18 and Q24 ask participants about the features of their coding environments they dislike when debugging static analysis and application code, respectively. The features mentioned by more than one participant are shown in Table 3. Debugging tools lack features to support debugging static analysis according to 29.5% of participants, compared to 25% when debugging application code. The lack of immediate feedback when a change is made to the code was noted by 11.4% of analysis writers and 17.9% of application code writers. Coding support for static analysis is disliked by 18.2% and 25% for application code.
To our surprise, two of the most disliked features—debugging tools and coding support—are also among the most used and appreciated. This suggests that although current tools are useful, users require more specific features to fully support their needs. For example, a participant wrote: “While the IDE can show a path through [my] code for a symbolic execution run, it doesn’t show analysis states along that path.” Therefore, debugging tools for static analysis could be improved by showing more of the intermediate results of the analysis. For application code, participants requested more support for handling different systems and environments. Participants complained about the “manual work to setup complex build/test systems” and “Dealing with an external dependency (e.g., communicating with a party that I cannot control)”). Static analysis writers using an IDE find debugging tools not scalable, lack of visualizations of analysis constructs (e.g., “It’s mostly text-based”), and need special breakpoints (e.g., “Missing an easy way to add a breakpoint when the analysis reaches a certain line in the input program (hence having to re-run an analysis)”).
| SA/IDE | SA/TE | AC/IDE | AC/TE | |
|---|---|---|---|---|
| Graph visualizations | ✓ | ✓ | ||
| Omniscient debugging | ✓ | ✓ | ||
| Visualizations | ✓ | ✓ | ||
| Hot-code replacement | ✓ | ✓ | ||
| Coding support | ✓ | ✓ | ||
| Test generation | ✓ | |||
| Debugging tools | ✓ | |||
| Intermediate results | ✓ | |||
| Conditional breakpoints | ✓ | |||
| Handling data structures | ✓ |
To identify which debugging features would best support static analysis writers, we asked the participants to suggest useful features for debugging static analysis (Q19) and for debugging application code (Q25). Table 4 shows the features that are mentioned more than once. The requested debugging features for application code and static analysis are quite different. To write application code, participants requested better hot-code replacement and coding support (e.g., “better support to record complex data coming from external services”). For static analysis, 18.4% of participants asked for better visualizations of the analysis constructs, and 23.7% requested graph visualizations: “Easier way to inspect ‘intermediate’ result of an analysis, easier way to produce state graphs and inspect them with tools.” Omniscient debugging was requested by 13.2% of participants to help show the intermediate results of the analysis: “Stepping backwards in the execution of a program”. Participants also requested better test generation tools and special breakpoints (RQ5-1).
A test on the features of Table 4 shows a correlation between the type of code written (static analysis or application code) and the features requested by participants (). The same test does not show correlations between the type of code and the features liked and disliked by participants, with -values of 0.97 and 0.69, respectively. In addition, the test shows strong correlations between the type of editor used and the requested features for static analysis () and application code (). Such correlations could not be shown for features that participants liked or disliked, suggesting that the tools used to debug application code and static analysis contain features that all types of users equally like and dislike. Regardless of the editor, the requested features for writing static analysis and application code are quite different.
In Q26, the participants evaluate how important such features are to them. Figure 4 shows that graph visuals, access to the intermediate representation and intermediate results count as very important features, along with breakpoints and stepping functionalities that consider both the analysis code and the analyzed code. Participants find other types of visuals, better test generation, and quick updates less important.
2.5. Discussion
This survey shows that writing static analysis entails specific requirements on the writer. Handling two code bases and defining soundness makes static analysis harder to debug than general application code (RQ2-1). Those requirements cause different types of bugs to be of interest to static analysis writers when debugging. In addition to programming errors, corner cases and algorithmic errors are specific to static analysis code (RQ3-1). To debug their code, analysis writers mainly use the traditional debugging features included in their coding environments such as breakpoints and variable inspection (RQ4-1). While those tools are helpful, they are not sufficient to fully support debugging static analysis. Debugging features such as simple breakpoints fall short and force analysis writers to handle parts of the debugging process manually (RQ5-1).
Table 2 shows that the debugging tools that analysis writers currently use are adapted for more general application code. Table 4 shows that the features needed to debug analysis code are quite different from the features needed to debug application code. To improve the debug process of static analysis, we identify and prioritize the following features: graph visualizations, access to the analysis intermediate representation and results, and breakpoints that can be controlled on the analysis and the analyzed code (RQ5-2).
In the remainder of this paper, we present a tool that supports features for debugging static analysis, based on the observations from our survey. We also conduct a user study to test how useful those features are for debugging static analysis, and discuss its results. To reach the largest possible target audience, we focus on the most popular use case: providing debugging support in the IDE (RQ4-1) for data-flow analysis of Java programs using the Soot analysis framework (RQ1-1).
3. Visuflow: Visual Support for Debugging Data-Flow Analysis
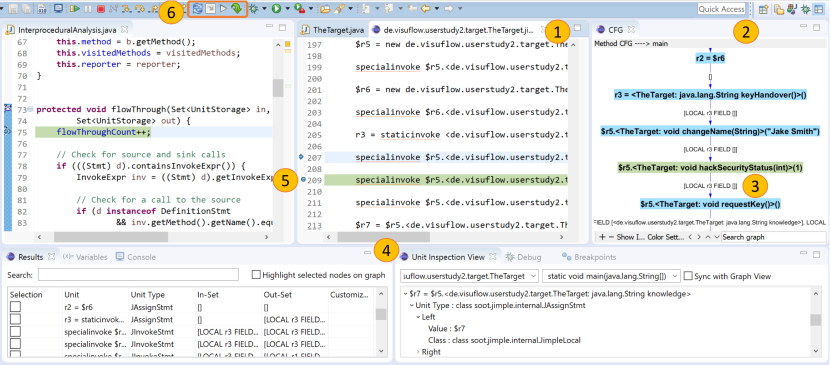
We present Visuflow, an Eclipse-based debugging environment designed for static data-flow analyses written on top of the Soot analysis framework (Vallée-Rai et al., 2000). Figure 5 presents the main Graphical User Interface (GUI) elements in Visuflow. These elements, described below and highlighted with the corresponding numbers in the figure, implement several features identified in Section 2.4.5. A video demo of the GUI is available online (Nguyen Quang Do et al., 2017b).
-
1.
Intermediate representation: Before running an analysis, Soot translates the program into a Jimple intermediate representation (Vallée-Rai et al., 2000) that is simpler to analyze. The Jimple code can be very different from the original source code. Therefore, Visuflow displays the Jimple code in its own read-only Jimple View.
-
2.
Graph visuals: To help the user better visualize the structure of the analyzed code, Visuflow has a Graph View that displays the call graph and control-flow graphs (CFGs) of the analyzed code. The user can customize the color of specific graph nodes or certain types of nodes (e.g., assignment statements).
-
3.
Access to intermediate results: In the graph, intermediate analysis results are edge labels. The user can then determine with a quick glance where a particular data-flow fact is generated, killed, or transferred, instead of debugging the analysis statement after statement to manually inspect intermediate results. The view is populated while debugging the analysis and generating its results. Intermediate results are displayed in the Results View.
-
4.
Visuals: The default layout of Visuflow has the analysis code and the analyzed code side-by-side, enabling the user to see both code bases and the graph in the same view, instead of switching from one tab to the other. The Results View provides a compact summary of the Graph View. The Unit Inspection View shows a list of the program statements, allowing users to inspect the details of what a statement comprises (i.e., type of the statement and types of its components). This feature is useful to novice Soot users who might have little or no knowledge of Jimple, but need to handle particular types of statements.
-
5.
Debugger: Traditional debuggers allow static-analysis writers to set breakpoints only in the analysis code. To debug an analysis for a specific statement of the analyzed code, users have to use conditional breakpoints that suspend the analysis only for that statement. This is difficult when users do not know which statements they should inspect (i.e., when they need to step through the analyzed code). Using Visuflow, users can set breakpoints in both the analysis code and the Jimple View. Visuflow provides separate stepping functionalities to help users debug through both code bases at the same time. Visuflow retains the basic Eclipse Variable Inspection View and Stack Frame View.
-
6.
Linking analysis code and analyzed code: Visuflow introduces a new type of Eclipse project dedicated to static analysis. This project type provides code stubs for both the analysis code and the analyzed code, and links them in the background. This allows Visuflow to identify where to extract the necessary information when displaying analysis results on the graph representing the analyzed code. It is also possible to link an existing analysis to an existing application project.
-
7.
View synchronization: The Visuflow views can be synchronized around a particular statement that is being observed by the user. This avoids confusion when browsing through different views, as observed during our pilot user study.
4. User Study
We conducted a user study to evaluate how useful Visuflow is as a debugging tool for static analysis through answering the following research questions:
-
RQ6:
Which features of Visuflow are used the most?
-
RQ7:
Does Visuflow help identify and fix more errors compared to the standard debugging environment in Eclipse?
-
RQ8:
Does Visuflow help understand and debug analyses better than other debugging environments?
4.1. Setup
We evaluate how users interact with Visuflow compared to the standard Eclipse debugging environment (home page, 2017a) (hereafter, referred to as Eclipse). Each participant performed two tasks: debugging a static analysis once with Visuflow and once with Eclipse. In the latter case, participants had access to various Eclipse debugging functionalities such as breakpoints, stepping, the variables view, and the stack frame view. To ensure a fair comparison with Visuflow, we provided participants with the Jimple intermediate representation of the analyzed code when they used Eclipse.
The two subject analyses we used are hand-crafted taint analyses that contain three errors each. Running either analysis on given programs does not compute the correct results. For each task, a participant had 20 minutes to identify and fix as many errors as possible in the analysis code. Half of the participants performed their first task with Visuflow, and the other half with Eclipse. Both groups switched tools for the second task. Before each task, participants were given time to work on a demo analysis to familiarize themselves with the tools. They then performed their task on a different analysis and analyzed code. We calibrated the difficulty of the tasks through a pilot study that we conducted on 6 participants.
During the two tasks, we measured the number of errors that participants identified and fixed. We also logged how long the mouse focus was for each view of the coding environment to evaluate the time spent using each view. Afterwards, participants were asked to fill a comparative questionnaire of the two debugging environments, followed by a short discussion of their impressions about the tools. The full-text answers presented in Section 4.3.3 were categorized by two authors in an open card sort (Hudson, 2013). Because each answer could be categorized in multiple categories, we calculated a Cohen’s Kappa for each category of each question. The average Kappa score over all questions and categories is = 0.98 (median = 1, min = 0.66, max = 1, standard deviation = 0.07), which is above the 0.81 threshold, indicating an almost perfect agreement (Landis and Koch, 1977). The user study results are available online (Nguyen Quang Do et al., 2017b).
4.2. Participants
A total of 20 people participated in our user study (referred to as P1–P20). Study participants are of diverse backgrounds: researchers in academia, researchers in industry, and students. Eleven participants have less than a year experience writing static analysis, 6 have 1–5 years of experience, and 3 have more than 5 years of experience.
Participants rated their familiarity of data-flow analysis, Eclipse, and Soot on a scale from 0 (novice) to 10 (expert). The average score is 5.7 (min: 1, max: 9) for data-flow analysis, 5.9 (min: 2, max: 8) for Eclipse, and 3.3 (min: 0, max: 7) for Soot. We thus gathered a variety of both novice and expert users in data-flow analysis and Eclipse. However, expert Soot users are rare. Only P7 and P8 participated in the survey whose results motivate the main features of Visuflow, ensuring the impartial evaluation of the remaining 18 participants.
4.3. Results
4.3.1. RQ6: Which features of Visuflow are used the most?
| Visuflow | Eclipse | |||
|---|---|---|---|---|
| #users | Time (s) | #users | Time (s) | |
| Java Editor | 14 | 486 | 14 | 653 |
| Graph View | 14 | 201 | n/a | n/a |
| Jimple View | 11 | 58 | 12 | 60 |
| Breakpoints / Stepping | 11 | 174 | 11 | 313 |
| Variable Inspection | 3 | 78 | 8 | 67 |
| Results View | 8 | 50 | n/a | n/a |
| Console | 5 | 24 | 7 | 40 |
| Drop Frame | 5 | 12 | 3 | 5 |
| Breakpoints View | 3 | 13 | 2 | 110 |
| Unit View | 3 | 7 | n/a | n/a |
Table 5 shows the number of participants who used the various views and features of Visuflow and Eclipse, and the median time they spent on each feature. Due to technical difficulties, we were able to process the logs of only 14 participants. As expected, the Java Editor is the most commonly used feature. However, the Jimple View was often used, showing that access to the intermediate representation is helpful when debugging static analysis. Other frequently used features include breakpoints, stepping, and variable inspection. The Visuflow-exclusive features that were used the most are the Graph View and the Results View (100% and 57.1% of participants, respectively).
Using Visuflow, participants spent 25.6% less time in the Java Editor, and 44.4% less time stepping through code. Instead, they spent this time using the Graph View, the Results View, and the Variable Inspection View. This shows that graph visualizations and access to the intermediate results of the analysis are desirable features for debugging. Participants used the Breakpoints View 88.2% less often in Visuflow compared to Eclipse. We attribute this to the special breakpoint features in Visuflow that allow users to step through both code bases simultaneously, sparing them the effort of writing conditional breakpoints in the Breakpoints View.
The Unit View was only used by 3 participants, all of whom are unfamiliar with Jimple. We believe that the Unit View may be more popular for tasks requiring more knowledge about Jimple statements (e.g., writing an analysis rather than debugging it). However, we cannot verify this hypothesis through our study.
Using a test of independence, we did not find a significant correlation () between the participants’ background, their Net Promoter Scores, and the tool features they used the most.
4.3.2. RQ7: Does Visuflow help identify and fix more errors compared to the standard debugging environment in Eclipse?
| Task 1 (E) | Task 2 (V) | Task 1 (V) | Task 2 (E) | |||||||
| I | F | I | F | I | F | I | F | |||
| P1 | 0 | 0 | 1 | 1 | P11 | 2 | 2 | 1 | 1 | |
| P2 | 0 | 0 | 1 | 1 | P12 | 1 | 0 | 2 | 1 | |
| P3 | 1 | 1 | 1 | 1 | P13 | 2 | 2 | 1 | 1 | |
| P4 | 1 | 0 | 1 | 1 | P14 | 2 | 1 | 0 | 0 | |
| P5 | 0 | 0 | 0 | 0 | P15 | 1 | 1 | 0 | 0 | |
| P6 | 3 | 3 | 3 | 3 | P16 | 1 | 1 | 2 | 1 | |
| P7 | 2 | 1 | 2 | 2 | P17 | 2 | 1 | 1 | 1 | |
| P8 | 2 | 1 | 0 | 0 | P18 | 2 | 1 | 1 | 1 | |
| P9 | 2 | 1 | 0 | 0 | P19 | 3 | 2 | 2 | 1 | |
| P10 | 1 | 1 | 2 | 2 | P20 | 1 | 0 | 0 | 0 | |
| Sum | 12 | 8 | 11 | 11 | 17 | 11 | 10 | 7 | ||
Table 6 reports the number of errors identified and fixed by each participant. An error is identified when a participant could explain why it occurred in the analysis code. Fixed errors are identified errors that the participant fixed later. For Task 1, participants identified and fixed 1.4 more errors with Visuflow than with Eclipse. In particular, 17 errors were identified and 11 were fixed with Visuflow compared to 12 and 8 with Eclipse for that task. For Task 2, participants identified 1.1 and fixed 1.6 more errors when using Visuflow. Overall, more participants identified (11) and fixed (10) errors using Visuflow compared to Eclipse. Using Eclipse, only 4 and 3 participants identified and fixed more errors, respectively. The remaining participants found and fixed the same number of errors with both tools. We do not compare the number of errors found by the same participant with different tools, because the two tasks were run on different, and thus incomparable, analyses.
A two-tailed Wilcoxon rank sum test does not show correlations between the tool used and the number of identified or fixed errors (). This is due to the high number of Eclipse users among our participants (12/20), causing a much lower learning curve for Eclipse. Despite this factor, 7 of those 12 participants found and fixed more errors with Visuflow than with their original debugging environment. Moreover, we found no significant correlations between the number of errors identified and fixed, and participant background (coding environment, seniority, knowledge of Soot, Eclipse, and data-flow analysis).
4.3.3. RQ8: Does Visuflow help understand and debug analyses better than other debugging environments?
After performing the tasks, participants filled out a comparative questionnaire to assess the perceived usefulness of various debugging environments. They rated Visuflow, Eclipse, and their own debugging environment through a Net Promoter Score (NPS) (Reichheld, 2003). Additionally, participants evaluated how Visuflow and Eclipse helped them perform the required tasks, and identified their preferred features in both debugging environments.
Overall, Visuflow was positively received. In the NPS questions, the 20 participants rated their likelihood of recommending a debugging environment over another one to a friend, for a task similar to the ones that they performed in the study. Visuflow has a mean NPS score of 9.1 out of 10 (standard deviation ) compared to Eclipse, and 8.3 () compared to the participant’s own debugging environment. Eclipse has a mean score of 1.4 () compared to Visuflow, and 3.4 () compared to the participant’s own debugging environment.
We then asked participants which debugging environment made it easier for them to find/fix the errors and understand the static analysis code. All participants answered that identifying errors was easier with Visuflow (“It is pretty obvious that that’s what static analysis needs.”). Sixteen participants found it easier to fix errors with Visuflow; the other 4 participants answered that both debugging environments made it equally easy. Seventeen participants wrote that Visuflow helped them understand the analysis code better (“What I was looking for in the first coding environment [Eclipse] was given to me by the second one [Visuflow]”), while 1 participant preferred Eclipse, and 2 participants remained neutral. To our surprise, the 12 participants who were already familiar with Eclipse still preferred Visuflow, showing that Visuflow is better suited than traditional debugging tools for debugging static analysis.
When asked what they would use both debugging environments for, 16 participants wrote they would use Visuflow to write and debug static analysis (“[I would use Visuflow for] visualising an analysis and finding unexpected values included or excluded from expected results”). Eleven participants found Eclipse more useful for “standard software development” or “general Java programming”.
Participants were asked to write in free-text which features of Visuflow and Eclipse they would like to have in their own debugging environments. Three participants liked Eclipse’s integrated debugger, which echoes our survey findings (Table 2). We received more requests for features that Visuflow provides. In particular, 10 participants asked for the Graph View (“visualising for provenance was useful”). Seven participants asked for visualizing intermediate results (“[Visuflow] is useful, because I get the abstract view of the situation, what’s happening inside. Before [with the other coding environment], you have to [go through all] the variables.”). Five participants asked for the special breakpoints (“[Visuflow] is more comfortable; you can set Jimple breakpoints. It is clearly better.”). Three participants asked for the synchronization between multiple views (“I think [Visuflow] is helpful because of the linkage between the Java code, the Jimple code and the graphic visualization: all that I had to keep in my mind [earlier]”). The Jimple View and the Unit Inspection View were only mentioned once. Two novice Soot users wrote that they wanted “All of them”. The features that participants find useful the most confirm our survey findings (RQ5-3), and match the participants’ behaviour (RQ6-1).
Novice analysis writers noted a gentler learning curve when using Visuflow. A participant said: “I think this approach of debugging in the CFG is easier to learn for starting with taint analysis”, and another one noted: “For someone who doesn’t do this style of debugging analysis code at all, it kind of surprised me how quickly I was able to track down bugs for a bunch of code that I don’t understand.”
5. Threats to Validity
We noticed that Q11 of the survey was misinterpreted by a few participants, because their answers do not match the explanation given in Q12. For example, a participant wrote in Q12 that “debugging SA [static analysis] is still a bit harder [than application code]”, and gave Q11 a score of 7 (scale from 1 to 10), denoting that application code is harder to debug than analysis code. In such clear cases, we reversed the score (in this example, the new score is 4) and reported the new score. We reversed only 12 scores out of 103 responses.
We conducted the user study in a controlled environment rather than in a development setting. Therefore, the setting of 20 participants, 20 minutes per task, and the analyses that were used in the user study are not quite representative of realistic uses. In practice, users would have more time to investigate much more complex analyses. Given the time limits, we had to simplify the analyses. To make them as realistic as possible, we based them on taint analyses written by experienced students in our graduate course. We then introduced typical errors made by those students. The resulting analyses are ~300 LOC long. We verified with our pilot participants that the tasks could be achieved in the time limits. To avoid further external threats to validity, we recruited participants from different backgrounds: academia, industry, students, and professionals. Visuflow is built on top of Eclipse and Soot, which are well-established both in industry and academia. It would, however, be interesting to conduct a future study with more industry participants in real-life conditions.
The times we report in Table 5 represent the mouse focus time on different views. These times are not exact, since participants attention may be divided between multiple views while the mouse can focus on only one of them. We argue that, for our user study, participants mainly used the mouse to navigate between views. In the absence of an eye-tracking device, our measurements approximate real user data. Averaged over all users, the relative difference between the times spent in each view is still a reliable metric.
6. Discussion and Future Work
Our survey collected extensive data, not only about debugging features for static analysis, but also about debugging features for general application code, motivations for writing static analysis (Q5), types of analysis written by participants (Q2, Q7, Q8), detailed analysis examples (Q10), reasons why participants debug static analysis (Q14), and why participants use a particular debugging environment (Q30). Due to space limitation, we did not report all data, but it is available online for further use (Nguyen Quang Do et al., 2017b).
We designed the current Visuflow prototype as a proof of concept to confirm the usefulness of some of the features identified in our survey. However, Visuflow, in its current version, does not scale to more complex analyses that need to handle larger graphs that would not be easily understandable. For such analyses, Visuflow has a higher latency while waiting for the analysis to terminate. We plan to address both issues in future work. Furthermore, it would be interesting to investigate and integrate more of the debugging features found in the survey (e.g., omniscient debugging and quick updates) in debugging tools like Visuflow. Visuflow is available online (Nguyen Quang Do et al., 2017b), and we encourage contributions by other researchers and practitioners.
7. Related Work
Debugging static analysis has not been a major topic in the software engineering community. In this section, we discuss prior work on visualizing static analysis information, existing debugging tools and techniques, and the usability of static analysis tools.
7.1. Debugging Static Analysis
We are not aware of any tool that is tailored to address issues specific to debugging static analysis. In past work, Andreasen et al. (Andreasen et al., 2017) suggest to employ soundness testing, delta debugging, and blended analysis to debug static analysis. By means of a few examples, they discuss how the combination of these techniques (both pairwise and all three of them) have helped them locate and fix bugs in their static analyzer TAJS. Other tools also provide a subset of the features in Visuflow, especially in terms of visualization of information and data flows. For example, Atlas (Deering et al., 2014) visualizes data-flow paths based on the abstract syntax tree (AST) of a given program. To improve user understanding and evaluating error reports, Phang et al. (Khoo et al., 2008) present a tool that visualizes program paths to help the user track where an error originates from. Unlike Visuflow, none of these tools enable static analysis writers to debug their own analyses, but are rather tailored to the users of static analysis tools (e.g., code developers), and therefore focus more on visualization features than debugging features.
7.2. Standard Debugging Tools
Most programming languages’ runtime environments are shipped with debuggers provided by the language maintainers (e.g., GDB (Debugger, 2017)). Many IDEs, such as Eclipse (home page, 2017a) and IntelliJ (home page, 2017d), integrate debugging functionalities for major programming languages natively in their tool sets. Since Visuflow is integrated into Eclipse, it uses all available features such as breakpoints and stepping. As our survey and user study have shown, such tools are designed for general application code, and do not have specific support for static analysis. There exist more complex debugging techniques such as delta debugging (Zeller and Hildebrandt, 2002), omniscient debugging (Lewis, 2003), and interrogative debugging (Ko and Myers, 2004). However, these techniques are not integrated into the most commonly used tools such as Eclipse.
7.3. Usability of Static Analysis Tools
To our knowledge, this paper presents the first large-scale survey of static analysis developers. Most of the prior surveys of developers are targeted towards static analysis users instead of writers. Ayewah et al. (Ayewah et al., 2008) present a survey of FindBugs (Shen et al., 2011) users to determine their usage habits and how they deal with the displayed warnings. The authors conclude that static analysis tools have been widely adopted by their participants, but are not used regularly, and without customization. Christakis and Bird (Christakis and Bird, 2016) asked 375 developers within Microsoft about their attitudes towards static analysis tools. The features that participants deemed most important include: better usability, better responsiveness, and pre-configured prioritization of security and best-practice aspects when it comes to error reporting. Johnson et al. (Johnson et al., 2016) investigated the warning and error reports of the static analyzer FindBugs, the Eclipse Java Compiler, and the code-coverage tool Eclemma (home page, 2017c). Nguyen Quang Do et al. (Nguyen Quang Do et al., 2017a) evaluated the impact of their Just-in-Time static analysis on the workflow of developers who use such tools to detect errors in their code. Phang et al. (Khoo et al., 2008) also tested the program-path visualization tool discussed above through a user study. However, the goal of those surveys and user studies is to assess the usability of static analyzers from the end-user perspective. This paper, on the other hand, aims at collecting requirements for a debugging tool for static analysis writers, and assess the usability of such a tool.
8. Conclusion
Writing and debugging static analysis is a difficult task. We surveyed 115 static analysis writers from different backgrounds and show that current debugging tools are not always sufficient to properly support static analysis writers. In this paper, we report the main causes of bugs in static analysis, show the major tool features used by analysis writers to debug their analyses, discuss their limitations, and identify features that would best support debugging static analysis.
We present Visuflow, a debugging environment designed specifically for debugging static analysis, including some of the features we identified in our survey. In a comparative user study between Visuflow and Eclipse, we empirically show that Visuflow enables analysis writers to debug static analysis more efficiently. Visuflow was well received by analysis writers, confirming our survey’s findings, and validating the usefulness of its debugging features.
The full list of debugging features presented in this paper can be used to design better tool support for debugging static analysis and make it easier for analysis writers to secure application code.
Acknowledgements
We thank the participants of our surveys and user studies for their invaluable input. We would also like to thank Henrik Niehaus, Shashank Basavapatna Subramanya, Kaarthik Rao Bekal Radhakrishna, Zafar Habeeb Syed, Nishitha Shivegowda, Yannick Kouotang Signe, and Ram Muthiah Bose Muthian for their work on the implementation of Visuflow. This research was supported by a Fraunhofer Attract grant as well as the Heinz Nixdorf Foundation. This work has also been partially funded by the DFG as part of project E1 within the CRC 1119 CROSSING, and was supported by the Natural Sciences and Engineering Research Council of Canada.
References
- (1)
- Andreasen et al. (2017) Esben Sparre Andreasen, Anders Møller, and Benjamin Barslev Nielsen. 2017. Systematic approaches for increasing soundness and precision of static analyzers. In Proceedings of the 6th ACM SIGPLAN International Workshop on State Of the Art in Program Analysis. ACM, 31–36.
- Ayewah et al. (2008) Nathaniel Ayewah, David Hovemeyer, J. David Morgenthaler, John Penix, and William Pugh. 2008. Experiences Using Static Analysis to Find Bugs. IEEE Software 25 (2008), 22–29. Special issue on software development tools, September/October (25:5).
- Bodden (2012) Eric Bodden. 2012. Inter-procedural data-flow analysis with IFDS/IDE and Soot. In International Workshop on State of the Art in Java Program Analysis (SOAP). 3–8. https://doi.org/10.1145/2259051.2259052
- Calcagno and Distefano (2011) Cristiano Calcagno and Dino Distefano. 2011. Infer: An Automatic Program Verifier for Memory Safety of C Programs. In NASA Formal Methods (NFM) (Lecture Notes in Computer Science), Vol. 6617. 459–465.
- Christakis and Bird (2016) Maria Christakis and Christian Bird. 2016. What Developers Want and Need from Program Analysis: An Empirical Study. In Proceedings of the 31st IEEE/ACM International Conference on Automated Software Engineering (ASE 2016). ACM, New York, NY, USA, 332–343. https://doi.org/10.1145/2970276.2970347
- Debugger (2017) GDB: The GNU Project Debugger. 2017. https://www.gnu.org/software/gdb/. (2017).
- Deering et al. (2014) Tom Deering, Suresh Kothari, Jeremias Sauceda, and Jon Mathews. 2014. Atlas: A New Way to Explore Software, Build Analysis Tools. In Companion Proceedings of the 36th International Conference on Software Engineering (ICSE Companion 2014). ACM, New York, NY, USA, 588–591. https://doi.org/10.1145/2591062.2591065
- Fortify (2017) HP Fortify. 2017. http://www8.hp.com/us/en/software-solutions/static-code-analysis-sast/. (2017).
- home page (2017a) Eclipse home page. 2017a. https://eclipse.org/. (2017).
- home page (2017b) Emacs home page. 2017b. https://www.gnu.org/software/emacs/. (2017).
- home page (2017c) Eclemma home page. 2017c. http://www.eclemma.org/. (2017).
- home page (2017d) IntelliJ home page. 2017d. https://www.jetbrains.com/idea/. (2017).
- home page (2017e) LLVM home page. 2017e. http://llvm.org/. (2017).
- home page (2017f) Vim home page. 2017f. http://www.vim.org/. (2017).
- home page (2017g) Wala home page. 2017g. http://wala.sourceforge.net/wiki/index.php/Main_Page. (2017).
- Hudson (2013) W. Hudson. 2013. Card Sorting. (2013).
- Johnson et al. (2016) Brittany Johnson, Rahul Pandita, Justin Smith, Denae Ford, Sarah Elder, Emerson Murphy-Hill, Sarah Heckman, and Caitlin Sadowski. 2016. A Cross-tool Communication Study on Program Analysis Tool Notifications. In Proceedings of the 2016 24th ACM SIGSOFT International Symposium on Foundations of Software Engineering (FSE 2016). 73–84.
- Khoo et al. (2008) Yit Phang Khoo, Jeffrey S. Foster, Michael Hicks, and Vibha Sazawal. 2008. Path Projection for User-centered Static Analysis Tools. In Proceedings of the 8th ACM SIGPLAN-SIGSOFT Workshop on Program Analysis for Software Tools and Engineering (PASTE ’08). ACM, New York, NY, USA, 57–63. https://doi.org/10.1145/1512475.1512488
- Ko and Myers (2004) Andrew Jensen Ko and Brad A. Myers. 2004. Designing the whyline: a debugging interface for asking questions about program behavior. In Proceedings of the 2004 Conference on Human Factors in Computing Systems, CHI 2004, Vienna, Austria, April 24 - 29, 2004. 151–158.
- Ko and Myers (2006) Andrew Jensen Ko and Brad A. Myers. 2006. Barista: An implementation framework for enabling new tools, interaction techniques and views in code editors. In Conference on Human Factors in Computing Systems (CHI). 387–396.
- Landis and Koch (1977) J. R. Landis and G. G. Koch. 1977. The measurement of observer agreement for categorical data. 159–174.
- Lewis (2003) Bil Lewis. 2003. Debugging Backwards in Time. CoRR cs.SE/0310016 (2003). http://arxiv.org/abs/cs.SE/0310016
- Liang et al. (2012) Guangtai Liang, Qian Wu, Qianxiang Wang, and Hong Mei. 2012. An effective defect detection and warning prioritization approach for resource leaks. In Computer Software and Applications Conference (COMPSAC). 119–128.
- Nguyen Quang Do et al. (2017a) Lisa Nguyen Quang Do, Karim Ali, Benjamin Livshits, Eric Bodden, Justin Smith, and Emerson Murphy-Hill. 2017a. Just-in-time Static Analysis. In Proceedings of the 26th ACM SIGSOFT International Symposium on Software Testing and Analysis (ISSTA 2017). ACM, New York, NY, USA, 307–317. https://doi.org/10.1145/3092703.3092705
- Nguyen Quang Do et al. (2017b) Lisa Nguyen Quang Do, Stefan Krüger, Patrick Hill, Karim Ali, and Eric Bodden. 2017b. VisuFlow. https://blogs.uni-paderborn.de/sse/tools/visuflow-debugging-static-analysis/. (2017).
- Reichheld (2003) Frederick F Reichheld. 2003. The one number you need to grow. Harvard Business Review 81, 12 (2003), 46–55.
- Ryder (1983) Barbara G. Ryder. 1983. Incremental Data Flow Analysis. In Proceedings of the 10th ACM SIGACT-SIGPLAN Symposium on Principles of Programming Languages (POPL ’83). ACM, New York, NY, USA, 167–176. https://doi.org/10.1145/567067.567084
- Sadowski et al. (2015) Caitlin Sadowski, Jeffrey Van Gogh, Ciera Jaspan, Emma Söderberg, and Collin Winter. 2015. Tricorder: Building a program analysis ecosystem. In International Conference on Software Engineering (ICSE). 598–608.
- Shen et al. (2011) Haihao Shen, Jianhong Fang, and Jianjun Zhao. 2011. Efindbugs: Effective error ranking for findbugs. In International Conference on Software Testing, Verification and Validation (ICST). 299–308.
- Vallée-Rai et al. (2000) Raja Vallée-Rai, Etienne Gagnon, Laurie J. Hendren, Patrick Lam, Patrice Pominville, and Vijay Sundaresan. 2000. Optimizing Java Bytecode Using the Soot Framework: Is It Feasible?. In CC. 18–34. https://doi.org/10.1007/3-540-46423-9_2
- Viswanathan and Shrikant (2014) Shankar Viswanathan and I Bangdiwala Shrikant. 2014. Observer Agreement Paradoxes in 2x2 Tables: Comparison of Agreement Measures. In BMC Medical Research Methodology. https://doi.org/10.1186/1471-2288-14-100
- Xie et al. (2012) Jing Xie, Heather Lipford, and Bei-Tseng Chu. 2012. Evaluating Interactive Support for Secure Programming. In Conference on Human Factors in Computing Systems (CHI). 2707–2716. https://doi.org/10.1145/2207676.2208665
- Zeller and Hildebrandt (2002) Andreas Zeller and Ralf Hildebrandt. 2002. Simplifying and Isolating Failure-Inducing Input. IEEE Trans. Software Eng. 28, 2 (2002), 183–200.