Shape of LOSVDs in barred disks: Implications for future IFU surveys
Abstract
The shape of LOSVDs (line-of-sight velocity distributions) carries important information about the internal dynamics of galaxies. The skewness of LOSVDs represents their asymmetric deviation from a Gaussian profile. Correlations between the skewness parameter () and the mean velocity () of a Gauss-Hermite series reflect the underlying stellar orbital configurations of different morphological components. Using two self-consistent -body simulations of disk galaxies with different bar strengths, we investigate correlations at different inclination angles. Similar to previous studies, we find anticorrelations in the disk area, and positive correlations in the bar area when viewed edge-on. However, at intermediate inclinations, the outer parts of bars exhibit anticorrelations, while the core areas dominated by the boxy/peanut-shaped (B/PS) bulges still maintain weak positive correlations. When viewed edge-on, particles in the foreground/background disk (the wing region) in the bar area constitute the main velocity peak, whereas the particles in the bar contribute to the high-velocity tail, generating the correlation. If we remove the wing particles, the LOSVDs of the particles in the outer part of the bar only exhibit a low-velocity tail, resulting in a negative correlation, whereas the core areas in the central region still show weakly positive correlations. We discuss implications for IFU observations on bars, and show that the variation of the correlation in the disk galaxy may be used as a kinematic indicator of the bar and the B/PS bulge.
Subject headings:
galaxies: bulges — galaxies: kinematics and dynamics – galaxies: spiral – galaxies: structure1. INTRODUCTION
Kinematic information is essential to understand disk secular evolution. It encapsulates the potential, angular momentum, and underlying stellar orbits of the disk and bar, if present. Measurement of the disk kinematics can reveal the disk formation history, the bar and spiral arms growths and evolutions, and allow to estimate the dynamical mass of the whole disk.
Integral-field unit (IFU) spectroscopic observations of nearby disk galaxies provide 2D spatially-resolved spectral information, whereby important kinematic properties can be measured. They are a powerful tool to investigate bar kinematics (e.g. Cappellari et al., 2007; Krajnović et al., 2011). IFU surveys such as ATLAS3D (Cappellari et al., 2011), CALIFA (Sánchez et al., 2012; García-Benito et al., 2015), SLUGGS (Brodie et al., 2012, 2014), SAMI (Croom et al., 2012; Bryant et al., 2015), MaNGA (Bundy et al., 2015), and MUSE (Bacon et al., 2010) have led to significant progress in our understanding of disk galaxy formation and evolution.
The shape of line-of-sight velocity distributions (LOSVDs) can be described by Gauss-Hermite series. Key kinematic information includes the mean velocity (), velocity dispersion (), and the third and fourth Gauss-Hermite coefficients and , describing the asymmetric (“skewness”) and symmetric (“kurtosis”) deviations from a Gaussian profile, respectively (Gerhard, 1993; van der Marel & Franx, 1993; Bender et al., 1994). Positive indicates a high-velocity tail, and negative a low-velocity tail. For , a positive value indicates a sharp central peak, and a negative value results from a flat-top profile. Correlations between and the mean line-of-sight velocity reflect the underlying stellar orbits.
Commonly seen in disk galaxies, bars play important roles in their secular evolution (e.g. Kormendy & Kennicutt, 2004). Bureau & Athanassoula (2005) used -body simulations to confirm the negative correlation (i.e. anticorrelation) observed in edge-on disks and the positive correlation observed in bars, as reported in previous long-slit observations of edge-on galaxies (e.g. Fisher, 1997; Chung & Bureau, 2004) and the theoretical orbital analysis by Bureau & Athanassoula (1999). They suggested that LOSVDs with a high-velocity tail (positive correlation) may be tracers of bars. Debattista et al. (2005) also suggested that when viewed face-on, boxy/peanut-shaped (B/PS) bulges tend to show values in the inner regions that are smaller than elsewhere (also see Iannuzzi & Athanassoula, 2015). In doubly barred disks, Du et al. (2016) found peaks in the line-of-sight (LOS) velocity dispersion near the inner bars, and anticorrelations in the inner bars for certain orientations. These Gauss-Hermite coefficients relations are important indices that can be used to understand bar kinematics and evolution when compared to IFU observations.
To understand the (anti-)correlations, and the reasons behind those correlations, we carry out a study based on two self-consistent -body simulations of disk galaxies with different bar strengths. We also investigate the inclination angle (and bar viewing angle) dependence of key kinematic features, especially in the B/PS bulge regions.
The paper is organized as follows. Section 2 describes the two simulations. The results and corresponding discussion are presented in Sections 3 and 4, respectively. Key results are summarized in Section 5.
2. SIMULATIONS
Two disk galaxy -body simulations with different bar amplitudes are analyzed here. Face-on and edge-on projections of the two models are shown in the top and middle panels of Fig. 1 in Li & Shen (2015). Compared to Model 2, the bar in Model 1 is longer and stronger, that has experienced higher buckling instability, resulting in a more prominent B/PS bulge (Combes & Sanders, 1981; Raha et al., 1991). Initially, the two models are featureless exponential disks. In Model 1, two million disk particles evolve in a live dark matter halo, consisting of 2.5 million particles with a compressed King profile ( and ; see Sellwood & McGaugh 2005 for details of the adiabatic compression). Model 2 was shown to reproduce well the photometric and kinematic properties of the Galactic Bulge in Shen et al. (2010). It consists of one million disk particles rotating in a rigid dark matter halo potential. Bars in both models grow quickly to form an inner B/PS bulge. In previous studies, the two models (especially Model 2) have been used extensively to understand the structure and kinematic properties of the Galactic bulge and disk (e.g. Shen et al., 2010; Li & Shen, 2012; Li et al., 2014; Molloy et al., 2015a, b; Nataf et al., 2015; Qin et al., 2015; Li & Shen, 2015).
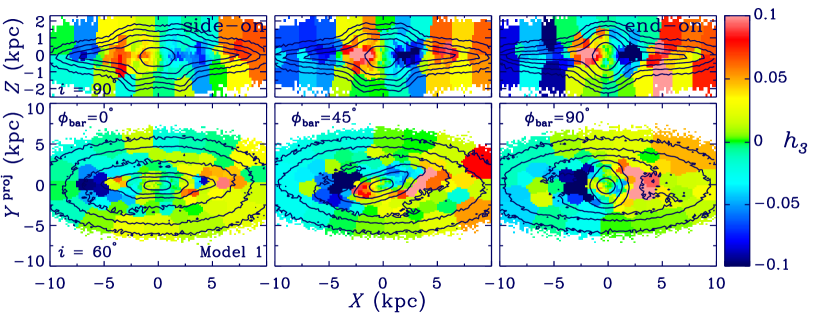
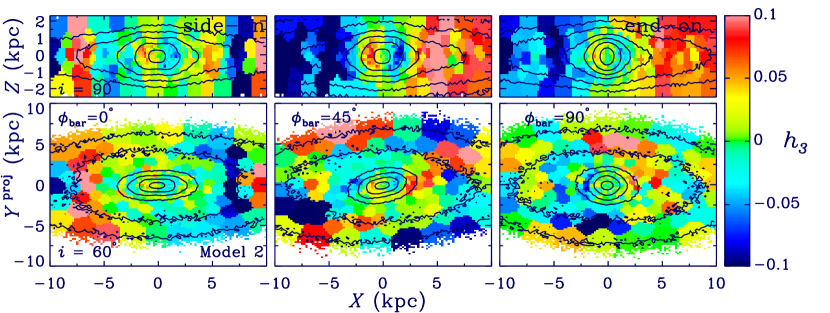
To understand the inclination dependence of key kinematic properties, the two models are projected with moderate and edge-on inclination angles () and different bar viewing angles ().111Close to face-on (), LOS velocities are too small to show clear pattern. is the angle between the major axis of the bar and the major axis of the inclined disk ( is thus a side-on bar and an end-on bar). To calculate , , , and , we fit the Gauss-Hermite series to the LOSVDs up to the fourth order.222We also fit the Gauss-Hermite series up to the eighth order. The fourth-order and eighth-order fit yield consistent results, with the fifth and higher order coefficients being negligible. maps of the edge-on disks () and moderately inclined disks () in Models 1 and 2 are shown in Figs. 1 and 2, respectively. We used the Voronoi binning method of Cappellari & Copin (2003) (with ). The disks in the two models rotate clockwise as seen from , i.e. positive (receding) at and vice versa.
3. Results
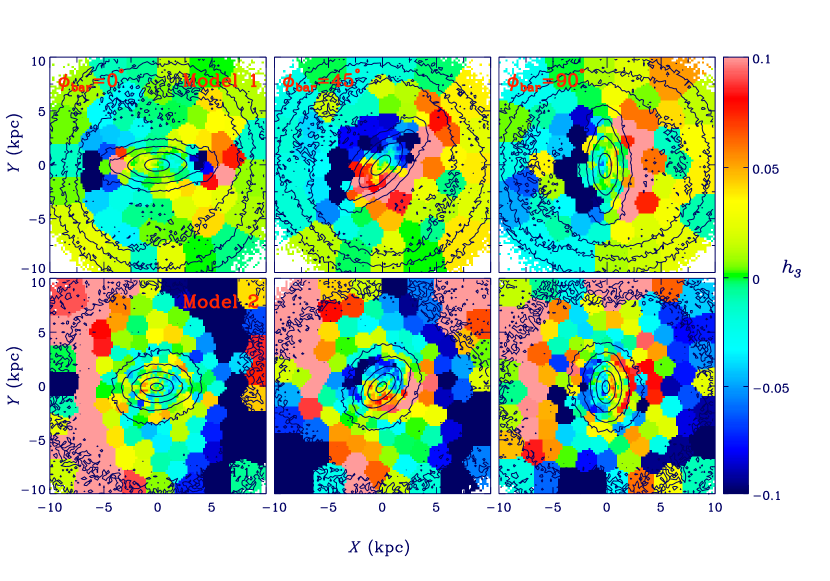
For Model 1, in the edge-on view (top row in Fig. 1), inside the bar area ( kpc), and exhibit positive correlations, with larger values in the end-on cases (; third column) than the side-on cases (; first column). In the outer disks ( kpc), generally anti-correlates with , as expected. These results are consistent with previous studies (Bureau & Athanassoula, 2005) and the kinematics of the Milky Way bar/bulge (Zhou et al., 2017).
For moderately inclined disks (, bottom row of Fig. 1), inside the outer parts of the bars, the correlations change drastically from positive to negative, whereas the core areas dominated by the B/PS bulges (within about half the bar length) still show weak positive correlations. This is most significant in the second and third columns for Model 1 ( and ). This phenomenon was first noticed in Bureau & Athanassoula (2005) and confirmed in Iannuzzi & Athanassoula (2015). They found that the correlation in the bar region decreases as decreases, and even becomes anticorrelation for . This is consistent with our results, except the core areas, which maintain positive correlations. From the top left panel in Fig. 1, it seems that the iso-density contours of Model 1 in the edge-on view with a side-on bar are not symmetric with respect to the mid-plane. The buckling event may not be completely finished. We have performed similar analysis in earlier snapshots of this simulation. The main results are unchanged.
For Model 2, as shown in Fig. 2, it exhibits consistent pattern with Model 1 with smaller amplitude and weaker correlation. Note that in the first column of Fig. 2, the disk area at kpc shows a positive correlation along the major axis of the bar. This feature may be related to the Outer Lindblad Resonance (OLR) of the bar in Model 2. According to Binney & Tremaine (2008), we estimate the location of OLR of the two models by comparing the bar pattern speed () and the radial profiles of . The location of OLR is 14 kpc for Model 1 (), and 8 kpc for Model 2 (). The bar rotates slower in Model 1, thus resulting in a larger OLR radius and the absence of this feature in the disk of Model 1.
4. DISCUSSION
4.1. LOSVDs in disk and bar areas
The most direct way to understand the correlations is dissecting the LOSVDs themselves. We thus select typical fields in the disk and bar areas. For the edge-on and moderately inclined viewing angles, the selected disk areas are at kpc, while the selected bar areas are at kpc. The selected core areas are at kpc. All three areas are restricted with kpc.
4.1.1 Edge-on disks ()
Theoretically, for an axisymmetric edge-on disk, the main peak of the LOSVD at any given position is contributed by particles at the tangent point of nearly circular orbits, with a low-velocity tail from the projected stellar orbits away from (both in front and beyond) the tangent point (Bureau & Athanassoula, 2005). This generates the usual anticorrelation.
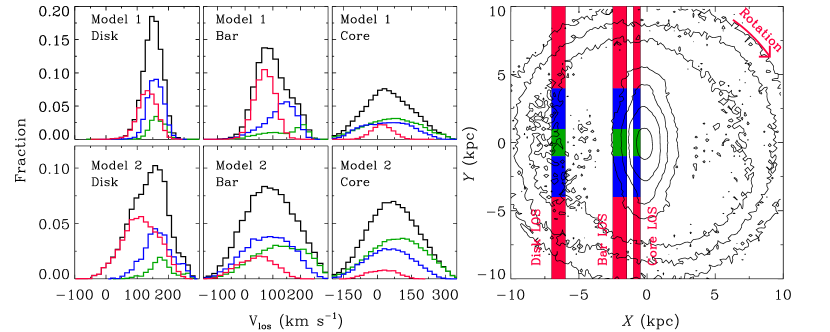
The LOSVDs of the disk and bar areas in the edge-on view with an end-on bar are shown in Fig. 3. As shown in the right panel, along each LOS, the particles are separated into three subsamples according to the distance from the tangent point, representing a tangent region (green, kpc), an intermediate region (blue, kpc), and a wing region (red, kpc). The corresponding LOSVDs of the disk areas in the two models are shown in the first column with the same color scheme. As expected, the green histograms peak at the highest velocities, km s-1, while the blue and red histograms peak at lower velocities, 160 and 100 km s-1, respectively. This agrees with the theoretical expectations that the tangent points lead to the highest velocities, while the wing regions lead to low velocities. For the total LOSVDs, the low-velocity tails are mainly contributed by the red histograms. The combined effect is the usual anticorrelation.
The three-dimensional orbital configuration of bars has been extensively studied in the literature (Pfenniger, 1984; Pfenniger & Friedli, 1991; Skokos et al., 2002a, b; Patsis et al., 2002, 2003). Inside the bar, the main orbit families of -body simulations can be regarded as three-dimensional generalizations of the main two-dimensional orbit family, i.e. the family corresponding to orbits elongated parallel to the bar (Bureau & Athanassoula, 2005). The orbits lead to higher LOS velocities than the outer orbits in the end-on bar view, and much lower velocities in the side-on bar view (Bureau & Athanassoula, 1999). As the viewing angle to the bar approaches end-on, the velocity distribution from the elongated orbits in the bar shifts towards velocities higher than those of circular orbits. Considering the low-velocity contributions from quasi-circular (foreground and background) projected disk orbits surrounding the bar, the combined effect is a high-velocity tail, i.e. an unusual positive correlation.
For our two models, the velocity distributions in the bar field are shown in the second column of Fig. 3. Clearly, the green histograms show much larger peak velocities ( 200 km s-1) than those of the blue histograms (intermediate regions). The red histograms (wing regions) show the lowest peak velocities ( 50 km s-1). This is fully consistent with the theoretical expectations of the orbit family. However, in the bar areas, both the green and blue histograms show low-velocity tails, i.e. large negative values (when considered independently). This is more significant in Model 1, with a strongly buckled bar (). The LOSVDs inside the bar areas show low-velocity tails and large dispersion. The orbits seem unlikely to contribute to such low-velocity tails. Other orbital families are needed to explain this feature.
As shown in the third column of Fig. 3, the core areas have large velocity dispersions. The green histograms’ peak velocities are slightly higher than those of the blue histograms. The LOSVDs in tangent and intermediate regions are quite symmetric, with small values. The total LOSVDs show weak positive correlations.
We also study the LOSVDs in the bar and disk areas in the edge-on disk with a side-on bar. The results are shown in Fig. 4. In the bar area, the LOSVDs become much broader than the end-on case, resulting in a much weaker amplitude and correlation.
Fig. 5 shows the face-on view of the maps of for the two models in different bar angles. actually represents the LOS velocity in the edge-on view with the observer in the plane and the corresponding LOS perpendicular to the -axis. This provides a clear visualization of the spatial distribution of values in different regions of the galaxy. The disks rotate clockwise. In the bar region, the outer part exhibits clear anticorrelation with . This is consistent with Figs. 3 and 4. The disk of Model 2 at kpc shows positive correlation, probably due to the influence of OLR.
4.1.2 Moderately inclined disks ()
At slightly smaller inclination angles (), correlations change dramatically. As shown in Figs. 1 and 2, values in the disk area decrease at smaller inclinations, while inside the bar areas, especially in the end-on cases, the correlations change from positive to negative in the outer parts of the bars. The core areas maintain weak positive correlations.
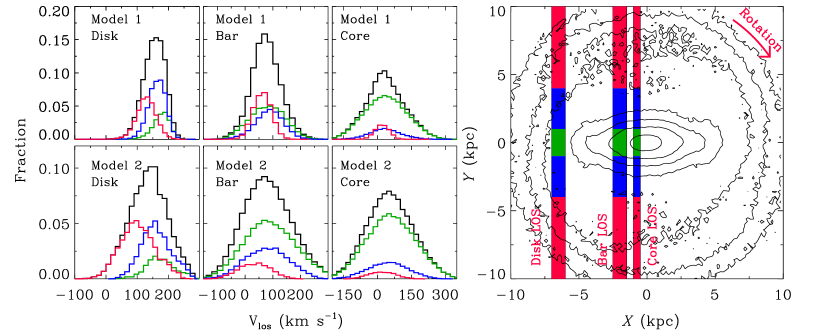
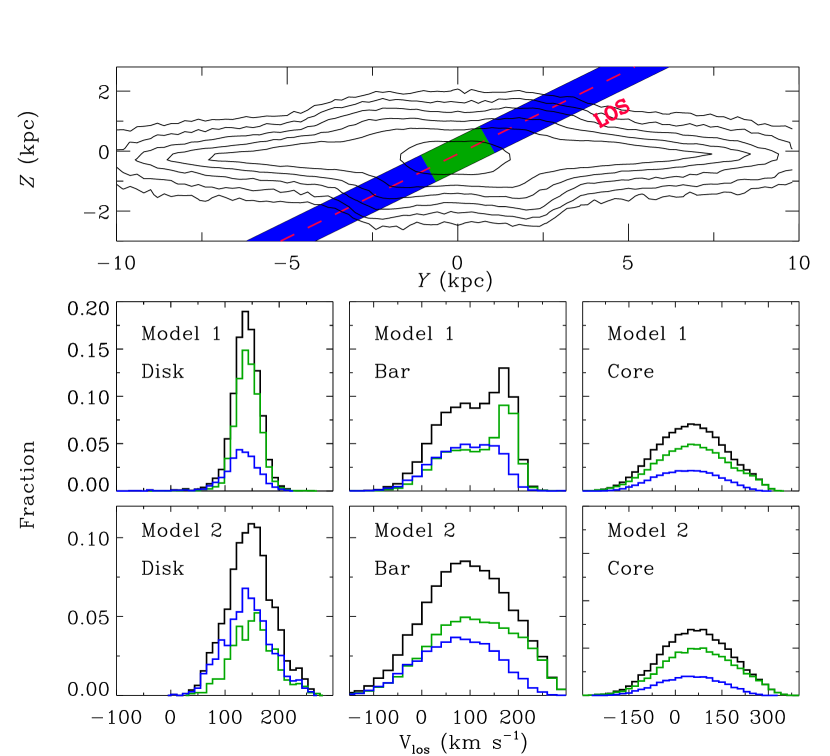
For lines-of-sight through the disks at with an end-on bar, as shown in the top panel of Fig. 6, the depths along the lines-of-sight (8 kpc) are roughly twice the vertical thickness of the disks (4 kpc).333The top panel shows the iso-density contours in the plane. Therefore the bar is in side-on view. The selected disk, bar and core areas have different ranges, but the same and ranges. The red dashed line represents the projected LOS of the disk, bar and core areas. For planar orbits, a inclination will cause a 13% reduction of . The velocity distributions will thus shift to slightly lower velocities and become narrower. We again divide the particles into two groups, i.e. the tangent region (green) and an intermediate region (blue). Due to the smaller depths along the lines-of-sight, we cannot define a wing region kpc away from the tangent point, as before.
For the disk areas, as shown in the left column of Fig. 6, the green histograms peak at km s-1, the blue ones at km s-1. The values are very small for the combined histograms, due to the lack of low-velocity contributions from the wing regions as in the edge-on cases.
In the outer part of the bar, in the middle column of Fig. 6, both the green and blue histograms show clearly skewed distributions with low-velocity tails. Here, in the moderately inclined cases, the lines-of-sight do not go through the outer disk areas. Without the low LOS velocity contributions from the outer disks, the bars themselves display the unusual anticorrelations. The velocity distribution of the tangent region (green histogram) in Model 1 seems to be composed of two components, i.e. a narrow peak 170 and a broad peak 50 . Similar feature can also be seen in the green histogram (tangent region) in the top middle panel of Fig. 3 for the bar area. The high velocity narrow peak is probably related to the orbits, while the broad low velocity peak may be due to other orbital families in the bar.
In the core area, as shown in the right column of Fig. 6, the LOSVDs of the tangent and intermediate regions have large velocity dispersions and small values. The weak positive correlations at inclination in the core area are consistent with the edge-on cases, where the LOSVDs are dominated by the tangent and intermediate regions.
We also tried considering only the bar particles in the simulations. Regardless of the inclination angles, there are positive and negative correlations in the core and outer bar areas, respectively, consistent with the previous argument.
In this work, we found similar phenomena as Iannuzzi & Athanassoula (2015), but we strive to understand the reason behind this. Along each LOS, by dissecting the particles into tangent, intermediate and wing regions, we investigate the shape of the LOSVDs causing the correlation. For the bar area, the dependence of the correlation on the inclination angle is also explained with the combination of the LOSVDs from the tangent, intermediate and/or wing regions.
4.2. Comparison with IFU observations of nearby galaxies
Direct comparison between our simulation predictions and the IFU observations is not straightforward. derived from the observed spectra is sensitive to dust extinction correction and has large fluctuations (Seidel et al., 2015). Moreover, bars are often accompanied with nuclear disks, nuclear bars or pseudobulges, that may affect the correlation in the core region.
Our pure bar models at moderate inclinations () predict a positive correlation in the core and an anticorrelation in the outer part of the bar. In edge-on view, the simulations exhibit a positive correlation in the bar region. According to previous simulations (Bureau & Athanassoula, 2005; Iannuzzi & Athanassoula, 2015), the signature is strongest with relatively large inclination angles () and bar viewing angles (). Seidel et al. (2015) studied 2D kinematics of 16 barred galaxies observed with SAURON IFU. Unfortunately, only 2 galaxies have relatively large inclination angles () and large , i.e. NGC 2543 and NGC 5350. For the two galaxies, we do see anticorrelations in the outer part of the bar, consistent with our predictions for the bar kinematics at moderate inclination angles. Similar anticorrelation in the bar region was reported in Saburova et al. (2017) with long-slit observations of UGC 1344.
If the iso-density contours are more peanut-like, with weak values, then the bar is probably aligned with the projected major axis of the disk, i.e. . If the iso-density contours are more spheroidal with strong positive correlations between and , is close to . Recently, Opitsch et al. (2017) mapped the kinematics of the M31 bulge region, and found a positive correlation. Considering the relatively large inclination angle of M31 (close to edge-on), this positive correlation and the lack of clear B/PS isophotes probably imply the existence of an end-on bar in M31, also consistent with our predictions.
Our simulations do not include nuclear substructures in the central region of the bar. For real galaxies, additional substructures, e.g. nuclear disk, secondary bars, or pseudobulges (Kormendy & Kennicutt, 2004), could overwhelm the weak correlation predicted by our models. In fact, Seidel et al. (2015) detected anticorrelations in the core regions in half of their sample. The detected anticorrelation probably hints for a kinematically decoupled substructure, since a pure bar model predicts weak positive correlations in the core region. In the future, we will make more tests with more sophisticated simulations including the later formation of nuclear substructures (e.g. Cole et al., 2014).
4.3. Bars and B/PS bulges identification
In edge-on galaxies, the disks generally show anticorrelations, while the bars display positive correlations. Therefore, based on the area showing a positive correlation in long-slit or IFU observations, the bar existence may be revealed. The bar roughly corresponds to the region with positive correlation. In addition, the amplitude depends on the viewing angle of the bar. An end-on bar usually shows larger values than a side-on bar.
In a moderately inclined disk, the bar can be directly measured from the image at small . When is close to , a bar may be difficult to identify. In this case, negative correlations in the inner region of the disk can help to confirm the existence of a bar.
Recent observational studies have identified B/PS bulges in local disk galaxies (Erwin & Debattista, 2017; Li et al., 2017). From our results, for a barred galaxy with B/PS bulge in moderate inclinations, without the presence of nuclear substructures, the core area could be identified by the central positive correlation, with the outer part of the bar showing negative correlation. This feature is different from results of the pure bar models without B/PS bulges. Iannuzzi & Athanassoula (2015) investigated the individual contribution of bars and B/PS bulges on the observed kinematics by comparing a simulation in pre- and post-B/PS formation. They found quite significant differences in velocity dispersion, and maps, with B/PS bulges showing strong and features off the kinematic-major axis. The in-plane values are also boosted with B/PS bulge. At smaller inclination angles, the simulations without B/PS bulges show negative correlation in the bar and the core regions. We performed similar analysis by analyzing the snapshots of our models with pre- and post-B/PS formation. The results are consistent with Iannuzzi & Athanassoula (2015).
5. SUMMARY
We use two -body simulations of disk galaxies with different bar strengths to investigate their disk kinematics and dependence on inclination. For the disks viewed edge-on, we confirm the negative and positive correlations in the disk and bar areas, respectively. The amplitude is larger in bars viewed end-on than side-on. At inclination, the amplitude in the disk areas is smaller, while in the bar areas, the correlations change from positive to negative in the outer parts of bars, and remain weakly positive in the core area dominated by the B/PS bulge.
To understand the origin of the correlation, we dissect the LOSVDs in the bar and disk areas at different inclination angles. In the edge-on views, for the disk areas, the tangent region of the underlying quasi-circular orbits along the LOS leads to the highest velocities, while the regions far from the tangent point mainly lead to a significant low-velocity contribution. The combined distribution thus shows an anticorrelation. In the bar areas, the bar particles lead to velocities even higher than those of circular orbits, changing the combined LOSVD to one with a high-velocity tail, thus resulting in a positive correlation. These results are consistent with theoretical expectations. However, for bar particles only, the LOSVDs in the outer part of the bar show significant low-velocity tails, which seems unlikely to be contributed by orbits.
At a inclination, the depths along the lines-of-sight decrease from 20 kpc to 8 kpc. All velocities decrease by 13% due to the projection effect. Because of the smaller depths along the lines-of-sight, there is no contribution from low-velocity disk particles surrounding the bars. Therefore the total LOSVDs are mainly contributed to by the tangent and intermediate regions. In the disk areas, the LOSVDs are fairly symmetric with very small , while in the bar areas, the LOSVDs of the tangent and intermediate regions show negative correlations in the outer parts of the bars, and weak positive correlations in the core areas. This results in the observed contrasting behavior with respect to the edge-on cases, and is confirmed by a test using the bar particles, where both the edge-on and moderately inclined disks show anticorrelations between and in the outer parts of the bars, and weak positive correlations in the core areas.
We also compare with IFU observations and find our predictions roughly consistent with IFU and long-slit observations of nearby galaxies in the bar region, suggesting that the correlation could be a good indicator for the bar identification. For a disk viewed edge-on, the bar can be associated with the area showing a positive correlation. In moderately inclined disks, and are anti-correlated in the outer parts of the bars. In long-slit and IFU observations of moderately inclined disks, the anticorrelations seen in the bar areas are thus fully consistent with bar kinematics; there is no need for an additional disk to explain the anticorrelations.
From our results, we can see that the core region dominated by the B/PS bulge shows positive correlation at moderately inclination angle, whereas the outer parts of the bars show negative correlation. This feature is absent for simulations without B/PS bulges, that only show weak anticorrelations in the bar region. This drastic feature in the bar area can be used in B/PS bulge identification.
We thank the anonymous referee for constructive suggestions that helped to improve the paper. The research presented here is partially supported by the 973 Program of China under grant no. 2014CB845700, by the National Natural Science Foundation of China under grant nos. 11773052, 11333003, 11322326, and 11403072, and by a China-Chile joint grant from CASSACA. ZYL is supported by the Youth Innovation Promotion Association, Chinese Academy of Sciences. His LAMOST Fellowship is supported by Special Funding for Advanced Users, budgeted and administrated by Center for Astronomical Mega-Science, Chinese Academy of Sciences (CAMS). JS acknowledges support from an Newton Advanced Fellowship awarded by the Royal Society and the Newton Fund, and from the CAS/SAFEA International Partnership Program for Creative Research Teams. MD is supported by the “National Postdoctoral Program for Innovative Talents” grant from the China Postdoctoral Science Foundation. VPD is supported by STFC consolidated grant #ST/M000877/1 and acknowledges the personal support of George Lake, and of the Pauli Center for Theoretical Studies, which is supported by the Swiss National Science Foundation (SNF), the University of Zürich, and ETH Zürich during a sabbatical visit in 2017. This work made use of the facilities of the Center for High Performance Computing at Shanghai Astronomical Observatory.
References
- Bacon et al. (2010) Bacon, R., Accardo, M., Adjali, L., et al. 2010, in Proc. SPIE, Vol. 7735, Ground-based and Airborne Instrumentation for Astronomy III, 773508
- Bender et al. (1994) Bender, R., Saglia, R. P., & Gerhard, O. E. 1994, MNRAS, 269, 785
- Binney & Tremaine (2008) Binney, J., & Tremaine, S. 2008, Galactic Dynamics: Second Edition (Princeton University Press)
- Brodie et al. (2012) Brodie, J. P., Usher, C., Conroy, C., et al. 2012, ApJ, 759, L33
- Brodie et al. (2014) Brodie, J. P., Romanowsky, A. J., Strader, J., et al. 2014, ApJ, 796, 52
- Bryant et al. (2015) Bryant, J. J., Owers, M. S., Robotham, A. S. G., et al. 2015, MNRAS, 447, 2857
- Bundy et al. (2015) Bundy, K., Bershady, M. A., Law, D. R., et al. 2015, ApJ, 798, 7
- Bureau & Athanassoula (1999) Bureau, M., & Athanassoula, E. 1999, ApJ, 522, 686
- Bureau & Athanassoula (2005) Bureau, M., & Athanassoula, E. 2005, ApJ, 626, 159
- Cappellari & Copin (2003) Cappellari, M., & Copin, Y. 2003, MNRAS, 342, 345
- Cappellari et al. (2007) Cappellari, M., Emsellem, E., Bacon, R., et al. 2007, MNRAS, 379, 418
- Cappellari et al. (2011) Cappellari, M., Emsellem, E., Krajnović, D., et al. 2011, MNRAS, 413, 813
- Chung & Bureau (2004) Chung, A., & Bureau, M. 2004, AJ, 127, 3192
- Cole et al. (2014) Cole, D. R., Debattista, V. P., Erwin, P., Earp, S. W. F., & Roškar, R. 2014, MNRAS, 445, 3352
- Combes & Sanders (1981) Combes, F., & Sanders, R. H. 1981, A&A, 96, 164
- Croom et al. (2012) Croom, S. M., Lawrence, J. S., Bland-Hawthorn, J., et al. 2012, MNRAS, 421, 872
- Debattista et al. (2005) Debattista, V. P., Carollo, C. M., Mayer, L., & Moore, B. 2005, ApJ, 628, 678
- Du et al. (2016) Du, M., Debattista, V. P., Shen, J., & Cappellari, M. 2016, ApJ, 828, 14
- Erwin & Debattista (2017) Erwin, P., & Debattista, V. P. 2017, MNRAS, 468, 2058
- Fisher (1997) Fisher, D. 1997, AJ, 113, 950
- García-Benito et al. (2015) García-Benito, R., Zibetti, S., Sánchez, S. F., et al. 2015, A&A, 576, A135
- Gerhard (1993) Gerhard, O. E. 1993, MNRAS, 265, 213
- Iannuzzi & Athanassoula (2015) Iannuzzi, F., & Athanassoula, E. 2015, MNRAS, 450, 2514
- Kormendy & Kennicutt (2004) Kormendy, J., & Kennicutt, Jr., R. C. 2004, ARA&A, 42, 603
- Krajnović et al. (2011) Krajnović, D., Emsellem, E., Cappellari, M., et al. 2011, MNRAS, 414, 2923
- Li et al. (2017) Li, Z.-Y., Ho, L. C., & Barth, A. J. 2017, ApJ, 845, 87
- Li & Shen (2012) Li, Z.-Y., & Shen, J. 2012, ApJ, 757, L7
- Li & Shen (2015) Li, Z.-Y., & Shen, J. 2015, ApJ, 815, L20
- Li et al. (2014) Li, Z.-Y., Shen, J., Rich, R. M., Kunder, A., & Mao, S. 2014, ApJ, 785, L17
- Molloy et al. (2015a) Molloy, M., Smith, M. C., Evans, N. W., & Shen, J. 2015a, ApJ, 812, 146
- Molloy et al. (2015b) Molloy, M., Smith, M. C., Shen, J., & Wyn Evans, N. 2015b, ApJ, 804, 80
- Nataf et al. (2015) Nataf, D. M., Udalski, A., Skowron, J., et al. 2015, MNRAS, 447, 1535
- Opitsch et al. (2017) Opitsch, M., Fabricius, M. H., Saglia, R. P., et al. 2017, ArXiv e-prints, arXiv:1707.06652
- Patsis et al. (2002) Patsis, P. A., Skokos, C., & Athanassoula, E. 2002, MNRAS, 337, 578
- Patsis et al. (2003) Patsis, P. A., Skokos, C., & Athanassoula, E. 2003, MNRAS, 342, 69
- Pfenniger (1984) Pfenniger, D. 1984, A&A, 134, 373
- Pfenniger & Friedli (1991) Pfenniger, D., & Friedli, D. 1991, A&A, 252, 75
- Qin et al. (2015) Qin, Y., Shen, J., Li, Z.-Y., et al. 2015, ApJ, 808, 75
- Raha et al. (1991) Raha, N., Sellwood, J. A., James, R. A., & Kahn, F. D. 1991, Nature, 352, 411
- Saburova et al. (2017) Saburova, A. S., Katkov, I. Y., Khoperskov, S. A., Zasov, A. V., & Uklein, R. I. 2017, MNRAS, 470, 20
- Sánchez et al. (2012) Sánchez, S. F., Kennicutt, R. C., Gil de Paz, A., et al. 2012, A&A, 538, A8
- Seidel et al. (2015) Seidel, M. K., Falcón-Barroso, J., Martínez-Valpuesta, I., et al. 2015, MNRAS, 451, 936
- Sellwood & McGaugh (2005) Sellwood, J. A., & McGaugh, S. S. 2005, ApJ, 634, 70
- Shen et al. (2010) Shen, J., Rich, R. M., Kormendy, J., et al. 2010, ApJ, 720, L72
- Skokos et al. (2002a) Skokos, C., Patsis, P. A., & Athanassoula, E. 2002a, MNRAS, 333, 847
- Skokos et al. (2002b) Skokos, C., Patsis, P. A., & Athanassoula, E. 2002b, MNRAS, 333, 861
- van der Marel & Franx (1993) van der Marel, R. P., & Franx, M. 1993, ApJ, 407, 525
- Zhou et al. (2017) Zhou, Y., Shen, J., Liu, C., et al. 2017, ApJ, 847, 74