Molecular Communications at the Macroscale: A Novel Framework for Modeling Epidemic Spreading and Mitigation
Abstract
Using the notion of effective distance proposed by Brockmann and Helbing, complex spatiotemporal processes of epidemic spreading can be reduced to circular wave propagation patterns with well-defined wavefronts. This hidden homogeneity of contagion phenomena enables the mapping of virtual mobility networks to physical propagation channels. Subsequently, we propose a novel communications-inspired model of epidemic spreading and mitigation by establishing the one-to-one correspondence between the essential components comprising information and disease transmissions. The epidemic processes can be regarded as macroscale molecular communications, in which individuals are macroscale information molecules carrying messages (epidemiological states). We then present the notions of normalized ensemble-average prevalence (NEAP) and prevalence delay profile (PDP) to characterize the relative impact and time difference of all the spreading paths, which are analogous to the classical description methods of path loss and power delay profile in communications. Furthermore, we introduce the metric of root mean square (RMS) delay spread to measure the distortion of early contagion dynamics caused by multiple infection transmission routes. In addition, we show how social and medical interventions can be understood from the perspectives of various communication modules. The proposed framework provides an intuitive, coherent, and efficient approach for characterization of the disease outbreaks by applying the deep-rooted communications theories as the analytical lens.
Index Terms:
Communications-inspired epidemic modeling, macroscale molecular communications, prevalence, delay profile, social and medical interventionsI Introduction
The transmission of emergent infectious diseases has caused global public health emergencies [1, 2, 3, 4]. The worldwide trend of urbanization and rapid growth in connectivity among metropolitan cities have greatly increased the risk that highly contagious pathogens will spread. In particular, transportation networks made of air traffic and high-speed rail have resulted in fast and frequent fluxes of individuals. Furthermore, the scale-free nature of the underlying mobility networks [5] implies that any virulent disease can spread through the global population [6, 7]. On one hand, it is critical to implement timely and effective intervention strategies to reduce the socioeconomic impact of a pandemic event [2]. On the other hand, it becomes increasingly difficult to contain and mitigate an outbreak [8, 9]. A key challenge is thus to design reliable models that capture the fundamental transmission characteristics of contagion phenomena, gain insights into the optimal intervention strategies such as vaccination and quarantine, and generate accurate epidemic forecasts for public health decision-making [10, 11].
When significant uncertainty clouds the epidemiology of an infectious disease, phenomenological models provide a starting point for generating early epidemic growth profiles [12, 13]. Nevertheless, a phenomenological approach cannot evaluate which mechanisms (e.g., airborne vs. close contact transmission model, population behaviour changes, individual heterogeneity in susceptibility and infectivity) might be responsible for the empirical patterns. In this regard, a series of large-scale, parameter-rich epidemic simulators based on mechanic transmission models have been proposed [10]. Models range from metapopulation formulations that include discrete and identifiable subpopulations [14, 15], spatially continuous formulations that consider a population being continuously distributed across space [16, 17], and individual-level formulations that summarize disease-causing interactions at the individual scale [11].
Recently, a simple yet efficient measure derived from the underlying mobility network has been proposed to estimate the infection arrival time, which is given by a logarithmic ad hoc edge weight transformation requiring that adding edges should translate to multiplying the associated probabilities [18, 7]. This measure is called effective distance and follows the intuitive idea that a smaller number of passengers effectively increase the distance between neighboring nodes. The epidemic arrival time obtained from numerical simulations correlates highly with the shortest-path effective distance [18]. The correlation becomes even higher when all walks that connect source and target are included [7]. This phenomenon results in a circular wave propagating outwards at a constant speed from the infected node at time zero to all other nodes and permits effective detection of the initial outbreak location. This hidden homogeneity of contagion media permits the mapping of virtual mobility networks to physical propagation channels. Nevertheless, this approach only focuses on the statistics of the earliest arrival time of infection [19, 20] without looking into the role and relative importance of the multiple transmission paths in terms of both delay and prevalence. Furthermore, the analytical framework in [18, 7] does not provide an intuitive, coherent, and efficient approach that captures the interrelationship between the dynamics of the initial-stage, small community-level outbreaks and the air-traffic-mediated large-scale spreading. Finally, the model in [18, 7] does not incorporate inherently the influence of therapeutic and social resources to minimize the impact of the outbreak.
Here we propose a novel communications-inspired model of contagion phenomena that remedies the aforementioned drawbacks. The initial stage of an outbreak is the information-bearing signal, the departure and arrival of an infected person from the origin city to the target city by air transportation correspond to the transmission and reception of signals, and the multiple paths linking the origin to the target are the communication channel. Moreover, the medical interventions such as socially targeted antiviral prophylaxis, dynamic mass vaccination, and the social distancing at the local scale [21] are modeled as pulse shaping processes, whereas the social distancing at longer scales such as long-range air travel restriction is modeled by the organizational flow of message carriers (e.g., the magnetic gradient guiding the motion of message carriers in externally controllable and trackable communications [22]). The infection spreading can be regarded as macroscale molecular communications [23, 24, 25], in which individuals are macroscale information molecules carrying messages (epidemiological states). The proposed approach provides new insight into disease transmission by utilizing description methods traditionally only used in the communications field (e.g., path loss, delay profile, delay spread) for characterization of epidemic growth and mitigation.
The paper is organized as follows. Section II presents the one-to-one correspondence between the communications system and the epidemic spreading and control process. Section III discusses the communications-inspired description methods for epidemic spreading. Section IV provides numerical examples to demonstrate the main properties of the proposed modeling framework. Finally, some concluding remarks are drawn in Section V.
II Analogy between Communications System and Epidemic Spreading and Control
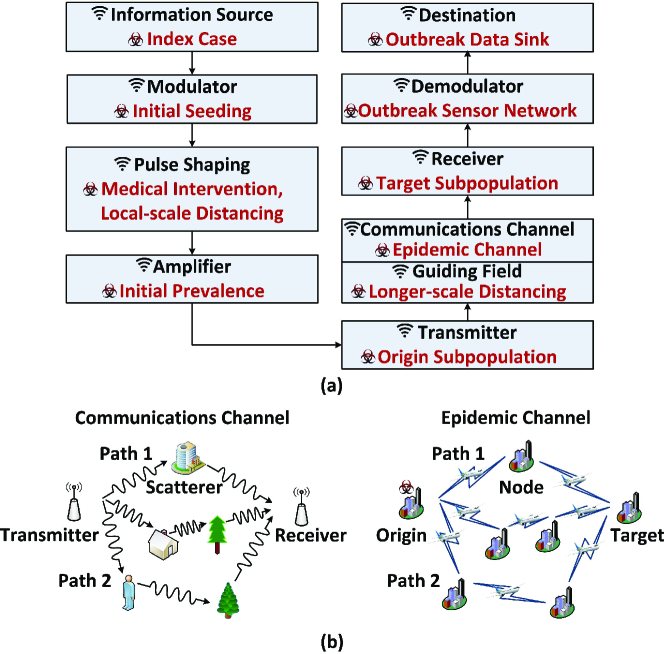
Fig. 1(a) shows the block diagram of a general communication system, in which different functional elements are represented by blocks. The analogy between the communication system and the epidemic spreading and mitigation is also demonstrated in Fig. 1(a).
The information source produces required messages to be transmitted. From the contagion perspective, we can consider the emergence and non-emergence of a new index case as two opposite messages to be broadcasted from the origin, which can be denoted by the two symbols and in the binary code.
The modulator processes the message into a form suitable for transmission over the communication channel. For the on-off keying (OOK) modulation, the appearance of a message carrier for a specific duration (e.g., a time-limited waveform) represents a binary , while its disappearance for the same duration represents a binary . In terms of disease outbreak, we can consider the initial seeding stage of infection in a metapopulation as the modulation process.
It is supposed that the number of susceptible individuals is much larger than the numbers of infectious and recovered individuals, which is the common assumption made for derivation of the effective distance and is realistic for the usual diseases [19, 20, 18, 7]. The initial seeding is analogous to the OOK, where a burst of case incidence describing the cumulative number of cases at time corresponds to the message carrier. The presence and absence of indicate the onset (“1”) and non-existence (“0”) of a novel pathogen, respectively. It is worth noting that “carrier” here is a communications terminology (i.e., to convey a message across the medium), which should be distinguished from “carrier” in the medical context (i.e., a bearer and transmitter of a causative agent of an infectious disease). For exponential growth dynamics which has been commonly assumed for the initial growth phase [26], in the absence of interventions or behavior changes is given by
| (1) |
where and denote the infecting and recovering processes, respectively, and is the Heaviside step function because both and are supported on . The term is a positive parameter denoting the growth rate and is the recovery rate.
Pulse shaping is the process of changing the waveform of transmitted signals, which can be used to describe the following intervention strategies as illustrated in Fig. 1(a). For socially targeted antiviral prophylaxis, symptomatic individuals and their close contacts receive treatment or prophylaxis with antiviral drugs, which increase the recovery rate and can thus be regarded as tuning of in (1); dynamic mass vaccination and local-scale social distancing such as school closure, voluntary behaviour change, and formally imposed quarantine reduce the per-case growth rate for the infecting process, which effectively reduces the parameter and results in slower-than-exponential epidemic growth as observed across a range of pathogens based on empirical data [13]. We can incorporate a time-dependent in the model, e.g., an exponential decline as suggested in [13], . The rate decreases exponentially from an initial value towards at the rate . By substituting into (1), the overall case incidence in the origin subpopulation becomes
| (2) |
The parameter is given by the time when the case incidence is equal to a sufficiently small threshold , below which the outbreak is deemed quenched at the small community level. A natural selection of is 1, which means that the outbreak is supposed to be contained if there is only one case left. In addition, the initial prevalence of the outbreak plays the role of a power amplifier multiplying the transmitted pulse as shown in Fig. 1(a).
In a multipath communications channel depicted in Fig. 1(b), the signal propagates from the transmitter to the receiver via multiple scatterers, which may involve single-bounce reradiation (e.g., Path 1) or multiple-bounce reradiation (e.g., Path 2) [27]. The power density of the signal reduces as it propagates through space. This phenomenon is called path loss or path attenuation. Furthermore, the signal waveform may be distorted upon reflection at a scatterer, which is depending on the frequency response of the scatterer. Note that the aim of lossless transmission in communications refers to the error-free delivery of messages (i.e., “0”s and “1”s) rather than the message carrier (i.e., ); correct messages can be recovered from distorted message carriers by using properly designed detectors at the receiver. The arrival time introduced by each path is proportional to its propagation length. The communications channel exhibits structural likeness with the air-traffic-mediated epidemic channel as also illustrated in Fig. 1(b). Multiple intermediate nodes representing different subpopulations (cities) in the global mobility network [18, 7, 20, 19] are analogous to the scatterers in the communications channel. A contagious disease spreads from the origin to the target via multiple routes due to passenger flows on the transportation network, which have coherent wavefronts for all paths and may involve a two-hop link (e.g., Path 1) or a multiple-hop link (e.g., Path 2). The probability that a successive node is contaminated by an infected traveler from the upstream node reduces as the effective distance between these two nodes increases as to be discussed in Section III, which is analogous to the concept of path loss. Subsequently, the spreading process within a subpopulation is triggered by any newly arrived infectious individuals from elsewhere, and then forms the local epidemiological state. This scenario is similar to the process that a scatterer receives an incoming signal and reradiates it with localized waveform distortion. As such, in (2) can be regarded as an “epidemic pulse” sent from the origin, which “excites” the mobility network resulting in an extended duration of the pandemic event in the target due to multiple infection spreading paths. This is similar to signal pulse excitation of a multipath channel in the context of wireless communications. The epidemic pulse starts from the origin and then propagates to all the intermediate nodes and the target.
Finally, the demodulator is associated with a sensor network placed in the target node to detect whether any person is infected [18]. Following [18], the locations graph is scale-free, which allows highly efficient outbreak detection by placing sensors in the hubs of the locations network. The destination is the data fusion center deciding whether there is a new primary case.
III Communications-inspired Description Methods for Epidemic Spreading
For description of the epidemic channel, we start with the concept of effective distance from a node to a connected node , where the flux fraction represents the fraction of travelers that leave and arrive at per unit time and depends only on the topological features of the static underlying network [18, 7]. As demonstrated in [18, 7], the mean arrival time is approximately proportional to the effective distance and the effective spreading speed depends on the epidemiological parameters, which is a global property independent on the mobility network and the outbreak location. Specifically, it was shown in [20, 19] that the propagation time between two connected nodes and follows a truncated Gumbel probability density function (pdf)
| (3) |
with average , where is the spreading rate and is the Euler constant. The Gumbel type of the arrival time distribution is derived based on the assumption that the time to increase the number of infectious individuals in node by one is small with respect to the time scale of the epidemic arrival in node [20, 19, 7]. Hence, could be approximated as the mean value of the per-case growth rate for (2), , without much influence on the validity of the Gumbel pdf. This can also be verified indirectly by the empirical data of the worldwide 2009 H1N1 influenza pandemic and 2003 SARS epidemic [18]. It was shown in [18] that there is a strong correlation between the disease arrival time and the effective distance throughout the entire time course of each disease, regardless of any mitigation strategies implemented that may change the per-case growth rate over time. This linear relationship is a typical feature of the Gumbel distribution (i.e., ).
Next, node will only be contaminated if the arrival of an infectious individual occurs before quenching of the outbreak in node . Hence, the probability that node is contaminated is given by
| (4) |
The quantity essentially measures the normalized ensemble-average prevalence (NEAP) of contagion in node . Subsequently, for an ordered path from node to node , , the NEAP is derived as
| (5) |
This expression is analogous to the path loss in a communications channel where the overall loss is equal to the multiplication of attenuation for each reradiation, which is a function of the distance of each hop. In addition, any arrival time greater than the duration of the transmitted epidemic waveform would not have pathogenical significance because the passenger traveling from node to node will not cause disease transmission after the outbreak is extinguished at . Hence, the pdf of effective propagation time is a further truncated Gumbel distribution:
| (6) |
with being a normalization factor to ensure that is a pdf. The mean value can be derived after some manipulations as
| (7) |
where is the lower incomplete gamma function. Note that if . For the ordered path , the average arrival time is given by
| (8) |
Consider a multipath epidemic channel as shown in Fig. 1(b), the path introduces a mean delay and a NEAP obtained from (8) and (5), respectively. Analogous to the classical power delay profile in communications [27], we introduce the description method of prevalence delay profile (PDP) as follows
| (9) |
where is the Dirac delta function. The PDP will give us a clear understanding of the roles of different disease transmission routes, which is of primary importance for the study of path-oriented contagion phenomena and the setup of containment measures and policies.
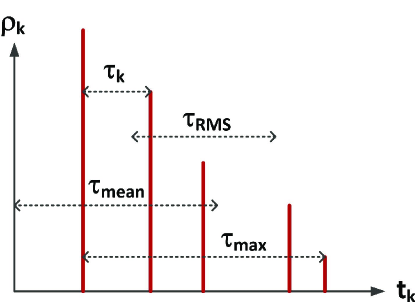
We continue to define the following parameters derived from the PDP as illustrated in Fig. 2, which are analogous to their counterpart quantities in wireless communications:
-
•
Excess delay: The delay of each path relative to the first arriving path, .
-
•
Total excess delay: The difference between the delay of the first and the last arriving path, .
-
•
Mean delay: The delay corresponding to the “centre of gravity” of the PDP,
.
-
•
Root mean square (RMS) delay spread: The second moment of PDP,
.
We now briefly discuss some of the new insights provided by the proposed framework. Firstly, the PDP in Fig. 2 motivated by the classical description method of multipath channels characterizes the relative prevalence and delay of all the epidemic spreading paths, whereas the existing approaches based on the theory of complex networks only study the earliest arrival or the mean aggregated behavior of infection [19, 20, 7]. Secondly, the PDP captures the fundamental relationship between the dynamics of the initial community-level outbreak and the global, mobility-network-driven contagion. In communications, intersymbol interference (ISI) is a form of distortion of a signal in which one symbol interferes with subsequent symbols. This is an unwanted phenomenon as the previous symbols have similar effect as noise, thus making the communications less reliable. ISI is caused by multipath propagation causing successive symbols to “blur” together due to different lengths of the paths. The RMS delay spread affects the ISI in the way that if the symbol duration is long enough compared to the delay spread, one can expect an equivalent ISI-free channel (i.e., a narrowband channel). Otherwise, a wideband channel is resulted, where ISI introduces errors in the decision device at the receiver output. From the perspective of infection transmission, an epidemic channel is considered “wideband” if the delay spread is significant compared with the pulse duration . In other words, if , outbreaks caused by two successive and independent patient zeroes will not interfere with each other and the time series of all the index cases originated from the upstream population could be successfully recovered at the target city. In addition, techniques commonly used in communications to alleviate ISI such as adaptive equalization and maximum likelihood sequence estimation can also be applied to correctly detect the encoded epidemiological states should ISI occurs, which is beyond the scope of the current work and will be left for future investigation.
Note that longer-scale social distancing such as air travel restriction modifies the flux fractions over multiple epidemic spreading paths, which in turn changes the PDP. This effort is similar to the guiding field resulting in directed fluxes of message carriers in the externally controllable and trackable communications [22].
IV Numerical Examples
In this section, we present some numerical examples to illustrate the key principles of the proposed analytical framework. The following parameters are used in the examples. The mean recovery time of individuals ( is in the range of to days for influenza-like diseases [18]). The initial growth time , which results in the basic reproduction ratio of (reproductive number estimates are in the range of to for the epidemic influenza [28]). The final growth rate is after successfully implementing dynamic mass vaccination and community-level social distancing. Four different rates of decline are considered, . The threshold defining the duration of the epidemic pulse is set to be .
In terms of the underlying traffic, it is assumed that the number of paths is and the maximum number of hopping for each path is . The maximum traffic flux is (i.e., the fraction of people traveling between two successive nodes per unit time is ; the absolute sizes of the populations are not required), consistent with the typical scenario in a major transport hub in the global mobility network [18].
The minimum traffic flux is . The effective distance for each hopping is supposed to be uniformly distributed between and . The focus on the parameters is not essential, as the proposed framework is also valid for other types of mobility dynamics.
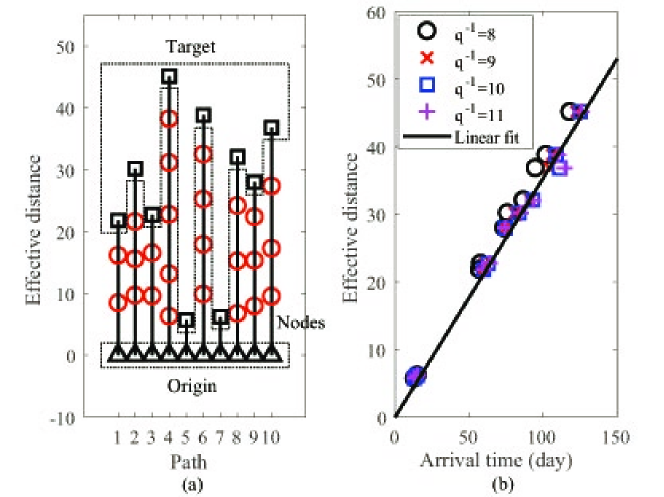
Fig. 3(a) depicts the multipath structure of a simulated mobility network for epidemic spreading from the origin to the target subpopulation via multiple intermediate nodes. Note that all the triangles in the figure refer to the same origin and all the squares refer to the same target. For each path, the locations of intermediate nodes are indicated in terms of their effective distances from the origin. As the epidemic spreading is analyzed from the communications perspective rather than the complex network, the multipath representation explicitly showing effective distances for each path is used in Fig. 3(a), which is easier to understand than the traditional network topology. Fig. 3(b) depicts the relationship between the overall effective distance for each path, which is obtained by adding up effective distances between successive nodes along that path, and the arrival time for the network in Fig. 3(a). A strong correlation between effective distance and arrival time is evident. Furthermore, the relationship is linear, meaning that the effective speed of the wavefront is a well-defined constant. This phenomenon is a consistent extension of the observations made in [18, 7]. It is worth noting that a larger pulse shaping parameter (see also Fig. 4(a)) results in a slightly bigger effective speed even for the same underlying network. This is in contrast to the communications channel where the speed of message carrier is a property of propagation medium but not transmitted signal.
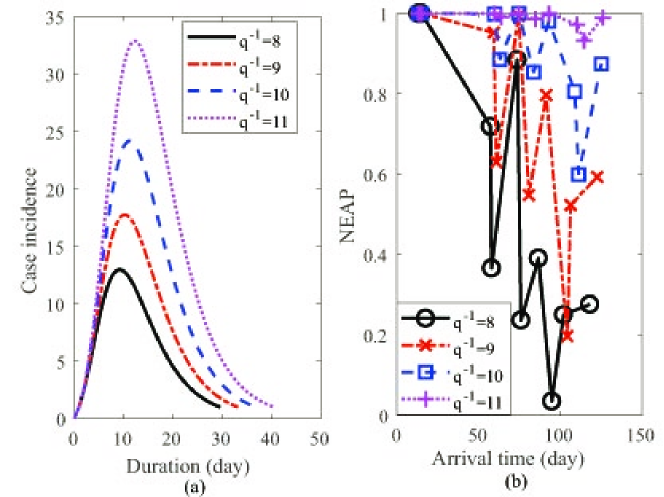
Fig. 4(a) illustrates the epidemic pulses transmitted from the origin for different values of , which corresponds to the case incidence in the origin subpopulation. As could be expected, slower rate of decline of the disease growth results in broader pulses. The corresponding PDPs are shown in Fig. 4(b) given the same mobility network generated. We can make the following important observations. Firstly, overall larger arrival time leads to lower prevalence due to reduced probability in disease transmission. Nevertheless, the relationship is not monotonic as multiple hops along a path potentially increase the chance of epidemic spreading due to reduced distances between neighboring nodes, though the overall arrival time increases. Secondly, as the rate of decline of the outbreak growth decreases, the total access delay increases and the weights of all paths approach (i.e., the prevalence becomes less sensitive to the arrival time).
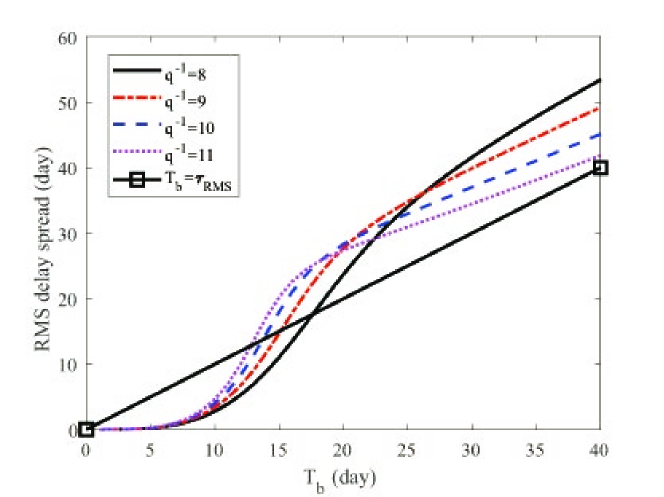
Fig. 5 demonstrates the relationship between the RMS delay spread and the pulse duration for different values of . Suppose that needs to be greater than to ensure a narrowband epidemic channel such that the pulse shape of would be reserved at the target node for reliable analysis of early contagion dynamics. As shown in Fig. 5, a crossover phenomenon can be observed as decreases where smaller results in larger in the regime of small and an opposite trend occurs for large . Furthermore, the epidemic channel appears to be narrowband for smaller , and gradually becomes wideband as increases. However, the trend is dependent on the specified boundary of the narrowband and wideband regimes in the plane as well as the underlying multipath structure of the mobility network generated.
V Conclusion
In summary, the analysis of air-traffic-mediated epidemic spreading and mitigation strategies in the communications-inspired framework enables researchers to understand complex contagion dynamics by applying the deep-rooted communications theories. We have presented the quantity of PDP to describe the relative influence of multiple disease transmission paths, and introduced the metric of RMS delay spread to measure the frequency selectivity of an epidemic channel (“narrowband” vs. “wideband”).
The method is a useful starting point for more detailed investigations. Firstly, the framework would motivate acquisition of real spatiotemporal epidemic data (PDPs at various target locations) that reflect the multipath nature of infection spreading. Secondly, the approach allows utilizing a wide range of signal detection algorithms and performance measures traditionally only used in the communications field (e.g., equalization, bit error rate) for analysis of global disease dynamics and social/medical interventions. Finally, the communications-inspired model may be extended to other contagion phenomena, such as human-mediated spread of violence or rumors.
Acknowledgement
This work is supported by the Guangdong Natural Science Funds under Grant 2016A030313640.
References
- [1] C. Fraser and et al., “Pandemic potential of a strain of influenza A (H1N1): early findings,” Science, vol. 324, no. 5934, pp. 1557–1561, June 2009.
- [2] V. Colizza, A. Barrat, M. Barthélemy, and A. Vespignani, “Predictability and epidemic pathways in global outbreaks of infectious diseases: the SARS case study,” BMC Med., vol. 5, no. 34, pp. 766–776, Nov. 2007.
- [3] C. Poletto, M. F. Gomes, A. P. y Piontti, L. Rossi, L. Bioglio, D. L. Chao, I. M. Longini Jr, M. E. Halloran, V. Colizza, and A. Vespignani, “Assessing the impact of travel restrictions on international spread of the 2014 West African Ebola epidemic,” Eurosurveillance, vol. 19, no. 42, pp. 1–6, Oct. 2014.
- [4] S. Ioos, H. P. Mallet, I. L. Goffart, V. Gauthier, T. Cardoso, and M. Herida, “Current Zika virus epidemiology and recent epidemics,” Med. Mal. Infect., vol. 44, no. 7, pp. 302–307, Jul. 2014.
- [5] A.-L. Barabási and R. Albert, “Emergence of scaling in random networks,” Science, vol. 286, no. 5439, pp. 509–512, Oct. 1999.
- [6] R. Pastor-Satorras and A. Vespignani, “Epidemic spreading in scale-free networks,” Phys. Rev. Lett., vol. 86, no. 14, pp. 3200, Apr. 2001.
- [7] F. Iannelli, A. Koher, D. Brockmann, P. Hövel, and I. M. Sokolov, “Effective distances for epidemics spreading on complex networks,” Phys. Rev. E, vol. 95, no. 1, pp. 012313, Jan. 2017.
- [8] V. Colizza, A. Barrat, M. Barthélemy, and A. Vespignani, “The role of the airline transportation network in the prediction and predictability of global epidemics,” Proc. Natl. Acad. Sci. U.S.A., vol. 103, no. 7, pp. 2015–2020, Feb. 2006.
- [9] T. D. Hollingsworth, N. M. Ferguson, and R. M. Anderson, “Frequent travelers and rate of spread of epidemics,” Emerg. Infect. Dis., vol. 13, no. 9, pp. 1288–1294, Sep. 2007.
- [10] G. Chowell, L. Sattenspiel, S. Bansal, and C. Viboud, “Mathematical models to characterize early epidemic growth: A review,” Phys. Life Rev., vol. 18, pp. 66–97, Jul. 2016.
- [11] R. Pastor-Satorras, C. Castellano, P. V. Mieghem, and A. Vespignani, “Epidemic processes in complex networks,” Rev. Mod. Phys., vol. 87, no. 3, pp. 925, Aug. 2015.
- [12] G. Chowell, D. Hincapie-Palacio, J. Ospina, B. Pell, A. Tariq, S. Dahal, S. Moghadas, A. Smirnova, L. Simonsen, and C. Viboud, “Using phenomenological models to characterize transmissibility and forecast patterns and final burden of Zika epidemics,” PLOS Curr., vol. 8, May 2016.
- [13] C. Viboud, L. Simonsen, and G. Chowell, “A generalized-growth model to characterize the early ascending phase of infectious disease outbreaks,” Epidemics, vol. 15, pp. 27–37, Jun. 2016.
- [14] L. Hufnagel, D. Brockmann, and T. Geisel, “Forecast and control of epidemics in a globalized world,” Proc. Natl. Acad. Sci. U.S.A., vol. 101, no. 42, pp. 15124–15129, Oct. 2004.
- [15] V. Colizza, R. Pastor-Satorras, and A. Vespignani, “Reaction-diffusion processes and metapopulation models in heterogeneous networks,” Nat. Phys., vol. 3, pp. 276–282, Apr. 2007.
- [16] L. Sattenspiel, The Geographic Spread of Infectious Diseases: Models and Applications, Princeton University Press, 2009.
- [17] M. J. Keeling and P. Rohani, Modeling Infectious Diseases in Humans and Animals, Princeton University Press, 2008.
- [18] D. Brockmann and D. Helbing, “The hidden geometry of complex, network-driven contagion phenomena,” Science, vol. 342, no. 6164, pp. 1337–1342, Dec. 2013.
- [19] A. Gautreau, A. Barrat, and M. Barthélemy, “Arrival time statistics in global disease spread,” J. Stat. Mech., vol. 2007, Sep. 2007.
- [20] A. Gautreau, A. Barrat, and M. Barthélemy, “Global disease spread: statistics and estimation of arrival times,” J. Theor. Biol., vol. 251, no. 3, pp. 509–522, Apr. 2008.
- [21] T. C. Germann, K. Kadau, I. M. Longini Jr, and C. A. Macken, “Mitigation strategies for pandemic influenza in the united states,” Proc. Natl. Acad. Sci. U.S.A., vol. 103, no. 15, pp. 5935–5940, Apr. 2006.
- [22] Y. Chen, P. Kosmas, P. S. Anwar, and L. Huang, “A touch-communication framework for drug delivery based on a transient microbot system,” IEEE Trans. NanoBiosci., vol. 14, no. 4, pp. 397–408, Jun. 2015.
- [23] T. Nakano, “Molecular communication: a 10 year retrospective,” IEEE Trans. Mol. Biol. Multiscale Commun., vol. 3, no. 2, pp. 71–78, June 2017.
- [24] T. Nakano, A. W. Eckford, and T. Haraguchi, Molecular Communications, Cambridge University Press, 2013.
- [25] T. Nakano, T. Suda, Y. Okaie, M. J. Moore, and A. V. Vasilakos, “Molecular communication among biological nanomachines: A layered architecture and research issues,” IEEE Trans. Nanobiosci., vol. 13, no. 3, pp. 169–197, Sep. 2014.
- [26] R. M. Anderson and R. M. May, Infectious Diseases of Humans, Oxford University Press, 1991.
- [27] A. F. Molisch, Wireless Communications, 2nd ed., Wiley-IEEE Press, 2010.
- [28] C. C. Spicer and C. J. Lawrence, “Epidemic influenza in greater london,” J. Hyg. Camb., vol. 93, no. 1, pp. 105–112, Aug. 1984.