A NuSTAR census of coronal parameters in Seyfert galaxies
Abstract
Context. We discuss the results on the hot corona parameters of Active Galactic Nuclei that have been recently measured with NuSTAR. The values taken from the literature of a sample of nineteen bright Seyfert galaxies are analysed.
Aims. The aim of this work is to look for correlations between coronal parameters, such as the photon index and cutoff energy (when a phenomenological model is adopted) or the optical depth and temperature (when a Comptonization model is used), with other parameters of the systems like the black hole mass or the Eddington ratio.
Methods. We analysed the coronal parameters of the nineteen unobscured, bright Seyfert galaxies that are present in the Swift-BAT 70 months catalogue and that have been observed by NuSTAR, alone or simultaneously with others X-rays observatories such as Swift, Suzaku or XMM-Newton.
Results. We found an anti-correlation with a significance level % between the coronal optical depth and the coronal temperature of our sample. On the other hand, no correlation between the above parameters and the black hole mass, the accretion rate and the intrinsic spectral slope of the sources is found.
Key Words.:
Galaxies: active – Galaxies: Seyfert – X-rays: galaxies – Black hole physics1 Introduction
The X-ray continuum of Active Galactic Nuclei can be explained by thermal Comptonization of the soft UV radiation, produced by the inner accretion disk, by a plasma of relativistic electrons around the supermassive black hole, known as the corona (Haardt & Maraschi, 1993). This continuum is reprocessed by cold neutral circumnuclear medium (e.g. the accretion disc or the molecular torus) and gives rise to a reflection bump at around 30 keV and a iron K line emission at around 6.4 keV (e.g., Matt et al. 1991). The presence of these features in the spectrum places constraints on the geometry of the X-ray emitting region and tells us that the hot plasma region is quite compact and likely situated close to the accretion disc.
However the detailed geometry of the disc/corona system is still largely unknown, and indeed the size, location and shape of the corona are still matter of debate. It is not yet clear if the corona is very compact, as assumed in the lamp-post geometry (Matt et al. (1991), Henri & Petrucci (1997), Petrucci & Henri (1997) Miniutti & Fabian (2004)), or more extended, filling the inner part of the accretion flow. It is also not yet clear if the coronal plasma is a continuous or a patchy medium (Petrucci et al., 2013).
To solve the doubts raised above we need to study the broad-band X-ray spectrum of AGN in details, to disentangle all the complex spectral features in this energy range, to remove all the degeneracies between the primary continuum features and other physical observables in order to constraints the coronal parameters and to have an overview of the physics and the structure of the hot corona (Marinucci et al., 2016).
The simplest way to obtain a description of Comptonizing coronae is to measure the cut-off in the hard X-ray spectrum and the photon power-law index. The spectral cut-off is directly related to the Comptonizing electron temperature of the corona while the power-law index depends on the interplay between the electron temperature and the optical depth. These kind of measurements have been performed with hard X-ray satellites, such as BeppoSAX (Dadina 2007, Perola et al. 2002), INTEGRAL (Panessa et al. 2011; de Rosa et al. 2012; Molina et al. 2013) and Swift (Ricci et al. 2017). The cutoff values ranged between 50 and 300 keV. The high energy cutoff values result to be correlated with the photon index of the primary emission. It is not clear, however, if this was a real correlation of an effect due to the degeneracies between parameters in those background-dominated observations.
The Nuclear Spectroscopic Telescope Array (NuSTAR, Harrison et al. 2013) is a hard X-ray observatory launched in June 2012. It has two coaligned X-ray optics which focus X-ray photons onto two independent shielded focal plane modules, namely FPMA and FPMB. Thanks to its focusing optics, it has a broad and high quality spectral coverage from 3 to 79 keV. Given these features, NuSTAR is suitable for studying the hard X-ray spectra of AGN with high sensitivity, discriminating between the primary X-ray emission and the scattered or reflected component (i.e. radiation which interacts with circumnuclear gas and gets absorbed or Compton scattered). Alone, or with simultaneous observations with other X-ray observatories operating below 10 keV, such as XMM-Newton, Suzaku and Swift, it provided strong constraints on the coronal properties of many AGN (Brenneman et al. 2014, Baloković et al. 2015, Fabian et al. 2015 Matt et al. 2015, Marinucci et al. 2014a, Marinucci et al. 2016, Tortosa et al. 2017, Fabian et al. 2017).
To better understand the complex environment of AGN, it is important to search for correlations between coronal parameters and other physical parameters, such as the black hole mass and the Eddington ratio. In this paper, we present the analysis of a small catalogue of AGN built up by choosing the unobscured nearby, non-jetted (following the distinction made by Padovani et al. 2017) Seyfert galaxies that have been observed by NuSTAR (often in coordination with XMM-Newton, Suzaku or Swift). We took from the literature the values of the coronal parameters of this sample of AGN. The aim of the paper is to list and discuss these values and look for possible correlations.
2 The sample
The primary X-ray emission is characterized by a power-law spectral shape extending to energies determined by the electron temperature. The power-law often shows a cutoff at high energies. Both the energy of the cutoff and the photon index are related to the temperature and the optical depth of the corona. Comptonization models imply that the cutoff energies are 2-3 times the temperature of the corona ((Petrucci et al., 2000, 2001)). To investigate the shape of the spectrum it is important to take into account the reprocessed emission of the circumnuclear environment in this energy range, such as reflection from accretion disc and distant material. Typical X-ray features of the cold circumnuclear material include intense iron K alpha line at 6.4 keV and the associated Compton reflection peaking at 30 keV.
Unlike the previous hard X-ray observatories, which are background dominated for almost all AGN, NuSTAR is the first focusing hard X-ray telescope on orbit, 100 times more sensitive in the 10-79 keV band compared to previous observatories working in the same energy band. The focusing capability implies a very low background, and the observation of bright AGN are source-dominated. NuSTAR data can, therefore, provide strong and robust constraints on the high-energy cutoff, allowing to study AGN at high energies with high precision and with unprecedented accuracy. Thanks to NuSTAR observations in collaborations with other X-ray satellites such as XMM-Newton and Swift, in the last few years several cutoff energies have been measured with very high precision.
We built the catalogue by choosing the unobscured (cm-2) nearby brightest Seyfert galaxies that are present in the Swift-BAT 70 months catalogue and that have been observed by NuSTAR alone or simultaneously with other X-rays observatories, such as Swift, Suzaku or XMM-Newton. We selected only unobscured, or moderately obscured AGN to have a clear view of the primary emission component. Other objects for which the cutoff energy had been left fixed in the spectral analysis are not included (1H0707-495 for instance), since they need a more intensive study on this issue.The list and the characteristics of all the sources can be found in Table 2 and in Appendix B.
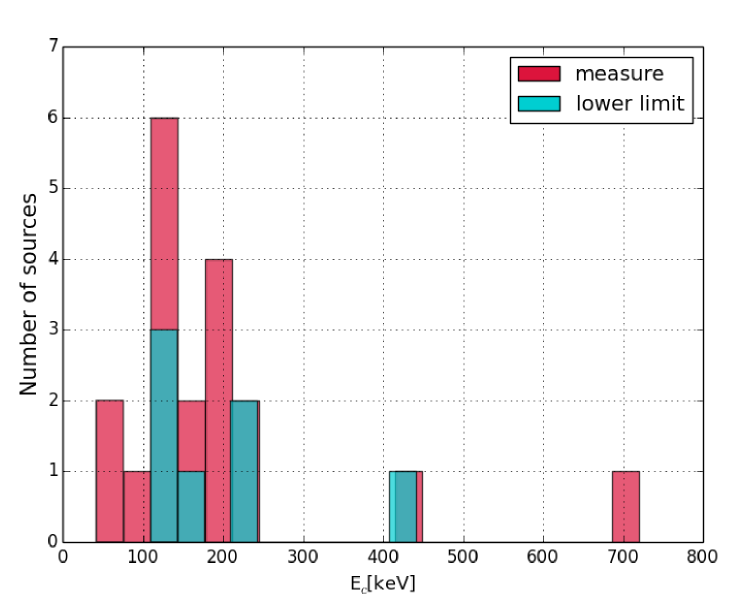
The final sample comprises nineteen objects, twelve with a measurement of the cutoff energy and seven having only a lower limit. The distribution of high-energy cutoff measurements from the sample is shown in Figure 1.
| X | Y | h0 | geometry | |
|---|---|---|---|---|
| Ec | 0.18 | 0.47 | - | |
| log(Mbh/M⊙) | Ec | -0.11 | 0.61 | - |
| LLEdd | Ec | -0.14 | 0.56 | - |
| kTe | -0.88 | 0.004 | slab | |
| kTe | -0.63 | 0.02 | sphere | |
| log(Mbh/M⊙) | -0.22 | 0.63 | slab | |
| log(Mbh/M⊙) | -0.26 | 0.46 | sphere | |
| LLEdd | 0.49 | 0.27 | slab | |
| LLEdd | 0.38 | 0.28 | sphere | |
| log(Mbh/M⊙) | kTe | 0.20 | 0.64 | slab |
| log(Mbh/M⊙) | kTe | 0.18 | 0.47 | sphere |
| LLEdd | kTe | -0.37 | 0.41 | slab |
| LLEdd | kTe | -0.36 | 0.32 | sphere |
2.1 Black Hole mass measurements
Some of the selected sources had more than one literature value for the mass of the central black hole. One of the most reliable and direct way to measure the mass of a super massive black hole residing in the nucleus of an active galaxy is reverberation mapping (RM, Blandford & McKee 1982; Peterson 1993). We decided to use the RM mass values, for the sources that have one (IC4329A, 3C390.3, Ark 564, Ark 120, Mrk 335, Fairall 9, Mrk 766, PG 1211+143 Peterson et al. 2004; NGC 6814 Pancoast et al. 2014, 2015). For the sources without a RM measurement we used mass values derived from virial mass methods, such as the single-epoch method (SE). These methods start from the relation between the size and the luminosity of the broad line region (R-L relation), to derive the broad line region size through a single measure of the optical continuum luminosity and, combining this information with the width of a broad line, it is possible to build a relation with the black hole mass (Vestergaard, 2002; Vestergaard & Peterson, 2006).
| Source | Ref. | log(Mbh/M⊙) | Ref. | LLEdd | L2-10keV | F2-10keV | kTe | geom. | model | |||
| [keV] | ergs s-1 | erg cm-2s -1 | [keV] | |||||||||
| NGC 5506 | 1 | (A) | slab | compTT | ||||||||
| sphere | compTT | |||||||||||
| MCG -05-23-16 | 2 | (B) | slab | compTT | ||||||||
| sphere | compTT | |||||||||||
| SWIFT J2127.4 | 3-4 | (J) | slab | compTT | ||||||||
| sphere | compTT | |||||||||||
| IC4329A | 5-6 | (N) | slab | compTT | ||||||||
| sphere | compTT | |||||||||||
| 3C390.3 | 7 | (H) | sphere | compTT | ||||||||
| 3C382 | 8 | (D) | slab | compTT | ||||||||
| GRS 1734-292 | 9 | (L) | slab | compTT | ||||||||
| sphere | compTT | |||||||||||
| NGC 6814 | 10 | (C) | sphere | nthcomp | ||||||||
| MCG +8-11-11 | 10 | (E) | sphere | nthcomp | ||||||||
| Ark 564 | 11 | (H) | - | sphere | nthcomp | |||||||
| PG 1247+267 | 12-13 | (M) | sphere | nthcomp | ||||||||
| Ark 120 | 14-15 | (H) | - | - | - | - | ||||||
| NGC 7213 | 16 | (G) | sphere | compPS | ||||||||
| MCG 6-30-15 | 17-18 | (E) | - | - | - | - | ||||||
| NGC 2110 | 19 | (K) | slab | compTT | ||||||||
| Mrk 335 | 21-22 | (H) | - | - | - | - | ||||||
| Fairall 9 | 20 | (H) | - | - | - | - | ||||||
| Mrk 766 | 17-23-24 | (I) | - | - | - | - | ||||||
| PG 1211+143 | 26 | (H) | - | - | - | - |
1. Matt et al. (2015), 2. Baloković et al. (2015), 3.Marinucci et al. (2014a), 4.Malizia et al. (2008), 5. Bianchi et al. (2009b), 6. Brenneman et al. (2014), 7. Lohfink et al. (2015), 8. Ballantyne et al. (2014), 9. Tortosa et al. (2017), 10. Tortosa et al. (2018), 11. Kara et al. (2017), 12. Lanzuisi et al. (2016), 13. Trevese et al. (2014), 14. Matt et al. (2014), 15. Porquet et al. (2017), 16. Ursini et al. (2015), 17. Marinucci et al. (2014b), 18. Emmanoulopoulos et al. (2014), 19. Marinucci et al. (2015), 20. Lohfink et al. (2016), 21. Parker et al. (2014), 22. Bianchi et al. (2001), 23. Buisson et al. (2017), 24. Risaliti et al. (2011), 25. Zoghbi et al. (2015), 26. Lawson & Turner (1997).
Mass References: A. Papadakis (2004), B. Onori et al. (2017), C. Pancoast et al. (2014, 2015),D. Winter et al. (2009), E.Bian & Zhao (2003), F. Zhang & Wang (2006), G. Woo & Urry (2002), H. Peterson et al. (2004), I. Bentz et al. (2010), JHalpern (2006), K. Moran et al. (2007), L. Tortosa et al. (2017), M. Trevese et al. (2014), N de La Calle Pérez et al. (2010).
Estimated parameter.
One of the most used R-L relations based on H RM measurements is (Bentz et al., 2009):
| (1) |
In the case of NGC 5506 the central stellar velocity dispersion (km s-1) (Oliva et al. 1999, Papadakis 2004) and the width of the [OIII] line (Boroson, 2003) give a black hole mass M⊙, and we decided to use this value.
We assumed a 20% uncertainty for black hole mass estimates not inferred from reverberation.
3 The fitting process
The aim of this work is, as said before, to look for correlations between the spectral parameters, such as the cutoff value and physical parameters.
The goodness of the correlation is given by the Spearman’s rank correlation coefficient or Spearman’s .The Spearman correlation coefficient is defined as the Pearson correlation coefficient between the ranked variables. The sign of the Spearman correlation indicates the direction of the association between X (the independent variable) and Y (the dependent variable). A Spearman correlation close to zero indicates that there is no tendency for Y to either increase or decrease when X increases. When X and Y are perfectly monotonically related, the Spearman correlation coefficient becomes (or for anti-correlation). In the fitting process also the ”null hypothesis” is given. The null hypothesis, denoted by , is the probability that sample observations result purely from chance. A small value indicates a significant correlation. The fits are made using the Interactive Data Language (IDL 111www.harrisgeospatial.com/SoftwareTechnology/IDL.aspx) programming language. We fitted the parameters with a simple linear relation in logarithmic scale:
| (2) |
The fits are made with a Monte Carlo method which repeated the fit procedure by random sampling the values between a minimum value and a maximum value, which are identified respectively with the lower and the upper extreme of the errors of the measure, (Bianchi et al., 2009a).
3.1 Spectral Parameters
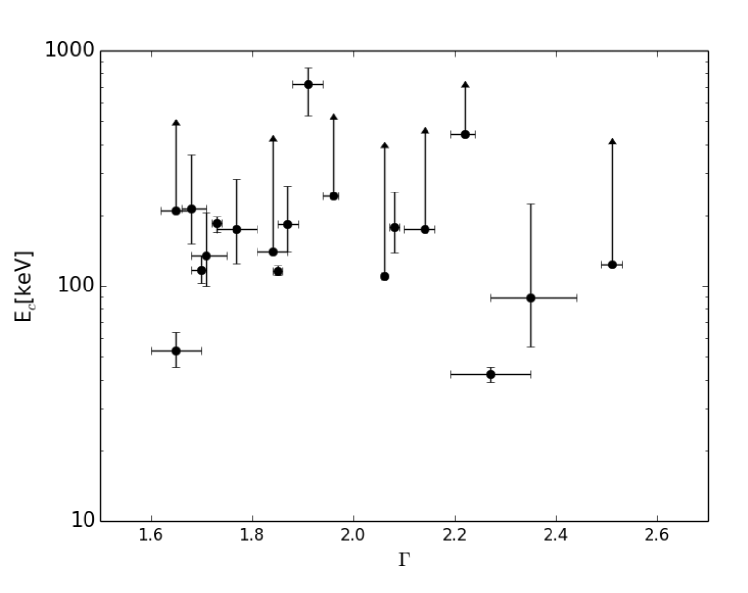
We started by looking for a correlation between the photon index and the high-energy cutoff with the relation of Equation 2. As it can be seen in Figure 2, no statistically significant correlation is found between this parameters, in contrast with what was found by previous satellites ( e.g., Perola et al. 2002; Ricci et al. 2017). This is reassuring, suggesting that with NuSTAR, and using a relatively large sample of well exposed sources with good measurements, the intrinsic degeneracy between these two parameters is significantly reduced.
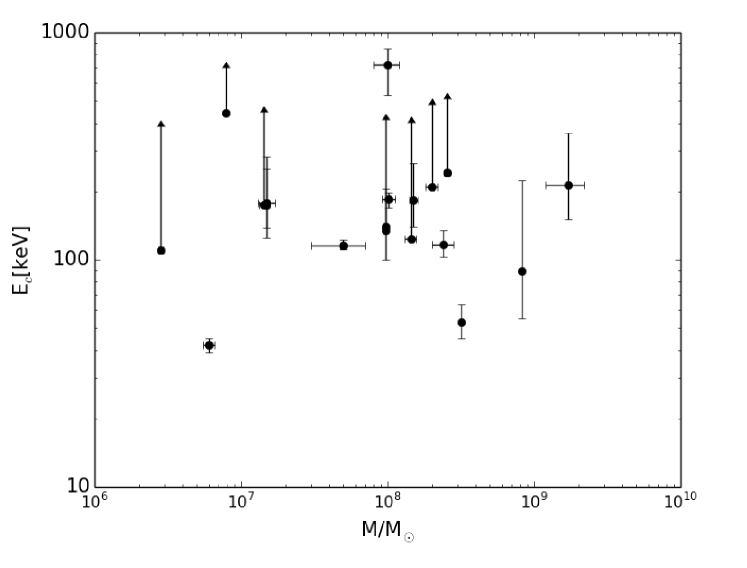
The following step was to search for a linear correlation between the high energy cutoff and either the mass of the central black hole or the Eddington ratio.
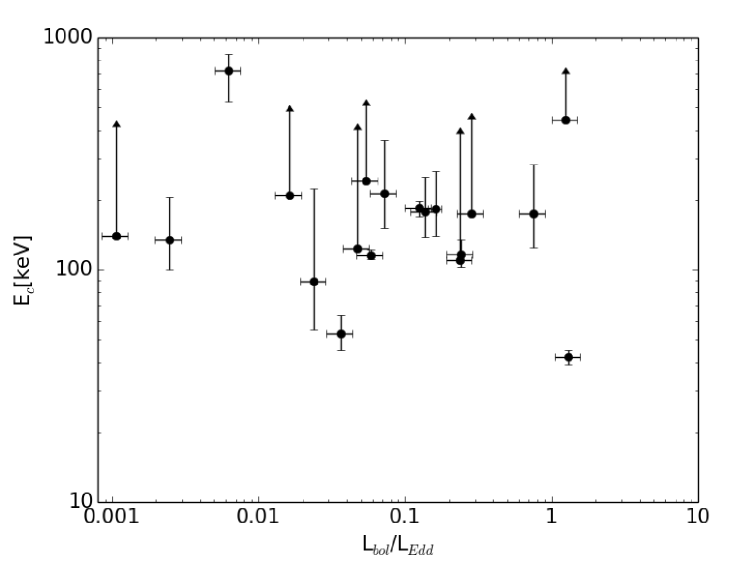
The Eddington ratio LLEdd is computed using the keV absorption-corrected luminosity of the sourced to estimate the bolometric luminosity using the keV bolometric correction of Marconi et al. 2004. Error bars on the Eddington ratio are derived from uncertainties on the black hole mass and keV luminosity measurements. All values are reported in Table 2. The Spearman’s values, reported in Table 1, show that there is no significant correlation between the checked parameters.
3.2 Physical Parameters
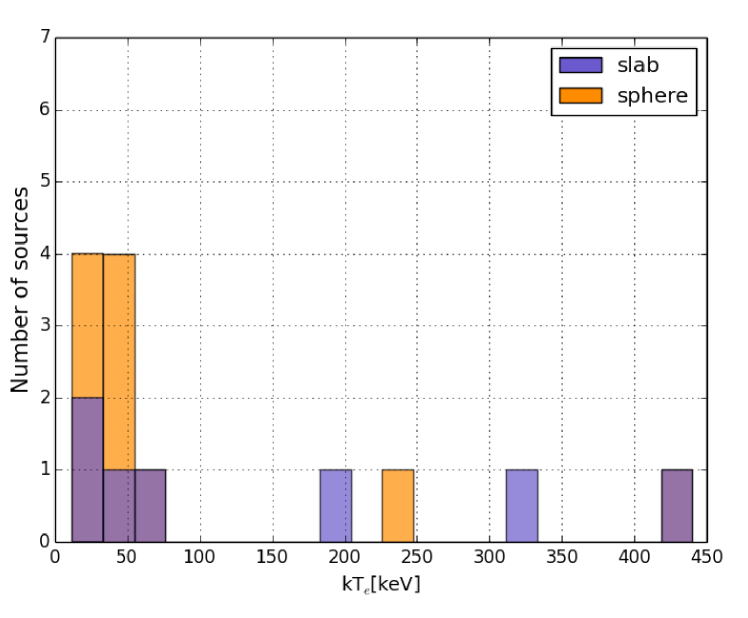
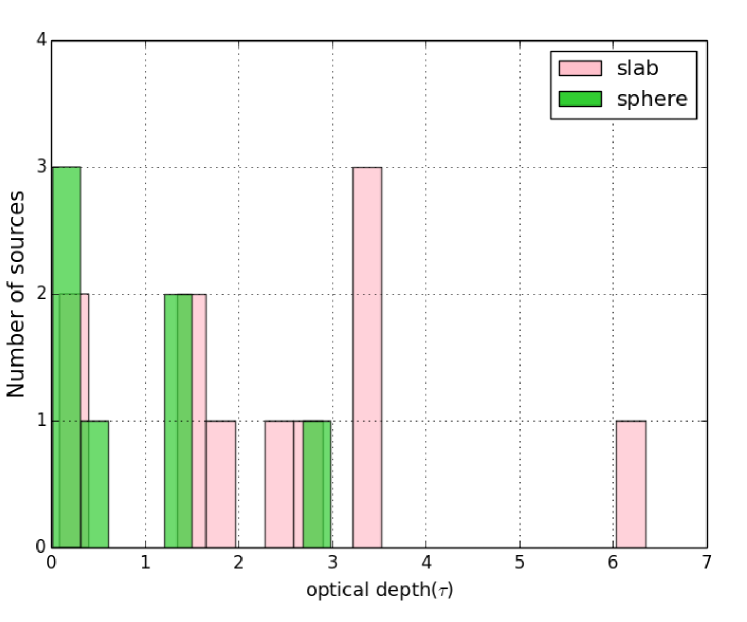
We consider the physical parameters that characterize the AGN coronae: the coronal temperature and the optical depth. The distribution of these two values in our sample is shown in Figure 5.
It should be noted that for some of the sources the optical depth parameter is not directly measured, since the model used (nthcomp inxspec) does not have the optical depth as free parameter. In these cases, the optical depth has been estimated using the relation from Beloborodov (1999):
| (3) |
where is the photon index of the spectrum between 2 and 10 keV. The dependence from the optical depth is in the relativistic -parameter:
| (4) |
where is the electron temperature normalized to the electron rest energy:
| (5) |
We performed the fit for the two cases of slab and spherical geometry of the corona.
In Appendix A, the results obtained with nthcomp are compared with those obtained with compTT for a few selected sources.
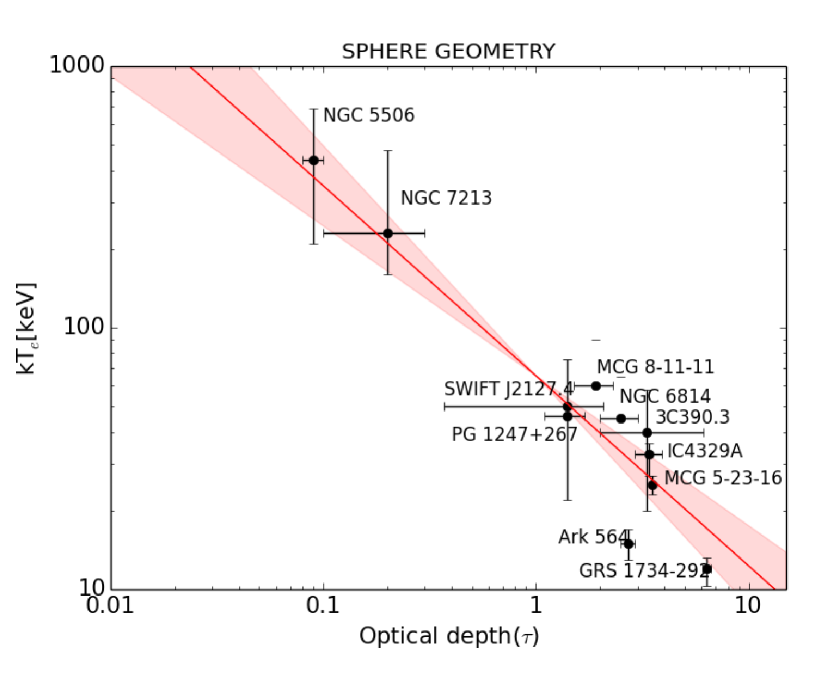
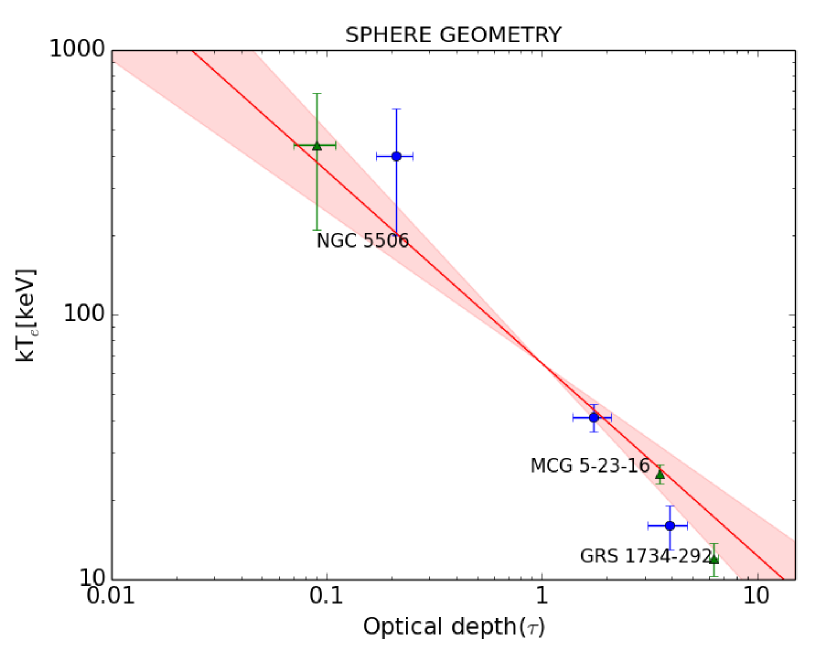
3.2.1 Optical Depth vs Coronal Temperature
The optical depth and coronal temperature appear to be extremely anti-correlated, the Spearman correlation factor for this fit is / and the null hypothesis probability /, for the slab and spherical geometry respectively, see also Figure 6.
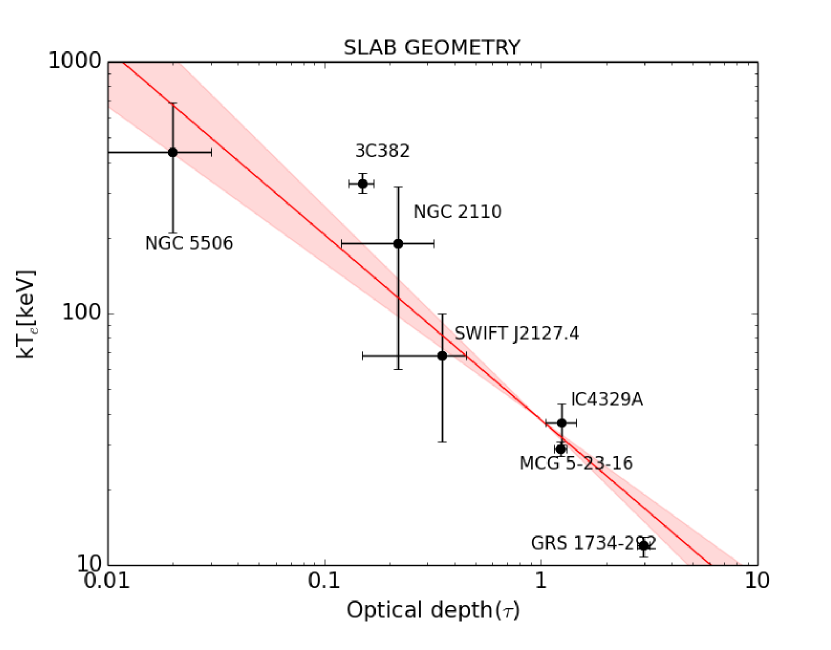
Using the equation 2 we found, in the case of a slab geometry, the following intercept and slope values for the fit:
| (6) |
The parameters of the linear regression in the case of the spherical geometry are:
| (7) |
This is a very interesting result, but the physical interpretation is not straightforward. We will discuss this correlation in the following section.
We also searched for correlations between the above parameters (coronal optical depth and coronal temperature) and the central black hole of the AGN, and the Eddington Ratio in both coronal geometries, slab and spherical. We do not found statistically significant correlation any of the analysed cases (see Table 1).
4 Discussion
We found two relevant results from this analysis. The first one is the lack of correlation between the high-energy cutoff and the spectral photon index of the primary power law (see Figure 2). Perola et al. in 2002 found a correlation between the high-energy cutoff and the photon index of the primary power law with a correlation coefficient equal to , with Ec increasing with . The same correlation is found in the Swift-BAT sample, in which Ricci et al. (2017) found that, when fitting the simulated Swift/BAT spectra with a simple power-law model, the Swift/BAT photon index increases when the cutoff decreases (see Figure 19 in their work).
Given that the two parameters are correlated in the fit procedure, this correlation may be an artifact due to any systematic error on one of the two parameters. Instead, we found no significant correlation between and Ec. The lack of correlation between these parameters means that there are no large systematics in the NuSTAR measurements.
The second important result is the presence of a strong anticorrelation between the optical depth and the coronal temperature, both in the slab and in the spherical geometry.The interpretation of this anticorrelation is not trivial. Of course the values of the parameters are model dependent. We check the kTe and values in spherical geometry of the corona for some of the sources of the sample, in particular GRS 1734-292, NGC 5506 and MCG -05-23-16, which have very different values of temperature and optical depth, by re-analysing the NuSTAR observations. The coronal temperature and the optical depth of the three sources listed above are all obtained with the compTT model (Titarchuk, 1994). Instead we used the nthcomp model (Zdziarski et al. 1996 and Życki et al. 1999), see Appendix A. We found different values for the two parameters of the three sources, but they still follow the anti-correlation (see Figure 7).
Moreover, we note that the model used for the analysis of the different sources in the literature is not always the same. This excludes the fact that the correlation could be an artefact due to the use of the same model for the analysis.
The -kTe anti-correlation cannot be easily reconciled with a fixed disc-corona configuration in radiative balance. Indeed, such a configuration corresponds to a fixed cooling/heating ratio for the corona. In this case the corona temperature and optical depth have only to adjust themselves in order to ensure the constancy of this ratio. But there is no reason for kTe and/or to change. In other words, if 1) the disc-corona configuration of all the Seyfert galaxies is the same and 2) is in radiative balance, we would expect kTe and/or to cluster around the same values for all the objects of our sample.
The observed correlation indicate that one (or both) of these hypotheses is wrong. The invalidation of the former (same disc-corona configuration) implies a geometrical variation of the accretion flow. It could be the variations of the transition radius Rtr separating the inner corona and the outer disk or the variation of the height H of the corona above the disk, like in the lampost configuration. A smaller Rtr/H would imply a larger cooling from the disk and then a smaller temperature (assuming the heating is the same). In this case the observed anti-correlation would indicate that objects like NGC 5506 have a larger Rtr/H than objects like GRS 1734-292.
The invalidation of the radiative balance hypothesis, instead, could be due to, e.g., a variation of the fraction of thermal emission due to viscous dissipation (”intrinsic emission” from now on) with respect to the total disk emission, which also includes reprocessing of the coronal radiation. Indeed, for a fixed disk-corona geometry, the radiative balance will change if this proportion varies. If it increases, the cooling of the corona will increase and the temperature will decrease. In this case the observed anti-correlation would indicate that the disk intrinsic emission in objects like NGC 5506 has a smaller contribution to the total disk emission compared to objects like GRS 1734-292.
Note that for a pair-dominated corona, opposite behaviours are expected since an increase of the cooling (which is inversely proportional to the coronal optical depth, Haardt & Maraschi 1991) would correspond to an increase of the corona temperature and not a decrease (Ghisellini & Haardt, 1994). As a consequence, to explain the observed kT anti-correlation, objects with large corona temperatures would have a smaller Rtr(H) or a larger contribution of the disk intrinsic emission than objects with low temperature.
5 Conclusions
We have presented and discussed recent high-energy cutoff measurements in a sample of nineteen bright Seyfert galaxies observed by NuSTAR in collaboration with other X-ray observatories operating below 10 keV, such as XMM-Newton, Suzaku and Swift. The goal of the work is to look for correlation between spectral and physical parameters, to better understand the physics and the structure of AGN coronae.
This kind of analysis has been already done before the coming of NuSTAR using cutoff energy measurements made up by hard X-ray satellites like Beppo-SAX(Perola et al., 2002) and INTEGRAL (Malizia et al., 2014). Unlike NuSTAR, these instruments are non-focusing, and therefore background dominated for AGN observations.
We searched for correlations between the high-energy cutoff and the photon index of the primary power-law, the mass of the central black hole and the Eddington ratio, i.e. LLEdd. We did not found any statistically significant correlation between these parameters.
Finally, we searched for correlations between the physical parameters which characterize the hot coronae of AGN, i.e. the temperature and the optical depth, and the mass of the central black hole and the Eddington ratio. No significant statistical correlation is found between these parameters. Instead, a significant anti-correlation is found between the optical depth and the coronal temperature fit. We found a Spearman correlation coefficient in the case of a slab geometry of the corona and in the case of a spherical corona. The null hypothesis probability, , is equal to in the case of slab geometry and for the sphere geometry. The observed anti-correlation suggests a disk-corona configuration in radiative balance, but requires differences, from source to source, in either the disk-corona configuration or in the intrinsic disk emission.
Acknowledgements.
This work made use of data from the NuSTAR mission, a project led by the California Institute of Technology, managed by the Jet Propulsion Laboratory, and funded by the National Aeronautics and Space Administration. We thank the NuSTAR Operations, Software and Calibration teams for support with the execution and analysis of these observations. This research has made use of the NuSTAR Data Analysis Software (NuSTARDAS) jointly developed by the ASI Science Data Center (ASDC, Italy) and the California Institute of Technology (USA). AT, AM and GM acknowledge financial support from Italian Space Agency under grant ASI/INAF I/037/12/0-011/13, SB under grant ASI-INAF I/037/12/P1. Part of this work is based on archival data, software or on-line services provided by the ASI SCIENCE DATA CENTER (ASDC). AT, SB, AM and GM acknowledge financial support from the European Union Seventh Framework Programme (FP7/2007-2013) under grant agreement n.312789. POP acknowledges financial support from the CNES and the CNRS/PNHE. EP and SB acknowledge financial contribution from the agreement ASI-INAF I/037/12/0.References
- Ballantyne et al. (2014) Ballantyne, D. R., Bollenbacher, J. M., Brenneman, L. W., et al. 2014, ApJ, 794, 62
- Baloković et al. (2015) Baloković, M., Matt, G., Harrison, F. A., et al. 2015, ApJ, 800, 62
- Beloborodov (1999) Beloborodov, A. M. 1999, in Astronomical Society of the Pacific Conference Series, Vol. 161, High Energy Processes in Accreting Black Holes, ed. J. Poutanen & R. Svensson, 295
- Bentz et al. (2009) Bentz, M. C., Peterson, B. M., Pogge, R. W., & Vestergaard, M. 2009, ApJ, 694, L166
- Bentz et al. (2010) Bentz, M. C., Walsh, J. L., Barth, A. J., et al. 2010, ApJ, 716, 993
- Bian & Zhao (2003) Bian, W. & Zhao, Y. 2003, MNRAS, 343, 164
- Bianchi et al. (2009a) Bianchi, S., Bonilla, N. F., Guainazzi, M., Matt, G., & Ponti, G. 2009a, A&A, 501, 915
- Bianchi et al. (2009b) Bianchi, S., Guainazzi, M., Matt, G., Fonseca Bonilla, N., & Ponti, G. 2009b, A&A, 495, 421
- Bianchi et al. (2001) Bianchi, S., Matt, G., Haardt, F., et al. 2001, A&A, 376, 77
- Blandford & McKee (1982) Blandford, R. D. & McKee, C. F. 1982, ApJ, 255, 419
- Boroson (2003) Boroson, T. A. 2003, ApJ, 585, 647
- Brenneman et al. (2014) Brenneman, L. W., Madejski, G., Fuerst, F., et al. 2014, ApJ, 781, 83
- Buisson et al. (2017) Buisson, D. J. K., Lohfink, A. M., Alston, W. N., & Fabian, A. C. 2017, MNRAS, 464, 3194
- Dadina (2007) Dadina, M. 2007, A&A, 461, 1209
- Dauser et al. (2014) Dauser, T., García, J., Parker, M. L., Fabian, A. C., & Wilms, J. 2014, MNRAS, 444, L100
- de La Calle Pérez et al. (2010) de La Calle Pérez, I., Longinotti, A. L., Guainazzi, M., et al. 2010, A&A, 524, A50
- de Rosa et al. (2012) de Rosa, A., Panessa, F., Bassani, L., et al. 2012, MNRAS, 420, 2087
- Emmanoulopoulos et al. (2014) Emmanoulopoulos, D., Papadakis, I. E., Dovčiak, M., & McHardy, I. M. 2014, MNRAS, 439, 3931
- Fabian et al. (2017) Fabian, A. C., Lohfink, A., Belmont, R., Malzac, J., & Coppi, P. 2017, MNRAS, 467, 2566
- Fabian et al. (2015) Fabian, A. C., Lohfink, A., Kara, E., et al. 2015, MNRAS, 451, 4375
- Fabian et al. (2002) Fabian, A. C., Vaughan, S., Nandra, K., et al. 2002, MNRAS, 335, L1
- Filippenko & Halpern (1984) Filippenko, A. V. & Halpern, J. P. 1984, ApJ, 285, 458
- García et al. (2014) García, J., Dauser, T., Lohfink, A., et al. 2014, ApJ, 782, 76
- García & Kallman (2010) García, J. & Kallman, T. R. 2010, ApJ, 718, 695
- Ghisellini & Haardt (1994) Ghisellini, G. & Haardt, F. 1994, ApJ, 429, L53
- Gliozzi et al. (2009) Gliozzi, M., Papadakis, I. E., Eracleous, M., et al. 2009, ApJ, 703, 1021
- Grier et al. (2012) Grier, C. J., Peterson, B. M., Pogge, R. W., et al. 2012, ApJ, 744, L4
- Haardt & Maraschi (1991) Haardt, F. & Maraschi, L. 1991, ApJ, 380, L51
- Haardt & Maraschi (1993) Haardt, F. & Maraschi, L. 1993, ApJ, 413, 507
- Halpern (2006) Halpern, J. P. 2006, The Astronomer’s Telegram, 847
- Harrison et al. (2013) Harrison, F. A., Craig, W. W., Christensen, F. E., et al. 2013, ApJ, 770, 103
- Henri & Petrucci (1997) Henri, G. & Petrucci, P. O. 1997, A&A, 326, 87
- Kalberla et al. (2005) Kalberla, P. M. W., Burton, W. B., Hartmann, D., et al. 2005, A&A, 440, 775
- Kara et al. (2017) Kara, E., García, J. A., Lohfink, A., et al. 2017, MNRAS, 468, 3489
- Lanzuisi et al. (2016) Lanzuisi, G., Perna, M., Comastri, A., et al. 2016, A&A, 590, A77
- Lawson & Turner (1997) Lawson, A. J. & Turner, M. J. L. 1997, MNRAS, 288, 920
- Lohfink et al. (2015) Lohfink, A. M., Ogle, P., Tombesi, F., et al. 2015, ApJ, 814, 24
- Lohfink et al. (2016) Lohfink, A. M., Reynolds, C. S., Pinto, C., et al. 2016, ApJ, 821, 11
- Malizia et al. (2008) Malizia, A., Bassani, L., Bird, A. J., et al. 2008, MNRAS, 389, 1360
- Malizia et al. (2014) Malizia, A., Molina, M., Bassani, L., et al. 2014, ApJ, 782, L25
- Marconi et al. (2004) Marconi, A., Risaliti, G., Gilli, R., et al. 2004, MNRAS, 351, 169
- Marinucci et al. (2015) Marinucci, A., Matt, G., Bianchi, S., et al. 2015, MNRAS, 447, 160
- Marinucci et al. (2014a) Marinucci, A., Matt, G., Kara, E., et al. 2014a, MNRAS, 440, 2347
- Marinucci et al. (2014b) Marinucci, A., Matt, G., Miniutti, G., et al. 2014b, ApJ, 787, 83
- Marinucci et al. (2016) Marinucci, A., Tortosa, A., & NuSTAR AGN Physics Working Group. 2016, Astronomische Nachrichten, 337, 490
- Matt et al. (2015) Matt, G., Baloković, M., Marinucci, A., et al. 2015, MNRAS, 447, 3029
- Matt et al. (2014) Matt, G., Marinucci, A., Guainazzi, M., et al. 2014, MNRAS, 439, 3016
- Matt et al. (1991) Matt, G., Perola, G. C., & Piro, L. 1991, A&A, 247, 25
- Miniutti & Fabian (2004) Miniutti, G. & Fabian, A. C. 2004, MNRAS, 349, 1435
- Molina et al. (2013) Molina, M., Bassani, L., Malizia, A., et al. 2013, MNRAS, 433, 1687
- Molina et al. (2009) Molina, M., Bassani, L., Malizia, A., et al. 2009, MNRAS, 399, 1293
- Moran et al. (2007) Moran, E. C., Barth, A. J., Eracleous, M., & Kay, L. E. 2007, ApJ, 668, L31
- Mukai et al. (2003) Mukai, K., Hellier, C., Madejski, G., Patterson, J., & Skillman, D. R. 2003, ApJ, 597, 479
- Nagar et al. (2002) Nagar, N. M., Oliva, E., Marconi, A., & Maiolino, R. 2002, A&A, 391, L21
- Oliva et al. (1999) Oliva, E., Origlia, L., Maiolino, R., & Moorwood, A. F. M. 1999, A&A, 350, 9
- Onori et al. (2017) Onori, F., Ricci, F., La Franca, F., et al. 2017, MNRAS, 468, L97
- Padovani et al. (2017) Padovani, P., Alexander, D. M., Assef, R. J., et al. 2017, A&A Rev., 25 [arXiv:1707.07134]
- Pancoast et al. (2014) Pancoast, A., Brewer, B. J., Treu, T., et al. 2014, MNRAS, 445, 3073
- Pancoast et al. (2015) Pancoast, A., Brewer, B. J., Treu, T., et al. 2015, MNRAS, 448, 3070
- Panessa et al. (2011) Panessa, F., de Rosa, A., Bassani, L., et al. 2011, MNRAS, 417, 2426
- Papadakis (2004) Papadakis, I. E. 2004, MNRAS, 348, 207
- Parker et al. (2014) Parker, M. L., Wilkins, D. R., Fabian, A. C., et al. 2014, MNRAS, 443, 1723
- Pavlinsky et al. (1992) Pavlinsky, M. N., Grebenev, S. A., & Sunyaev, R. A. 1992, Soviet Astronomy Letters, 18, 88
- Perola et al. (2002) Perola, G. C., Matt, G., Cappi, M., et al. 2002, A&A, 389, 802
- Peterson (1993) Peterson, B. M. 1993, PASP, 105, 247
- Peterson et al. (2004) Peterson, B. M., Ferrarese, L., Gilbert, K. M., et al. 2004, ApJ, 613, 682
- Petrucci et al. (2001) Petrucci, P. O., Haardt, F., Maraschi, L., et al. 2001, ApJ, 556, 716
- Petrucci et al. (2000) Petrucci, P. O., Haardt, F., Maraschi, L., et al. 2000, ApJ, 540, 131
- Petrucci & Henri (1997) Petrucci, P. O. & Henri, G. 1997, A&A, 326, 99
- Petrucci et al. (2013) Petrucci, P.-O., Paltani, S., Malzac, J., et al. 2013, A&A, 549, A73
- Porquet et al. (2017) Porquet, D., Reeves, J. N., Matt, G., et al. 2017, ArXiv e-prints [arXiv:1707.08907]
- Poutanen & Svensson (1996) Poutanen, J. & Svensson, R. 1996, ApJ, 470, 249
- Ricci et al. (2017) Ricci, C., Trakhtenbrot, B., Koss, M. J., et al. 2017, ArXiv e-prints [arXiv:1709.03989]
- Risaliti et al. (2011) Risaliti, G., Nardini, E., Salvati, M., et al. 2011, MNRAS, 410, 1027
- Rivers et al. (2014) Rivers, E., Markowitz, A., Rothschild, R., et al. 2014, ApJ, 786, 126
- Sambruna et al. (2009) Sambruna, R. M., Reeves, J. N., Braito, V., et al. 2009, ApJ, 700, 1473
- Titarchuk (1994) Titarchuk, L. 1994, ApJ, 434, 570
- Tortosa et al. (2018) Tortosa, A., Bianchi, S., Marinucci, A., et al. 2018, MNRAS, 473, 3104
- Tortosa et al. (2017) Tortosa, A., Marinucci, A., Matt, G., et al. 2017, MNRAS, 466, 4193
- Trevese et al. (2014) Trevese, D., Perna, M., Vagnetti, F., Saturni, F. G., & Dadina, M. 2014, ApJ, 795, 164
- Ursini et al. (2015) Ursini, F., Marinucci, A., Matt, G., et al. 2015, MNRAS, 452, 3266
- Veron et al. (1980) Veron, P., Lindblad, P. O., Zuiderwijk, E. J., Veron, M. P., & Adam, G. 1980, A&A, 87, 245
- Vestergaard (2002) Vestergaard, M. 2002, ApJ, 571, 733
- Vestergaard & Peterson (2006) Vestergaard, M. & Peterson, B. M. 2006, ApJ, 641, 689
- Wang et al. (1999) Wang, T., Mihara, T., Otani, C., Matsuoka, M., & Awaki, H. 1999, ApJ, 515, 567
- Wegner et al. (2003) Wegner, G., Bernardi, M., Willmer, C. N. A., et al. 2003, AJ, 126, 2268
- Willmer et al. (1991) Willmer, C. N. A., Focardi, P., Chan, R., Pellegrini, P. S., & da Costa, N. L. 1991, AJ, 101, 57
- Winter et al. (2009) Winter, L. M., Mushotzky, R. F., Reynolds, C. S., & Tueller, J. 2009, ApJ, 690, 1322
- Woo & Urry (2002) Woo, J.-H. & Urry, C. M. 2002, ApJ, 579, 530
- Zdziarski et al. (1996) Zdziarski, A. A., Johnson, W. N., & Magdziarz, P. 1996, MNRAS, 283, 193
- Zhang & Wang (2006) Zhang, E.-P. & Wang, J.-M. 2006, ApJ, 653, 137
- Zoghbi et al. (2015) Zoghbi, A., Miller, J. M., Walton, D. J., et al. 2015, ApJ, 799, L24
- Życki et al. (1999) Życki, P. T., Done, C., & Smith, D. A. 1999, MNRAS, 309, 561
Appendix A Re-Analysis of NGC 5506, GRS 1734-292 and MCG -05-23-16
NGC 5506, GRS 1734-292 and MCG -05-23-16 have the most extreme values of coronal temperature of the sample. These values are obtained in literature using the compTT comptonization model (Titarchuk 1994). We check the kTe and values in spherical geometry of the corona for the above sources by re-analysing the NuSTAR observations using the nthcomp model (Zdziarski et al. 1996 and Życki et al. 1999).
NGC 5506 was observed with NuSTAR (OBSID 60061323) on 2014 April 1. The observation was coordinated with the Swift observatory (OBSID 00080413001), which observed the source, on 2012 April 2.In the re-analysis of NGC 5506, we fitted also the simultaneous Swift/XRT data, but we did not re-extract the Swift/XRT spectra.
GRS 1734-292 was observed by NuSTAR on 2014 September 16 (OBSID 60061279002), for a total elapsed time of 43 ks.
MCG -05-23-16 was observed on 2012 July 11–12 (OBSID 10002019), and on 2013 June 3–7 (OBSID 60001046). The first observation was conducted as a part of the NuSTAR calibration campaign. The second observation was a science observation carried out simultaneously with a long Suzaku observation. In our re-analysis we used only the NuSTAR science observation.
First we reduced again the old NuSTAR observations with the NuSTAR Data Analysis Software (NuSTARDAS) package (v. 1.6.0). Cleaned event files (level 2 data products) were produced and calibrated using standard filtering criteria with the nupipeline task using the last new calibration files available from the NuSTAR calibration database (CALDB 20170120). The extraction radii of the circular region were 0.5 arcmin both for source and for background spectra, for all the sourced.
In their analysis of NGC 5506 Matt et al. (2015) found an X-ray spectrum composed by an absorbed power law (with ) with an exponential high-energy cutoff (E keV), plus a moderately ionized reflection component, and ionized iron lines. They estimated the coronal parameters using the compTT comptonization model (Titarchuk 1994), and the compps model (Poutanen & Svensson 1996), founding, in the spherical geometry of the corona a coronal temperature of keV ( keV) and an optical depth of 0.09 (0.14) respectively.
Tortosa et al. (2017) found, for the NuSTAR spectra of GRS 1734-292, a spectral shape of an absorbed power-law with photon index of and a very low exponential cutoff, keV. They found a reflection fraction of and no evidence of relativistic features. Using the compTT model and assuming a spherical geometry for the Comptonizing corona, they fond a coronal temperature of keV and an optical depth .
The analysis of the NuSTAR spectrum of MCG -05-23-16, made up by Baloković et al. (2015), showed a primary power-law with an exponential high energy cutoff at keV, a photon index of and the iron line with both narrow and broad component, the last one due to relativistic effects. compTT Comptonization model in the case of a spherical corona gives a coronal temperature kT keV and a coronal optical depth .
We used models similar to the ones of Matt et al. (2015), Tortosa et al. (2017) and Baloković et al. (2015) to fit the NGC 5506, GRS 1734-292 and MCG -05-23-16 data, but we used therelxillcp and xillver-comp models (García & Kallman 2010; García et al. 2014 and Dauser et al. 2014) to model the relativistic or standard (respectively) reflection with the irradiation of the accretion by a power law with a nthcomp(Zdziarski et al. 1996 and Życki et al. 1999) Comptonization continuum.
The values obtained with the re-analysis are showed in Table 3. The coronal optical depth values are extrapolated using the relation from Beloborodov (1999).
| Source | kTe (keV) | d.o.f. | ||
|---|---|---|---|---|
| NGC 5506 | ||||
| GRS 1734-292 | ||||
| MCG -05-23-16 |
The values we found in our re-analysis are different from the literature values, especially the photon index (and so the optical depth). However the error bars on the coronal temperature almost are still the same.
Even if the values we found are different from the literature ones, the -kTe pairs follow the relation found previously with the literature values (see Figure 7).
Appendix B List of the sources
-
•
NGC 5506 is a bright, nearby() Compton-thin (Wang et al. 1999), narrow-line Seyfert 1 galaxy (Nagar et al. 2002). Its spectrum is well described by a power-law with with an high energy exponential cutoff at keV (Matt et al. 2015). NGC 5506 has a galactic absorption with a column density of cm-2 (Kalberla et al. 2005). The observed 2-10 keV flux corrected for absorption is erg cm-2s -1 corresponding to a luminosity of ergs s-1 (Matt et al. 2015).
-
•
MCG -05-23-16 is a nearby (, 36Mpc)Seyfert 1.9 galaxy (Veron et al. 1980; Wegner et al. 2003). This source has a complex structure of the fluorescent line emission, including both broad and narrow components produced by the disc and the torus reflection, respectively (Baloković et al. 2015). It has an absorption with column density of cm-2. The photon index of the primary power-law results to be . It shows also an high energy cutoff at keV (Baloković et al. 2015)
-
•
SWIFT J2127.4+5654 () is a narrow-line Seyfert 1. It was observed by NuSTAR and XMM-Newton in an observational campaign performed in November 2012. This source is affected only by the the Galactic column density absorption ( cm-2, Kalberla et al. 2005). The primary emission of this source has a power-law spectral shape with a photon index of and a cutoff energy (Marinucci et al. 2014a).
- •
-
•
3C 390.3 () is a radio-loud Seyfert 1 galaxy with a weak reflection and a flat photon index. The timing properties of 3C390.3 do not differ from those of radio-quiet Seyferts (Gliozzi et al. 2009) and that there is no noticeable contribution from the jet to the X-ray emission (Sambruna et al. 2009). It has a Galactic column density of cm-2 (Kalberla et al. 2005), a photon index of the primary power-law of and a cutoff at energy of keV (Lohfink et al. 2015).
-
•
3C 382 () is a broad-line radio galaxy but its X-ray continuum is dominated by the Comptonizing corona similarly to radio-quiet Seyfert galaxies (Ballantyne et al. 2014). It has a Galactic absorption with a column density of cm-2 (Kalberla et al. 2005) and a weak, highly ionized warm absorber with cm-2 and , it has also a and a high energy cutoff at keV (Ballantyne et al. 2014).
-
•
GRS 1734-292 (, corresponding to a distance of Mpc) is a Seyfert Galaxy originally discovered by the ART-P telescope aboard the GRANAT satellite (Pavlinsky et al. 1992). It has a total hydrogen column density in excess of cm-2. The 2-10 keV flux for this source is erg cm-2 s-1. GRS 1734-292 has the spectral slope of the primary power-law typical of a Seyfert galaxy in the NuSTAR observation (1.65), with one of the lowest high energy cutoff ( keV) measured so far by NuSTAR (Tortosa et al. 2017).
-
•
NGC 6814 (, Molina et al. 2009) is a Seyfert 1 Galaxy known to show X-ray variability by at least a factor of 10 over time scales of years (Mukai et al. 2003). The keV absorption-corrected luminosities from the NuSTAR observation is L erg s-1. It has a primary power-law with a photon index of and an exponential cutoff at keV (Tortosa et al. 2018).
-
•
MCG 8-11-11 () is a very X-ray bright AGN. The keV absorption-corrected luminosities from the NuSTAR observation is L erg s-1. It has a primary power-law with a photon index of and an exponential cutoff at keV (Tortosa et al. 2018).
- •
-
•
PG 1247+267 is one of the most luminous known quasars at and is a strongly super-Eddington accreting supermassive black hole (SMBH) candidate. It was observed by NuSTAR in December 2014 for a total of 94 ks. From this observation it results that Pg 1247+267 has a primary power-law with a cutoff energy at keV and photon index of (Lanzuisi et al. 2016).
-
•
Ark 120 () is a ’bare’ Seyfert 1 galaxy, a system in which ionized, displaying neither intrinsic reddening in its IR continuum nor evidence for absorption in UV and X-rays absorption is absent (Matt et al. 2014, Porquet et al. 2017). The spectrum of the source has a measure of the high energy cutoff value of keV Porquet et al. (2017). The photon index of the primary power-law is (Porquet et al. 2017).
-
•
NGC 7213 () is a low-luminosity active galactic nucleus that hosts a supermassive black hole of solar masses. It has also been classified as a low-ionization nuclear emission region galaxy (LINER) because of the low excitation observed in the narrow-line spectrum (Filippenko & Halpern 1984). The photon index of the primary power-law of the spectrum of NGC 7213 is . The sources does not have a cutoff measurements but shows only a lower limits on the cutoff energy of keV (Ursini et al. 2015).
-
•
MCG 6-30-15 (), is a Seyfert 1 galaxy with an extreme X-rays variability and a very broad Fe k line emission, with an iron abundance significantly higher than solar (Fabian et al. 2002). Its primary power-law show a photon index of and a lower limit on the high enery cutoff which results to be keV (Marinucci et al. 2014b).
-
•
NGC 2110 () is a bright Seyfert 2 galaxy. it shows a prominent Fe k line with a variable intrinsic emission and shows a cutoff energy keV, with no detectable contribution from Compton reflection (Marinucci et al. 2015). The source has several layers of absorbing material with column densities in the range cm-2 (Rivers et al. 2014).
-
•
Mrk 335 () is a arrow-line Seyfert 1 galaxy that show narrower broad emission-line components than typical Type 1 AGN (Grier et al. 2012). It has been observed by NuSTAR in June and July 2013. The Galactic absorption for this source is of cm-2 (Kalberla et al. 2005). Its primary power-law spectrum shows a photon index of and a cutoff energy (Parker et al. 2014).
- •
- •
-
•
PG 1211+143 () is a bright radio-quiet quasar which belongs to the class of Narrow Line Seyfert 1 galaxies and presents an archetypical case for the ultra-fast outflows. The amount of Galactic neutral absorption along the line of sight is cm-2 (Kalberla et al. 2005). The photon index of the primary power-law of the spectrum of this source is with a lower limit on the exponential cutoff of keV (Zoghbi et al. 2015).