The nature of the intrinsic spectra from the VHE emission of
H 2356-309 and 1ES 1101-232
Abstract
The VHE emission from the HBLs H 2356-309 and 1ES 1101-232 were observed by HESS telescopes during 2004–2007. Particularly the observation in 2004 from H 2356-309 and during 2004–2005 from 1ES 1101-232 were analyzed to derive strong upper limits on the EBL which was found to be consistent with the lower limits from the integrated light of resolved galaxies. Here we have used the photohadronic model corroborated by two template EBL models to fit the observed VHE gamma-ray data from these two HBLs and to predict their intrinsic spectra. We obtain very good fit to the VHE spectra of these two HBLs. However, the predicted intrinsic spectra are different for each EBL model. For the HBL H 2356-309, we obtain a flat intrinsic spectrum and for 1ES 1101-232 the spectrum is mildly harder than 2 but much softer than 1.5.
I Introduction
The high energy -rays coming from the distant blazar jets to the Earth are attenuated by pair production with the soft photonsStecker:1992wi ; Hauser:2001xs . There are mainly two important sources of these soft photons, namely, synchrotron photons intrinsic to the jet and the external ambient photons from the extragalactic background light (EBL). As we understand, the blazar spectra are highly variable and have wider range of variability. Although we have learned a lot about them, the present understanding of their radiation process is still incomplete to reliably predict the intrinsic TeV spectrum, and thus to disentangle absorption from intrinsic features. It is hoped that modeling of the blazar spectral energy distribution (SED) by taking into account properly the emission mechanism can take care of the intrinsic extraneous effect due to its environment. The total absorption of the TeV -rays depends on the local density of the low energy photons at the origin, the distance traveled (redshift ) and also the energy of the high energy -rays . For higher energy -rays the absorption process leads to the steepening of the observed spectrum thus reducing the observed flux. So the observed blazar spectrum contains valuable information about the history of EBL in the line-of-sight and the intrinsic properties of the source.
The EBL effect on the blazar spectrum can be calculated by subtracting the foreground sources from the diffuse emission. However, the foreground zodiacal light and galactic light introduce large uncertainties in such measurements and make it difficult to isolate the EBL contribution from the observed multi-TeV flux from distant blazars. Strict lower limits are derived from the source counts and rather loose upper limits come from direct measurements. Nevertheless, an indirect approach is to utilize the very high energy (VHE) -ray spectra from blazars by assuming a power-law behavior for the intrinsic spectrum. So, long term studies of many high frequency peaked BL Lacerate objects (HBLs) of different redshifts during periods of activity such as flaring will provide invaluable insights into the emission mechanisms responsible for the production of VHE -rays as well as the absorption process due to EBL. In recent years, the continuing success of highly sensitive Imaging Atmospheric Cherenkov Telescopes (IACTs) such as VERITASArchambault:2016wly , HESS Abramowski:2012ry and MAGICMoralejo:2017eny have led to the discovery of many new extragalactic TeV sources which in turn resulted in constraining the flux density of the EBL over two decades of wavelengths from m to mH.E.S.S.:2017odt ; Romoli:2017nrp ; Moralejo:2017eny ; Abeysekara:2015pjl ; Ahnen:2015qrv ; Ahnen:2016gog .
Blazars detected at VHE are predominantly HBLs and flaring in VHE seems to be a common phenomenon in these objects, although it is not yet understood properly. In general this VHE emission is explained by leptonic modelsKatarzynski:2006db ; Fossati:1998zn ; Ghisellini:1998it ; Roustazadeh:2011zz through SSC scattering process. Due to the absorption of the primary VHE photons by EBL, the corresponding intrinsic spectrum becomes harder than the observed one. Normally in the SSC model the intrinsic photon spectrum has a spectral index (discussed in Sec.III) in the energy range where electron cooling via synchrotron and/or IC energy loss is efficient and the hard spectrum with is considered as a lower bound. It is difficult to produce harder spectra () in the one-zone SSC scenario. The orphan flaring in multi-TeV -rays and blazars with hard gamma ray spectra are troublesome to deal with the standard SSC scenario. Multi-TeV emission from two HBLs, 1ES 1101-232 (z=0.186) and H 2356-309 (z=0.165) were observed by the HESS Cherenkov telescopesAharonian:2005gh and at that time these were the most distant sources. Due to the lack of reliable EBL data, different EBL SEDs were assumed to construct the intrinsic spectra from the observed VHE spectra. The assumed EBL SEDs were in general agreement with the EBL spectrum expected from galaxy emission. Although, the constructed intrinsic spectra were compatible with a power-law, the intrinsic spectrum of the HBL 1ES 1101-232 was rather hard and such hard spectra had never been observed before in the spectra of closest, less absorbed TeV blazars e.g. Mrk 421 and Mrk 501Aharonian:1999vy ; Krennrich:2002as ; DjannatiAtai:1999af ; Sahu:2015tua ; Sahu:2016bdu and are difficult to explain with the standard leptonic or hadronic scenariosAharonian:2001jg for blazar emission. Also the resulting EBL upper limits were found to be consistent with the lower limits from the integrated light of resolved galaxies and seems to exclude a large contribution to the EBL from other sources. From the analysis in ref. Aharonian:2005gh , it was inferred that the Universe is more transparent to gamma rays than previously anticipated. Later on, harder spectra have also been observed from many HBLs Aharonian:2007wc ; Neronov:2011ni ; HESS:2012aa . Thereafter, many scenarios are suggested to achieve very hard VHE spectra which are discussed in ref. Cerruti:2014iwa and references therein. Also alternative photohadronic scenarios are proposed to explain the VHE emissionEssey:2010er ; Cao:2014nia . The structured jet (spine-layer) model is also proposed to explain the high energy emission from blazarsGhisellini:2004ec ; Tavecchio:2008be .
In this work our goal is to use the photohadronic model of Sahu et al.Sahu:2013ixa and different template EBL modelsFranceschini:2008tp ; Inoue:2012bk to re-examine the VHE spectra of HBLs 1ES 1101-232 and H 2356-309 and to calculate their intrinsic spectra. Here, we assume that the Fermi accelerated protons in the blazar jet have a power-law behavior and the observed VHE spectra of the HBLs are related to the proton spectrum.
The paper is organized as follows: In Sec. 2 we discuss different EBL models which are used for our calculation. The photohadronic model of Sahu et al.Sahu:2013ixa is discussed concisely in Sec. 3. We discuss the results obtained for the VHE observations of HBLs H 2356-309 and 1ES 1101-232 in Sec.4 and finally we briefly summarize our results in Sec. 5.
II EBL Models
Considering the uncertainty associated with the direct detection of the EBL contribution, a wide range of models have been developed to model the EBL SED based on our knowledge of galaxy and star formation rate and at the same time incorporating the observational inputsFranceschini:2008tp ; Inoue:2012bk ; Kneiske:2002wi ; Stecker:2005qs ; Dominguez:2010bv ; Orr:2011ha ; Primack:2005rf . Mainly three types of EBL models exist: backward and forward evolution models and semi-analytical galaxy formation models with a combination of information about galaxy evolution and observed properties of galaxy spectra. In the backward evolution scenariosStecker:2005qs , one starts from the observed properties of galaxies in the local universe and evolve them from cosmological initial conditions or extrapolating backward in time using parametric models of the evolution of galaxies. This extrapolation induces uncertainties in the properties of the EBL which increases at high redshifts. However, the forward evolution modelsFranceschini:2008tp ; Kneiske:2002wi predict the temporal evolution of galaxies forward in time starting from the cosmological initial conditions. Although, these models are successful in reproducing the general characteristics of the observed EBL, cannot account for the detailed evolution of important quantities such as the metallicity and dust content, which can significantly affect the shape of the EBL. Finally, semi-analytical models have been developed which follow the formation of large scale structures driven by cold dark matter in the universe by using the cosmological parameters from observations. This method also accounts for the merging of the dark matter halos and the emergence of galaxies which form as baryonic matter falls into the potential wells of these halos. Such models are successful in reproducing observed properties of galaxies from local universe up to .
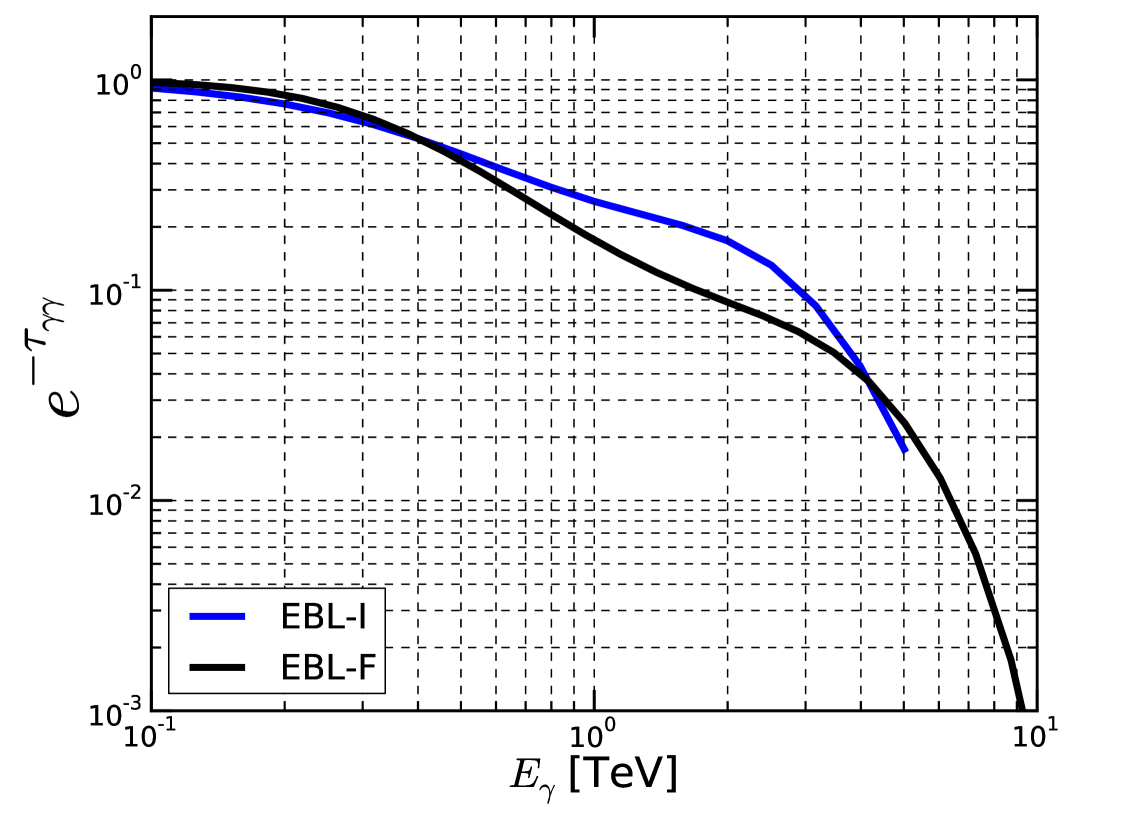
The VHE -rays from distant sources interact with the EBL to produce electron-positron pairs thus depleting the VHE flux by a factor of . Here is the optical depth of the process which depends on the energy of the -ray () and the redshift (z). For the present study we choose two different EBL models by Franceschini et al.Franceschini:2008tp and Inoue et al.Inoue:2012bk (hereafter EBL-F and EBL-I respectively). The attenuation factor of these EBL models at redshifts 0.165 and 0.186 are shown in Figs.1 and 2. In Fig.1, it is observed that below GeV, these two models behave almost the same and above this energy there is a slight difference in their behavior.
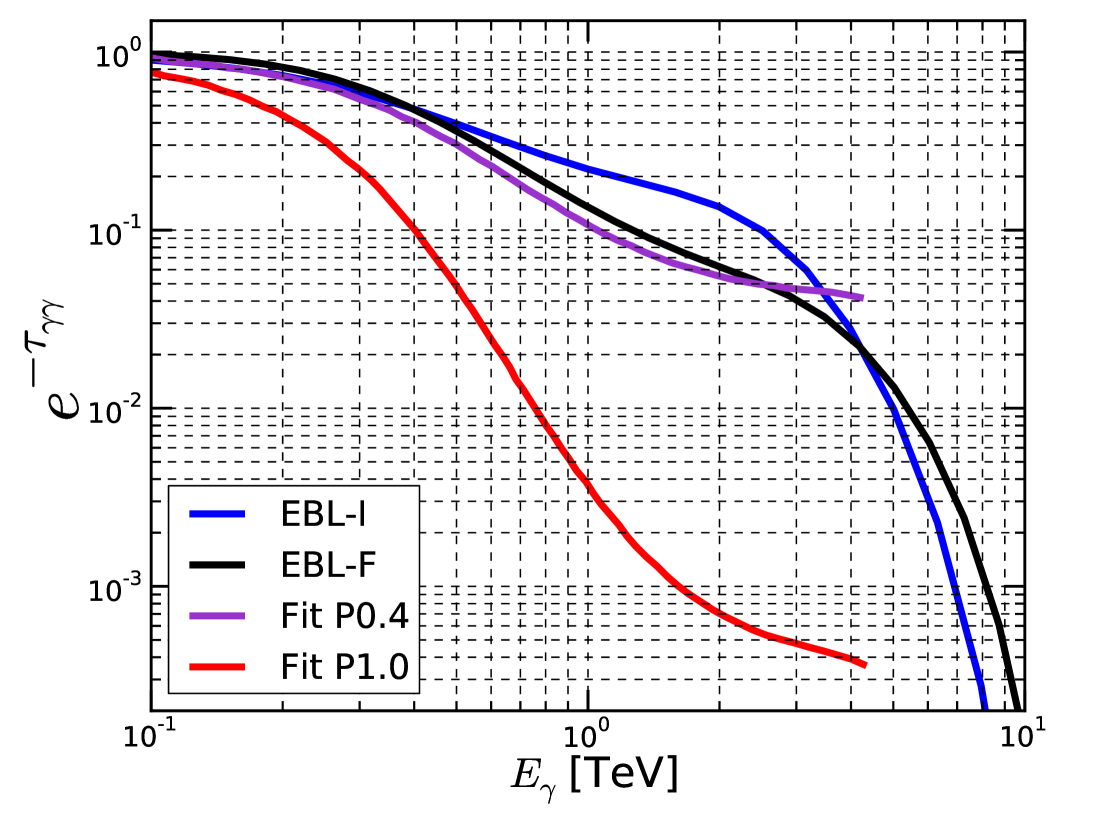
In Fig.2, we have compared the attenuation factor of EBL-F and EBL-I for z=0.186. The behavior of both these models are similar to the one at redshift z=0.165 which can be seen by comparing Fig.1 and 2. Here in Fig.2 we have also plotted the attenuation factor of ref. Aharonian:2005gh for z=0.186 with two different normalizations. To determine an upper limit of the EBL model, Aharonian et al [16] assumed a previously known shape for the SED of the EBL . This curve, is then renormalized to fit the measurements made by the HESS collaboration at 2.2 and 3.5 m. Here the normalization factor is as a free parameter and the scaled curves are named accordingly to this factor. Here, P1.0 means the original shape is multiply by a factor of 1, meanwhile P0.4 means that the original shape of the EBL is scaled by a factor of 0.4. In Fig.2 the P0.4 curve (violet) is very similar to the EBL-F (black curve) up to TeV. The curve P1.0 (red) falls very fast compared to other, as can be seen in the figure. This fast fall corresponds to a denser EBL component.
III Photohadronic Model
The photohadronic model Sahu:2013ixa ; Sahu:2015tua ; Sahu:2016bdu ; Sahu:2013cja has explained very well the orphan TeV flare from the blazar 1ES1959+650, and multi-TeV emission from M87, Mrk 421, Mrk 501 and 1ES 1011+496. This model relies on the standard interpretation of the leptonic model to explain both low and high energy peaks by synchrotron and SSC photons respectively, as in the case of any other AGN and blazar. Thereafter, it is assumed that the flaring occurs within a compact and confined volume of size inside the blob of radius (where ′ implies the jet comoving frame) and . During the flaring, both the internal and the external jets are moving with almost the same bulk Lorentz factor and the Doppler factor as the blob (for blazars ). A detail description of the photohadronic model and its geometrical structure is discussed in ref.Sahu:2013ixa . The injected spectrum of the Fermi accelerated charged particles having a power-law spectrum with the power index is considered here.
In the compact inner jet region, the Fermi accelerated high energy protons interact with the background photons with a comoving density to produce the -resonance and its subsequent decay to neutral and charged pions will give VHE -rays and neutrinos respectively. In the flaring region we assume is much higher than the rest of the blob (non-flaring) i.e. . As the inner jet is buried within the blob, we can’t calculate directly. So we use the scaling behavior of the photon densities in the inner and the outer jet regions as follows:
| (1) |
which assumes that the ratio of photon densities at two different background energies and in the flaring and the non-flaring states remains almost the same. The photon density in the outer region can be calculated from the observed flux from SED. By using Eq. (1), the can be expressed in terms of . It is shown in Refs. Cao:2014nia ; Zdziarski:2015rsa that super Eddington luminosity in protons is required to explain the high energy peaks. In a normal jet, the photon density is low, which makes the photohadronic process inefficientPjanka:2016ylv . However, in the present scenario it is assumed that during the flaring the photon density in the inner jet region can go up so that the -resonance production is moderately efficient, which eliminates the extreme energy requirementSahu:2015tua .
In the observer frame, the -decay TeV photon energy and the target photon energy satisfy the condition
| (2) |
The above condition is derived from the process . Also, the observed TeV -ray energy and the proton energy are related through . It is observed that for most of the HBLs, the is such that, always lies in the lower tail region of the SSC band. So it is the low energy SSC region which is responsible for the production of multi-TeV -rays in the photohadronic model. The efficiency of the process depends on the physical conditions of the interaction region, such as the size, the distance from the base of the jet, expansion time scale (or dynamical time scale of the blob ) and the photon density in the region which is related to the optical depth of this process.
Correcting for the EBL contribution, the observed VHE flux can be expressed in terms of the intrinsic flux by the relation
| (3) |
where the intrinsic flux can be given asSahu:2016bdu
| (4) |
The SSC energy and the observed energy satisfy the kinematical condition given in Eq.(2) and is the SSC flux corresponding to the energy which is known from the leptonic model fit to the multi-wavelength data. Here the only free parameter is the spectral index . For a given multi-TeV flaring energy and its corresponding flux, we can always look for the best fit to the spectrum which will give the value of . Also it is to be noted that, blazars are highly variable objects and characterized by very wide range of different spectra. Our model depends on the value of which can be different for separate epochs of observations and accordingly the value of can vary. However, in principle should be kept constant for a given acceleration mechanism. In the leptonic model, the SSC photon flux in the low energy tail region is a power-law given as , where . By using the relation in Eq. (2) we can express in terms of the observed VHE -ray energy which will give and again by replacing in Eq.(4) we get
| (5) |
and the intrinsic differential power spectrum for VHE photon is a power-law given as
| (6) |
However, due to the nonlinearity of the observed VHE flux will not behave as a single power-law. Hardness of the intrinsic spectrum depends on the value of for a given leptonic model which fixes the value of .
| Parameter | Description | H 2356-309 | 1ES 1101-232 |
|---|---|---|---|
| Black hole mass | |||
| z | Redshift | 0.165 | 0.186 |
| Bulk Lorentz Factor | 18 | 20 | |
| Doppler Factor | 18 | 20 | |
| Blob Radius | |||
| Magnetic Field | 0.16 G | 0.1 G |
IV Results
The VHE emission from the HBLs H 2356-309 and 1ES 1101-232 were observed by HESS telescopes during 2004 and 2005. The intrinsic flux can be calculated from the observed one by subtracting the EBL effect. So we use reliable EBL models to calculate the intrinsic flux. For our interpretation of the VHE -ray spectrum, we use two EBL models: EBL-F and EBL-I which are discussed in Sec.II. Also, we have to model the emission process in the HBLs. So here we use the photohadronic model of Sahu et al.Sahu:2013ixa and input for the photohadronic process comes from the leptonic models which are successful in explaining the double peak structure of the blazars. The detail analysis and results of the HBLs H 2356-309 and 1ES 1101-232 are discussed separately below.
IV.1 H 2356-309
The high frequency peaked BL Lac object H 2356-309 is hosted by an elliptical galaxy located at a redshift of z = 0.165 Falomo:1991a and was first detected in X-rays by the satellite experiment UHURUForman:1978a and subsequently by the Large Area Sky Survey experiment onboard the HEAO-I satellite Wood:1984a . Also in optical band it was observedSchwartz:1989 . In 2004, H 2356-309 was observed simultaneously in X-rays by RXTE, in optical by ROTSE-III, in radio by Nancay decimetric telescope (NRT) and in VHE for about 40 hours (June to December 2004) by HESS telescopes. It was observed that during this period, the X-ray spectrum measured above 2 eV was softer and the flux was times lower than the one measured by BeppoSAX in 1998 in the same energy band but in a comparatively quiescent state. Since 2004, H 2356-309 has been monitored by HESS for several years (from 2005 to 2007) and little flux variability is observed on the time scale of a few years. From the above simultaneous multi-wavelength observations, the HESS collaboration used one-zone leptonic model to fit the observed dataAbramowski:2010kg ; Aharonian:2006zy and the best fit parameters of the model are given in Table-1 which are used for the photohadronic model.
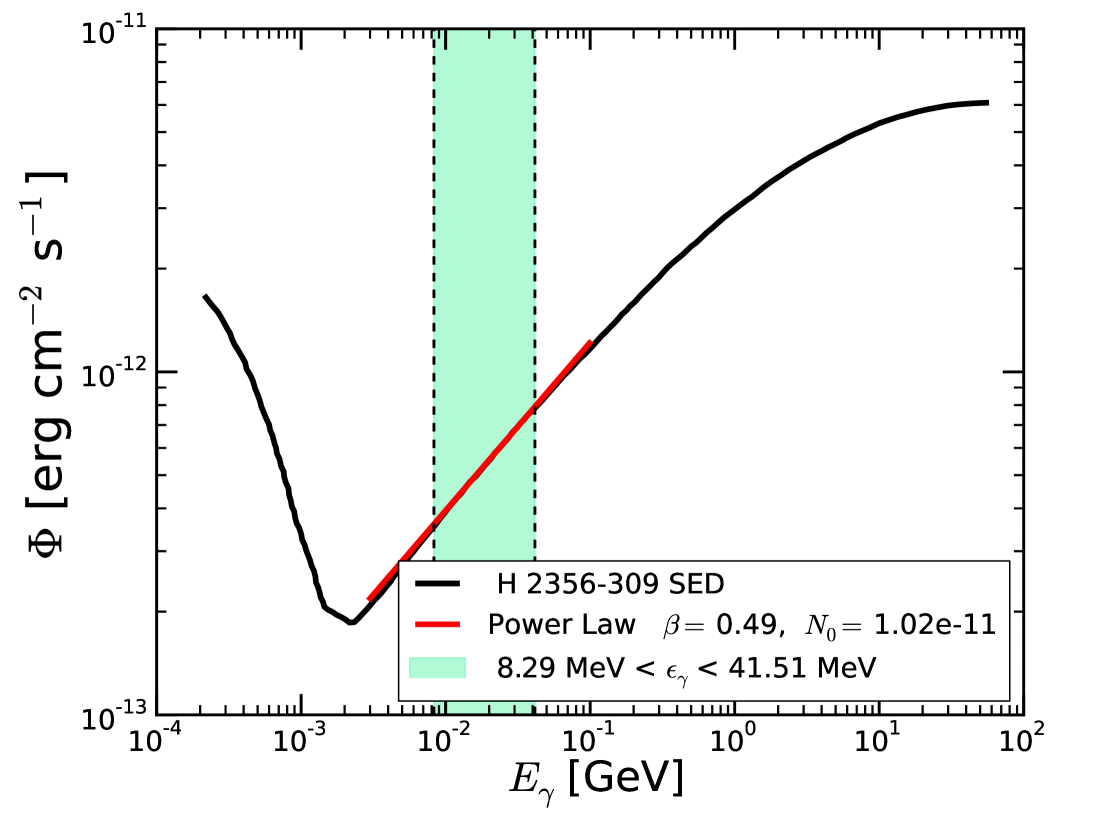
During 2004, the HESS telescopes observed the VHE emission in the energy range Aharonian:2005gh which was analyzed to constraint the EBL contribution. Here we would like to mention that the photohadronic model is applicable not only to VHE flaring but also to VHE (multi-TeV) emission from the blazars under discussion. In the photohadronic scenario this range of corresponds to Fermi accelerated protons in the energy range TeV which interacts with the seed SSC photons in the inner jet region in the energy range to produce -resonance. Subsequent decay of the resonance state produces -rays and neutrinos.
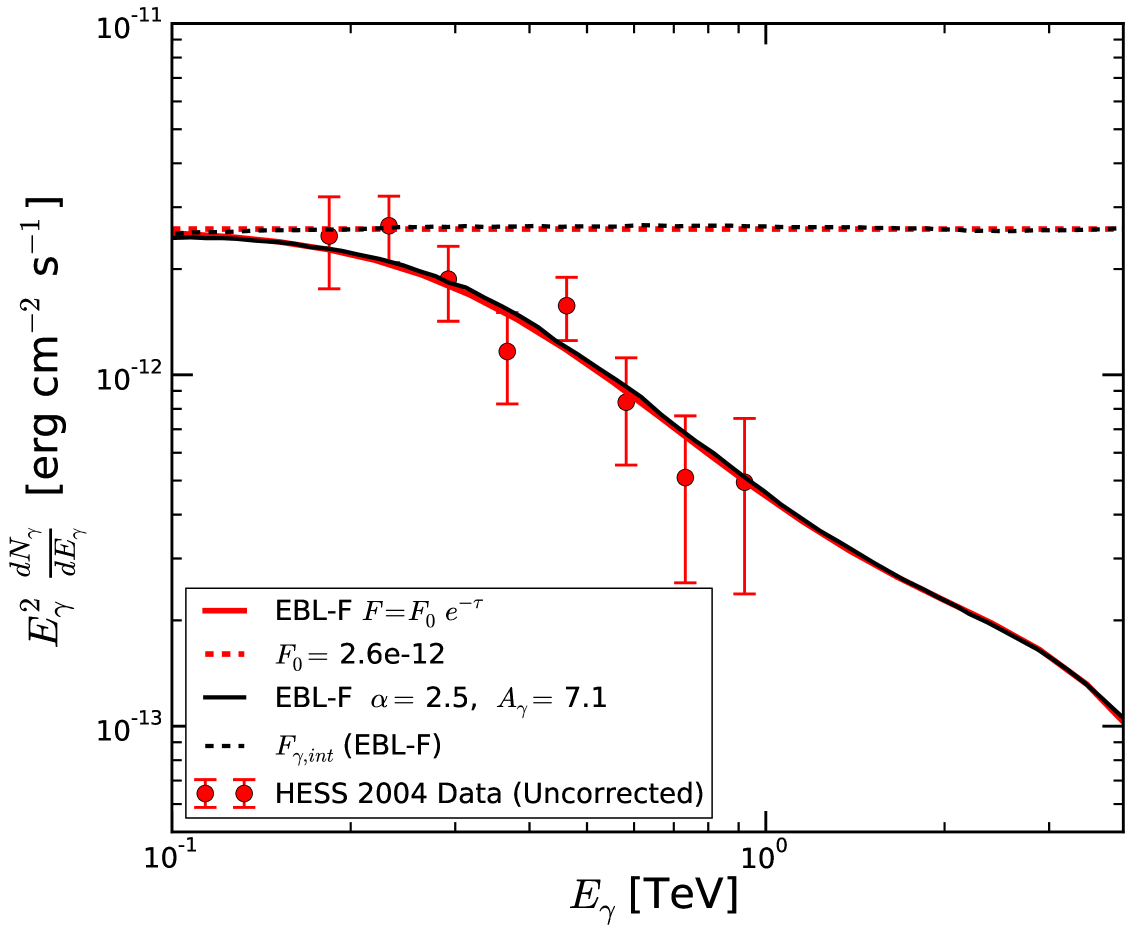
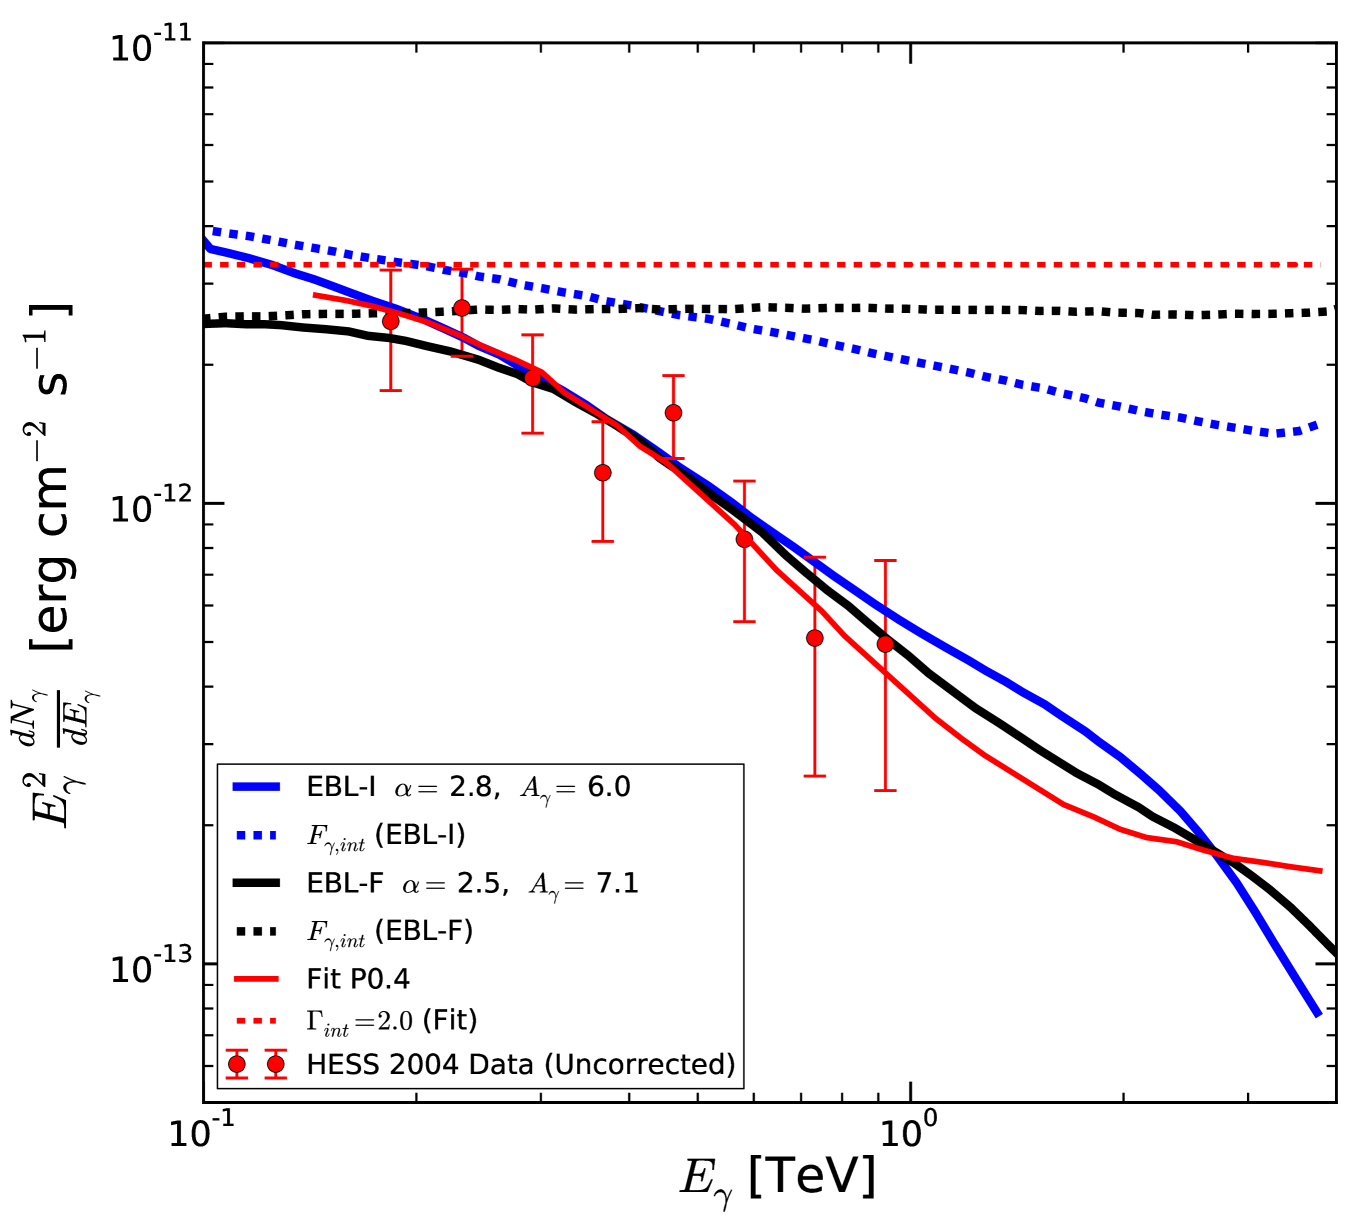
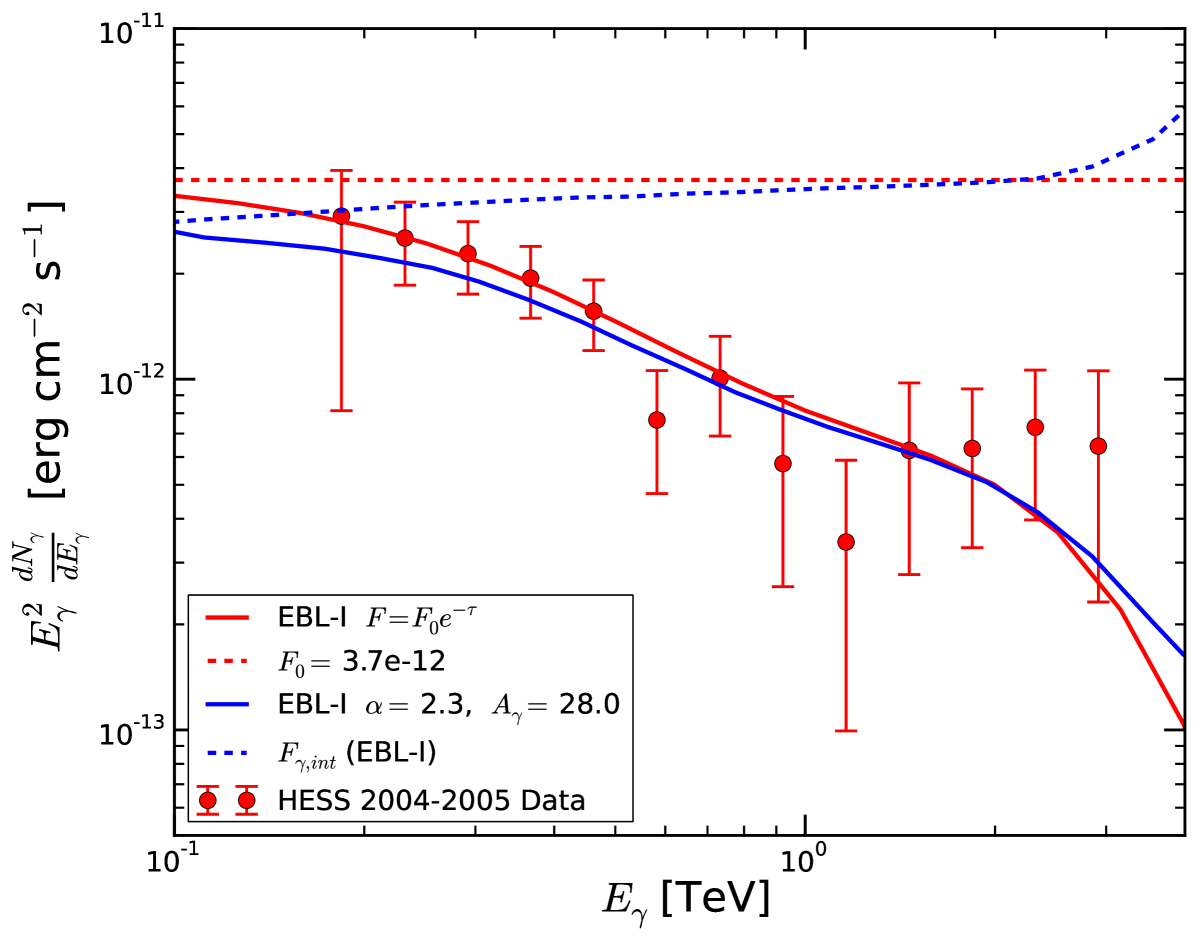
The VHE spectrum of H 2356-309 is strongly affected by the EBL and to calculate the intrinsic spectrum, we have used the EBL-F and EBL-I. Observed flux is proportional to the attenuation factor as shown in Eq.(3) and by assuming a constant in both the EBL models, we tried to fit the observed data which are shown in Figs. 3 and 4 respectively. It is observed that by taking for EBL-F (red curve) we can fit the observed data very well which is shown in Fig. 3. In the same plot we have also shown the photohadronic fit (black curve). The photohadronic fit and the multiplication by a constant factor are indistinguishable. A good fit to the data is obtained in photohadronic model for and . The constant implies that and exact fit to the in the energy range gives which is shown in Fig. 5 (red line). Also this gives the spectral index for the intrinsic spectrumCostamante:2012ph .
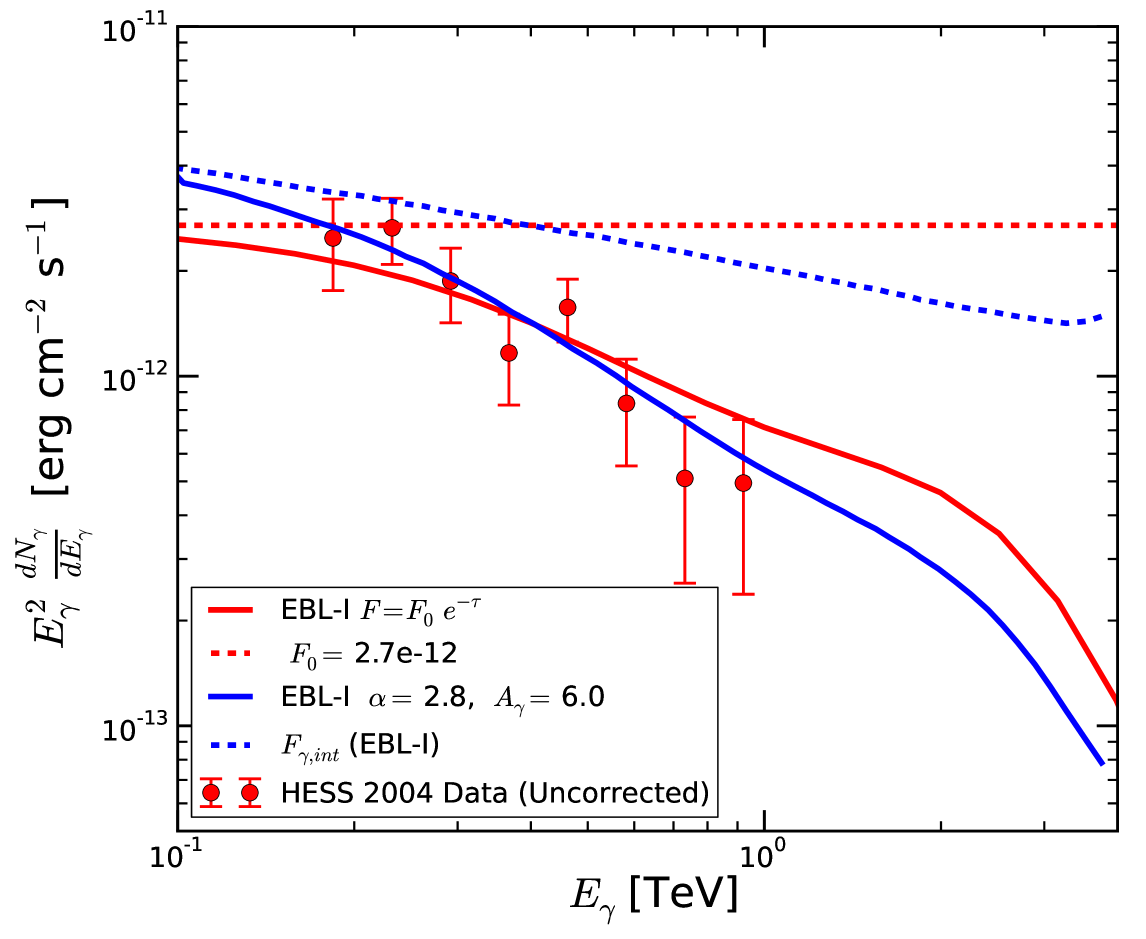
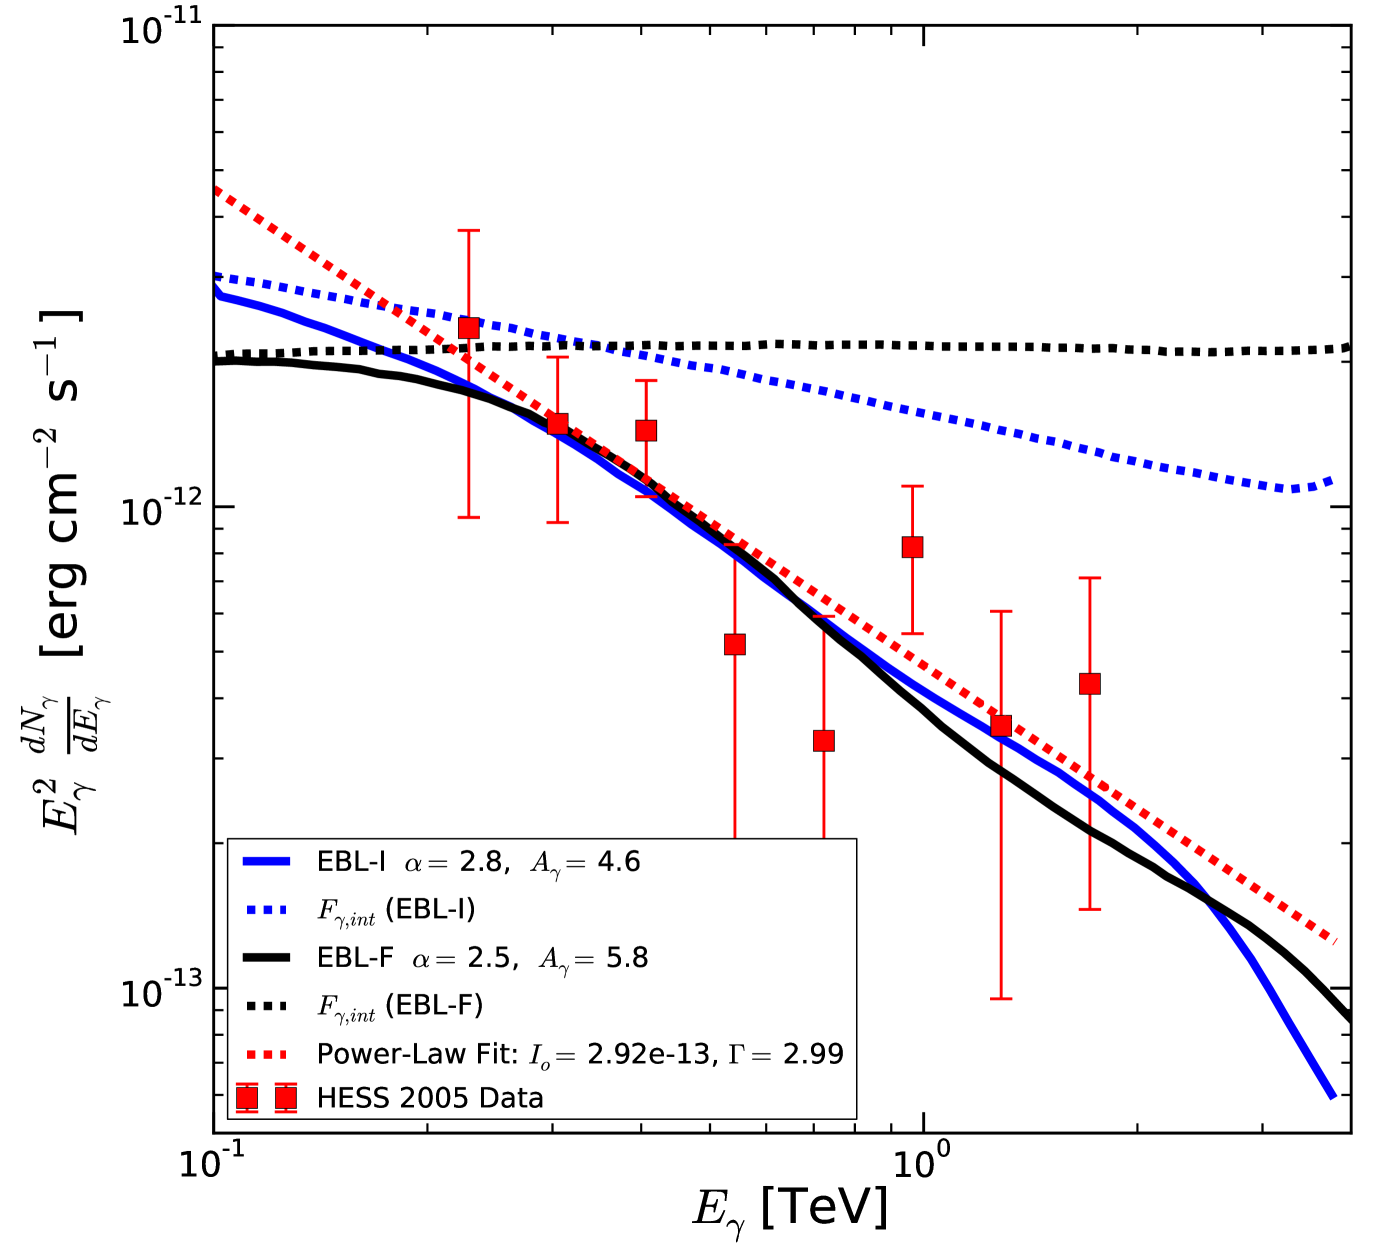
In Fig. 4 we have also rescaled the attenuation factor of EBL-I (red curve) by to fit the observed VHE data and for comparison the photohadronic model fit (blue curve) is also shown. The best fit for the photohadronic model is achieved here for and . We observe that the rescaling and the model fit are very different from each other and the photohadronic model fit is better than the rescale one. We also observe that the EBL-I (blue curve) correction to the photohadronic fit does not give a constant , but a power-law with and the intrinsic spectral index is .
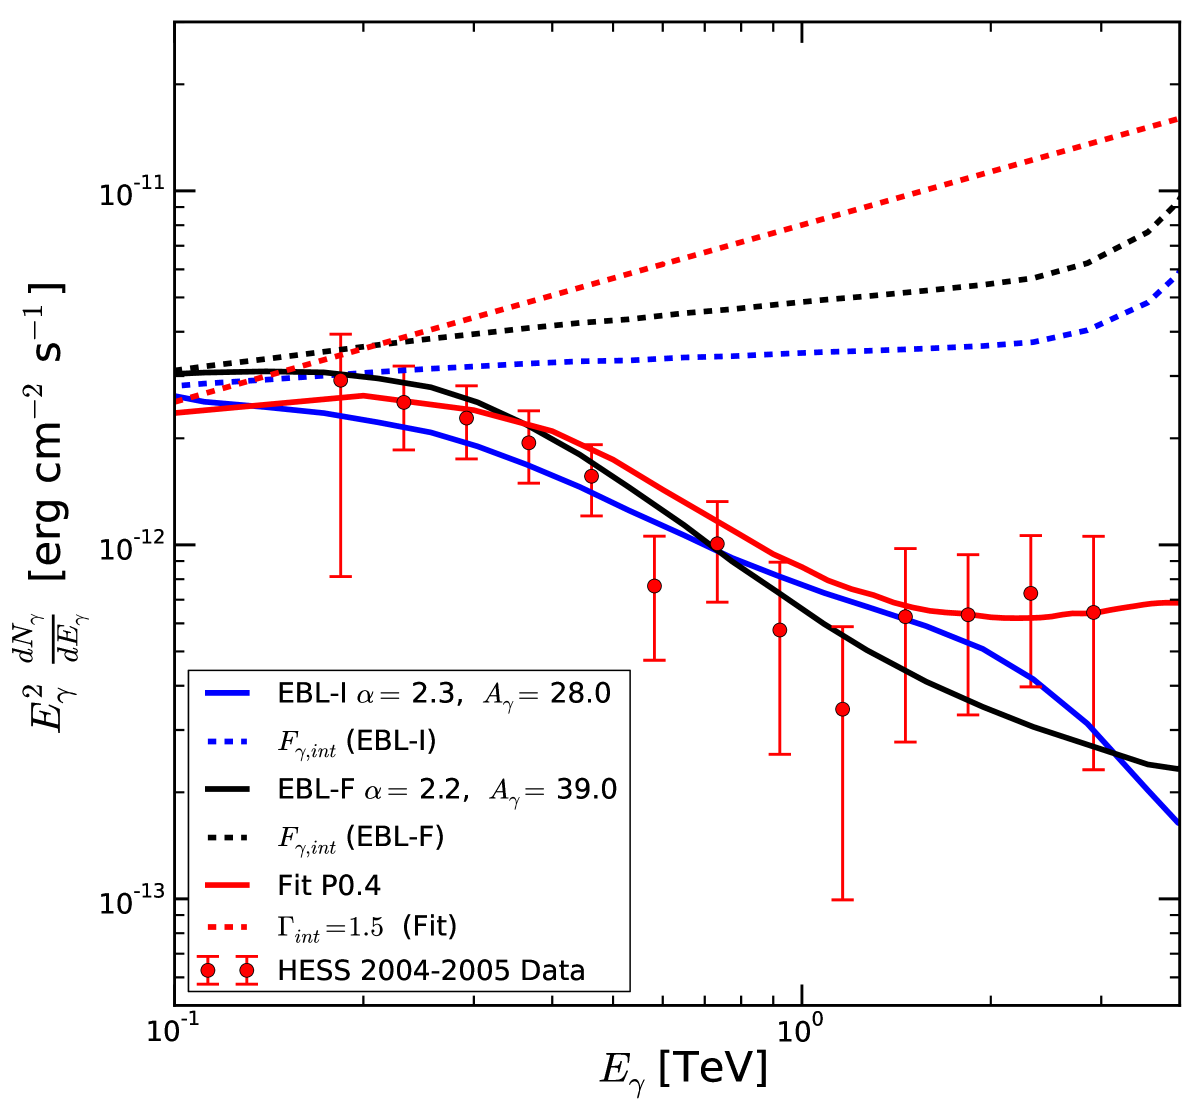
To compare the predictions of different EBL models and the result of ref. Aharonian:2005gh with P0.4 scaling (red curve), we have plotted these results in Fig. 6. We observe that all these models fit well to the observed data. For GeV the EBL-F (black curve) predict slightly lower flux than the rest. Also for TeV these predictions slightly differ from each other. Although the EBL-F (black dotted curve) and ref. Aharonian:2005gh models predict flat , their magnitudes are different due to different normalizations. The EBL-I predict an intrinsic flux with soft power index (blue dotted curve).
The Bethe-Heitler (BH) pair production process can also compete with the photohadronic process, but strongly depends on the angle between the photon and the emitted leptons. In the BH process, the electron-position pair can emit synchrotron photons. It is shown that this process can produce a third peak in-between the synchrotron peak and the IC peakPetropoulou:2014rla . For this to happen, the protons and electrons energies have to be very highPetropoulou:2015upa . It the present scenario, the maximum energy of a proton and also an electron in the jet is TeV. For a magnetic field of 0.16 G, an electron of energy 10 TeV will emit a synchrotron photon with maximum energy MeV, which is an order of magnitude smaller than the lowest SSC photon energy MeV taking part in the photohadronic process to produce -resonance. Leptons produced from pion and muon decay, pair creation and BH process will have energies less than 10 TeV and again the synchrotron photons from these leptons will have energies less than 0.8 MeV. The BH process may be important for very high energy protons and electrons, but here it does not play an important role and will not enhance the SSC photon flux in the energy range unless the magnetic field is high.
IV.1.1 Correction to 2004 data
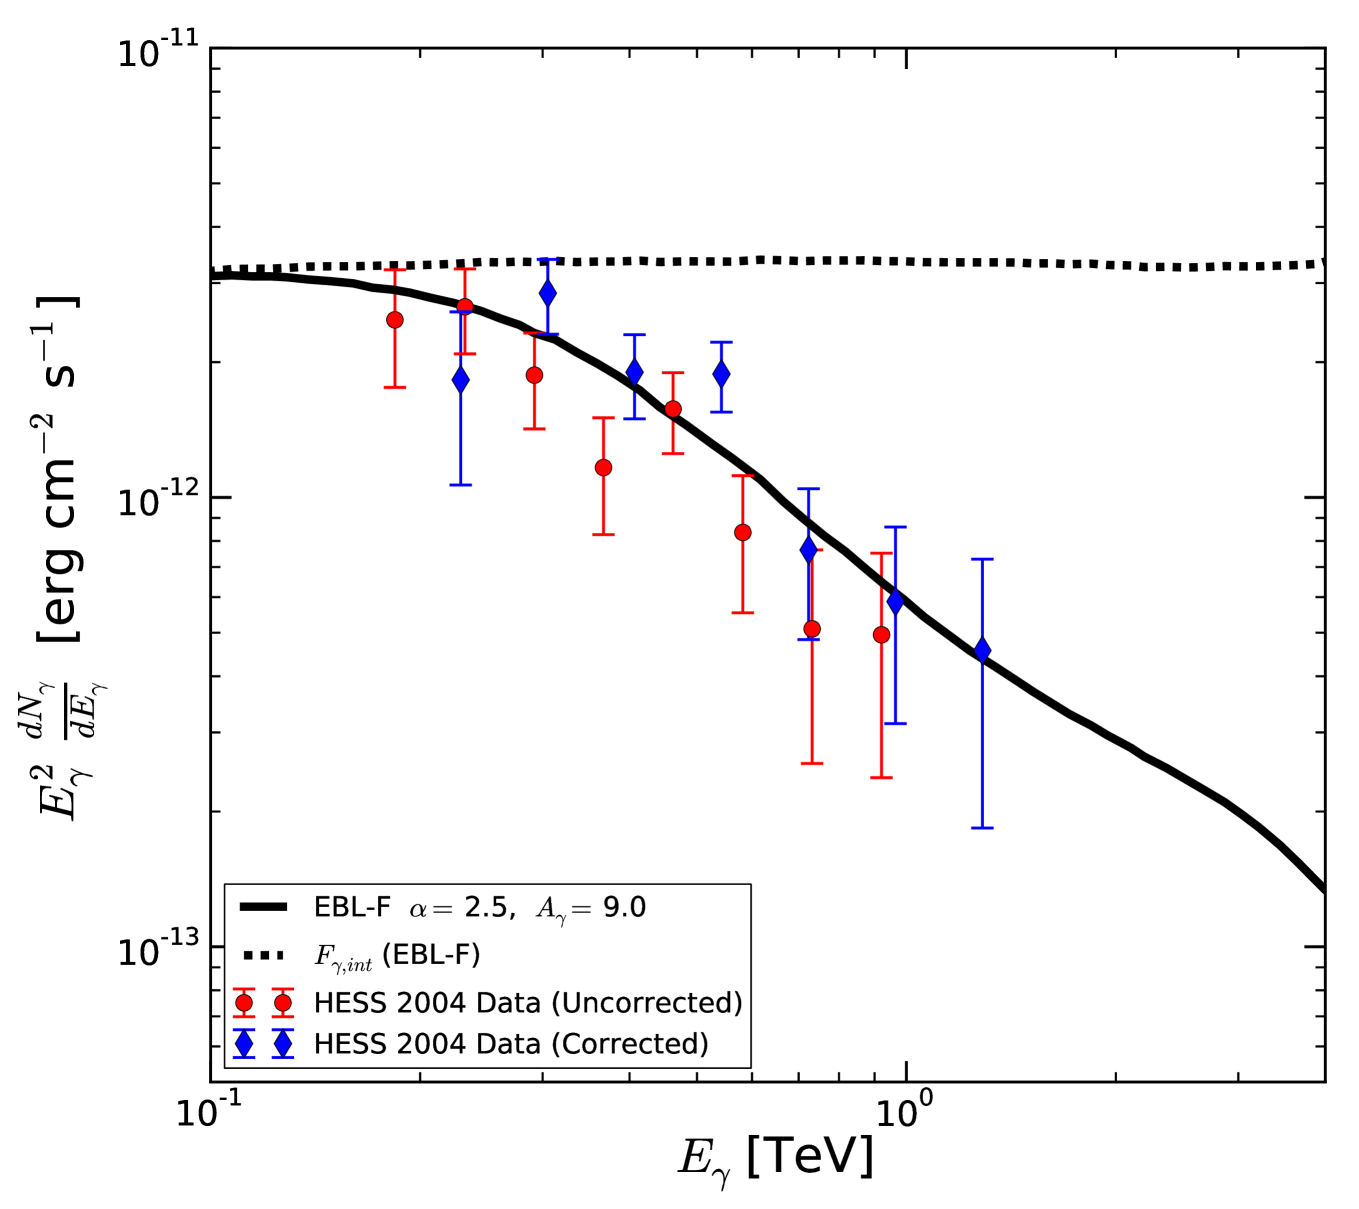
The aging of the HESS detector and the accumulation of dust on the optical elements of the telescopes affect the optical efficiency of the detector system and it can reduce the efficiency by about 26% for the entire data sample. So the HESS collaboration reanalyzed the previously published result of 2004Aharonian:2005gh and added results of new observations from 2005 to 2007 in another articleAbramowski:2010kg . As a consequence of the above correction the individual event energy is renormalized and correspondingly the flux changed. The corrected 2004 integral flux is higher then the original data. The observed VHE -rays of 2004 shifted from to . This new range of shifted the seed photon energy range to . We have shown both the uncorrected and corrected data of 2004 for comparison in Fig. 7. The corrected data is fitted well by photohadronic model with EBL-F (black curve) correction for and . By comparing these values with the corresponding parameters of Fig. 3, we observe that the value of has increased by which implies an overall increase in the observed flux and the intrinsic flux by the same amount with no other changes.
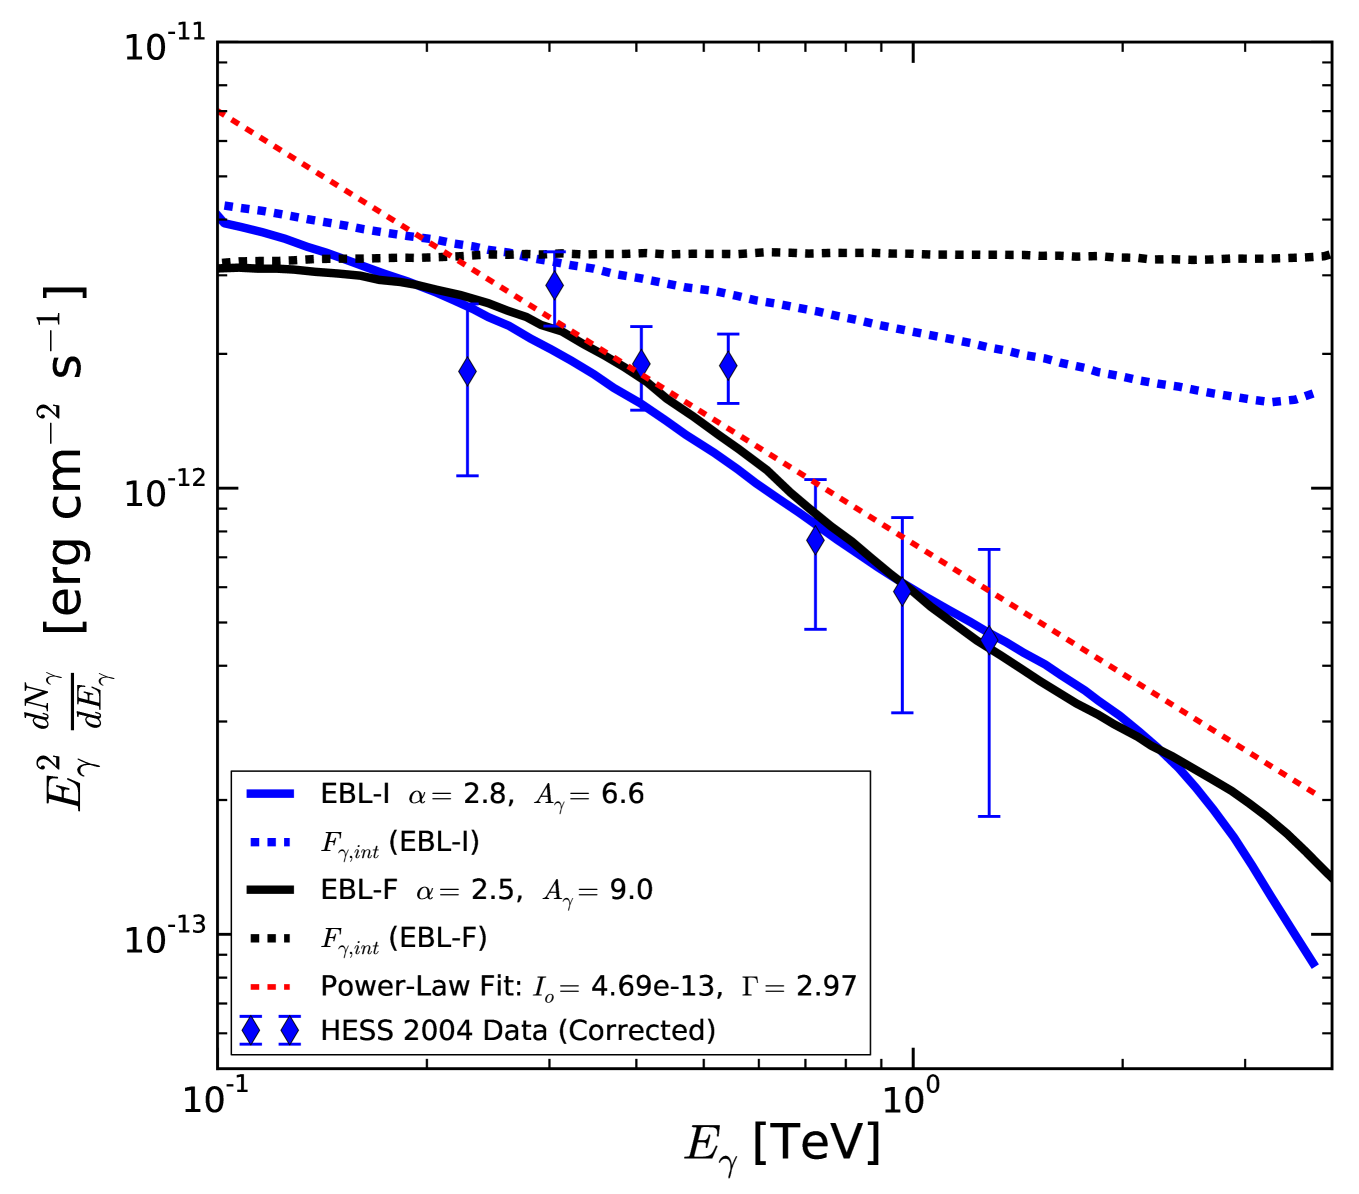
We also fit the corrected data with the EBL-I (blue curve) correction to the photohadronic model and compare with other fits in Fig. 8. A good fit is obtained for and . Again, this new corresponds to a 10% increase in the flux compared to the original fit. A power-law fit (red dotted curve) with , where and Abramowski:2010kg , is shown for comparison. Although the EBL-F and EBL-I fits to the observe data are similar, for GeV and TeV we can see a difference in their behavior. Also both these fits are different from the power-law fit.
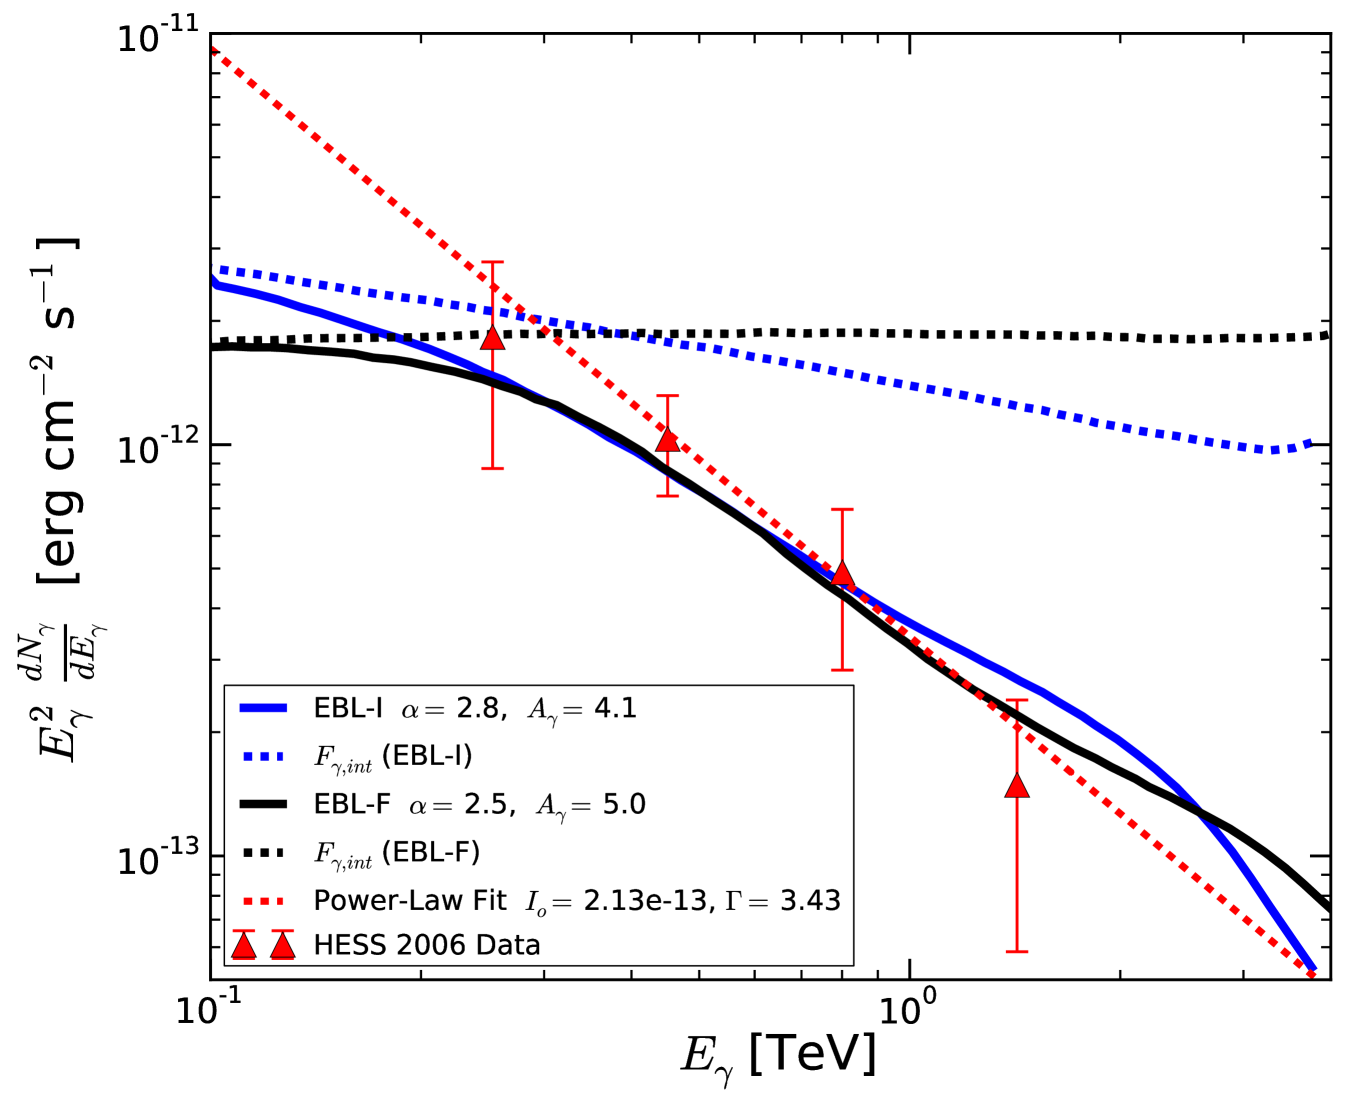
We have also fitted the 2005 and 2006 data using the EBL-F (black curve), EBL-I (blue curve) and a power-law (red dotted curve) for comparison in Figs. 9 and 10 respectively. Due to low photon statistics of 2007 observation, no spectrum was generated. In EBL-F good fits are obtained for same but for 2005 data and for 2006 data respectively. Similarly for EBL-I good fits are obtained for same but for 2005 data and for 2006 data respectively. The same value of for a particular model and data of different periods clearly shows that same acceleration mechanism is involved to accelerate the protons for the observed VHE -rays from 2004 to 2006. The power-law fits to 2005 and 2006 data have similar behavior as the photohadronic fits in the observed energy range.
There is no way to directly measure the photon density in the inner compact region in the observed VHE ranges. Nonetheless, by assuming the scaling behavior of the photon densities for different energies in the inner and the outer jets as shown in Eq.(1), we relate the unknown densities of the inner region with the known one in the outer region. In the outer jet this range of lies in the low energy tail region of the SSC band and the sensitivity of the currently operating -ray detectors are not good enough to detect these photons.
The hidden jet has a size cm and here we take cm. Also by assuming the central black hole has a mass of and using the constraint on the highest energy proton flux and the maximum luminosity of the inner jet to be smaller than the Eddington luminosity, the optical depth satisfies . For our estimate we take which gives the photon density in the inner jet region .
IV.2 1ES 1101-232
The HBL 1ES 1101-232 resides in an elliptical host galaxy at a redshift of z = 0.186Remillard:1989 ; Falomo:1994a . The radio maps of this HBL show an one-sided, not well-collimated jet structure at a few kpc distance from the coreLaurent:1993 . In 2004 and 2005, 1ES 1101-232 was observed by the HESS telescopes and following the detection of a weak signal in its observations, an extended multifrequency campaign was organized for 11 nights in March 2005 to study the multiwavelength emission and to look for possible correlated variability in different wavebandsAharonian:2005gh . The exposure time for VHE observation was approximately 43 hours. Also simultaneous observations were carried out in X-rays by RXTE, and in optical with ROTSE 3c robotic telescope. However, there were no simultaneous observation in GeV energy range. But, the analysis of 3.5 years data collected from August 2008 to February 2012 by Fermi-LAT reported the observation of GeV emission from this object Finke:2013tyq . From the simultaneous observations in optical, X-rays and VHE -rays, Aharonian et al. constructed a truly simultaneous SED of 1ES 1101-232. In 2006 May and July, Suzaku observed this HBL in X-rays which was also quasi-simultaneously observed with HESS and MAGIC telescopes and no significant variability was observed neither in X-rays nor in -raysAharonian:2007nq . In fact during this observation period it was found in a quiescent state with the lowest X-ray flux ever measured. The multiwavelength observation of the blazar 1ES 1101-232 during the flaring in 2004-2005 is used to constructed the synchrotron and SSC SED using one zone leptonic modelAharonian:2007nq ; Costamante:2006pm and the parameters for the best fit are given in Table-1. For our calculation we shall use these parameters.
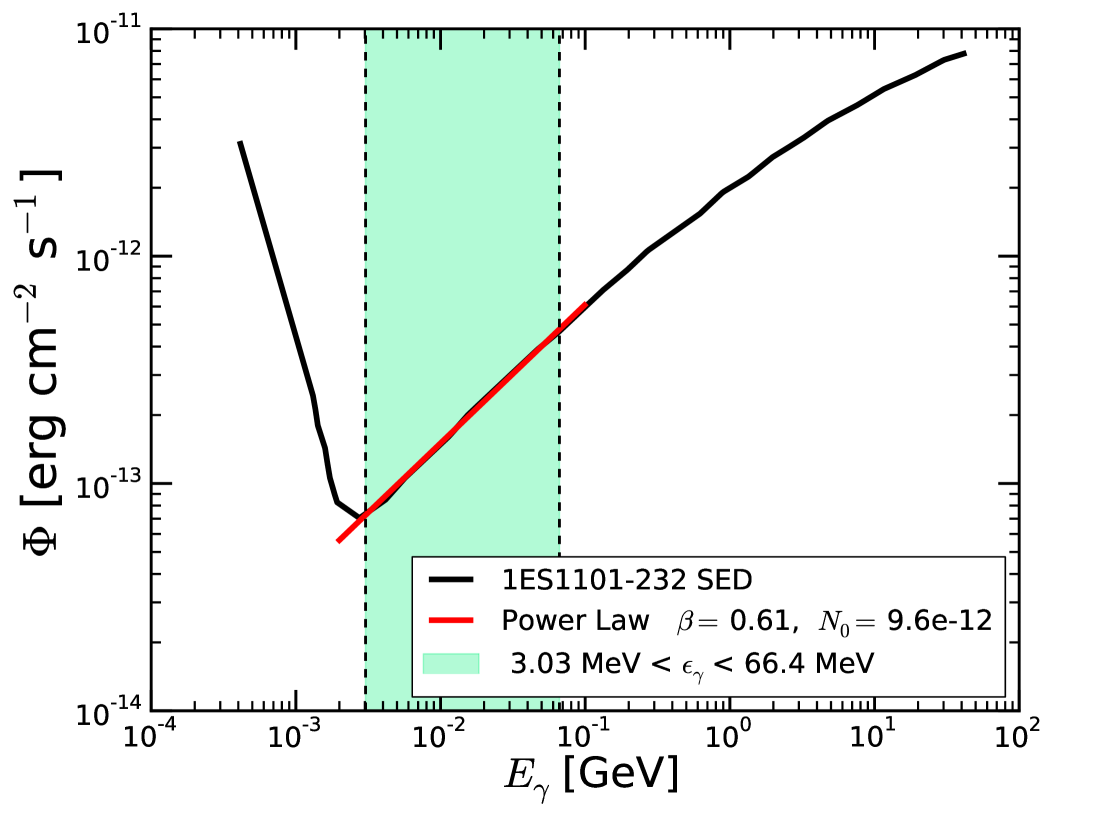
The observed VHE flare of 1ES 1101-232 was in the energy range . This corresponds to seed photon energy range in the inner jet region, where the Fermi accelerated protons in the energy range collide to produce -rays and neutrinos through intermediate -resonance and pions. This range of corresponds to the low energy tail of the SSC band. In the energy range we observed that the SSC flux can be fitted with a power-law (red line) given as which is shown in Fig. 11.
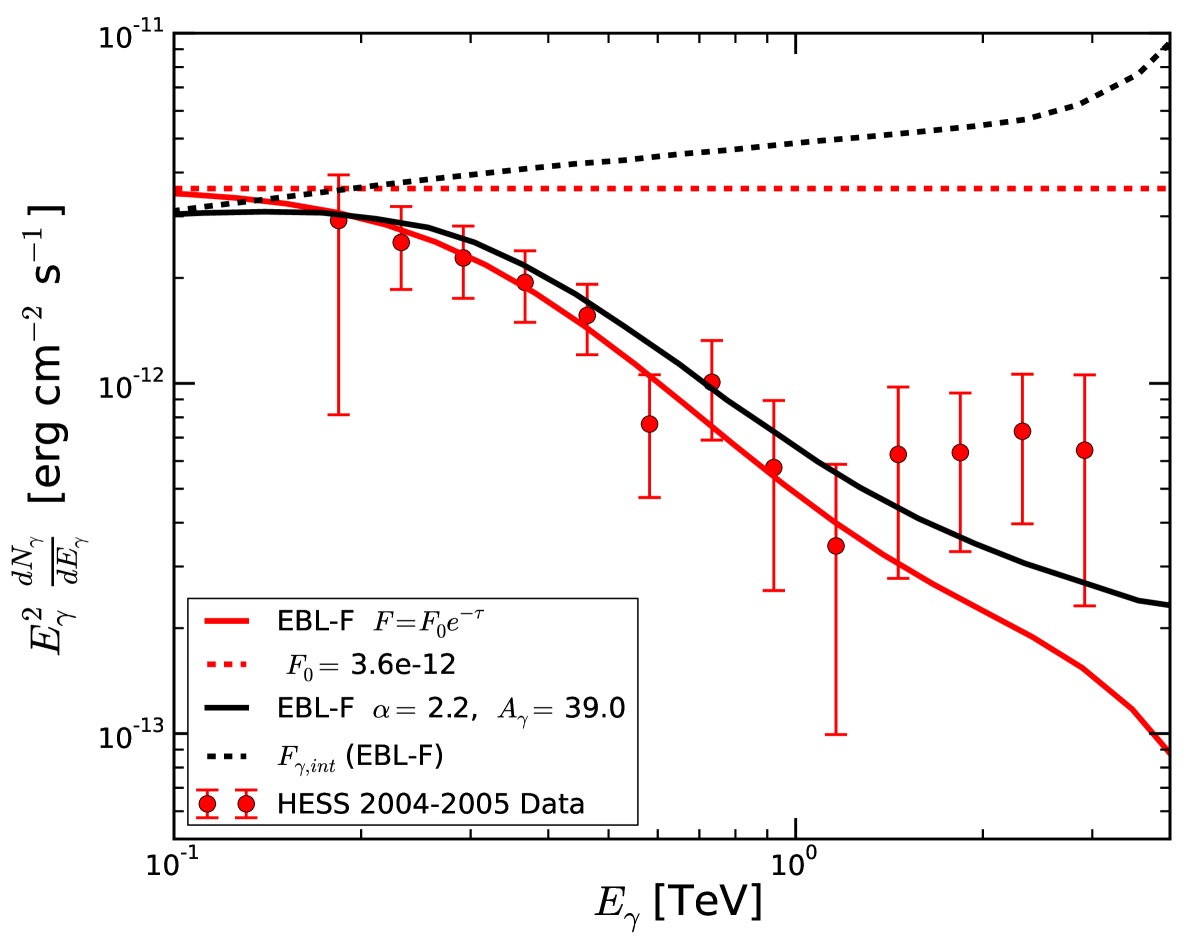
In Fig. 12, we rescale the attenuation factor of EBL-F by to fit the observed VHE data (red curve). It shows that the rescaling can’t fit the VHE data above 1.5 TeV. However, a good fit to the VHE flare data is obtained for and in the photohadronic model with EBL-F (black curve ) correction and this corresponds to an intrinsic spectrum with .
Again by multiplying to the attenuation factor of EBL-I we can fit well the observed data below 1 TeV. However, above 1 TeV the fitted curve differs from the observed data as shown in Fig. 13 (red curve). In the same figure we have also shown the photohadronic model with the EBL-I correction fit (blue curve) to the observed data for and . The photohadronic fit almost coincides with the rescaling of the attenuation factor and having which is softer than the one by EBL-F.
In Fig. 14, we have compared all these models and the fit of ref.Aharonian:2005gh . Rescaling the originally normalized EBL by 40% (P0.4, red curve), Aharonian et al. could fit the data well which is shown in the figure. At the same time the photohadronic model accompanied by EBL-F (black curve) and EBL-I (blue curve) also fit the data well. But all these three fits behave differently in the high energy regime. While the fit in ref.Aharonian:2005gh slightly increases beyond TeV, the EBL-I predict a drop in the flux above this energy limit and EBL-F flux is relatively shallow. Even though the overall fit to the observed data by different models are similar, their corresponding intrinsic fluxes behave differently. The fit by Aharonian et al. gives the intrinsic spectral index which is hard (red dotted curve). However, in the photohadronic model with EBL-F we have and with EBL-I it gives . So the photohadronic scenario gives milder intrinsic spectral index compared to the one by ref. Aharonian:2005gh in their original fit.
In 1ES 1101-232, the BH process will produce leptons with energies below TeV and synchrotron emission from these electrons and positrons in G magnetic field in the inner jet region will produce synchrotron photons below 3 MeV energy range. Thus, these photons will not contribute for the enhancement of the photon flux in the low energy tail region of the SSC band.
We have also calculated the photon density in the inner jet region. For this we have taken the central black hole mass and the inner jet region has a size cm. Using the constraint on the highest energy proton flux and the maximum luminosity of the inner jet to be smaller than the Eddington luminosity we get . We take which gives in the inner jet region.
V Summary
The multi-TeV emission from the HBLs H 2356-309 and 1ES 1101-232 were observed by HESS telescopes during 2004 to 2007. For the first time, the VHE observation from H 2356-309 in 2004 and in 2004-2005 from 1ES 1101-232 were analyzed by Aharonian et al.Aharonian:2005gh to derive strong upper limits on the EBL which was found to be consistent with the lower limits from the integrated light of resolved galaxies. While the intrinsic spectrum of H 2356-309 found to be flat, for 1ES 1101-232 it was hard . Here we have used the photohadronic model accompanied by two template EBL models EBL-F and EBL-I to fit the observed VHE data from these two HBLs and to predict their intrinsic spectra. Although the blazar jet environment plays an important role in attenuating the VHE -rays, the absorption of it within the jet is neglected by assuming that the intrinsic flux takes care of this extraneous effect.
An important ingredient for the photohadronic scenario is the SSC flux . From the simultaneous multi-wavelength observations of these HBLs, one-zone leptonic models are constructed to fit the observed data well and the resulting parameters and are used here for the analysis of our results. In the photohadronic model the intrinsic flux and the power index is fixed for a given leptonic model. So the proton spectral index is the only free parameter here.
A good fit for the 2004 corrected VHE spectrum of H 2356-309 is achieved by photohadronic model with the EBL correction from EBL-F and EBL-I. However, the intrinsic spectrum is different for each EBL model. While the EBL-F correction gives a flat intrinsic spectrum, a softer intrinsic spectrum is obtained with the EBL-I correction. The same spectral index of the respective EBL model but different normalization can fit the VHE spectra of 2005 and 2006 well.
The multi-TeV spectrum of 1ES 1101-232 is also fitted using the EBL-F and EBL-I and compared with the original fit by Aharonian et al. The overall fit to the observed VHE SED by all these models are similar but their corresponding intrinsic spectra are different. The of the EBL-I is softer then the EBL-F which is again softer than the fit by ref. Aharonian:2005gh . In future, for a better understanding of the EBL effect and the role played by the SSC photons on the VHE -ray flux from intermediate to high redshift blazars, it is necessary to have simultaneous observations in multi-wavelength to the flaring objects and to accurately model the low energy SSC tail region.
We thank D. Khangulyan, Yoshiyuki Inoue, Susumu Inoue, Vladimir L. Yáñez, M. V. Barkov and Haoning He for many useful discussions. S.S. is a Japan Society for the Promotion of Science (JSPS) invitational fellow. The work of S. S. is partially supported by DGAPA-UNAM (Mexico) Project No. IN110815 and PASPA-DGAPA, UNAM. This work is partially supported by RIKEN, iTHEMS & iTHES Program and also by Mitsubishi Foundation.
References
- (1) F. W. Stecker, O. C. de Jager and M. H. Salamon, Astrophys. J. 390, L49 (1992). doi:10.1086/186369
- (2) M. G. Hauser and E. Dwek, Ann. Rev. Astron. Astrophys. 39, 249 (2001) doi:10.1146/annurev.astro.39.1.249 [astro-ph/0105539].
- (3) S. Archambault et al., Astron. J. 151, 142 (2016) doi:10.3847/0004-6256/151/6/142 [arXiv:1603.02410 [astro-ph.HE]].
- (4) A. Abramowski et al. [H.E.S.S. Collaboration], Astron. Astrophys. 550, A4 (2013) doi:10.1051/0004-6361/201220355 [arXiv:1212.3409 [astro-ph.HE]].
- (5) A. Moralejo Olaizola et al. [MAGIC Collaboration], PoS ICRC 2017, 604 (2017) [arXiv:1709.02238 [astro-ph.HE]].
- (6) A. U. Abeysekara et al. [VERITAS and SPOL and ASAS-SN and OVRO and NuSTAR and CRTS Collaborations], Astrophys. J. 815, no. 2, L22 (2015) doi:10.1088/2041-8205/815/2/L22
- (7) H. Abdalla et al. [H.E.S.S. Collaboration], Astron. Astrophys. 606, A59 (2017) doi:10.1051/0004-6361/201731200
- (8) C. Romoli et al. [H.E.S.S. Collaboration], PoS ICRC 2017, 605 (2017) [arXiv:1708.01153 [astro-ph.HE]].
- (9) M. L. Ahnen et al. [MAGIC and Fermi-LAT Collaborations], Astrophys. J. 815, no. 2, L23 (2015) doi:10.1088/2041-8205/815/2/L23 [arXiv:1512.04435 [astro-ph.GA]].
- (10) M. L. Ahnen et al., Astron. Astrophys. 590, A24 (2016) doi:10.1051/0004-6361/201527256 [arXiv:1602.05239 [astro-ph.HE]].
- (11) K. Katarzynski and G. Ghisellini, Astron. Astrophys. 463, 529 (2007) doi:10.1051/0004-6361:20066448 [astro-ph/0610801].
- (12) G. Fossati, L. Maraschi, A. Celotti, A. Comastri and G. Ghisellini, Mon. Not. Roy. Astron. Soc. 299, 433 (1998) doi:10.1046/j.1365-8711.1998.01828.x [astro-ph/9804103].
- (13) G. Ghisellini, A. Celotti, G. Fossati, L. Maraschi and A. Comastri, Mon. Not. Roy. Astron. Soc. 301, 451 (1998) doi:10.1046/j.1365-8711.1998.02032.x [astro-ph/9807317].
- (14) P. Roustazadeh and M. Böttcher Astrophys. J. 728, 134 (2011) doi:10.1088/0004-637X/728/2/134 [arXiv:1012.3923 [astro-ph.HE]].
- (15) F. Aharonian et al. [H.E.S.S. Collaboration], Nature 440, 1018 (2006) doi:10.1038/nature04680 [astro-ph/0508073].
- (16) F. Aharonian [HEGRA Collaboration], Astron. Astrophys. 349, 11 (1999) [astro-ph/9903386].
- (17) F. Krennrich et al., Astrophys. J. 575, L9 (2002) doi:10.1086/342700 [astro-ph/0207184].
- (18) A. Djannati-Atai et al., Astron. Astrophys. 350, 17 (1999) [astro-ph/9906060].
- (19) S. Sahu, L. S. Miranda and S. Rajpoot, Eur. Phys. J. C 76, no. 3, 127 (2016) doi:10.1140/epjc/s10052-016-3975-2 [arXiv:1501.00973 [astro-ph.HE]].
- (20) S. Sahu, A. R. de León and L. S. Miranda, Eur. Phys. J. C 77, no. 11, 741 (2017) doi:10.1140/epjc/s10052-017-5335-2 [arXiv:1610.01709 [astro-ph.HE]].
- (21) F. A. Aharonian, astro-ph/0112314.
- (22) F. Aharonian et al. [H.E.S.S. Collaboration], Astron. Astrophys. 475, L9 (2007) doi:10.1051/0004-6361:20078462 [arXiv:0709.4584 [astro-ph]].
- (23) A. Neronov, D. V. Semikoz and A. M. Taylor, Astron. Astrophys. 541, A31 (2012) doi:10.1051/0004-6361/201117083 [arXiv:1104.2801 [astro-ph.HE]].
- (24) A. Abramowski et al. [H.E.S.S. Collaboration], Astron. Astrophys. 538, A103 (2012) doi:10.1051/0004-6361/201118406 [arXiv:1201.2044 [astro-ph.HE]].
- (25) M. Cerruti, A. Zech, C. Boisson and S. Inoue, Mon. Not. Roy. Astron. Soc. 448, no. 1, 910 (2015) doi:10.1093/mnras/stu2691 [arXiv:1411.5968 [astro-ph.HE]].
- (26) W. Essey, O. Kalashev, A. Kusenko and J. F. Beacom, Astrophys. J. 731, 51 (2011) doi:10.1088/0004-637X/731/1/51 [arXiv:1011.6340 [astro-ph.HE]].
- (27) G. Cao and J. Wang, Astrophys. J. 783, 108 (2014) doi:10.1088/0004-637X/783/2/108 [arXiv:1401.3970 [astro-ph.HE]].
- (28) G. Ghisellini, F. Tavecchio and M. Chiaberge, Astron. Astrophys. 432, 401 (2005) doi:10.1051/0004-6361:20041404 [astro-ph/0406093].
- (29) F. Tavecchio and G. Ghisellini, Mon. Not. Roy. Astron. Soc. 385, 98 (2008) doi:10.1111/j.1745-3933.2008.00441.x [arXiv:0801.0593 [astro-ph]].
- (30) S. Sahu, A. F. Osorio Oliveros and J. C. Sanabria, Phys. Rev. D 87, no. 10, 103015 (2013) doi:10.1103/PhysRevD.87.103015 [arXiv:1305.4985 [hep-ph]].
- (31) A. Franceschini, G. Rodighiero and M. Vaccari, Astron. Astrophys. 487, 837 (2008) doi:10.1051/0004-6361:200809691 [arXiv:0805.1841 [astro-ph]].
- (32) Y. Inoue, S. Inoue, M. A. R. Kobayashi, R. Makiya, Y. Niino and T. Totani, Astrophys. J. 768, 197 (2013) doi:10.1088/0004-637X/768/2/197 [arXiv:1212.1683 [astro-ph.CO]].
- (33) T. M. Kneiske, K. Mannheim and D. H. Hartmann, Astron. Astrophys. 386, 1 (2002) doi:10.1051/0004-6361:20020211 [astro-ph/0202104].
- (34) F. W. Stecker, M. A. Malkan and S. T. Scully, Astrophys. J. 648, 774 (2006) doi:10.1086/506188 [astro-ph/0510449].
- (35) A. Dominguez et al., Mon. Not. Roy. Astron. Soc. 410, 2556 (2011) doi:10.1111/j.1365-2966.2010.17631.x [arXiv:1007.1459 [astro-ph.CO]].
- (36) M. Orr, F. Krennrich and E. Dwek, Astrophys. J. 733, 77 (2011) doi:10.1088/0004-637X/733/2/77 [arXiv:1101.3498 [astro-ph.CO]].
- (37) J. R. Primack, J. S. Bullock and R. S. Somerville, AIP Conf. Proc. 745, 23 (2005) doi:10.1063/1.1878394 [astro-ph/0502177].
- (38) S. Sahu and E. Palacios, Eur. Phys. J. C 75, no. 2, 52 (2015) doi:10.1140/epjc/s10052-015-3286-z [arXiv:1310.1381 [astro-ph.HE]].
- (39) A. A. Zdziarski and M. Böttcher, Mon. Not. Roy. Astron. Soc. 450, no. 1, L21 (2015) doi:10.1093/mnrasl/slv039 [arXiv:1501.06124 [astro-ph.HE]].
- (40) P. Pjanka, A. A. Zdziarski and M. Sikora, Mon. Not. Roy. Astron. Soc. 465, no. 3, 3506 (2017) doi:10.1093/mnras/stw2960 [arXiv:1607.08895 [astro-ph.HE]].
- (41) A. Abramowski et al. [H.E.S.S. Collaboration], Astron. Astrophys. 516, A56 (2010) doi:10.1051/0004-6361/201014321 [arXiv:1004.2089 [astro-ph.HE]].
- (42) L. Costamante [H.E.S.S. Collaboration], Astrophys. Space Sci. 309, 487 (2007) doi:10.1007/s10509-007-9418-7 [astro-ph/0612709].
- (43) R. Falomo, AJ, 101, 821 (1991).
- (44) W. Forman, C. Jones, L. Cominsky, et al. APJS, 38, 357 (1978).
- (45) K. S. Wood, J. F. Meekins, D. J. Yentis, et al. APJS, 56, 507 (1984).
- (46) D. A. Schwartz, R. J. V. Brissenden et al., in Lecture Notes in Physics, Berlin Springer Verlag, Vol. 334, 207, BL Lac Objects, ed. L. Maraschi, T. Maccacaro,M. -H. Ulrich.
- (47) F. Aharonian et al. [H.E.S.S. Collaboration], Astron. Astrophys. 455, 461 (2006) doi:10.1051/0004-6361:20054732 [astro-ph/0607569].
- (48) L. Costamante, arXiv:1208.0808 [astro-ph.HE].
- (49) M. Petropoulou and A. Mastichiadis, Mon. Not. Roy. Astron. Soc. 447, no. 1, 36 (2015) doi:10.1093/mnras/stu2364 [arXiv:1411.1908 [astro-ph.HE]].
- (50) M. Petropoulou, S. Dimitrakoudis, P. Padovani, A. Mastichiadis and E. Resconi, Mon. Not. Roy. Astron. Soc. 448, no. 3, 2412 (2015) doi:10.1093/mnras/stv179 [arXiv:1501.07115 [astro-ph.HE]].
- (51) R. A. Remillard,I. R. Tuohy and R. J. V. Brissenden, et al. Astrophys. J. 345, 140 (1989).
- (52) R. Falomo, R. Scarpa and M. Bersanelli, APJS 93, 1251 (1994).
- (53) S. A. Laurent-Muehleisen, R. I. Kollgaard, G. A. Moellenbrock and E. D. Feigelson, AJ 106, 875 (1993).
- (54) J. Finke et al. [Fermi-LAT Collaboration], eConf C 121028, 365 (2012) [arXiv:1303.5093 [astro-ph.HE]].
- (55) F. Aharonian [H.E.S.S. Collaboration], Astron. Astrophys. 470, 475 (2007) doi:10.1051/0004-6361:20077057 [arXiv:0705.2946 [astro-ph]].