Anomalous magnetic and spin glass behavior in Nb substituted LaCo1-xNbxO3
Abstract
We report the structural, magnetic, transport and electronic properties of Nb substituted LaCo1-xNbxO3 ( 0–0.2). The Rietveld analysis of x-ray diffraction data demonstrate structural phase transitions from rhombohedral to orthorhombic and further to monoclinic with increasing the Nb concentration up to 0.2. Interestingly, we observed dramatic changes in the magnetization (M) with increasing the Nb concentration, as the M sharply increases below 10 K even at 2.5% substitution. Furthermore, ac susceptibility data show the spin-glass behavior in 0.1 sample. We find that the density of states near the Fermi level decreases and the activation energy increases, which results in the decreasing conductivity with higher Nb concentration. A significant shift in the peak position of A2g phonon mode has been observed using Raman spectroscopy, which indicates the change in the coupling due to the structural distortion with Nb substitution. The core-level photoemission study confirms that the Nb is present in 5+ valence state. Our study reveals that the nonmagnetic Nb5+ () substitution converts Co3+ ions to Co2+ and stabilize both in the high-spin state. Our results suggest that structural and spin-state transitions as well as the difference in the ionic radii between Nb5+ and Co3+ are playing an important role in tuning the physical properties.
PACS: 75.60.Ej, 75.60.Tt, 75.75.Cd, 75.70.Rf, 79.60.–i
I Introduction
The rare-earth cobaltite LaCoO3 exhibit unusual magnetic and electronic phase transitions, which can be tuned by changing the temperature, pressure RaccahPRB67 ; VogtPRB03 ; LengsdorfPRB04 ; VankoPRB06 ; LengsdorfPRB07 ; KozlenkoPRB07 as well as with chemical substitutions at the La/Co site VasquezPRB96 ; KrienerPRB04 ; HammerPRB04 ; BaierPRB05 ; KreinerPRB09 ; SatoJPSJ14 ; StreltsovJPCM16 ; KarpinskyJPCM16 ; SerranoJPDAP08 ; YoshiPRB03 . The 3 orbitals of the Co3+ ion, surrounded with octahedrally coordinated O2- ions, are split into the t2g (triply degenerate) and the eg (doubly degenerate) orbitals in the lower and upper energy levels, respectively. The low temperature ground state is nonmagnetic (S=0) insulating nature with Co3+ ions being in the low spin (LS) state configuration (3d6; te) ZhuangPRB98 . However, with increasing temperature, the magnetic susceptibility () shows two prominent features/transitions at around 90 K and 500 K ZobelPRB02 ; PodlesnyakPRB06 ; EnglishPRB02 . The nonmagnetic to paramagnetic transition at 90 K is believed to be due to the change in the spin state of Co ions from LS to high spin state [HS; te (S=2)] or intermediate spin state [IS; te (S=1)] or both mixed in a certain ratio EnglishPRB02 ; KorotinPRB96 ; RaccahJAP68 ; IshikawaPRL04 ; YamaguchiPRB97 ; SaitohPRB97 ; HaverkortPRL06 ; KliePRL07 . The multiple spin states of Co ions (i.e. the change in the relative populations of t2g and eg levels) are due to the competition between the crystal field splitting and the intra-atomic Hund’s exchange energy RaccahPRB67 ; SenarisJSSC95 ; CaciuffoPRB99 ; AsaiPRB89 . Note that the energy difference between these energies is rather small and the crystal field splitting energy strongly depends on the Co-O bond length, which leads to the unusual magnetic behavior in doped LaCoO3 FitaPRB05 . The feature near 500 K is ascribed to an insulator to metal transition TokuraPRB98 , where the electrical conductivity increases by two orders of magnitude. Interestingly, these transitions are strongly affected by substituting alkali-earth elements at La site and transition metal elements at Co site VasquezPRB96 ; KrienerPRB04 ; HammerPRB04 ; BaierPRB05 ; KreinerPRB09 . For example, a well established case is the observation of a spin-cluster-glass insulator to ferromagnetic metal transition at about 20% concentration of Sr in bulk La1-xSrxCoO3 WuPRB03 . Recently, we reported that Sr/Ca substitution (i.e. hole doping) in LaCoO3 nanoparticles establish the IS/LS states of Co3+/Co4+ and observed significant enhancement in the magnetization Ravi17 . Here, the double exchange interactions between Co3+ and Co4+ are playing an important role in controlling the magnetic/spin-state transitions. Also, the layered cobaltites La2-xSrxCoO4 (containing both Co2+ and Co3+) are very interesting to understand the role of different spin as well as valence states of Co ions in controlling the magnetic, transport and electronic properties Hollmann ; WuPRB10 ; ChangPRL09 ; CwikPRL09 ; BabkevichPRB10 ; TealdiPRB10 ; LiSR16 . For example, it has been reported that the Co2+ present mostly in HS state, whereas different spin-states are possible in Co3+ ChangPRL09 ; CwikPRL09 . The magnetic susceptibility behavior also indicate the presence of the Co2+ ions in HS state and a possibility of magnetic ordering between Co2+ and Co3+ ions Hollmann .
In this context, the substitution of 3 elements at the Co site in LaCoO3 affects the spin state of nearby Co3+ and exhibit various anomalous behaviors in the magnetic and transport properties TomiyasuPRB13 ; HammerPRB04 ; ViswanathanPRB09 ; Vinod14 ; Vinod13 ; RajeevanJMMM15 ; BullPRB16 . In LaCo1-xNi1-yO3, where the end members are a insulator (LaCoO3) and a paramagnetic metal (LaNiO3), a metal to insulator transition was observed at about 40% Ni substitution HammerPRB04 ; RajeevPRB92 . Moreover, magnetization and neutron diffraction studies observed the presence of spin glass and long-range ordered ferromagnetic correlation at low temperatures HammerPRB04 ; ViswanathanPRB09 ; Vinod14 ; Vinod13 ; RajeevanJMMM15 . However, a recent study on highly metelllic LaNiO3 single crystals by Li et al. revealed antiferromagnetic ordering in magnetization, specific heat and neutron scattering experiments LiNC18 , which is in contrast with another report in ZhangCGD . In case of LaCo1-xMnxO3, where LaMnO3 is antiferromagnetic insulator and crystallizes in an orthorhombic structure, detailed magnetization and neutron diffraction studies suggest the ferromagnetic/glassy nature and structural transition with Mn concentration BullPRB16 . Another interesting case is the substitution of 4 elements like nonmagnetic Rh3+, which is isoelectronic to Co3+ and therefore, no charge transfer is expected KnizekPRB12 ; AsaiJPSJ ; GuoPRB16 . Also, the 4 orbitals are much more extended than 3 orbitals, which results in the decreasing the correlation. It is reported that Rh3+ substitution stabilizes the HS state of Co3+ in LaCo1-xRhxO3 where the driving forces are the elastic and electronic interactions associated with the larger ionic radii and the unfilled 4 shell of Rh3+ cation KnizekPRB12 . Asai et al., observed the ferromagnetic ordering below 15 K in the range of 10 to 40% Rh concentration AsaiJPSJ . The authors suggested that in this case the magnetic ordering is driven only by Co3+ ions AsaiJPSJ . This is different from the metallic ferromagnetic state of La1-xSrxCoO3, which is due to the mixed valence of Co3+ and Co4+ ions WuPRB03 . On the other hand, Guo et al., did not observe signature of long range magnetic ordering till 4 K, but suggest a spin glass ground state in LaCo1-xRhxO3 GuoPRB16 .
Despite many theoretical and experimental investigations, the discussions on the nature of magnetic/spin-state transitions with chemical substitutions and their origin are still controversial. In fact Motohashi et al. observed both the ferromagnetic and spin glass states and the competition between them in SrCo1-xNbxO3-δ MotohashiPRB05 ; MotohashiAPL05 . Therefore, it is vital to further investigate the physical properties with substituting 4 elements, which introduces itinerant electrons into the system. Recently, Oygarden et al., reported the structural transition from rhombohedral to orthorhombic/monoclinic and reduction in the electrical conductivity with Nb substitution in LaCo1-xNbxO3, which are discussed in terms of spin state of Co ion Oygarden . They show that as the valence state of Co ion is 3+ in LaCoO3, the charge balance with Nb substitution is by converting Co3+ to Co2+ where the chemical formula can be expressed as LaCoCoNbO3 i.e. Co is completely reduced to Co2+ for 0.33 sample Oygarden . Also, the ionic radius of Nb5+ (0.64 Å )/Co2+ [0.65 Å in LS (S = 0.5) and 0.745 Å in HS (S = 1.5)] is larger than that of the Co3+ (0.545 Å in LS, 0.56 Å in IS and 0.61 Å in HS) ions, which results increasing the average radius at the Co position and induce the lattice expansion Oygarden . Interestingly, the simultaneous substitution of Sr and Nb in LaCoO3 prevent the creation of Co4+ and it is reported that exchange interactions between IS/HS Co3+ can induce ferromagnetism SikolenkoJPCM09 ; Troyanchuk .
In order to understand the role of Co valence state for achieving the ferromagnetism, spin glass and spin-state transition in LaCoO3, we study the structural, magnetic, transport and electronic properties of nonmagnetic Nb5+ () substituted LaCo1-xNbxO3. The Rietveld refinements of XRD data clearly indicate the structural phase transition for 0.1 samples. More interestingly, we observed dramatic changes in the magnetization for Nb concentration as low as 2.5%. Furthermore, the spin glass behavior has been observed for 0.1 sample. Our resistivity measurements show the strong insulating nature with increasing Nb concentration. The XPS study confirms that the Nb is present in 5+ valence state. We find that nonmagnetic Nb5+ substitution converts Co3+ ions to Co2+ and stabilize in the high-spin state. We discuss the possible role of spin-state transition and the difference in the ionic radii between Nb5+ and Co3+/Co2+.
II Experimental Details
The polycrystalline samples of LaCo1-xNbxO3 were synthesized by the conventional solid state reaction method. The starting materials Co3O4 (99.99% Alfa) and Nb2O5 (99.9% Sigma) were used as received, without further purification. But, the La2O3 (99.9% Sigma) powder was dried prior to use at 7000C for 12 hrs due to its hygroscopic nature. The stoichiometric amount of starting materials were thoroughly mixed with the help of mortar-pestle and reacted at 9000C for 8 hour in air, calcined powder was pressed into pellets at 2000 psi with a hydraulic press and sintered in air at 12000C for the 24 hrs, in case of substituted samples temperature profile was 11000C for 12 hrs followed by 14750C for 6 hrs Oygarden .
The powder x-ray diffraction (XRD) data were collected with CuK radiation (1.5406 Å) from Panalytical X-ray diffractometer, we analyzed the XRD data by Rietveld refinement using FullProf package and the background was fitted using linear interpolation between the data points. The magnetic and transport measurements were performed with physical property measurement system (PPMS) from Quantum design, USA. A commercial electron energy analyzer (PHOIBOS 150 from Specs GmbH, Germany) and a non-monochromatic AlK x-ray source (h = 1486.6 eV of line width 0.9 eV) used for XPS measurements with the base pressure in the range of 10-10 mbar. We analyzed the core-level spectra after subtracting an inelastic Tougaard background. AC susceptibility measurements were performed with Magnetic property measurement system (MPMS) from Quantum design, USA. The Raman measurements were carried out in backscattering geometry using a Renishaw inviaconfocal Raman microscope using unpolarized laser of 514 nm and 785 nm excitation wavelength, 2400 lines per mm grating and 0.2 mW laser power at room temperature.
III Results and Discussion
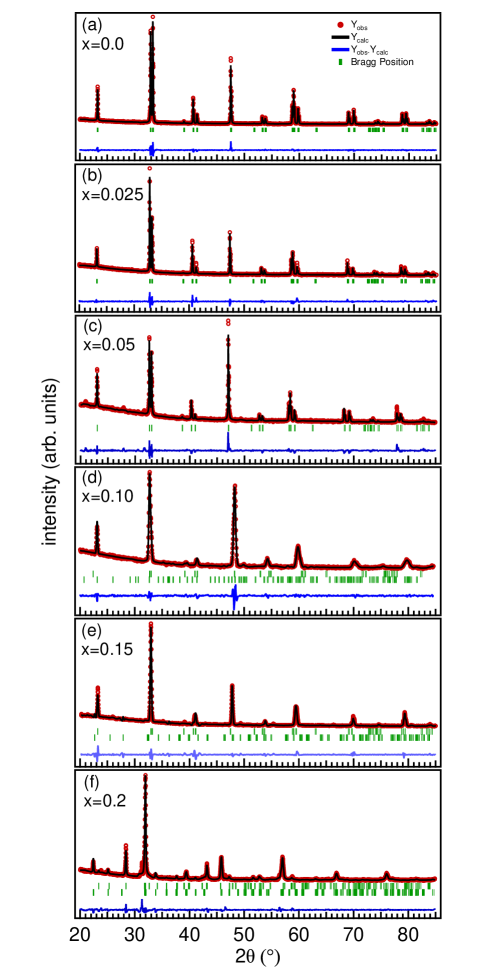
In Figs. 1(a–f), we show the room temperature powder x-ray diffraction data of LaCo1-xNbxO3 ( 0 – 0.2) with increasing Nb concentration. The Rietveld refinements confirm the rhombohedral structure (space group Rc) for 0, 0.025 and 0.05 samples, as shown in panels (a, b, c) of Fig. 1. We set the background with linear polynomial during the Rietveld refinements. With further increasing Nb concentration, the XRD patterns could not be fitted with only rhombohedral phase. Therefore, we have added the orthorhombic phase (space group Pbnm) for 0.1 and 0.15 samples, which produce the fitting of the data well. Further, we have quantified the contribution of orthorhombic phase and observed the ratio of about Rc:Pbnm = 74:26 and 58:42 in 0.1 and 0.15 samples, respectively. With further increasing the Nb concentration, we observed a monoclinic distortion as the XRD pattern of 0.2 sample can be fitted with orthorhombic and monoclinic phases in the ratio of Pbnm:P21/n = 62:38. Also, we observed a shift in the peak position (2 32.8) towards the lower 2 side with higher Nb content, which indicates the increment in the interplanar spacing as 1/. Our analysis clearly reveals the first-order structural phase transition with Nb substitution, and the coexistence of two phases at 0.1 is in agreement with ref. Oygarden . The possibility for this transformation can be thought as, due to the difference between the ionic radii of Nb5+/Co2+ and Co3+. Thus due to larger ionic radii of Nb5+/Co2+, the Goldschmidt tolerance factor t decreases with Nb substitution and the volume of octahedra around B site increases, which results in the structural phase transition from rhombohedral to orthorhombic and then to monoclinic with higher Nb concentration Oygarden . This is also consistent with a recent study by Guo et al., which report that the larger size Rh3+ (0.665 Å) substitution at Co cite, rapidly stabilizes the Pbnm (orthorhombic) structure GuoPRB16 . Furthermore, for 0 sample, the calculated Co–O–Co bond-angle is found to be 162.1o, and six Co–O bonds, two La–Co bonds and other six La–Co bonds are with average length of 1.936 , 3.273 , and 3.326 , respectively. Also, there are six Co–Co bonds at average length 3.825 , these parameters are in good agreement with reported values KnizekPRB05 ; PandeyJPCM06 . The pseudocubic (pc) lattice parameters, which are calculated using apc=a/, bpc=b/, cpc=c/ for Rc, and cpc=c/2 for Pbnm and P21/n, and unit cell volume are presented in table I. We note that the bond-angle and cell volume are increasing up to 0.05 and then the bond-angle decreases for 0.1 and 0.15 samples where refinement has been performed with two space groups (rhombohedral and orthorhombic) MartiJPCM94 . The Rietveld analysis of all the samples show good quality of fitting and the refined parameters (including bond-angle and average bond length) of LaCo1-xNbxO3 ( 0 – 0.2) are summarized in table I.
| a (Å) | b (Å) | c (Å) | space group | Co-O(Å) | Co–O–Co | La-Co(Å) | La-Co(Å) | Co-Co(Å) | apc | bpc | cpc | Vpc | ||
| (wt) | 6 | 2 | 6 | 6 | (Å) | (Å) | (Å) | (Å3) | ||||||
| 0 | 1.75 | 5.442 | 5.442 | 13.090 | Rc–100% | 1.936 | 162.1 | 3.273 | 3.326 | 3.825 | 3.848 | 3.848 | 3.779 | 56.0 |
| 0.025 | 1.72 | 5.454 | 5.454 | 13.117 | Rc–100% | 1.921 | 172.4 | 3.279 | 3.333 | 3.833 | 3.857 | 3.857 | 3.885 | 56.3 |
| 0.05 | 2.32 | 5.493 | 5.493 | 13.214 | Rc–100% | 1.934 | 173.8 | 3.304 | 3.357 | 3.861 | 3.885 | 3.885 | 3.815 | 57.6 |
| 0.10 | 2.2 | 5.132 | 5.132 | 12.439 | Rc–74% | 1.816 | 169.6 | 3.11 | 3.139 | 3.616 | 3.630 | 3.630 | 3.59 | 47.3 |
| 5.451 | 5.698 | 7.747 | Pbnm–26% | – | – | – | – | – | 3.855 | 4.029 | 3.874 | 60.2 | ||
| 0.15 | 2.85 | 5.436 | 5.436 | 13.172 | Rc–58% | 1.927 | 157.2 | 3.216 | 3.289 | 3.777 | 3.845 | 3.845 | 3.803 | 56.3 |
| 5.543 | 5.504 | 7.845 | Pbnm–42% | – | – | – | – | – | 3.920 | 3.893 | 3.923 | 59.9 | ||
| 0.20 | 2.35 | 5.604 | 5.633 | 7.599 | Pbnm–62% | – | – | – | – | – | 3.963 | 3.984 | 3.799 | 60.0 |
| 5.589 | 5.626 | 7.909 | P21/n–38% | – | – | – | – | – | 3.953 | 3.978 | 3.955 | 55.5 |
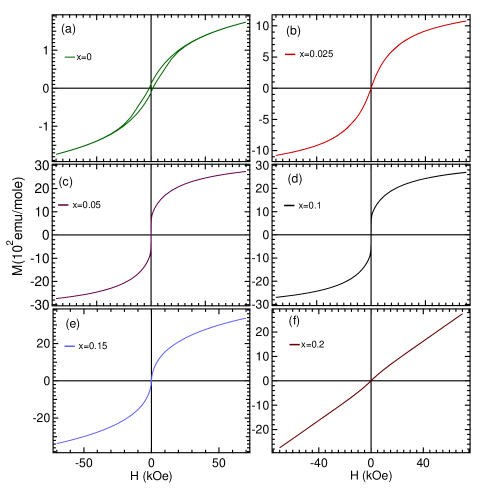
It is interesting to investigate the magnetic behavior with the substitution of nonmagnetic Nb5+ () at Co3+ site in LaCoO3. Therefore, we present in Figs. 2 (a–f) the isothermal magnetization data of LaCo1-xNbxO3 ( 0 to 0.2) measured at 5 K. The samples are first cooled to 5 K in zero field and then M–H loops are obtained as a function of applied magnetic field. For the parent 0 sample, the value of coercivity and spontaneous magnetization (MS) are observed about 1.35 kOe and 105 emu/mol [Fig. 2(a)], which indicate the presence of weak ferromagnetism. At the same time, the non-saturation nature of the magnetization up to 70 kOe [Fig. 2(a)] suggest the canted antiferromagnetism in the sample Vinod14 , which could be due to the superexchange interaction between Co3+–Co3+ ions SeoPRB12 ; MerzPRB10 ; ZhangPRB12 . Interestingly, the MS value is significantly higher (600 emu/mole) even with 2.5% Nb substitution, which further increased with increasing Nb concentration up to 10% (i.e. M 1500 and 2000 emu/mole for 0.05 and 0.1 samples, respectively). With increasing the Nb concentration, the MS value start decreasing and for 0.2 sample we observed a paramagnetic behavior. Moreover, the small hystersis present in 0 sample disappeared completely for 0.025 samples. It is interesting to note that the M-H data for 0.025 0.15 samples [see Figs. 2(b–e)] exhibit a superparamagnetic like nature, having negligible values of coercive field and remanance, but very high value of the magnetization. However, for 0.15 a paramagnetic behavior starts dominating, for example almost a straight line behavior has been observed for 0.2 sample, see Fig. 2(f). As the Nb5+ has d0 configuration, it is thought to be act as diamagnetic dilution in the solid solution of LaCo1-xNbxO3, which decreases the possibility of any long-range magnetic ordering. The Nb5+ substitution increases the population of Co2+ ions via changing the valency of nearest neighbor Co3+ ions, which play an important role in tuning the structural and magnetic phase transitions in LaCoO3.
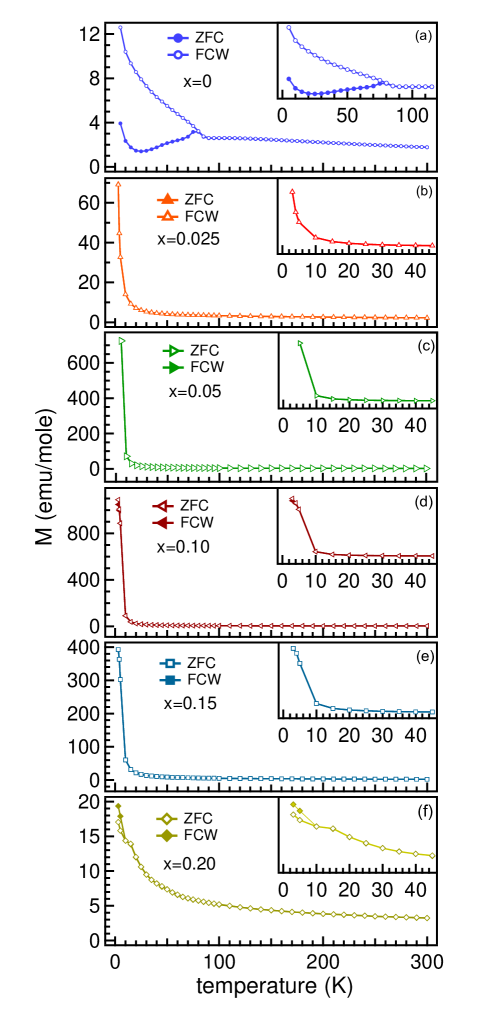
We therefore study the temperature dependence of the magnetization behavior of LaCo1-xNbxO3, 0 to 0.2, as measured at applied magnetic field of 500 Oe and presented in Fig. 3. For 0 sample, a clear ferromagnetic transition at TC 80 K has been observed in the zero field cooled – field cooled (ZFC–FC) data Vinod14 , and below TC the ZFC magnetization decreases from 2.5 emu/mole to 1.5 emu/mole till about 20 K, and then increases back to about 4 emu/mole at 5 K. The FC magnetization increases slowly till 20 K and then there is a fast increase up to 18 emu/mole at 5 K. A large bifurcation in ZFC and FC curves below 80 K indicates the possibility of short-range ferromagnetic interactions. Above TC, the ZFC-FC data show a paramagnetic behavior, where the magnetic susceptibility obeys the Curie-Weiss law (fitted in 200 to 300 K range). Note that only 2.5% Nb substitution changes the ZFC-FC behavior drastically, as can be seen in Figs. 3(b–f). For 0.025 to 0.15 samples, there is no significant change in the magnetization till about 10 K and below this there is a sharp increase in the magnetization upto the lowest measured temperature. The magnetization values at 5 K increases from 70 emu/mole for 0.025 sample to 700 emu/mole and 900 emu/mole for 0.05 and 0.1 samples, respectively. Further increasing Nb concentration, it decreases to about 400 emu/mole for 0.15 sample. However, there is no bifurcation between FC and ZFC magnetization data for 0.025 – 0.15 samples. The ZFC-FC results of 0.025 – 0.15 samples indicate the formation of small clusters with the spins aligned in ferromagnetic order and these spins freezes at the blocking temperature of 10 K. Interestingly, a continuous increase in the magnetizaion has been observed for 0.2 sample [Fig. 3(f)], with a slight difference in the FC and ZFC data below 10 K. Note that for 0.2 sample, the magnetization is significantly lower i.e. about 20 emu/mole at 5 K.
| x | C | Savg | Savg | (1-2) | 2 | |||
| (K) | (exp) | (exp) | (cal) | (cal) | ||||
| IS : HS | HS | |||||||
| 0 | -220 | 1.85 | 3.85 | 1.5 | 3.85 | 1.5 | 50 : 50 | 0 |
| 0.025 | -329 | 2.8 | 4.70 | 1.9 | 4.65 | 1.88 | 10 : 90 | 100 |
| 0.10 | -206 | 3.0 | 4.90 | 2.0 | 4.7 | 1.9 | 0 : 100 | 100 |
| 0.20 | -289 | 3.75 | 5.50 | 2.3 | 4.5 | 1.8 | 0 : 100 | 100 |
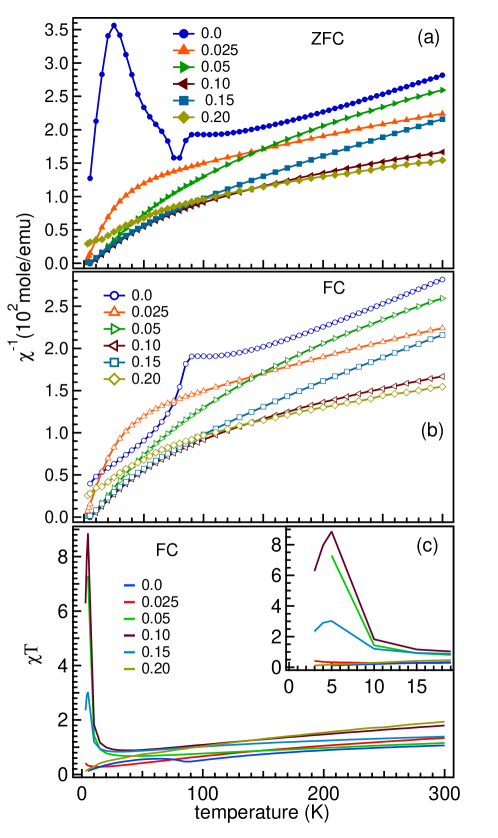
Furthermore, we analyze the inverse susceptibility () vs temperature data, as shown in Figs. 4(a, b), from 200 to 300 K by the Curie-Weiss law
| (1) |
and evaluate the effective magnetic moment and the Curie-Weiss temperature . The obtained values of and for 0 sample are consistent with the reported values in ref. Vinod14 . The parameters obtained for all the samples with Nb substitution are summerized in table II. As the Nb5+ substitution at Co3+ site will convert the neighboring Co ions from 3+ to 2+ valence states, it is important to examine the spin state of Co ions with Nb substitution and their role in controlling the structural and magnetic properties of LaCo1-xNbxO3. Here we use the approximation of spin only (as angular momentum is quenched) magnetic moment, Sav and calculate the values, using experimentally obtained values of with the formula , which are given in the table II. For 0 sample, the spin state contribution can be calculated by considering the mixed states of IS:HS in 50:50 ratio or LS:HS in 25:75 ratio, which gives the Sav and values very close to the experimental values. As it is reported in ref. Oygarden and also mentioned above in the Introduction section, at about 33% Nb substitution Co3+ ions will be completely converted to Co2+, i.e. at this concentration there will be only Co2+ ions present in the system. This means each Nb5+ converts two Co3+ ions to Co2+ ions. We have considered this and calculated the total spin using S (1)Co3+ + 2Co2+. Note that Nb5+, Co3+ (HS) and Co2+ (LS) are similar in size and larger than Co3+ (IS). We used different combinations of possible spin-states, and our calculations reveal that Nb substitution establish Co3+ ions in the HS state up to 20% concentration as the ionic radii of Nb5+ and Co3+ HS are very close. Interestingly, we find that Nb5+ substitution converts two Co ions in to 2+ state and Co2+ stabilize in high-spin state. We summarized the resulting values in table II.
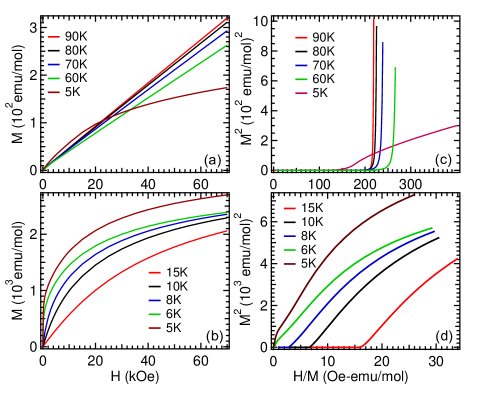
As discussed above, for 0 sample a clear transition is visible at 80 K and for 0.025 to 0.15 samples the magnetization data show sharp increase below about 10 K. Therefore, we further examine the magnetic behavior of 0 and 0.1 samples near their respective transition temperatures. Figs. 5(a, b) show the virgin curves (M – H) measured at various temperatures across the transitions. For 0 sample, a linear behavior is observed with slight decrease in the moment with lowering the temperature from 90 K to 60 K, see Fig. 5(a). On the other hand, the slope change in magnetization of 0.1 sample is clearly seen in Fig. 5(b) where the magnetic moment at 70 kOe increases with lowering the temperature. We performed further analysis of the isothermal magnetization data [from Figs. 5(a, b)] and present Arrott’s plot (M2 vs H/M)Arrott in Figs. 5(c, d). In the Arrott’s plot, we fit the high field data by a straight line and extract the information by positive/negative intercept, which tells the ferro/non-ferro magnetic nature of the system. Also, the strength of spontaneous magnetization in the system can be estimated by the value of the intercept. For 0 sample, see Fig. 5 (c), the intercept at all the temperatures is found to be negative, which suggest the presence of short-range magnetic ordering. However, for 0.1 sample, the intercept upto 10 K is negative, which changes to positive at 8 K, see Fig. 5(d). These results indicate the transition from short-range to long-range magnetic nature at low temperatures in 0.1 sample. Though, the substitution of nonmagnetic Nb5+ is expected to dilute the magnetic interactions, it creates Co2+ in high-spin state and enhance the magnetic moment.
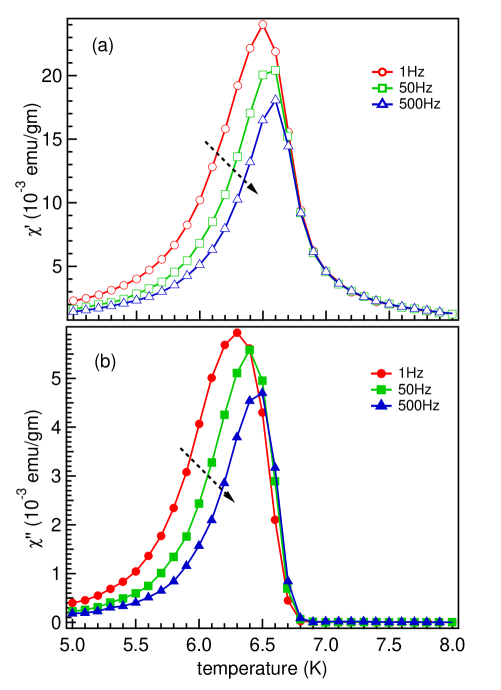
In order to understand the presence of spin-glass/cluster spin-glass/superparamagnetic nature in these samples, the above analysis motivated to perform ac susceptibility measurements. Moreover, in Fig. 4(c), we observed a peak in the plot between T vs temperature, at around 5 K for 0.05 – 0.15 samples where the peak is pronounced for 0.1 sample. Therefore, to further examine, we performed the ac susceptibility measurements in the zero field cooled mode for LaCo0.9Nb0.1O3 sample. Figs. 6(a, b) show both the real and imaginary components measured in the ac field Hac = 3.5 Oe at different frequencies (1, 50 and 500 Hz) in the temperature range from 5 K to 8 K. At 1 Hz, the real and imaginary parts show a peak at 6.5 K and 6.3 K, respectively. The peaks exhibit a clear shift to higher temperatures and change in the intensity with increasing the frequencies in both real and imaginary contributions. This behavior clearly indicate the presence of spin glass state in LaCo0.9Nb0.1O3.
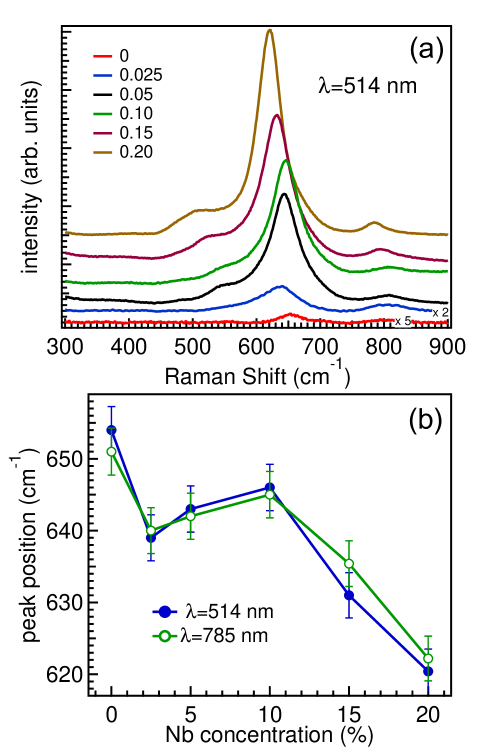
Raman scattering measurements are useful to probe the coupling between the optical phonon modes and relate to the distortions of CoO6 octahedra (tilting and rotation) with increasing Nb content. Also, the change in the peak position and relative intensity of the corresponding modes give evidence for the presence of different spin-states of Co ions. It has been reported that for the rhombohedral (Rc) structure, group theoretical analysis gives five Raman active modes (A1g + 4Eg) KozlenkoPRB07 ; IshikawaPRL04 ; GranadoPRB98 ; AbrashevPRB99 . In Fig. 7(a), we show the room temperature Raman spectra of LaCo1-xNbxO3 ( 0 – 0.2) in the range between 300 and 900 cm-1. For 0 and 0.025 samples, the intensity is very week, so we multiplied the intensity by a factor of 5 and 2, respectively, for clear presentation. We observed three peaks at about 560, 650 and 800 cm-1, which can be assigned to the Eg quadrupole, A2g breathing (stretching like internal vibrations of the CoO6 octahedra), and another Eg phonon modes, respectively KozlenkoPRB07 ; IshikawaPRL04 ; GranadoPRB98 ; AbrashevPRB99 . Interestingly, a clear shift has been observed in peak position of these modes. We now focus on the pronounced A2g mode and plotted the peak position measured using 514 nm and 785 nm excitation wavelengths, as shown in the Fig. 7(b). The shift in the A2g peak position indicates the change in coupling and the Co–O bond length i.e. further distortion in CoO6 octahedra, which may favor the HS state of Co ions RadaelliPRB02 , consistent with the magnetic data analysis. Also, a significant increase in the peak intensity of A2g mode is evident [Fig. 7(a)] with increasing Nb concentration.
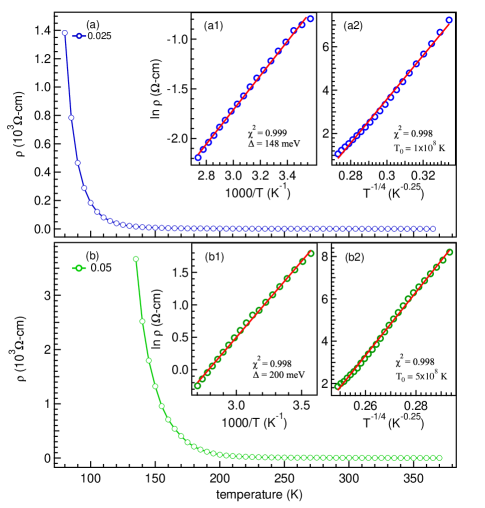
Now we discuss the underlying transport mechanism and measure the temperature dependence of electrical resistivity () of LaCo1-xNbxO3, 0.025 and 0.05 samples, as shown in Figs. 8(a, b). It is clear that both the samples show semiconducting/insulating behavior with decreasing the temperature. More interestingly, the resistivity increase sharply at low temperatures i.e. below about 150 K and 200 K for 0.025 and 0.05 samples, respectively, yielding an insulating ground state, see Figs. 8(a, b). To explain the electrical conduction we use different models and find that no single model can fit the data in the entire temperature range, which suggests at least two types of mechanisms controlling the conduction in the different temperature range. The Arrhenius model describes conduction by simple activation of charge carriers through the band gap between conduction and valance band at high temperatures, as given in the equation 2,
| (2) |
where is the activation energy. We plotted ln() vs. 1/T in the temperature range from 370 to 280 K [see Figs. 8(a1, b1)] and values can be obtained from the slope of the curves, which are 148 meV and 200 meV for 0.025 and 0.05 samples, respectively. These values of activation energy are significantly larger than the reported 120 meV for 0 sample in ref. Vinod13 and consistent for insulating transition metal oxides. At lower temperatures the carrier transport is provided by hoping between the localized states. Therefore, we used the Mott’s variable range hopping (VRH) model, as described in equation 3, in the lower temperature range close to the transition (from 140 to 85 and 185 to 135 K for 0.025 and 0.05 samples, respectively), see Figs. 8(a2, b2),
| (3) |
where T0 = is the characteristic temperature, and N(EF) is the effective density of states (DOS) near the Fermi level, and is localization length. Here T0 value is calculated from the slope of ln() vs. T-1/4 plots, which comes out to be 1108 K and 5108 K. And, using the T0 values and the 2 Å (taken as the average Co–O bond length for LaCoO3), we calculated the density of states [DOS; N(EF)] near the Fermi level, which are 2.5 and 5 eV-1cm-3 for 0.025 and 0.05 samples, respectively. It is clearly evident that the resistivity increases with Nb concentration in the measured temperature range. For example, the is 2 k-cm at 70 K and 5.5 k-cm at 140 K for 0.025 and 0.05 samples, respectively [Figs. 8(a, b)]. The obtained decrease in the DOS values at the Fermi level and increase in the activation energy results in the decrease in conductivity with higher Nb concentration.
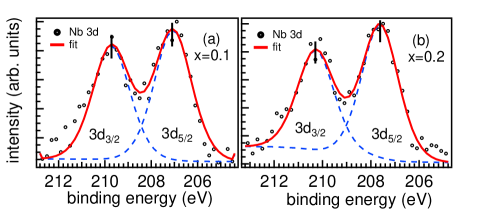
Further, we use x-ray photoelectron spectroscopy and measured the Co 2 and La 3 core-level spectra (not shown), which are consistent with the previous reports Ravi17 ; VasquezPRB96 ; Chainani92 ; Saitoh97 ; LamPRB80 ; BarmanPRB94 . There are some signature of the presence of Co2+ in the Co 2 core-level spectra; however, high-resolution measurements using synchrotron radiation facility are required for detailed analysis. In Figs. 9(a, b), we show the Nb 3 core-level spectra along the fitting with Voigt function after subtracting the inelastic Tougaard background. For 0.1 sample, the spin-orbit splitting components Nb 3 and 3 appear at binding energy (BE) 207 eV and 210 eV, respectively. These values confirm that the Nb is predominantly in 5+ state SasaharaJPCC13 . However, for 0.2 sample we observed the Nb 3 core-levels at about 0.5 eV towards higher BE due to the change in the surrounding chemical environment as higher Nb content converts Co3+ ions to Co2+ and stabilize in high-spin state.
IV Conclusions
In conclusion, the structural, magnetic, transport and electronic properties of LaCo1-xNbxO3 ( 0–0.2) have been studied in detail using x-ray diffraction, magnetization, DC resistivity and x-ray photoemission spectroscopy. The Rietveld refinements of the room temperature powder x-ray diffraction (XRD) data show structural phase transitions with increasing Nb concentration where coexistence of rhombohedral and orthorhombic is found in 0.1–0.15 samples and 0.2 sample is present in orthorhombic and monoclinic phases. More interestingly, we observed dramatic changes in the magnetic behavior for Nb concentration as low as 2.5% where the magnetization increases sharply below 10 K without bifurcation between ZFC and FC. Furthermore, the spin glass behavior has been observed for 0.1 sample in ac susceptibility measurements. The analysis of resistivity data show decrease in the density of state at the Fermi level and increase in the activation energy, which results in strong insulating nature with increasing the Nb concentration. The XPS study of Nb 3 core-levels confirms that the Nb is present mostly in 5+ valence state and shows about 0.5 eV shift towards higher BE side for 0.2 sample as the chemical surrounding changes due to more of Co2+ ions with Nb substitution. Our results demonstrate that the nonmagnetic Nb5+ substitution will convert Co3+ ions to Co2+ and stabilize in the high-spin state. We find that the spin-state transition and the difference in the ionic radii between Nb5+ and Co3+/Co2+ are crucial in controlling the physical properties of LaCo1-xNbxO3.
Acknowledgments
RS acknowledges the MHRD, India for fellowship through IIT Delhi. We thank V. K. Anand, Priyanka, A. K. Pramanik, Mahesh Chandra, Anita Dhaka and Milan Radovic for useful discussions. Authors acknowledge IIT Delhi for providing research facilities: XRD, PPMS EVERCOOL-II , SQUID, Raman and XPS. We also thank the physics department, IIT Delhi for support. RSD gratefully acknowledges the financial support from SERB-DST through Early Career Research (ECR) Award (project reference no. ECR/2015/000159) and BRNS through DAE Young Scientist Research Award project sanction No. 34/20/12/2015/BRNS.
References
- (1) P. M. Raccah and J. B. Goodenough, Phys. Rev. 155, 932 (1967).
- (2) T. Vogt, J. A. Hriljac, N. C. Hyatt, and P. Woodward, Phys. Rev. B 67, 140401(R) (2003).
- (3) R. Lengsdorf, M. Ait-Tahar, S. S. Saxena, M. Ellerby, D. I. Khomskii, H. Micklitz, T. Lorenz, and M. M. Abd-Elmeguid, Phys. Rev. B 69, 140403(R) (2004).
- (4) G. Vankó, J. -P. Rueff, A. Mattila, Z. Németh, and A. Shukla, Phys. Rev. B 73, 024424 (2006).
- (5) R. Lengsdorf, J. -P. Rueff, G. Vankó, T. Lorenz, L. H. Tjeng, and M. M. Abd-Elmeguid, Phys. Rev. B 75, 180401(R) (2007).
- (6) D. P. Kozlenko, N. O. Golosova, Z. Jirák, L. S. Dubrovinsky, B. N. Savenko, M. G. Tucker, Y. Le Godec, and V. P. Glazkov, Phys. Rev. B 75, 064422 (2007).
- (7) R. P. Vasquez, Phys. Rev. B 54, 14938 (1996).
- (8) M. Kriener, C. Zobel, A. Reichl, J. Baier, M. Cwik, K. Berggold, H. Kierspel, O. Zabara, A. Freimuth, and T. Lorenz, Phys. Rev. B 69, 094417 (2004).
- (9) K. Sato, A. Matsuo, K. Kindo, Y. Hara, K. Nakaoka, Y. Kobayashi, and K. Asai, J. of the Physical Society of Japan 83, 114712 (2014).
- (10) S. V. Streltsov, V. V. Gapontsev, and D. I. Khomskii, J. Phys.: Condens. Matter 28, 086005 (2016).
- (11) D. V. Karpinsky, I. O. Troyanchuk, K. Brner, H. Szymczak, and M. Tovar, J. Phys.: Condens. Matter 17, 7219 (2005).
- (12) I. Á.-Serrano, G. J. Cuello, M. L. López, A. J.-López, C. Pico, E. R.-Castellón, E. Rodríguez, and M. L. Veiga, J. Phys. D: Appl. Phys. 41, 195001 (2008).
- (13) K. Yoshii and H. Abe, Phys. Rev. B. 67, 094408 (2003).
- (14) D. Hammer, J. Wu, and C. Leighton, Phys. Rev. B 69, 134407 (2004).
- (15) J. Baier, S. Jodlauk, M. Kriener, A. Reichl, C. Zobel, H. Kierspel, A. Freimuth, and T. Lorenz, Phys. Rev. B 71, 014443 (2005).
- (16) M. Kriener, M. Braden, H. Kierspel, D. Senff, O. Zabara, C. Zobel, and T. Lorenz, Phys. Rev. B 79, 224104 (2009).
- (17) M. Zhuang, W. Zhang, and N. Ming, Phys. Rev. B 57, 10705 (1998).
- (18) C. Zobel, M. Kriener, D. Bruns, J. Baier, M. Grninger, T. Lorenz, P. Reutler, and A. Revcolevschi, Phys. Rev. B 66, 020402(R) (2002).
- (19) A. Podlesnyak, S. Streule, J. Mesot, M. Medarde, E. Pomjakushina, K. Conder, A. Tanaka, M. W. Haverkort, and D. I. Khomskii, Phys. Rev. Lett. 97, 247208 (2006).
- (20) S. R. English, J. Wu, and C. Leighton, Phys. Rev. B 65, 220407(R) (2002).
- (21) M. A. Korotin, S. Yu. Ezhov, I. V. Solovyev, V. I. Anisimov, D. I. Khomskii, and G. A. Sawatzky, Phys. Rev. B 54, 5309 (1996).
- (22) P. M. Raccah and J. B. Goodenough, J. Appl. Phys. 39, 1209 (1968).
- (23) A. Ishikawa, J. Nohara, and S. Sugai, Phys. Rev. Lett. 93, 136401 (2004).
- (24) S. Yamaguchi, Y. Okimoto, and Y. Tokura, Phys. Rev. B 55, R8666(R) (1997).
- (25) T. Saitoh, T. Mizokawa, A. Fujimori, M. Abbate, Y. Takeda, and M. Takano, Phys. Rev. B 55, 4257 (1997).
- (26) R. F. Klie, J. C. Zheng, Y. Zhu, M. Varela, J. Wu, and C. Leighton, Phys. Rev. Lett. 99, 047203 (2007).
- (27) M. W. Haverkort, Z. Hu, J. C. Cezar, T. Burnus, H. Hartmann, M. Reuther, C. Zobel, T. Lorenz, A. Tanaka, N. B. Brookes, H. H. Hsieh, H.-J. Lin, C. T. Chen, and L. H. Tjeng, Phys. Rev. Lett. 97, 176405 (2006).
- (28) R. Caciuffo, D. Rinaldi, G. Barucca, J. Mira, J. Rivas, M. A. Señarís-Rodríguez, P. G. Radaelli, D. Fiorani, and J. B. Goodenough, Phys. Rev. B 59, 1068 (1999).
- (29) M. A. Señarís-Rodríguez and J. B. Goodenough, J. Solid State Chem. 118, 323 (1995).
- (30) K. Asai, P. Gehring, H. Chou, and G. Shirane, Phys. Rev. B 40, 10982 (1989).
- (31) I. Fita, R. Szymczak, R. Puzniak, I. O. Troyanchuk, J. F.-Finowicki, Y. M. Mukovskii, V. N. Varyukhin, and H. Szymczak, Phys. Rev. B. 71, 214404 (2005).
- (32) Y. Tokura, Y. Okimoto, S. Yamaguchi, H. Taniguchi, T. Kimura, and H. Takagi, Phys. Rev. B 58, R1699(R) (1998).
- (33) J. Wu and C. Leighton, Phys. Rev. B 67, 174408 (2003).
- (34) Ravi Prakash, Rishabh Shukla, Priyanka, Anita Dhaka, and R. S. Dhaka, arXiv:1709.01745.
- (35) N. Hollmann, M. W. Haverkort, M. Benomar, M. Cwik, M. Braden, and T. Lorenz, Phys. Rev. B 83, 174435 (2011); N. Hollmann, M. W. Haverkort, M. Cwik, M. Benomar, M. Reuther, A. Tanaka and T. Lorenz, New Journal of Physics 10, 023018 (2008).
- (36) Hua Wu, Phys. Rev. B 81, 115127 (2010); 86, 075120 (2012).
- (37) C. F. Chang, Z. Hu, Hua Wu, T. Burnus, N. Hollmann, M. Benomar, T. Lorenz, A. Tanaka, H.-J. Lin, H. H. Hsieh, C. T. Chen, and L. H. Tjeng, Phys. Rev. Lett. 102, 116401 (2009).
- (38) M. Cwik, M. Benomar, T. Finger, Y. Sidis, D. Senff, M. Reuther, T. Lorenz, and M. Braden, Phys. Rev. Lett. 102, 057201 (2009).
- (39) P. Babkevich, D. Prabhakaran, C. D. Frost, and A. T. Boothroyd, Phys. Rev. B 82, 184425 (2010).
- (40) C. Tealdi, C. Ferrara, L. Malavasi, P. Mustarelli, C. Ritter, G. Chiodelli, and Y. A. Diaz-Fernandez, Phys. Rev. B 82, 174118 (2010).
- (41) Z. W. Li, Y. Drees, C. Y. Kuo, H. Guo, A. Ricci, D. Lamago, O. Sobolev, U. Rtt, O. Gutowski, T. W. Pi, A. Piovano, W. Schmidt, K. Mogare, Z. Hu, L. H. Tjeng, and A. C. Komarek, Scientific Reports 6, 25117 (2016).
- (42) K. Tomiyasu, Y. Kubota, S. Shimomura, M. Onodera, S. -I. Koyama, T. Nojima, S. Ishihara, H. Nakao, and Y. Murakami, Phys. Rev. B 87, 224409 (2013).
- (43) M. Viswanathan and P. S. Anil Kumar, Phys. Rev. B 80, 012410 (2009).
- (44) V. Kumar, R. Kumar, D. K. Shukla, S. K. Arora, I. V. Shvets, K. Singh, and R. Kumar, Materials Chemistry and Physics, 147, 617 (2014).
- (45) V. Kumar, R. Kumar, D. K. Shukla, S. Gautam, K. H. Chae, and R. Kumar, J. Applied Physics, 114, 073704 (2013).
- (46) N. E. Rajeevan, V. Kumar, R. Kumar, R. Kumar, S. D. Kaushik, J. of Magnetism and Magnetic Materials 393, 394 (2015).
- (47) C. L. Bull, H. Y. Playford, K. S. Knight, G. B. G. Stenning, and M. G. Tucker, Phys. Rev. B 94, 014102 (2016).
- (48) K. P. Rajeev and A. K. Raychaudhuri, Phys. Rev. B 46, 1309 (1992).
- (49) H. Guo, Z. W. Li, L. Zhao, Z. Hu, C. F. Chang, C. -Y. Kuo, W. Schmidt, A. Piovano, T. W. Pi, O. Sobolev, D. I. Khomskii, L. H. Tjeng, and A. C. Komarek, Nature Communications, 9 43 (2018).
- (50) J. Zhang, H. Zheng, Y. Ren, and J. F. Mitchell, Crystal Growth and Design 17, 2730 (2017).
- (51) H. Guo, K. Manna, H. Luetkens, M. Hoelzel, and A. C. Komarek, Phys. Rev. B 94, 205128 (2016).
- (52) K. Knížek, J. Hejtmánek, M. Maryško, Z. Jirák, and J. Buršík, Phys. Rev. B 85, 134401 (2012).
- (53) S. Asai, N. Furuta, Y. Yasui, and I. Terasaki, J. of the Physical Society of Japan 80, 104705 (2011); S. Asai, R. Okazaki, I. Terasaki, Y. Yasui, W. Kobayashi, A. Nakao, K. Kobayashi, R. Kumai, H. Nakao, Y. Murakami, N. Igawa, A. Hoshikawa, T. Ishigaki, O. Parkkima, M. Karppinen, and H. Yamauchi, ibid 82, 114606 (2013).
- (54) T. Motohashi, V. Caignaert, V. Pralong, M. Hervieu, A. Maignan, and B. Raveau, Phys. Rev. B 71, 214424 (2005).
- (55) T. Motohashi, V. Caignaert, V. Pralong, M. Hervieu, A. Maignan, and B. Raveau, Appl. Phys. Lett. 86, 192504 (2005).
- (56) V. Oygarden, H. L. Lein, and T. Grande, Journal of Solid State Chemistry 192, 246 (2012).
- (57) V. Sikolenko, V. Efimov, E. Efimova, A. Sazonov, C. Ritter, A. Kuzmin, and I. Troyanchuk, J. Phys.: Condens. Matter 21, 436002 (2009).
- (58) I. O. Troyanchuk, D. V. Karpinsky, and R. Szymczak, Phys. Stat. Sol.(b) 242, R49 (2005).
- (59) K. Knížek, P. Novák, and Z. Jirák, Phys. Rev. B 71, 054420 (2005).
- (60) S. K. Pandey, S. Khalid, N. P. Lalla, and A. V. Pimpale, J. Phys.: Condens. Matter 18, 10617 (2006).
- (61) W. Marti, P. Fischer, F. Altorfer, H. J. Scheel, and M. Tadin, J. Phys.: Condens. Matter 6, 127 (1994).
- (62) G. Zhang, E. Gorelov, E. Koch, and E. Pavarini, Phys. Rev. B 86, 184413 (2012).
- (63) H. Seo, A. Posadas, and A. A. Demkov, Phys. Rev. B 86, 014430 (2012).
- (64) M. Merz, P. Nagel, C. Pinta, A. Samartsev, H. v. Lhneysen, M. Wissinger, S. Uebe, A. Assmann, D. Fuchs, and S. Schuppler, Phys. Rev. B 82, 174416 (2010).
- (65) A. Arrott, Phys. Rev. 108, 1394 (1957).
- (66) E. Granado, N. O. Moreno, A. Garcia, J. A. Sanjurjo, C. Rettori, I. Torriani, S. B. Oseroff, J. J. Neumeier, K. J. McClellan, S. -W. Cheong, and Y. Tokura, Phys. Rev. B 58, 11435 (1998).
- (67) M. V. Abrashev, A. P. Litvinchuk, M. N. Iliev, R. L. Meng, V. N. Popov, V. G. Ivanov, R. A. Chakalov, and C. Thomsen, Phys. Rev. B 59, 4146 (1999).
- (68) P. G. Radaelli and S.-W. Cheong, Phys. Rev. B 66, 094408 (2002).
- (69) A. Chainani, M. Mathew, and D. D. Sarma, Phys. Rev. B 46, 9976 (1992).
- (70) T. Saitoh, T. Mizokawa, A. Fujimori, M. Abbate, Y. Takeda, and M. Takano, Phys. Rev. B 56, 1290 (1997).
- (71) D. J. Lam, B. W. Veal, and D. E. Ellis, Phys. Rev. B 22, 5730 (1980).
- (72) S. R. Barman, and D. D. Sarma, Phys. Rev. B 49, 13979 (1994).
- (73) A. Sasahara and M. Tomitori, J. Phys. Chem. C 117, 17680 (2013).