Tracking Advanced Planetary Systems (TAPAS) with HARPS-N. ††thanks: Based on observations obtained with the Hobby-Eberly Telescope, which is a joint project of the University of Texas at Austin, the Pennsylvania State University, Stanford University, Ludwig-Maximilians-Universität München, and Georg-August-Universität Göttingen. ††thanks: Based on observations made with the Italian Telescopio Nazionale Galileo (TNG) operated on the island of La Palma by the Fundación Galileo Galilei of the INAF (Istituto Nazionale di Astrofisica) at the Spanish Observatorio del Roque de los Muchachos of the Instituto de Astrofísica de Canarias. ††thanks: Table 2 is only available in electronic form at the CDS via anonymous ftp to cdsarc.u-strasbg.fr (130.79.128.5) or via http://cdsweb.u-strasbg.fr/cgi-bin/qcat?J/A+A/
Abstract
Context. We present the latest results of our search for planets with HARPS-N at the 3.6 m Telescopio Nazionale Galileo under the Tracking Advanced Planetary Systems project: an in-depth study of the 15 most Li abundant giants from the PennState - Toruń Planet Search sample.
Aims. Our goals are first, to obtain radial velocities of the most Li-rich giants we identified in our sample to search for possible low-mass substellar companions, and second, to perform an extended spectral analysis to define the evolutionary status of these stars.
Methods. This work is based on high-resolution spectra obtained with the Hobby-Eberly Telescope and its High Resolution Spectrograph, and with the HARPS-N spectrograph at the Telescopio Nazionale Galileo. Two stars, HD 181368 and HD 188214 , were also observed with UVES at the VLT to determine beryllium abundances.
Results. We report i) the discovery of two new planetary systems around the Li-rich giant stars: HD 238914 and TYC 3318-01333-1 (a binary system); ii) reveal a binary Li-rich giant, HD 181368 ; iii) although our current phase coverage is not complete, we suggest the presence of planetary mass companions around TYC 3663-01966-1 and TYC 3105-00152-1 ; iv) we confirm the previous result for BD+48 740 and present updated orbital parameters, and v) we find a lack of a relation between the Li enhancement and the Be abundance for the stars HD 181368 and HD 188214 , for which we acquired blue spectra.
Conclusions. We found seven stars with stellar or potential planetary companions among the 15 Li-rich giant stars. The binary star frequency of the Li-rich giants in our sample appears to be normal, but the planet frequency is twice that of the general sample, which suggests a possible connection between hosting a companion and enhanced Li abundance in giant stars. We also found most of the companions orbits to be highly eccentric.
Key Words.:
Stars: late-type - Planets and satellites: detection - Techniques: radial velocities - Techniques: spectroscopic -Stars: chemically peculiar1 Introduction
The hypothesis that a star can enhance its lithium content in the atmosphere through planet engulfment has been formulated by Alexander (1967) long before any Li-rich giant (star) or a planetary host was discovered.
The first Li-rich giant was discovered 25 years after Alexander’s work by Wallerstein & Sneden (1982). Today, we know more than 150 stars with . They are most often defined as Li-rich objects, but it is still not clear why one giant star in 100 objects has an enhanced Li abundance. The variety of properties of Li-rich giants is intriguing: many are located all along the red giant branch (RGB) (Lebzelter et al., 2012), and some are identified as stars at the turn-off point (Koch et al., 2011) and horizontal branch objects. Furthermore, for some stars, the high Li content is associated with infrared excesses (Bharat Kumar et al., 2015; Rebull et al., 2015).
The first candidate for a Li-rich giant hosting a planet was reported by Adamów et al. (2012a) as a result of the PennState - Toruń Planet Search (PTPS). Currently, we know only a few more Li-rich objects that have been identified as potential planetary hosts: 8 UMi (HD 133086) (Kumar et al., 2011; Lee et al., 2015), NGC 2423 3 (Carlberg et al., 2016), and two giants in the NGC 2423 and NGC 4349 clusters (Delgado Mena et al., 2016).
Under special circumstances (efficient mixing between the convective layer and the hydrogen burning shell), a chain of chemical reactions that lead to Li production can occur (Cameron & Fowler, 1971), most likely at the luminosity function bump in the Herztsprung-Russel (HR) diagram. This means that an RGB star may be able to produce Li by itself (Adamów et al. 2014 and references therein). Li enhancement may be also the result of a transfer of Li-rich gas from a more evolved companion in a close binary system (Sackmann & Boothroyd, 1999). Rapid Li production is also associated with supernova (SN) explosions (Woosley & Weaver, 1995). If a star accretes post-SN material, its chemical composition may be altered, resulting in higher Li content. Planetary ingestion is expected when a star leaves the main sequence and moves to the tip of the RGB, where the significant expansion in radius and the extension of the convective zone amplifies the effects of tidal interactions with the orbiting planets (Villaver & Livio, 2009). The lack of close-in planets around evolved stars suggests that planetary engulfment is a common process in the evolution of planetary systems, and the solar system probably is no exception (Villaver & Livio, 2009; Villaver et al., 2014).
The increasing number of evolved stars hosting planets with enhanced Li abundances may suggest that indeed planet engulfment is the mechanism responsible for Li abundance anomalies. The amount of unprocessed matter required to enhance the Li abundance in a giant is very high. However, the hypothesis that is more attractive to study in more detail are the structural effects on the star and the chemical signatures of a planet engulfment. Privitera et al. (2016) showed that planet engulfment either produces a too weak signal, as in the case of the carbon isotopic ratios, or produces signals that cannot be attributed in a non-ambiguous way to a planet engulfment.
It is very tempting, however, to search for low-mass companions around Li-rich giants since a large portion of planetary systems are expected to be multiple. PTPS, a planet-search program focused on evolved stars, is the perfect laboratory in which to study this problem in detail. Within the project, we collected high-resolution spectra that we used to determine Li abundances for the whole sample of nearly 1000 objects, which are mostly composed of evolved stars. We identified several new Li-rich stars (Adamów et al., 2012b, 2014) for which we decided to perform a dedicated campaign to investigate their properties, including radial velocity (RV) variations and Be abundances, as a part of the Tracking Advanced Planetary Systems (TAPAS) project (Niedzielski et al., 2015; Adamów et al., 2015; Niedzielski et al., 2016b, c; Villaver et al., 2017), to test the working hypothesis that Li-rich giants might be related to the process of planet engulfment and might even still host more planets.
In this paper, we present results of RV measurements for 12 stars with the highest Li abundances identified in the PTPS sample (), and we give an update on orbital parameters of BD+48 740 b after numerous additional epochs of observations. We also present results of chemical composition studies for those stars, including Be abundances in two of them: HD 181368 and HD 188214 , which are bright enough and available for high-resolution spectroscopy in the UV.
2 Sample and observations
The sample presented in this paper comprises a total of 15 Li-rich giants from PTPS with the highest Li content, (Adamów et al., 2014). HD 181368 was added to this list because this star was identified as a giant by Deka-Szymankiewicz et al. (2018), and it was found to be a Li-rich giant as well. Twelve objects are the subject of detailed analysis, as new epochs of precise RV were collected in a quest for possible companions around them within the TAPAS project. The sample also includes BD+48 740 (Adamów et al., 2012a), for which new RV observations are available.
We also added three stars to this sample that had no new observation epochs: the apparently single Li-rich giant with the highest A(Li) in our sample, HD 107028 (Adamów et al., 2015), and two Li-rich giants in binary systems, TYC 0405-01700-1 and TYC 3314-01371-1, which were presented in Adamów et al. (2014) for completeness.
Basic atmospheric parameters (, , Fe/H, determined through abundance analysis of neutral and ionized Fe lines) and Li abundance are presented in Table 1. A detailed description of the atmospheric parameters can be found in Zieliński et al. (2012) and Niedzielski et al. (2016a). Masses, radii, and stellar ages were adopted from Deka-Szymankiewicz et al. (2018).
| Star | [K] | Fe/H | |||||||
|---|---|---|---|---|---|---|---|---|---|
| BD+02 3497 | p m 8 | p m 0.03 | p m 0.05 | p m 0.15 | p m 0.24 | p m 1.23 | p m 3.60 | p m 2720 | |
| BD+48 740 | p m 8 | p m 0.04 | p m 0.06 | p m 0.12 | p m 0.16 | p m 1.81 | p m 2.20 | p m 2477 | |
| HD 181368 | p m 15 | p m 0.05 | p m 0.02 | p m 0.10 | p m 0.13 | p m 0.79 | p m 0.97 | p m 70 | |
| HD 188214 | p m 13 | p m 0.05 | p m 0.07 | p m 0.18 | p m 0.08 | p m 1.48 | p m 0.40 | p m 17 | |
| HD 238914 | p m 15 | p m 0.06 | p m 0.09 | p m 0.19 | p m 0.47 | p m 3.89 | p m 0.50 | p m 130 | |
| TYC 0684-00553-1 | p m 10 | p m 0.03 | p m 0.05 | p m 0.14 | p m 0.35 | p m 2.57 | p m 2.80 | p m 5497 | |
| TYC 3105-00152-1 | p m 5 | p m 0.02 | p m 0.05 | p m 0.04 | p m 0.08 | p m 0.83 | p m 0.60 | p m 111 | |
| TYC 3263-02180-1 | p m 10 | p m 0.04 | p m 0.01 | p m 0.12 | p m 0.12 | p m 1.97 | p m 0.94 | p m 88 | |
| TYC 3300-00133-1 | p m 10 | p m 0.03 | p m 0.06 | p m 0.10 | p m 0.16 | p m 0.92 | p m 0.70 | p m 42 | |
| TYC 3318-01333-1 | p m 10 | p m 0.04 | p m 0.06 | p m 0.11 | p m 0.14 | p m 1.00 | p m 0.70 | p m 126 | |
| TYC 3663-01966-1 | p m 10 | p m 0.03 | p m 0.05 | p m 0.09 | p m 0.21 | p m 2.28 | p m 0.60 | p m 116 | |
| TYC 3930-00681-1 | p m 20 | p m 0.08 | p m 0.09 | p m 0.23 | p m 0.26 | p m 2.29 | p m 0.60 | p m 95 | |
| HD 107028 | p m 15 | p m 0.04 | p m 0.02 | p m 0.08 | p m 0.05 | p m 0.51 | p m 0.44 | p m 82 | |
| TYC 0405-01700-1 | p m 50 | p m 0.17 | p m 2.1 | ||||||
| TYC 3314-01371-1 | p m 10 | p m 0.04 | p m 0.07 | p m 0.11 | p m 0.16 | p m 0.75 | p m 0.80 | p m 63 |
The spectroscopic observations presented in this paper were made with the 9.2 Hobby-Eberly Telescope (HET, Ramsey et al. 1998) and its High-Resolution Spectrograph (HRS, Tull 1998) in the queue-scheduled mode (Shetrone et al., 2007), and with the 3.58 meter Telescopio Nazionale Galileo (TNG) and its High Accuracy Radial velocity Planet Searcher in the North hemisphere (HARPS-N, Cosentino et al. 2012). A detailed description of the adopted observing strategies and instrumental configuration for HET/HRS and TNG/HARPS-N can be found in Niedzielski et al. (2007) and Niedzielski et al. (2015).
Additionally, we obtained UVES (Dekker et al., 2000) spectra for two stars: HD 181368 and HD 188214 . The configuration of the spectrograph was chosen to cover the bluest spectral region available for UVES, which includes the beryllium resonance lines. Five exposures were made for HD 181368 , and six for HD 188214 in 2014 (April 4 and 10; June 28; and July 2 and 10). All observations were reduced with Reflex - a dedicated reduction pipeline (Freudling et al., 2013). Single exposures for each star were combined to achieve a spectrum with a high signal-to-noise ratio, which we used for determining the abundance of beryllium.
All HET/HRS spectra were reduced with standard IRAF111IRAF is distributed by the National Optical Astronomy Observatories, which are operated by the Association of Universities for Research in Astronomy, Inc., under cooperative agreement with the National Science Foundation. procedures. The TNG/HARPS-N spectra were processed with the standard user’s pipeline. The typical signal-to-noise ratio for these spectra is 50-80. As HARPS-N is a temperature- and pressure-controlled spectrograph, all gathered spectra for a star were combined to obtain one high-resolution spectrum with a high signal-to-noise ratio for the purpose of the chemical analysis.
3 Radial velocities and activity
Stellar activity may be a source of RV-like variations in stars. Spots on the stellar surface, which move across the disk as the star rotates, distort the line shapes and influence the RV measurements. A long-term stellar magnetic cycle may possibly also influence the RV measurements through a convective blueshift. This effect has been intensively studied for main-sequence stars (Meunier et al. 2017a, b and references therein). For a proper identification of the RV variability in a source, we investigated four indicators of stellar activity.
3.1 Radial velocities
All HET/HRS RV and spectral line bisector (BIS) measurements were obtained using the I2 gas-cell technique (Marcy & Butler, 1992; Butler et al., 1996). Our application of this technique to HET/HRS data is described in detail in Nowak (2012) and Nowak et al. (2013).
The RV and BIS from HARPS-N were obtained with the cross-correlation (Queloz, 1995; Pepe et al., 2002) method, with the standard user’s pipeline, which uses the simultaneous Th-Ar calibration mode of the spectrograph and the cross-correlation mask with stellar spectrum (mask). For all stars, except for HD 107028 and TYC 3263-02180-1 , we used the K5 mask. For these two stars, we used the G2 mask. The RV and BIS data for all stars are presented in Table 2.
The RVs discussed in this paper were collected in a long period of time – HET/HRS data were collected between 2 June 2004 and 14 July 2015, TNG/HARPN-N were obtained between 30 November 2012 and 4 August 2015. The time span of observations for each star is given in Table 3. This table also includes the estimated amplitudes of solar-like oscillations (Kjeldsen & Bedding, 1995), associated with granulation and other heterogeneities on the stellar surface, the initial amplitudes in RV (defined as the difference between maximum and minimum values of raw RVs), the average error in RV, the linear correlation coefficient between RV and BIS, and its significance level.
Table 3 shows that the observed RV variations are 1-2 orders of magnitude larger than the average RV uncertainty for all our stars. In most cases, the observed RV variations are at least an order of magnitude larger than the expected RV amplitude of the p-mode oscillations. The only exceptions are HD 188214 - whose HET/HRS RV amplitude is only twice larger than the expected , not confirmed by TNG/HARPS-N data (therefore most likely caused by the low number of HET/HRS epochs), and TYC 3930-00681-1 , again most likely due to the low number of HET/HRS observations.
There is no statistically significant correlation between RV and BIS in HET/HRS data (except for TYC 3930-00681-1 , for which there are just two observation epochs) In the TNG data for two stars, BD+02 3497 and TYC 3263-02180-1 , the linear correlation coefficients are below a level of significance of , pointing to a relation between RV and BIS. For other stars we can assume that the RV signal origin is Dopplerian.
| Star | HET/HRS | TNG/HARPS-N | ||||||||||||
|---|---|---|---|---|---|---|---|---|---|---|---|---|---|---|
| p | no | p | no | |||||||||||
| BD+02 3497 | 3693 | 12 | 18 | |||||||||||
| BD+48 740 | 3492 | 25 | 16 | |||||||||||
| HD 181368 | 2981 | 9 | 18 | |||||||||||
| HD 188214 | 3333 | 4 | 14 | |||||||||||
| HD 238914 | 3944 | 71 | 15 | |||||||||||
| TYC 0684-00553-1 | 2340 | 9 | 18 | |||||||||||
| TYC 3105-00152-1 | 2868 | 14 | 22 | |||||||||||
| TYC 3263-02180-1 | 3320 | 10 | 19 | |||||||||||
| TYC 3300-00133-1 | 3940 | 3 | 11 | |||||||||||
| TYC 3318-01333-1 | 3514 | 12 | 16 | |||||||||||
| TYC 3663-01966-1 | 2940 | 20 | 12 | |||||||||||
| TYC 3930-00681-1 | 3769 | 2 | 11 | |||||||||||
3.2 activity index
The core of the Hα line is an indicator of stellar activity. Changes in flux in the line center can be quantified with the activity index. It specifies the flux ratio at the core of Hα to the flux in the continuum close to this line. We measured the Hα activity index () in both HET/HRS and TNG/HARPS-N spectra. For the calculations, we followed the procedure described by Maciejewski et al. (2013), which was based on the approach presented by Gomes da Silva et al. (2012) and Robertson et al. (2013, and references therein). The analysis of for HET/HRS had to be extended because of the use of cell, therefore the order of spectra with Hα is affected by weak lines. Moreover, the instrumental profile for HET/HRS data may vary. To take these two effects into account, we determined the analogical index to for Fe I 6593.883 Å. This line is located in the same echelle order of spectra as Hα in our HET/HRS data and is not affected by stellar activity. We will denote the Fe activity index as . If there is a correlation between RV and , it means that the instrumental profile strongly affects the analysis. We also performed the same analysis on the iodine flat-field spectra (Flat GC), to determine whether the potential variability might stem from itself. Any correlation between indexes and the RV measured for Flat GCs and RVs indicates that the influence of weak iodine lines is not negligible and the analysis may not be reliable. The HARPS-N is an instrument with a stable instrumental profile, but we continued to monitor the control line. The resulting correlation coefficients and their significance levels are presented in Tables 4 and 5.
The HET/HRS data show statistically significant correlations between and RV for TYC 0684-00553-1 . A strong correlation between BIS and is present for BD+48 740 , which is mirrored in the Flat GC analysis. This strong correlation is also visible for vs. BIS in Flat GC for TYC 3263-02180-1 . Weak iodine lines affect the analysis of these two objects.
The three stars HD 238914 , TYC 3263-02180-1 and TYC 3300-00133-1 show a statistically significant correlation between and RV in the HARPS-N spectra. For the first object, HD 238914 , the correlation is present for all investigated parameter pairs in the and analysis. Because the chosen control line is not sensitive to chromospheric activity, we claim that these correlations have a non-stellar source. TYC 3300-00133-1 also shows a high, but not statistically significant correlation between RV and the control Fe line index, which is a strong suggestion that the nature of the observed and RV correlation is instrumental. In the absence of a similar correlation in the control Fe line and taking into account the increased (but not statistically significant) correlation between and BIS, we assume for TYC 3263-02180-1 that these results are an indication of stellar activity.
Statistically significant correlations are also present for TYC 0684-00553-1 : BIS seems to be correlated with , but the same correlation is present for , thus it is most likely caused by instrumental effects. TYC 3318-01333-1 shows a weak correlation between BIS and . For two objects, HD 181368 and TYC 3105-00152-1 , we detected correlations in the control line, but not in Hα.
| Star | HET/HRS star | HET/HRS flat GC | |||||||||||||||
|---|---|---|---|---|---|---|---|---|---|---|---|---|---|---|---|---|---|
| RV | BIS | RV | BIS | RV | BIS | RV | BIS | no | |||||||||
| r | p | r | p | r | p | r | p | r | p | r | p | r | p | r | p | ||
| BD+02 3497 | 12 | ||||||||||||||||
| BD+48 740 | 25 | ||||||||||||||||
| HD 181368 | 9 | ||||||||||||||||
| HD 188214 | 4 | ||||||||||||||||
| HD 238914 | 71 | ||||||||||||||||
| TYC 0684-00553-1 | 9 | ||||||||||||||||
| TYC 3105-00152-1 | 13 | ||||||||||||||||
| TYC 3263-02180-1 | 10 | ||||||||||||||||
| TYC 3300-00133-1 | 3 | ||||||||||||||||
| TYC 3318-01333-1 | 12 | ||||||||||||||||
| TYC 3663-01966-1 | 20 | ||||||||||||||||
| TYC 3930-00681-1 | 2 | ||||||||||||||||
| Star | TNG/HARPS-N | ||||||||
|---|---|---|---|---|---|---|---|---|---|
| RV | BIS | RV | BIS | no | |||||
| r | p | r | p | r | p | r | p | ||
| BD+02 3497 | 18 | ||||||||
| BD+48 740 | 16 | ||||||||
| HD 181368 | 18 | ||||||||
| HD 188214 | 19 | ||||||||
| HD 238914 | 15 | ||||||||
| TYC 0684-00553-1 | 18 | ||||||||
| TYC 3105-00152-1 | 22 | ||||||||
| TYC 3263-02180-1 | 19 | ||||||||
| TYC 3300-00133-1 | 11 | ||||||||
| TYC 3318-01333-1 | 16 | ||||||||
| TYC 3663-01966-1 | 12 | ||||||||
| TYC 3930-00681-1 | 11 | ||||||||
3.3 Calcium H & K doublet
The reversal profile in the cores of Ca H and K lines, that is, the emission structure at the core of the Ca absorption line, indicates increased stellar activity (Eberhard & Schwarzschild, 1913). The Ca II H & K lines are not available from the HET/HRS spectra, but they are located at the blue end of the TNG/HARPS-N spectra. This is the region with the lowest S/N of all HARPS-N echelle orders. The highest S/N for spectra or stars discussed in this paper is about 30, but it varies between 4 and 10 in general. Stacking spectra to achieve a better S/N is not possible here as the spectra were taken at least a month apart, which is the adopted observing strategy in the TAPAS project. We manually examined Ca H & K lines in every obtained TNG/HARPS-N spectrum and removed all epochs for which stellar spectrum in the Ca region was dominated by instrumental response from the Ca analysis. These were spectra with the lowest S/N, usually .
None of single-epoch observations for any star considered in this paper shows a reversal profile in the H & K line cores.
For every epoch (spectrum) of given star, we also calculated the index following Duncan et al. (1991), and we calibrated it to Mount Wilson scale with the formula provided in Lovis et al. (2011). The quantifies stellar chromospheric activity by comparing the flux in the cores of the H & K lines and two bands outside the lines. The average values and their scatter for all epochs for a given star are presented in Table 6; they are typical for giant stars (Zhao et al., 2013).
Investigating the connection between RVs and is challenging for the available data set. First, the low S/N may affect its results; second, the number of points for the statistics is quite low; and third, the observation span for TNG/HARPS-N data is shorter than three years. If the magnetic cycle is longer than that, we may therefore miss it (i.e., the case of Tau discussed in Aurière et al. 2015). To check whether the measured RVs are connected with the indexes, we calculated the linear correlation coefficients between the RVs and . As the blue end of the HARPS-N spectrum has a low S/N, we calculated the correlation between the index and the S/N to test if the S/N might be responsible for potential correlations. The results of this analysis are presented in Table 6.
We found a statistically significant correlation between the RVs and the activity indicator for one star - TYC 3930-00681-1 . This means that for this star, the variability in the RVs is associated with stellar activity. For two other objects, BD+48 740 and HD 181368 , the analysis may not be reliable because there is a weak, but statistically significant correlation between and the S/N.
| Star | p | p | No | ||||
|---|---|---|---|---|---|---|---|
| BD+02 3497 | |||||||
| BD+48 740 | |||||||
| HD 181368 | |||||||
| HD 188214 | |||||||
| HD 238914 | |||||||
| TYC 0684-00553-1 | |||||||
| TYC 3105-00152-1 | |||||||
| TYC 3263-02180-1 | |||||||
| TYC 3300-00133-1 | |||||||
| TYC 3318-01333-1 | |||||||
| TYC 3663-01966-1 | |||||||
| TYC 3930-00681-1 |
3.4 Photometry
Stellar activity can also manifest itself through changes in brightness. All our targets have been observed in large photometric surveys. We collected available data for them from several different catalogs: ASAS (Pojmanski, 1997), NSVS (Woźniak et al., 2004), Hipparcos (Perryman & ESA, 1997), and SuperWASP (Pollacco et al., 2006). Table 7 presents the summary of the collected data. In data sets with many observing epochs (a star was observed multiple times in a one-day period), the data were resampled to one-day bins. For stars that are included in multiple catalogs, we considered the longest set or the set with the most points to be the most reliable. We searched for signals in the Lomb-Scargle periodogram for which the false-alarm probability (FAP) is greater than . The photometric data sets present a measurable signal in the periodograms for only five stars.
| Star | Catalog | No. of points | Time range [d] | Av. bright. [mag] | period [d] | Power |
|---|---|---|---|---|---|---|
| BD+02 3497 | ASAS | p m 0.014 | ||||
| NSVS | p m 0.031 | - | - | |||
| BD+48 740 | Hipparcos | p m 0.017 | - | - | ||
| SuperWASP | p m 0.047 | |||||
| HD 181368 | ASAS | p m 0.012 | - | - | ||
| NSVS | p m 0.054 | - | - | |||
| HD 188214 | ASAS | p m 0.012 | ||||
| NSVS | p m 0.029 | - | - | |||
| HD 238914 | Hipparcos | p m 0.023 | - | - | ||
| NSVS | p m 0.018 | - | - | |||
| SuperWASP | p m 0.019 | - | - | |||
| TYC 0684-00553-1 | ASAS | p m 0.017 | - | - | ||
| NSVS | p m 0.018 | |||||
| TYC 3105-00152-1 | NSVS | p m 0.023 | - | - | ||
| TYC 3263-02180-1 | Hipparcos | p m 0.006 | - | - | ||
| TYC 3300-00133-1 | NSVS | p m 0.020 | - | - | ||
| SuperWASP | p m 0.024 | - | - | |||
| TYC 3318-01333-1 | NSVS | p m 0.021 | - | - | ||
| SuperWASP | p m 0.011 | - | - | |||
| TYC 3663-01966-1 | NSVS | p m 0.030 | - | - | ||
| SuperWASP | p m 0.011 | - | - | |||
| TYC 3930-00681-1 | NSVS | p m 0.016 | - | - | ||
| SuperWASP | p m 0.023 |
4 Keplerian analysis
To determine the orbital parameters, we combined the global genetic algorithm (GA; Charbonneau 1995) with the MPFit algorithm for the fitting (Markwardt, 2009). This hybrid approach was described by Goździewski et al. (2003); Goździewski & Migaszewski (2006); Goździewski et al. (2007). The range of Keplerian orbital parameters found with the GA was searched with the RVLIN (Wright & Howard, 2009) code, which we modified to introduce stellar jitter as a free parameter for fitting (Ford & Gregory, 2007; Johnson et al., 2011) the optimal solution. The uncertainties were estimated using the bootstrapping method (Murdoch et al., 1993; Kuerster et al., 1997; Marcy et al., 2005; Wright et al., 2007).
For a more detailed description of the Keplerian analysis that is briefly presented in this section, we refer to the first TAPAS paper, Niedzielski et al. (2015).
5 Lithium, beryllium, and carbon abundances and carbon isotopic ratios
The Li abundances for 14 stars were derived in Adamów et al. (2014) and Adamów et al. (2015). We used the same method to calculate the Li abundance of HD 181368 .
The carbon isotopic ratio is an indicator of the evolutionary status of a star. To determine it, we combined all available TNG/HARPS-N spectra for a given star with an S/N higher than 30, which resulted in one spectrum with a high S/N and high resolution. In a first step, we analyzed two bands in two spectral ranges, and to calculate the carbon abundance. After setting the carbon abundance, we determined the using the CH band at . These two steps of the analysis were made with the synth driver, which is part of the MOOG222 http://www.as.utexas.edu/chris/moog.html stellar line analysis code (Sneden, 1973). The S/N values for the combined spectra, the obtained carbon abundances, and for are presented in Table 8.
Low beryllium abundances for stars on the RGB are expected because of the depletion at the first dredge-up episode and because non-standard mixing processes start after the dredge-up phase. A more detailed description of A(Be) evolution along the RGB can be found in Takeda & Tajitsu (2014).
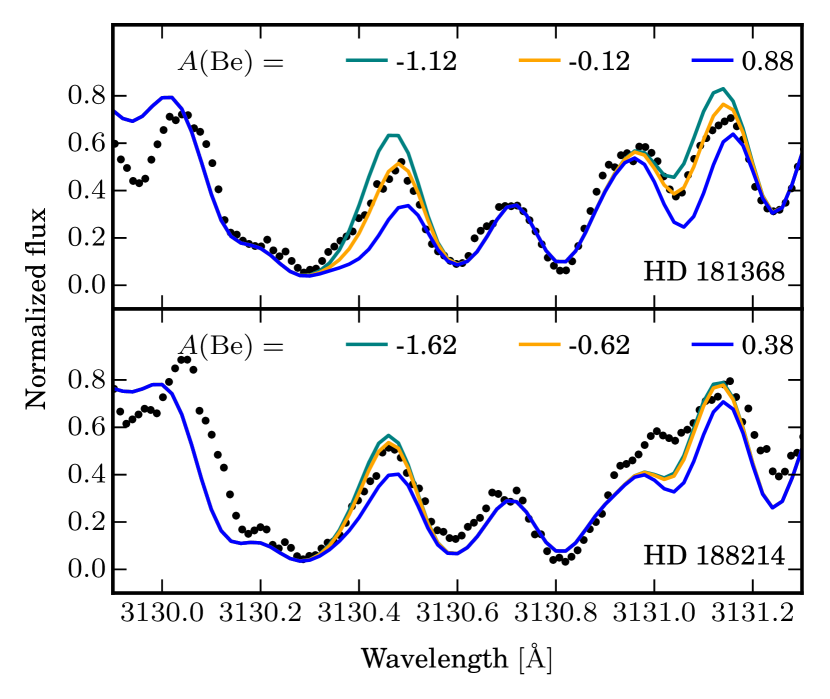
Beryllium abundances were determined using MOOG synthetic spectrum fitting driver in the spectral range. The analysis included two Be II lines at and . For giant stars, these lines are located in a crowded spectral region and are heavily blended, mostly with iron and CH and OH bands. Because of this, the continuum level is difficult to define. To obtain a proper continuum, we rescaled the observed spectrum around the Be lines so that it fitted the synthetic model as well as possible. The adopted carbon abundances and ratios we obtained are presented in Table 8. Oxygen abundances come from Adamów et al. (2014), that is, [O/H]= -0.13 and [O/H]= 0.17 for HD 181368 and HD 188214 , respectively. We adopted the solar value for beryllium (Asplund et al., 2009). The best fit of the synthetic spectrum in the Be spectral region is provided using for HD 181368 and for HD 188214 .
| Star | No. | S/N | [C/H] | |
|---|---|---|---|---|
| BD+02 3497 | ||||
| BD+48 740 | ||||
| HD 181368 | ||||
| HD 188214 | ||||
| HD 238914 | ||||
| TYC 0684-00553-1 | ||||
| TYC 3105-00152-1 | ||||
| TYC 3263-02180-1 | ||||
| TYC 3300-00133-1 | ||||
| TYC 3318-01333-1 | ||||
| TYC 3663-01966-1 | ||||
| TYC 3930-00681-1 |
6 Results
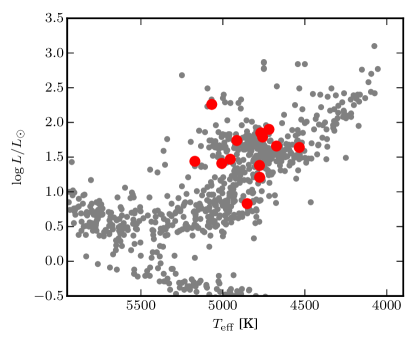
The basic parameters of the stars studied in this paper are presented in Table 1. Table 3 delivers a short summary of radial velocity measurements and line bisector analysis. In Tables 4,5 and 6 we present a summary of the spectral activity indicators, and indexes. An overview of the Fourier analysis for the available photometry of the program stars is presented in Table 7. Finally, a summary of the analysis is presented in Table 8. To illustrate the current evolutionary status of all our Li-rich giants (supported by results of our analysis) we present them together with the complete PTPS sample of stars in H-R diagram in Figure 1.
6.1 Stellar activity indicators
We investigated four indicators of stellar activity to check if it is a likely source of observed RV variations. Based on collected RVs and stellar spectra we identified three active stars: TYC 3930-00681-1 (correlation between RV and ), TYC 3263-02180-1 (RV vs. BIS and RV vs. correlations) and BD+02 3495 (RV vs. BIS correlation).
A comparison of statistically significant periods detected in the available photometry for our targets stars (with false alarm probability ) is presented in Table 7 with our estimates of the maximum rotation period derived from the estimated rotational velocity presented in Table 1 shows that the available data allow for periodic stellar surface activity may be related to rotation (spots) in the case of two stars: BD+48 740 , TYC 0684-00553-1 . In the case of HD 188214 the period detected in ASAS photometry is way too long to be connected with the rotation period of less than 76 days. In the case of BD+02 3497 and TYC 3930-00681-1 the periods present in the photometric data are very similar to the lunar period from which they most likely originate.
6.2 Li-rich giants with stellar companions
In addition to TYC 0405-01700-1 and TYC 3314-01371-1 presented in Adamów et al. (2014) we found one more Li-rich giant with a stellar companion. HD 181368 , originally classified as a subgiant in PTPS sample Niedzielski & Wolszczan (2008), was found by Deka-Szymankiewicz et al. (2018) to be actually a giant.
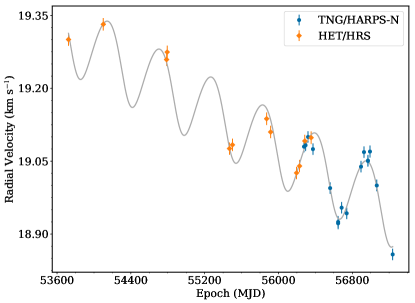
We collected 27 epochs of RV data (9 from HET/HRS and 18 from TNG/HARPS) between MJD= 54257 and 57238. There are no signs of stellar activity for this star, either in photometric data or line bisectors, that could explain the high amplitude of the RV variations (almost ), hence we check the hypothesis that HD 181368 hosts a companion. The strongest signal in the periodogram for RVs refers to the orbital period of 1753 days, less than two times shorter that the time period covered with observations. Keplerian analysis of this signal led to solution that indicates that HD 181368 hosts a low mass stellar companion. But after removing the Keplerian fit from the RV data, we got a strong, periodic signal ( days) in RV residuals, that could be interpreted as an additional planetary mass companion. Both objects would orbit HD 181368 on very eccentric orbits () what might raise questions about the long term stability of such a system. Another solution is to assume that the signal observed in the periodogram is caused by the fact that the cadence of the observations is short compared to the orbital period, hence the Lomb-Scargle analysis signal in RVs may not be reliable.
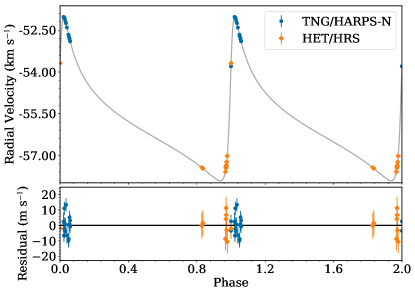
During a second approach to Keplerian fitting we chose to explore the parameter space with longer orbital periods. Results of that analysis are presented in Table 3 and the RV measurements and the fit are depicted in Fig. 3. As a result, we got an orbital fit with low RMS and no additional signal in residua. The companion is a low mass star with on a very elliptical, long period orbit. The semi-major axis of 14.8 au would place it between orbits of Saturn and Uranus in Solar System.
HD 181368 has a typical spectrum of a red giant. We did not observe any distortion in the shape of CCF functions that could prove that the companion contributes to observed spectrum. This star is one of two objects we measured Be abundance. Obtained is typical for a star at this evolutionary stage. Therefore, for HD 181368 Li enhancement is not associated with elevated Be abundance.
| Parameter | HD 181368 b | BD+48 740 b | HD 238914 b | TYC 3318-01333-1 b | TYC 3663-01966-1 b | TYC 3105-00152-1 b |
|---|---|---|---|---|---|---|
| (days) | ||||||
| (MJD) | ||||||
| () | ||||||
| (deg) | ||||||
| () | ||||||
| () | ||||||
| () | ||||||
| (/ day) | - | - | - | - | - | |
| offset () | ||||||
| () | ||||||
| 1.29 | ||||||
| RMS () | 18.7 | |||||
| 41 | 36 |
6.3 Li-rich giants with planetary-mass companions
We report here two new candidates for planetary-mass companions to Li-rich giants and present a confirmation and updated parameters for BD+48 740 .
6.3.1 BD+48 740 : updated orbit
This is a , (Adamczyk et al., 2016), giant star. It was the first Li-rich giant reported as a potential planetary host by Adamów et al. (2012a) and a possible case of Li enrichment by engulfment of close-in planets.
The low carbon isotopic ratio of obtained by us indicates that BD+48 740 completed FDU depletion and is a regular giant on the RGB.
In addition to the 15 epochs of precise RV presented in Adamów et al. (2014), we collected 11 new RV measurements from HET/HRS and 16 new RV measurements with HARPS-N under the TAPAS project for this star. In the extended set of observations, the Keplerian hypothesis concerning the apparent RV variations is still valid: no RV vs. line bisector correlation was found, and no indication of stellar activity can be extracted from existing data. The periodic signal in SuperWASP photometry may indicate a spot rotating with a star, but because of the very different period, it is unrelated to the observed Keplerian RV signal.
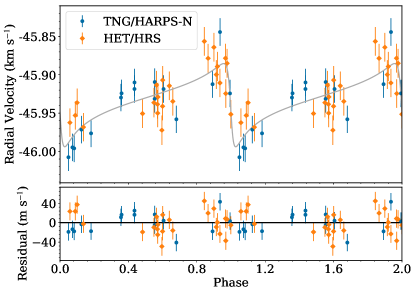
The updated orbital solutions for this star are based on the total number of 41 RV measurements obtained over 3491 days, between MJD = 53747.2 and MJD=57238.2. New orbital parameters for this system are presented in Table 3, and the best Keplerian fit is shown in Fig. 4. The updated set of orbital parameters is very similar to the original set. We therefore confirm our previous finding that this star is a good candidate for a planetary host with a companion with a minimum mass of on a very elliptical orbit ().
6.3.2 HD 238914 : a giant planet in 5.7 au orbit
The source HD 238914 (BD+59 1909, TYC 3917-01107-1) is a (Høg et al., 2000), (Gaia Collaboration et al., 2016) star in Draco. Atmospheric parameters derived by Zieliński et al. (2012) are presented in Table 1 together with physical parameters derived by Deka-Szymankiewicz et al. (2018). This star is a giant () with a mass of , radius (Adamczyk et al., 2016) and . The advanced evolutionary stage is confirmed with a low ratio.
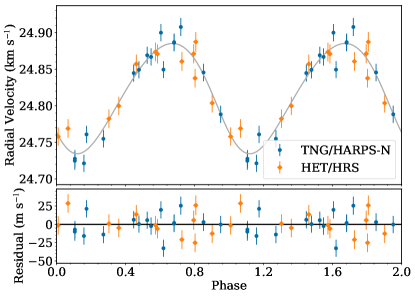
We collected a total number of 86 epochs of RV measurements for this object between MJD = 53294.1 and MJD = 57238.1, spanning the time period of 3944 days. No indication of stellar activity was found in HET/HRS or TNG/HARPS-N data, which allowed for a Keplerian interpretation of the apparent RV variations. The observed RV changes presented in Fig. 5 can be explained by the presence of a companion on an eccentric orbit with . The orbital period is 4100 days (Table 3).
6.3.3 TYC 3318-01333-1 : a planet in a binary system
The source TYC 3318-01333-1 (Gaia 439327806662223744, 2MASS J03021978+4944389 ) is a (Høg et al., 2000) and (Gaia Collaboration et al., 2016) giant star with K, , and solar metallicity () in Perseus. According to Deka-Szymankiewicz et al. (2018), it has a mass of and a radius of . With and this star was classified as a Li-rich giant after the FDU stage.
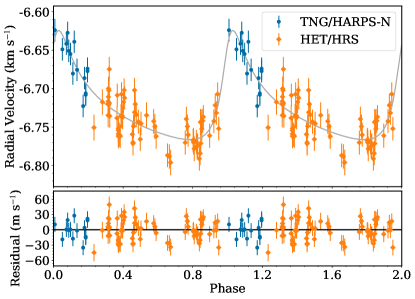
A total number of 28 epochs (12 from HET/HRS and 16 from TNG/HARPS-N) of RV measurements were collected for this object over 3514 days, between MJD = 53724.2 and MJD=57238.2. No correlation between RV and BIS is present in either HET/HRS or TNG/Harps data. The obtained data show a linear trend in RV vs. MJD (Fig. 6, upper panel) and periodic changes in RV, which may be interpreted as a presence of a low-mass companion (Fig. 6, lower panel). The orbital solution fitted to detrended data is presented in Table 3. TYC 3318-01333-1 is a potential host to a planet on a 562-days slightly elliptical () orbit.
After removing the fitted RV trend that is due to a distant companion, we checked the activity indicators again and found a statistically significant correlation between and RV (r=0.75, p=0.01) in the HET/HRS data. Since a similar correlation appears between and RV in the GC flat spectra (r=0.72, p=0.01) and no trace of any activity was found in TNG/HARPS-N data, we assume that this stems solely from weak iodine lines. For the detrended TNG/HARPS-N data, there is no correlation for vs. RV (r=0.01,p=98 for , r=0.08, p=78 for ), and neither does the index show a correlation with RV (r=0.33, p=0.26). Consequently, there is no compelling evidence of a stellar activity nature of the observed RV variations for TYC 3318-01333-1 .
6.4 Possible companions
For two of the stars, TYC 3663-01966-1 and TYC 3105-00152-1 , we collected enough data to perform the Keplerian analysis, but since the phase coverage is not complete, they require confirmation with future observations.
6.4.1 TYC 3663-01966-1 : a low-mass planet at the edge of engulfment
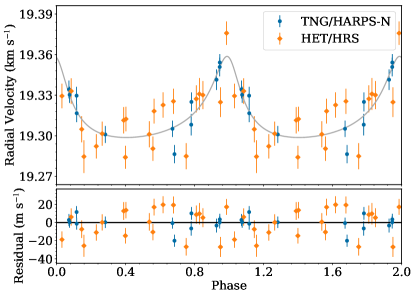
This star is a giant with following parameters: K, , , , and . We collected 32 epochs of RV measurements for this object, 20 from HET/HTS and 12 from TNG/HARPS-N. The observed RV variations are at least 11 times larger than the RV uncertainty and at least 4.6 times larger than the expected RV amplitude of the p-mode oscillations. The star is clearly RV variable and not only due to oscillations. There is no observational evidence of stellar activity in this star, so that the observed RV variations may be caused by Doppler shifts that are due to a companion. The observed variations seem to be periodic, with an amplitude of , hence we performed a Keplerian fit to the data. The RV curve we obtained is presented in Fig. 7, and the parameters of the best fit are included in Table 3. We found TYC 3663-01966-1 to be the possible host of a , close-in ( au, days) planet on an elliptical orbit ().
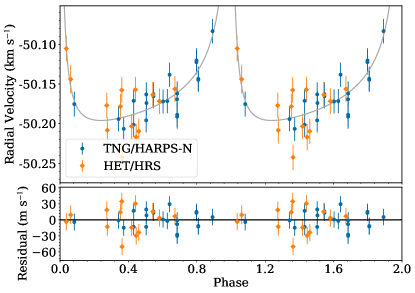
6.4.2 TYC 3105-00152-1 : a planet on a highly eccentric orbit
The source TYC 3105-00152-1 has K, , , , and and it is another case of a star that may host a low-mass companion on a very eccentric orbit. For this object we collected 14 HET/HRS observational data points within the PTPS project and an additional 16 epochs form TNG/HARPS-N follow-up.
The observed RV amplitude for TYC 3105-00152-1 is 24 times larger than the RV uncertainty and 14 times larger than the expected RV amplitude of the p-mode oscillations. The data collected here show no trace of stellar activity in TYC 3105-00152-1 , so that the only viable source of the variability seems to be a companion.
The obtained radial velocity curve is presented in Fig. 8, and details of the fitted Keplerian solution are listed in Table 3. A companion might orbit the star on a 339.5-day orbit with .
6.5 Single or unresolved stars
Seven stars in our sample of Li-rich giants are objects that we classified as single.
The most interesting of them is HD 107028 , the most Li-rich giant in our sample, a star described in detail in Adamów et al. (2015). This object is a very interesting case for Li studies, however, because it is a star on the early RGB phase and Li production could not have been triggered by the mechanisms that have been proposed for enrichment in giants as they occur in a later evolutionary stage.
Another two stars in this group are HD 188214 and TYC 3930-00681-1 , for which the estimated p-mode oscillation RV amplitudes in (sparse) HET/HRS data are comparable to the RV amplitude. Although the more numerous HARPS-N data show larger RV amplitudes, no significant periodic variations were detected.
TYC 3930-00681-1 shows a correlation between the observed HARPS-N RV variations and the index. We also detected a strong periodic signal in the available SuperWASP photometry for this object, but with a period of 27.91 days it is most likely attributable to lunar phases. We consider this star as single and active.
HD 188214 shows no trace of stellar activity in the spectra that were available to us. It does show a strong photometric period of 1471.1 days in the ASAS data, however. This may by physical, although it is apparently unconnected with the much slower rotation period of 71 days. The enhancement of Li does not occur simultaneously with the Be enrichment - of -0.62 for HD 188214 is low, and typical for giants at this evolutionary stage.
For the remaining four objects BD+02 3497 , TYC 0684-00553-1 , TYC 3263-02180-1 , and TYC 3300-00133-1 , we collected a sufficient number of observations to obtain conclusive orbital solutions, but it was not possible to identify any periodic signals in their RVs data that might have been generated by a low-mass companion. Three of them, TYC 0684-00553-1 , BD+02 3497 , and TYC 3263-02180-1 , show correlations between the RV and activity indicators, hence we consider them active.
7 Discussion
Our in-depth study of 12 of the 15 most Li abundant giants from the PTPS sample (Adamów et al., 2014) resulted in the discovery of two new candidates for planetary systems around Li-rich giants and in the confirmation of one that was presented in Adamów et al. (2012a). We also found one new stellar binary and two stars that appear to have planetary-mass companions. Another seven stars were found to be single.
Of special interest are two of the newly discovered planetary hosts, or host candidates, presented here. HD 238914 b is a unique planet, the most distant that orbits a giant star known so far ( au). It may only be compared to HD 14067 b (Wang et al., 2014), an object of higher mass () that does not reside that far away from its star ( au). Owing to its high eccentricity (), HD 238914 b cruises between 2.5 and 8.9 au, leaving little space for other planets in this system. At this orbital separation, the planet is likely to survive the evolution of its host at least up to the AGB phase.
Even more intriguing is the possible planetary companion of TYC 3663-01966-1 , an evolved (), extended (), very rare intermediate-mass (2.88 M⊙) star. Owing to its proximity to the star and to the high orbital eccentricity, its relatively low-mass () companion that we advocate for may periodically approach the red giant at only 4.5 stellar radii, which makes it potentially a perfect laboratory to study tidal interactions before it is eventually ingested by its sun. This potential planetary system certainly deserves more attention.
It is also worth mentioning that the updated orbit of BD+48 740 b confirms that this case has the most eccentric orbit () of a planet around a giant star (a record that may be beaten by TYC 3105-00152-1 , if confirmed with future observations).
7.1 Planet frequency around Li-rich giants in the PTPS sample
Altogether, the sample of the 15 most Li-rich giants in the PTPS sample contains three planetary-mass companions (one in a binary system), two possible planetary-mass companions, three binary systems, and seven single stars. In other words, of the stars in the PTPS Li-rich giant sample appear to have companions. The planet occurrence rate is therefore at least and may even be as high as . The binary star frequency is . Forty-seven percent of the PTPS Li-rich objects appear to be single. The frequency of RV-variable field red giants was estimated to be by Gunn & Griffin (1979). Mermilliod & Mayor (1980) found of the giants in open clusters to be RV variable. Harris & McClure (1983) found of the cluster giants to be RV variable. Mermilliod & Mayor (1989) found of the red giants in clusters to be RV variable. The frequency of RV-variable stars (binaries) in our sample appears to be consistent with these results.
The gas-giant planet fraction around evolved solar-mass stars with lower than solar metallicity was recently estimated by Reffert et al. (2015) as . The frequency of planets around the 15 most Li-rich giants in our sample is therefore about three times higher. Our results are more consistent with the results presented by these authors for giants with higher than solar metallicity (). The problem here is apparently the different sensitivity of our survey and that of Reffert et al. (2015). These authors assumed that they are sensitive to companion masses of with a period up to 2.3 years.
When we assume that the minimum mass of a companion detectable in our search is about and the maximum orbital separation is about 6 au, our results are more consistent with the frequency of planets around dwarfs presented by Cumming et al. (2008), that is, of the stars with gas giants with orbital periods d, typical for planets around giants.
However, the relatively high frequency of planetary-mass companions around Li-rich giants suggests a relation between the Li overabundance in giants and the presence of exoplanets.
7.2 Nature of eccentricity
Except for one object (TYC 3318-01333-1 ), all identified candidates for planetary hosts have planets on highly eccentric orbits with eccentricities of between 0.48 and 0.76, well above average for planets around evolved stars. The orbits of stellar companions around Li-rich giants appear to be more circular (, Adamów et al. 2015), except for HD 181368 with its .
Of other planets around Li-rich giants, orbital elements are available only for two: 8 UMi (HD 133086) (Kumar et al., 2011; Lee et al., 2015) and NGC 2423 3 (Carlberg et al., 2016). Contrary to the planets presented in this paper, they both reside on more circular orbits with and , respectively.
The engulfment of inner planets, and as a consequence, the disruption of a planetary system, is a good explanation for the high eccentricities as well as the Li enrichment. Aguilera-Gómez et al. (2016) calculated that an engulfment episode can explain a Li enrichment of up to , while higher abundances require other enrichment mechanisms. All but one of the potential hosts with low-mass companions discussed here have hence the engulfment scenario is feasible. TYC 3105-00152-1 is the exception with .
A strong indication of such a process might come from infrared excess, which should be associated with Li enhancement through engulfment episodes (Siess & Livio, 1999). The connection between Li enhancement and infrared excess was studied in Adamów et al. (2014) and Rebull et al. (2015). None the objects discussed here shows any excess in infrared photometry.
7.3 Connection to stellar clusters?
High eccentricity is rather uncommon in evolved planetary systems around giants, although the most recent discoveries of high-eccentricity systems (see, e.g., Wittenmyer et al. 2017 and the stars reported in this paper) seem to be reversing this trend. For main-sequence systems, high eccentricity has been suggested to imply a violent dynamical history of the observed systems or a Kozai resonance with a distant companion (Takeda & Rasio, 2005). In search for a scenario leading to such a configuration, we note that the most suitable environment in which dynamical interactions may produce planetary systems with a highly eccentric component and in which an enhanced probability of planet engulfment through star-planet collision may be witnessed are open clusters. According to simulations of the dynamical evolution of an open cluster member star hosting planets by Hao et al. (2013), up to 12 of the inner planets in their equal-planetary mass models may eventually collide with the stars. The outer planets gain high eccentricity in the process. Similar results were more recently obtained by Shara et al. (2016) in simulations of two-planet systems in open clusters. Star-planet collisions are only the extreme case of dynamical interactions between a multi-planet system and other open cluster members. The most common results in the simulations of the above mentioned authors are hot Jupiters in very tight orbits. We note that this process, together with stellar evolution that naturally leads to an ingestion of the inner planets and to star-planet collisions, creates ideal conditions for the pollution of the stellar surface with elements from one or more planets, possibly leading to an enhanced Li surface abundance and an enhanced eccentricity of the surviving planets.
We therefore checked whether our Li-rich giants with planets were members of a cluster, for which we used data on open clusters from Kharchenko et al. (2013). We found that three stars from our sample are located within three cluster radii () from open cluster centers: BD+02 3497 (Collinder 359), TYC 3300-00133-1 ( Per), and TYC 3318-01333-1 ( Per), the last star within . In the case of TYC 3318-01333-1 , we also found matching metallicities. However, neither RV nor proper motions match, which makes a cluster membership for these stars unlikely.
The simulations of Villaver et al. (2014) predict a modest decay of the semi-major axis and eccentricity before a planet is engulfed. This means that a high-eccentricity planet can sustain the RGB evolution at high eccentricity.
8 Conclusions
We presented two new candidates for planetary systems around Li-rich giants: HD 238914 with an companion in au, orbit, and TYC 3318-01333-1 , a component of a binary system with a companion in au, orbit. We have updated the orbital parameters for BD+48 740 and also found a binary Li-rich giant, HD 181368 , with an companion in au, orbit. In the analysis of another two Li-rich giants presented in this paper, TYC 3663-01966-1 and TYC 3105-00152-1 , we argue for planetary-mass companions in eccentric orbits, but we lack the data to prove it.
One out of three binary systems and two (four) out of three (five) planetary-mass companions orbit their hosts on eccentric orbits with . We note, however, that the other two Li-rich giant planets with available orbital elements, 8 UMi (HD 133086) (Kumar et al., 2011; Lee et al., 2015) and NGC 2423 3 (Carlberg et al., 2016), show more circular orbits ().
In our sample of the 15 most Li-rich giants from the PTPS, we find three planetary-mass companions, two possible planetary-mass companions, three binary systems and one binary with a planet, and seven single stars. The binary frequency of appears to be normal, but the planetary companions frequency is a factor of 3 higher than in the general sample of giants with planets (Reffert et al., 2015).
The high planet occurrence rate for Li-rich giants presented here suggests a relation between Li-abundance and planets from Li-rich giants and the pollution of the stellar surface with Li from a low-mass companion as the Li enhancement mechanism. The high eccentricity in the majority of the planetary systems we presented suggests previous dynamical interactions in these systems either with other planets within the system or with more distant, stellar companions. We therefore investigated the possibility of planetary system disruption through Kozai resonances in open clusters, but we found that none of our stars is a member of an open cluster. Neither did we find any trace of infrared excess, which is assumed to be associated with the engulfment process (de La Reza et al., 1997).
We found no Be surface abundance anomalies in the two Li-rich giants HD 181368 and HD 188214 . These two stars have low Be abundances, typical for their evolutionary stage. Although it is difficult to generalize these two estimates to all our stars, they clearly do not provide evidence of a planetary engulfment process in these stars.
The evolution of planetary systems, the main mechanisms of which are summarized by Veras (2016), is a complex process that is influenced by many factors. The Li-rich planetary hosts discussed here represent an interesting opportunity to study this problem in more detail.
Acknowledgements.
We would like to thank the referee, whose comments helped improve and clarify this manuscript. We also thank the HET, IAC, and ESO resident astronomers and telescope operators for their support. MA acknowledges the Mobility+III fellowship from the Polish Ministry of Science and Higher Education. AN was supported by the Polish National Science Centre grant no. UMO-2015/19/B/ST9/02937. EV acknowledges support from the Spanish Ministerio de Economía y Competitividad under grant AYA2013-45347P. KK was funded in part by the Gordon and Betty Moore Foundation’s Data-Driven Discovery Initiative through Grant GBMF4561. This research was supported in part by PL-Grid Infrastructure. The HET is a joint project of the University of Texas at Austin, the Pennsylvania State University, Stanford University, Ludwig-Maximilians-Universität München, and Georg-August-Universität Göttingen. The HET is named in honor of its principal benefactors, William P. Hobby and Robert E. Eberly. The Center for Exoplanets and Habitable Worlds is supported by the Pennsylvania State University, the Eberly College of Science, and the Pennsylvania Space Grant Consortium. This research has made use of the SIMBAD database, operated at CDS, Strasbourg, France. This research has made use of NASA’s Astrophysics Data System. The acknowledgements were compiled using the Astronomy Acknowledgement Generator. This research made use of SciPy (Jones et al., 2001). This research made use of the yt-project, a toolkit for analyzing and visualizing quantitative data (Turk et al., 2011). This research made use of matplotlib, a Python library for publication quality graphics (Hunter, 2007). This research made use of Astropy, a community-developed core Python package for Astronomy (Astropy Collaboration et al., 2013). IRAF is distributed by the National Optical Astronomy Observatory, which is operated by the Association of Universities for Research in Astronomy (AURA) under cooperative agreement with the National Science Foundation (Tody, 1993). This research made use of NumPy (Van Der Walt et al., 2011).References
- Adamczyk et al. (2016) Adamczyk, M., Deka-Szymankiewicz, B., & Niedzielski, A. 2016, A&A, 587, A119
- Adamów et al. (2012a) Adamów, M., Niedzielski, A., Villaver, E., Nowak, G., & Wolszczan, A. 2012a, ApJ, 754, L15
- Adamów et al. (2014) Adamów, M., Niedzielski, A., Villaver, E., Wolszczan, A., & Nowak, G. 2014, A&A, 569, A55
- Adamów et al. (2012b) Adamów, M., Niedzielski, A., & Wolszczan, A. 2012b, Memorie della Societa Astronomica Italiana Supplementi, 22, 48
- Adamów et al. (2015) Adamów, M., M., Niedzielski, A., Villaver, E., et al. 2015, A&A, 581, A94
- Aguilera-Gómez et al. (2016) Aguilera-Gómez, C., Chanamé, J., Pinsonneault, M. H., & Carlberg, J. K. 2016, ApJ, 829, 127
- Alexander (1967) Alexander, J. B. 1967, The Observatory, 87, 238
- Asplund et al. (2009) Asplund, M., Grevesse, N., Sauval, A. J., & Scott, P. 2009, ARA&A, 47, 481
- Astropy Collaboration et al. (2013) Astropy Collaboration, Robitaille, T. P., Tollerud, E. J., et al. 2013, A&A, 558, A33
- Aurière et al. (2015) Aurière, M., Konstantinova-Antova, R., Charbonnel, C., et al. 2015, A&A, 574, A90
- Bharat Kumar et al. (2015) Bharat Kumar, Y., Reddy, B. E., Muthumariappan, C., & Zhao, G. 2015, A&A, 577, A10
- Butler et al. (1996) Butler, R. P., Marcy, G. W., Williams, E., et al. 1996, PASP, 108, 500
- Cameron & Fowler (1971) Cameron, A. G. W. & Fowler, W. A. 1971, ApJ, 164, 111
- Carlberg et al. (2016) Carlberg, J. K., Smith, V. V., Cunha, K., & Carpenter, K. G. 2016, ApJ, 818, 25
- Charbonneau (1995) Charbonneau, P. 1995, ApJS, 101, 309
- Cosentino et al. (2012) Cosentino, R., Lovis, C., Pepe, F., et al. 2012, in Society of Photo-Optical Instrumentation Engineers (SPIE) Conference Series, Vol. 8446, Society of Photo-Optical Instrumentation Engineers (SPIE) Conference Series
- Cumming et al. (2008) Cumming, A., Butler, R. P., Marcy, G. W., et al. 2008, PASP, 120, 531
- de La Reza et al. (1997) de La Reza, R., Drake, N. A., da Silva, L., Torres, C. A. O., & Martin, E. L. 1997, ApJ, 482, L77
- Deka-Szymankiewicz et al. (2018) Deka-Szymankiewicz, B., Niedzielski, A., Adamczyk, M., et al. 2018, ArXiv e-prints [arXiv:1801.02899]
- Dekker et al. (2000) Dekker, H., D’Odorico, S., Kaufer, A., Delabre, B., & Kotzlowski, H. 2000, in Proc. SPIE, Vol. 4008, Optical and IR Telescope Instrumentation and Detectors, ed. M. Iye & A. F. Moorwood, 534–545
- Delgado Mena et al. (2016) Delgado Mena, E., Tsantaki, M., Sousa, S. G., et al. 2016, A&A, 587, A66
- Duncan et al. (1991) Duncan, D. K., Vaughan, A. H., Wilson, O. C., et al. 1991, ApJS, 76, 383
- Eberhard & Schwarzschild (1913) Eberhard, G. & Schwarzschild, K. 1913, ApJ, 38, 292
- Ford & Gregory (2007) Ford, E. B. & Gregory, P. C. 2007, in ASP Conference Series, Vol. 371, Statistical Challenges in Modern Astronomy IV, ed. G. J. Babu & E. D. Feigelson, 189
- Freudling et al. (2013) Freudling, W., Romaniello, M., Bramich, D. M., et al. 2013, A&A, 559, A96
- Gaia Collaboration et al. (2016) Gaia Collaboration, Brown, A. G. A., Vallenari, A., et al. 2016, A&A, 595, A2
- Gomes da Silva et al. (2012) Gomes da Silva, J., Santos, N. C., Bonfils, X., et al. 2012, A&A, 541, A9
- Goździewski et al. (2003) Goździewski, K., Konacki, M., & Maciejewski, A. J. 2003, ApJ, 594, 1019
- Goździewski et al. (2007) Goździewski, K., Maciejewski, A. J., & Migaszewski, C. 2007, ApJ, 657, 546
- Goździewski & Migaszewski (2006) Goździewski, K. & Migaszewski, C. 2006, A&A, 449, 1219
- Gunn & Griffin (1979) Gunn, J. E. & Griffin, R. F. 1979, AJ, 84, 752
- Hao et al. (2013) Hao, W., Kouwenhoven, M. B. N., & Spurzem, R. 2013, MNRAS, 433, 867
- Harris & McClure (1983) Harris, H. C. & McClure, R. D. 1983, ApJ, 265, L77
- Høg et al. (2000) Høg, E., Fabricius, C., Makarov, V. V., et al. 2000, A&A, 355, L27
- Hunter (2007) Hunter, J. D. 2007, Computing In Science & Engineering, 9, 90
- Johnson et al. (2011) Johnson, J. A., Clanton, C., Howard, A. W., et al. 2011, ApJS, 197, 26
- Jones et al. (2001) Jones, E., Oliphant, T., Peterson, P., & Others. 2001, SciPy: Open source scientific tools for Python
- Kharchenko et al. (2013) Kharchenko, N. V., Piskunov, A. E., Schilbach, E., Röser, S., & Scholz, R.-D. 2013, A&A, 558, A53
- Kjeldsen & Bedding (1995) Kjeldsen, H. & Bedding, T. R. 1995, A&A, 293, 87
- Koch et al. (2011) Koch, A., Lind, K., & Rich, R. M. 2011, ApJ, 738, L29
- Kuerster et al. (1997) Kuerster, M., Schmitt, J. H. M. M., Cutispoto, G., & Dennerl, K. 1997, A&A, 320, 831
- Kumar et al. (2011) Kumar, Y. B., Reddy, B. E., & Lambert, D. L. 2011, ApJ, 730, L12
- Lebzelter et al. (2012) Lebzelter, T., Uttenthaler, S., Busso, M., Schultheis, M., & Aringer, B. 2012, A&A, 538, A36
- Lee et al. (2015) Lee, B.-C., Park, M.-G., Lee, S.-M., et al. 2015, A&A, 584, A79
- Lovis et al. (2011) Lovis, C., Dumusque, X., Santos, N. C., et al. 2011, ArXiv e-prints [arXiv:1107.5325]
- Maciejewski et al. (2013) Maciejewski, G., Niedzielski, A., Wolszczan, A., et al. 2013, AJ, 146, 147
- Marcy & Butler (1992) Marcy, G. W. & Butler, R. P. 1992, PASP, 104, 270
- Marcy et al. (2005) Marcy, G. W., Butler, R. P., Vogt, S. S., et al. 2005, ApJ, 619, 570
- Markwardt (2009) Markwardt, C. B. 2009, in Astronomical Society of the Pacific Conference Series, Vol. 411, Astronomical Data Analysis Software and Systems XVIII, ed. D. A. Bohlender, D. Durand, & P. Dowler, 251
- Mermilliod & Mayor (1980) Mermilliod, J. C. & Mayor, M. 1980, in IAU Symposium, Vol. 85, Star Clusters, ed. J. E. Hesser, 361
- Mermilliod & Mayor (1989) Mermilliod, J.-C. & Mayor, M. 1989, A&A, 219, 125
- Meunier et al. (2017a) Meunier, N., Lagrange, A.-M., Mbemba Kabuiku, L., et al. 2017a, A&A, 597, A52
- Meunier et al. (2017b) Meunier, N., Mignon, L., & Lagrange, A.-M. 2017b, A&A, 607, A124
- Murdoch et al. (1993) Murdoch, K. A., Hearnshaw, J. B., & Clark, M. 1993, ApJ, 413, 349
- Niedzielski et al. (2016a) Niedzielski, A., Deka-Szymankiewicz, B., Adamczyk, M., et al. 2016a, A&A, 585, A73
- Niedzielski et al. (2007) Niedzielski, A., Konacki, M., Wolszczan, A., et al. 2007, ApJ, 669, 1354
- Niedzielski et al. (2016b) Niedzielski, A., Villaver, E., Nowak, G., et al. 2016b, A&A, 588, A62
- Niedzielski et al. (2016c) Niedzielski, A., Villaver, E., Nowak, G., et al. 2016c, A&A, 589, L1
- Niedzielski et al. (2015) Niedzielski, A., Villaver, E., Wolszczan, A., et al. 2015, A&A, 573, A36
- Niedzielski & Wolszczan (2008) Niedzielski, A. & Wolszczan, A. 2008, in IAU Symposium, Vol. 249, Exoplanets: Detection, Formation and Dynamics, ed. Y.-S. Sun, S. Ferraz-Mello, & J.-L. Zhou, 43–47
- Nowak (2012) Nowak, G. 2012, PhD thesis, Nicolaus Copernicus Univ., Toruń, Poland
- Nowak et al. (2013) Nowak, G., Niedzielski, A., Wolszczan, A., Adamów, M., & Maciejewski, G. 2013, ApJ, 770, 53
- Pepe et al. (2002) Pepe, F., Mayor, M., Galland, F., et al. 2002, A&A, 388, 632
- Perryman & ESA (1997) Perryman, M. A. C. & ESA, eds. 1997, ESA Special Publication, Vol. 1200, The HIPPARCOS and TYCHO catalogues. Astrometric and photometric star catalogues derived from the ESA HIPPARCOS Space Astrometry Mission
- Pojmanski (1997) Pojmanski, G. 1997, Acta Astron., 47, 467
- Pollacco et al. (2006) Pollacco, D. L., Skillen, I., Collier Cameron, A., et al. 2006, PASP, 118, 1407
- Privitera et al. (2016) Privitera, G., Meynet, G., Eggenberger, P., et al. 2016, A&A, 593, L15
- Queloz (1995) Queloz, D. 1995, in IAU Symposium, Vol. 167, New Developments in Array Technology and Applications, ed. A. G. D. Philip, K. Janes, & A. R. Upgren, 221
- Ramsey et al. (1998) Ramsey, L. W., Adams, M. T., Barnes, T. G., et al. 1998, in Society of Photo-Optical Instrumentation Engineers (SPIE) Conference Series, Vol. 3352, Society of Photo-Optical Instrumentation Engineers (SPIE) Conference Series, ed. L. M. Stepp, 34–42
- Rebull et al. (2015) Rebull, L. M., Carlberg, J. K., Gibbs, J. C., et al. 2015, AJ, 150, 123
- Reffert et al. (2015) Reffert, S., Bergmann, C., Quirrenbach, A., Trifonov, T., & Künstler, A. 2015, A&A, 574, A116
- Robertson et al. (2013) Robertson, P., Endl, M., Cochran, W. D., & Dodson-Robinson, S. E. 2013, ApJ, 764, 3
- Sackmann & Boothroyd (1999) Sackmann, I.-J. & Boothroyd, A. I. 1999, ApJ, 510, 217
- Shara et al. (2016) Shara, M. M., Hurley, J. R., & Mardling, R. A. 2016, ApJ, 816, 59
- Shetrone et al. (2007) Shetrone, M., Cornell, M. E., Fowler, J. R., et al. 2007, PASP, 119, 556
- Siess & Livio (1999) Siess, L. & Livio, M. 1999, MNRAS, 308, 1133
- Sneden (1973) Sneden, C. 1973, ApJ, 184, 839
- Takeda & Rasio (2005) Takeda, G. & Rasio, F. A. 2005, ApJ, 627, 1001
- Takeda & Tajitsu (2014) Takeda, Y. & Tajitsu, A. 2014, PASJ, 66, 91
- Tody (1993) Tody, D. 1993, in Astronomical Society of the Pacific Conference Series, Vol. 52, Astronomical Data Analysis Software and Systems II, ed. R. J. Hanisch, R. J. V. Brissenden, & J. Barnes, 173
- Tull (1998) Tull, R. G. 1998, in Society of Photo-Optical Instrumentation Engineers (SPIE) Conference Series, Vol. 3355, Society of Photo-Optical Instrumentation Engineers (SPIE) Conference Series, ed. S. D’Odorico, 387–398
- Turk et al. (2011) Turk, M. J., Smith, B. D., Oishi, J. S., et al. 2011, ApJS, 192, 9
- Van Der Walt et al. (2011) Van Der Walt, S., Colbert, S. C., & Varoquaux, G. 2011, Computing in Science & Engineering, 13, 22
- Veras (2016) Veras, D. 2016, Royal Society Open Science, 3, 150571
- Villaver & Livio (2009) Villaver, E. & Livio, M. 2009, ApJ, 705, L81
- Villaver et al. (2014) Villaver, E., Livio, M., Mustill, A. J., & Siess, L. 2014, ApJ, 794, 3
- Villaver et al. (2017) Villaver, E., Niedzielski, A., Wolszczan, A., et al. 2017, A&A, 606, A38
- Wallerstein & Sneden (1982) Wallerstein, G. & Sneden, C. 1982, ApJ, 255, 577
- Wang et al. (2014) Wang, L., Sato, B., Omiya, M., et al. 2014, PASJ, 66, 118
- Wittenmyer et al. (2017) Wittenmyer, R. A., Jones, M. I., Horner, J., et al. 2017, ArXiv e-prints [arXiv:1711.05378]
- Woosley & Weaver (1995) Woosley, S. E. & Weaver, T. A. 1995, ApJS, 101, 181
- Woźniak et al. (2004) Woźniak, P. R., Vestrand, W. T., Akerlof, C. W., et al. 2004, AJ, 127, 2436
- Wright & Howard (2009) Wright, J. T. & Howard, A. W. 2009, ApJS, 182, 205
- Wright et al. (2007) Wright, J. T., Marcy, G. W., Fischer, D. A., et al. 2007, ApJ, 657, 533
- Zhao et al. (2013) Zhao, J. K., Oswalt, T. D., Zhao, G., et al. 2013, AJ, 145, 140
- Zieliński et al. (2012) Zieliński, P., Niedzielski, A., Wolszczan, A., Adamów, M., & Nowak, G. 2012, A&A, 547, A91