A survey for low-mass stellar and substellar members of the Hyades open cluster.
Abstract
Context. Unlike young open clusters (with ages 250 Myr), the Hyades cluster (age 600 Myr) has a clear deficit of very low-mass stars (VLM) and brown dwarfs (BD). Since this open cluster has a low stellar density and covers several tens of square degrees on the sky, extended surveys are required to improve the statistics of the VLM/BD objects in the cluster.
Aims. We search for new VLM stars and BD candidates in the Hyades cluster to improve the present-day cluster mass function down to substellar masses.
Methods. An imaging survey of the Hyades with a completeness limit of in the band and in the band was carried out with the 2k 2k CCD Schmidt camera at the 2m Alfred Jensch Telescope in Tautenburg. We performed a photometric selection of the cluster member candidates by combining results of our survey with 2MASS photometry.
Results. We present a photometric and proper motion survey covering 23.4 deg2 in the Hyades cluster core region. Using optical/IR colour-magnitude diagrams, we identify 66 photometric cluster member candidates in the magnitude range . The proper motion measurements are based on several all-sky surveys with an epoch difference of 60-70 years for the bright objects. The proper motions allowed us to discriminate the cluster members from field objects and resulted in 14 proper motion members of the Hyades. We rediscover Hy 6 as a proper motion member and classify it as a substellar object candidate (BD) based on the comparison of the observed colour-magnitude diagram with theoretical model isochrones.
Conclusions. With our results, the mass function of the Hyades continues to be shallow below indicating that the Hyades have probably lost their lowest mass members by means of dynamical evolution. We conclude that the Hyades core represents the ‘VLM/BD desert’ and that most of the substeller objects may have already left the volume of the cluster.
Key Words.:
stars: low-mass stars, brown dwarfs — stars: mass function — open cluster: individual: the Hyades1 Introduction
The accurate initial mass function (MF) of Galactic open clusters allows us to build up a picture of the initial conditions of cluster formation and to investigate their further evolution. The bright end of the mass function has been analysed in many detailed studies of bright clusters. In the last decades, on the other hand, deep photometric surveys of open clusters were focused on the faint MF end reaching out to the lowest mass members. The nearby open clusters are very convenient targets for this goal. In the solar neighbourhood there are a number of open clusters including the Pleiades, the Hyades, Praesepe (M44), and the Coma Berenices open cluster (Melotte 111). Extensive deep surveys of the Pleiades (age 120 Myr) have led to the discovery of a large population of very low-mass stars (VLM) and substellar members known as brown dwarfs (BDs) (Stauffer et al., 2007; Lodieu et al., 2012a; Zapatero Osorio et al., 2014; Bouy et al., 2015). A considerable low-mass population has also been discovered in some other younger stellar clusters (Lodieu et al., 2012b, Per:; Peña Ramírez et al., 2012, Ori:). These surveys showed that the initial conditions of star formation in stellar clusters were effective in creating low-mass members.
However, the proximity of a cluster also has the disadvantage of a large extension on the sky, which renders surveys for cluster membership difficult. Moreover, with cluster evolution the lowest mass members may escape from a cluster core (‘evaporate’ from the cluster) due to dynamical encounters and mix-up with the field objects (Terlevich, 1987; Kroupa, 1995; de La Fuente Marcos & de La Fuente Marcos, 2000). Therefore, detection of these objects will be more complicated. de La Fuente Marcos & de La Fuente Marcos (2000) suggested that this effect can already be noticeable in the clusters with ages of 200 Myr. The first surveys of the intermediate-age clusters, which covered only a small percent of the cluster core areas, did not find any significant population of low-mass members, similar to what was found for the Pleiades. The first studies of the Coma open cluster (age Myr) showed that this cluster has a deficit of low-mass stars in comparison to the younger clusters (Deluca & Weis, 1981; Odenkirchen et al., 1998). The recent and deeper surveys of this cluster covered a larger field and were reaching into the substellar domain. They confirmed that this deficit seems to be intrinsic and this finding (Casewell et al., 2006; Melnikov & Eislöffel, 2012) supports the idea that the depletion is caused by dynamical evolution. Recent studies of Praesepe (600 Myr), another open cluster of similar age, based on the analysis of all-sky surveys UKIDSS (Boudreault et al., 2012) and 2MASS, PPMXL, Pan-STARRS (Wang et al., 2014) found conflicting results. Boudreault et al. (2012) found that the Praesepe MF is consistent with that of the Galactic disk population down to , whereas Wang et al. (2014) concluded that the cluster MF shows a deficit of members below . Therefore, deep wide-field surveys of intermediate-aged open clusters (with ages of 450–600 Myr) are required to improve the comparison of their mass functions with those of the younger clusters and construct a more reliable scenario of how open clusters evolve with age.
The Hyades open cluster (d=46 pc) with age 600 Myr (age=625 Myr, Perryman et al., 1998), which has a Pleiades-like stellar population, is one of the most studied open clusters located in the solar neighbourhood. The earliest wide-field search for Hyades members covering 110 deg2 discovered a deficit of M-type dwarfs in this cluster (Reid, 1992, 1993) with respect to the solar neighbourhood mix. From these observations Reid (1992) derived a gravitational binding radius of 10.5 pc and a total cluster mass of 410–480 . Deeper imaging surveys, which covered only small areas to reach fainter members did not lead to a discovery of any significant population of such objects (Reid & Hawley, 1999; Reid & Mahoney, 2000; Gizis et al., 1999). A survey covering 10.5 deg2 by Dobbie et al. (2002) also failed to find any new low-mass members and recovered only the known stellar member RHy 29 (Reid, 1993). A wide-field study of the Hyades based on the recent proper motion catalogue PPMXL, 2MASS, and Carlsberg Meridian Catalogue 14 (CMC14; Copenhagen University et al., 2006) photometry has enabled a full census of the kinematic cluster members down to masses of 0.2 in a region up to 30 pc from the cluster centre (Röser et al., 2011). Combining these three surveys, Röser et al. (2011) carried out a three-dimensional analysis of the cluster population and found that the Hyades have a tidal radius of 9 pc with clear outward mass segregation. Using the PPMXL and Pan-STARRS1 sky surveys Goldman et al. (2013) analysed the same area of the Hyades and pushed the census of its members down to . Based on the deepest survey over 16 deg2 of the Hyades core, Bouvier et al. (2008) reported the discovery of the first two BDs and confirmed membership of 19 low-mass stellar members. Analysing the statistically significant number of Hyades members found in the previous studies, Bouvier et al. (2008) concluded that the present-day mass function of the Hyades is clearly deficient in the VLM/BD domain compared to the initial MF of the Pleiades, which have a similar population structure, but are much younger than the Hyades. Another study based on the all-sky surveys UKIDSS and 2MASS (Hogan et al., 2008) and following spectroscopic analysis (Casewell et al., 2014; Lodieu et al., 2014) added several BDs to the substellar domain of the cluster. Nevertheless, the updated MF still shows the apparent deficit of the lowest mass members (Lodieu et al., 2014).
In this paper, we present the results of a new deep imaging survey of the Hyades open cluster obtained with the wide-field Schmidt camera at the 2m Alfred Jensch Telescope of the Thüringer Landessternwarte in Tautenburg, Germany (TLS). Details of the photometric observations and data reduction are described in Sect. 2. In Sect. 3 we introduce the photometric selection procedure of VLM objects and BD candidates; we then compute proper motions of our optically selected candidates by combining the TLS astrometric calibration with earlier epoch all-sky surveys, and describe the results. In Sect. 4 we report on the comparison of our photometric selection with the results of previous surveys of the Hyades; we also discuss the updated mass function of the cluster combining our new cluster member candidates with those from the previous studies.
2 TLS photometric survey and basic CCD reduction
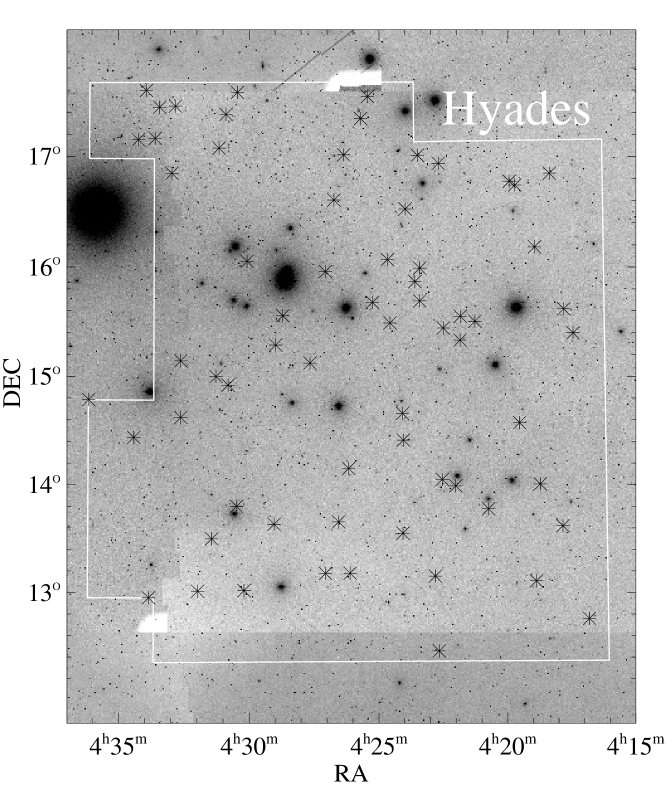
We have carried out a new wide and deep imaging survey of the Hyades open cluster (RA=4h26m DEC=+15° 0′) in the bands using the 2k x 2k CCD camera in the Schmidt focus of the 2m Alfred Jensch Telescope in Tautenburg. A short description of the photometric system of the CCD camera can be found in Melnikov & Eislöffel (2012). The Hyades are a very close open cluster and its core area ( pc; Perryman et al., 1998) extends over a very large sky area of 50 deg2. Our photometric survey obtained in October-November 2006 covers 23.4 deg2 in its central area, i.e. about 47% of the cluster core (see Fig. 1).
The total exposure time per filter (one frame) was 600 s, and for this exposure time the limiting magnitude of the frames was estimated to be in the band. To avoid saturated stellar profiles, we ensured that -magnitudes were in general 14.5. In total, 65 fields of good quality were obtained in the course of this survey. The positions of the field centres were chosen so that each field overlaps with its neighbours by (3′) in right ascension and in declination. The overlapping regions allowed us to check the quality of our photometric calibration by comparing the magnitudes of stars located in the overlapping areas of the adjacent frames.
The raw images were reduced following standard recipes in IRAF111IRAF is distributed by National Optical Astronomy Observatories, which is operated by the Association of Universities for Research in Astronomy, Inc., under contract with the National Science Foundation.; this procedure included overscan correction, bias subtraction, and dome flat-fielding. The -band images contained a prominent interference fringe pattern caused by night sky emission. These fringe strips were removed with a fringe mask constructed from the whole set of the -band images. The - and -band images were then aligned where necessary and all were astrometrically calibrated using the Graphical Astronomy and Image Analysis Tool software (GAIA) and the Hubble Guide Star Catalog (GSC v.1.2) as reference. The GSC contains positions for most of the field stars down to magnitude . Each of our Hyades CCD frames contains more than 30 reference stars evenly distributed across the field, and the accuracy of the astrometric solution for individual images is better than in both filters for both equatorial coordinates.
Cosmic ray hits (cosmics) were removed by combining each pair of frames of the same sky field into one image and rejecting cosmics. The images also had several different kinds of artefacts and extended objects which had to be discriminated from star-like objects. A description of these various artefacts and the method allowing us to clean the images is described in Melnikov & Eislöffel (2012).
Instrumental magnitudes of all extracted sources were then extracted based on the measurement of the point spread function (PSF) using the daophot package of IRAF. Finally, we converted the instrumental magnitudes into -band magnitudes using photometric standards observed in Landolt Selected Areas (Landolt, 1992). Photometric errors for the bands depend on magnitude: in the range of the errors gradually increase from to , but for objects with and the errors grow faster and reach about for . For the and CMDs, the -errors are combined with the infrared photometry errors provided in the 2MASS catalogue.
3 Selection of very low-mass stellar and brown dwarf candidates
All 65 CCD cluster fields together contain about 290 000 objects that were detected by SExtractor (Bertin & Arnouts, 1996) in the bands. We plot the colour-magnitude diagram (CMD) for the extracted sources (Fig. 2) and compare their diagram position with the model isochrones for low-mass objects, shifted to the distance of the Hyades (, Perryman et al., 1998). Interstellar reddening towards the Hyades is very low (Taylor & Joner, 2002) and can be neglected. Previous studies of the Hyades members exploited mostly the NextGen (Baraffe et al., 1998), DUSTY (Chabrier et al., 2000), and COND (Baraffe et al., 2003) isochrones (e.g. Dobbie et al., 2002; Bouvier et al., 2008). NextGen evolutionary models for solar metallicity based on non-grey dust-free atmosphere models described various observed properties of M dwarfs down to the bottom of the main sequence (CMDs, spectral types, etc.), whereas the DUSTY and COND models try to reproduce the same properties for BDs, taking into account the possible formation and opacity of dust grains in the atmosphere of objects with K. The DUSTY and COND models are different in that the latter include effects of rapid gravitational settling of the grains in the lower atmospheric layers below the photosphere. Chabrier et al. (2000) predict that this process will occur at a temperature of K, which corresponds to a mass of . The BT-Settl models (Allard et al., 2012) are a further development of evolutionary models which account for the formation of dusty clouds via a parameter-free cloud model (based on the cloud microphysics from Rossow, 1978). Compared to DUSTY, the BT-Settl models include, among other microphysical processes, gravitational settling of the dust in the cool BD atmospheres. The BT-Settl models, based on a solar abundance from Caffau et al. (2011, CIFIST2011) were already employed for the Hyades member selection in Goldman et al. (2013), who used the wide global surveys such as Pan-STARRS1 and SDSS combined with 2MASS and WISE infrared survey. The BT-Settl model grid allows a good reproduction of near-infrared (NIR) spectral energy distribution of cool VLMs and BDs (Allard, 2014). The current BT-Settl model grid (Baraffe et al., 2015; Allard, 2016) covers the stellar parameter range for the low-mass objects with K, and therefore the models are valid for both the lowest mass stars and BDs. We decided to utilise the latest BT-Settl model grid for our membership analysis.
To distinguish the Hyades member candidates from foreground dwarfs, we used the BT-Settl isochrones (solid curves in Fig. 2) calculated for the Hyades age (625 Myr). For the photometric selection of the candidates, we first took into account the cluster depth; the cluster core has a radius of 2.7 parsecs, which means the objects can be 012 fainter or brighter than the central cluster isochrone. Moreover, the main sequence of the Hyades in the CMD constructed from the previously known members from Reid (1993) shows that it is not just a thin line, but has a width of mag, which cannot be explained as resulting from the photometric errors or the cluster depth. Reid (1993) analysed this effect on , but it is also observable in . Reid (1993) suggested that this effect can be a sequence of natural dispersion of stellar parameters, where the high rate of unresolved binaries amongst the cluster members (Griffin et al., 1988; Reid, 1993) can be partly responsible for this scatter. Thus, we used the additional colour strip of mag width in order to take into consideration this dispersion and increase the detection probability of real members. As a result, we started with all objects within a strip that takes into account the cluster depth, the dispersion of colour indices, plus a wide strip due to photometric uncertainty (PSF photometric errors only). The strips are shown in the CMD in Fig. 2 as the two dashed curves on both sides of the BT-Settl isochrone which are getting wider due to increasing photometric errors with growing magnitude.


When we use the BT-Settl model for analysis of the CMD, we can roughly split the procedure into two parts. For the bright objects with , the BT-Settl isochrone is separated from the bulk of the field dwarfs quite well and we have found only several tens of photometric candidates within the photometric errors. There are also a number of objects located redward of our red uncertainty boundary which we included in our initial sample, especially in the upper part between . Some of these reddish objects at the CMD top could be background dwarfs, distant galaxies, or red giants. The observed displacement towards the red could be partly caused by the depth of the cluster and by the binarity of the objects. In the most extreme case, a binary consisting of equal mass stars may be lying up to 0.75 mag above the single star sequence. Since we cannot identify the origin of this reddening using only the CMD, all these reddish objects were initially included in our list as potential cluster members. As a result, we identified several tens of low-mass cluster member candidates in the magnitude range , covering from 0.15 to about 0.075 . These sources were then cross-identified with 2MASS-photometry and were subjected to further checks, which are detailed in the following.
For objects with , the BT-Settl model predicts that the isochrone has a turnover and fainter objects will have bluer colour indices. Therefore, for the candidates with masses below , one can see that the model coverage significantly overlaps with the field dwarfs at the CMD (Fig. 2). Using the BT-Settl isochrone has led to a selection of several thousand objects. These sources were then cross-identified against sources in 2MASS and the UKIRT InfraRed Deep Sky Survey (Galactic Clusters Survey, UKIDSS). The UKIDSS survey has a deeper detection limit, but its photometric selection contained only the band for the Hyades. We discuss this photometric selection in the following section.
3.1 Two Micron All-Sky Survey selection
As the next step of the photometric selection, we used three NIR CMDs of , , and (see Fig. 2). As for the diagram, the 625 Myr BT-Settl isochrones from Allard (2016) are shown on these IR CMDs in Fig. 2 as solid lines. The two dashed lines at both sides of the isochrones indicate the selection area defined by parameters adopted for CMD such as the photometric uncertainty, the cluster depth, and the natural photometric dispersion. All CMDs in Fig. 2 also represent a scale of stellar mass according to the model. Using the CMDs, we then selected all the photometric candidates which agree with the theoretical NIR isochrones within defined selection areas. Contrary to , the BT-Settl isochrones in the and CMDs predict a gradual increase in the colour indices with decreasing stellar mass at least down to 0.05 . The BT-Settl isochrone is almost vertical for , but for fainter the colour index becomes considerably redder. This behaviour agrees well with the colour indices of the faintest member candidates, which show very red colour indices on this CMD (Fig. 2).
Goldman et al. (2013) note that the discrimination between the Hyades cluster sequence and the bulk of the background stars is better when the wavelength difference between the bands is greater. Thus, the CMD is a good one for this preliminary discrimination. First, we cross-identified all our initial candidates selected from the CMD in the Two Micron All-Sky Survey (2MASS, Skrutskie et al., 2006). Using a matching radius of 25, we derived photometry for all our candidates up to . We combined the derived NIR photometry with our -magnitudes into the three additional CMDs (see Fig. 2). For our targets with , the 2MASS survey did not contain IR photometry and thus we cross-identified these against sources in the UKIDSS survey. Although the Hyades are covered by this survey, it provides only -magnitudes () for this cluster. Finally, we used the transformation equation from Hewett et al. (2006) to convert UKIDSS magnitudes to 2MASS .
The analysis of the large candidate set on the CMD showed that almost all UKIDSS and 2MASS sources with have bluer than is predicted by the BT-Settl isochrone, and thus they are probably field dwarfs. Therefore, we excluded all the objects from the further analysis. In our results, we identified only seven photometric candidates with . For we selected several tens of candidates and rejected those candidates which fail our criterion in any of the other NIR CMDs. As a result, all candidates which have only UKIDSS photometry are were rejected.
3.2 Field object contamination and background giant stars
An estimate of the number of contaminating field stars can be obtained from the Besançon Galaxy model (Robin et al., 2003), which gives star counts depending on their brightness, colour, and Galactic coordinates. Using this model, Goldman et al. (2013) have found that the contamination by field stars is negligible (%) up to 18 pc of the cluster centre. Since our survey lies within this radius, we will not consider contamination as essential for our conclusions.
Finally, we used the diagram to weed out possible background giants from our sample. This type of contaminating objects probably experiences interstellar extinction and tends to populate the top left side of the diagram above the sequence of the dwarf stars (Goldman et al., 2013). In Melnikov & Eislöffel (2012) we tried to find giants as background contaminants projected onto the Coma open cluster with the help of the analysis of narrowband spectral indices (Jones, 1973), which allowed us to distinguish genuine low-mass members from the far red giants with similar colour indices. However, no giants were found in the background of the Coma cluster. The Hyades (at , ) are located in the opposite direction to the Galactic centre and quite high above the Galactic plane. Therefore, we do not expect to find a large amount of distant background M-type giants in the direction of the Hyades either, given that this cluster is located at high Galactic latitude as well.
As a result of this NIR two-colour analysis, we found nine objects that are located in the CMD region with high extinction. To double check, we calculated proper motions of these targets (see Sect. 3.4). Most of these objects have proper motions around zero which seems to favour the idea that they might be background objects. Finally, we excluded these objects from our list of photometric VLM candidates.
3.3 Spectro-photometric classification
To determine the spectral types of the VLM candidates, we exploited the method of luminosity–spectral type calibration by Kraus & Hillenbrand (2007). This method is based on a large sample of stellar spectral energy distributions (SEDs) and allows us to estimate the spectral type (SpT) of a star using only its optical/NIR photometry. The results of this classification are presented in Table LABEL:phot_cand. The second to last column holds the spectral type derived from the TLS -band magnitudes and the last column is the average of the three SpT values determined from 2MASS . Spectral type sequences based on 2MASS photometry are self-consistent and the SpT estimates derived from these bands agree very well: the SpT values are equal to or lie within one spectral subclass. At the same time, the spectral type derived from 2MASS is systematically later than those calculated from the TLS band. Moreover, this difference increases towards later SpT objects. This may imply that our -band calibration has some bias with respect to the 2MASS -system. Considering this result in more detail, one can say that the SpT determined from the two methods agree well (with the difference of a SpT subclass) for most objects whose spectral indices were derived from the 2MASS photometry (58 of the 66 objects), whereas for 8 objects, SpT (2MASS) values are later by two subclasses and larger than those derived from the TLS photometry.
We should note that this luminosity–spectral calibration sequence is based on the stellar SEDs of VLMs only and is valid for stellar objects with (masses ). Therefore, this calibration method may not be reliable for BD candidates and it may not provide the proper spectral classification for objects with SpT about and later than L0.
3.4 Proper motion as a selection criterion
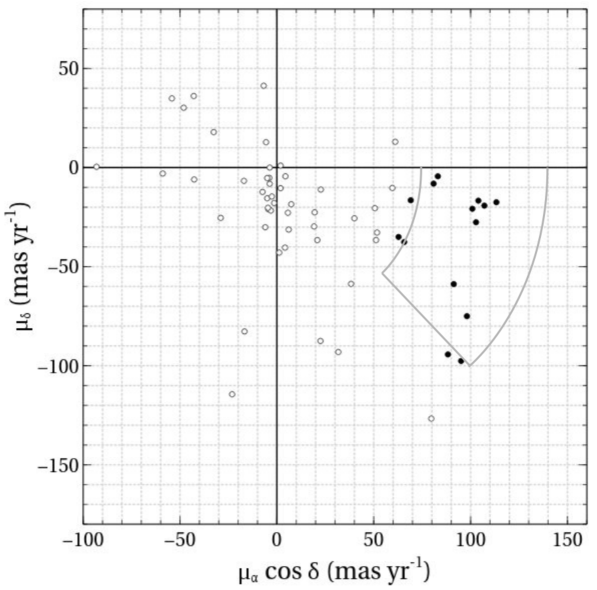
The mean proper motion (PM) of the Hyades cluster is 100 mas yr-1 (Bouvier et al., 2008), which is quite different from that of Galaxy field stars and therefore can be used for the separation of genuine cluster members from background and foreground objects. It was found that the faint Hyades members are located within the octant of PM space between PA=90° and PA=135° (Bryja et al., 1994) with a convergent point at PA115°.
Several all-sky surveys exist in the literature which provide PMs for a large number of stars. Cross-identification of our selected candidates in the USNO-B1 catalogue show, however, that the given PMs of some objects are questionable because of close stellar binarity that may have affected the measurements. The same shortcomings are found in the PPMXL, which combines USNO-B1.0 and 2MASS astrometry. Therefore, we decided to measure our own precise positions for our selected candidates to derive more reliable PM results, especially for the faint objects.
Therefore, we measured the (X-Y) location of our optically selected candidates on the astrometrically calibrated TLS images and determined their sky coordinates (J2000). To compute the PMs from several epochs, we then cross-referenced our candidates with the following surveys: POSS1 (), POSS2 (), 2MASS, UKIDSS band, and WISE; we then obtained astrometry for seven independent epochs (TLS averaged) from 1950 to 2010. Most objects fainter than could not be detected on the POSS1-R plates. These objects were measured on the WISE 3.4 and 4.6 m bands, where they were all detected, and were small enough to provide high-quality astrometry. These objects therefore only have an epoch difference from 1990 to 2010. We note that all objects could be measured on the downloaded 2MASS images, even those that are not in the 2MASS catalogue, while UKIDSS covers the Hyades only in its band.
The equatorial coordinates were extracted from all photometric surveys for the same epoch J2000 and thus a change of object positions should only depend on its PM. Finally, the PM of every target was derived from linear fitting the position changes over the epochs spanned by our data. The typical errors of the measurements are mas yr-1 and mas yr-1 for the PMs measured within 1950–2010 and mas yr-1 and mas yr-1 for the 1990–2010 epochs.
One source that can affect our PM results is a visual binary system. Reid (1993) found that the Hyades may have a substantial fraction of the binaries, from 25% to 60% depending on the model. If we measure the position of an unresolved binary, we believe that we derive the motion of the system as a whole, but if we measure the motion of an object which is actually a companion of a visual binary system, the measured PM can differ from that of the system because the components are involved in motion around their centre of mass. We inspected all selected member candidates and if they had signs of binarity, we marked them in Tables 1 and LABEL:pm_nonmemb as ‘VB’ for probable visual binaries (visual partially resolved systems) or as ‘VB?’ for wide stellar pairs with lower probability (resolved systems). One can see that the binary fraction in our selection set is not as high as predicted by Reid (1993). This is probably due to the source detection method used; the method used the shape of stellar images to separate single stellar objects from extended sources such as galaxies or artefacts. As a result, the many partially resolved systems whose components were not resolved during the detection process seem to have been excluded.
The resulting measured PMs for all 66 objects are shown as a vector diagram of and in Fig. 3. The objects with PMs satisfying Hyades membership were selected using the same PM box as in Bouvier et al. (2008); Bryja et al. (1994). Four other objects are located outside of this box, but can also be classified as Hyades members within their error bars. In total, 14 objects were selected as Hyades PM members (Table 1). Two objects have been selected as possible components of visual binaries TLS-Hy-2 and -8; both have also been classified as Hyades members in previous studies as LH 234 (Leggett & Hawkins, 1988) and RH 230 (Reid, 1992). However, both objects are mentioned in these studies as single stars without counterparts. Therefore, it is possible that these visual pairs are not physical binaries, but were classified as such due to projection effects. The optically selected candidates whose PMs do not satisfy Hyades membership are listed in Table LABEL:pm_nonmemb. Their PMs are listed with individual rms errors and actual epoch range.
| Object | RATLS | DECTLS | epoch | mass | notes | ||||
|---|---|---|---|---|---|---|---|---|---|
| TLS-Hy-.. | (J2000) | (mag) | (mas yr-1) | () | |||||
| 1 | 04 17 31.3 | 15 23 01 | 14.88 | 1.61 | 95.116.6 | 1950.94–2006.91 | 0.12 | ||
| 2 | 04 18 00.5 | 13 35 58 | 16.04 | 2.29 | 69.124.8 | 10.0 | 1953.78–2006.91 | 0.09 | LH 234, VB |
| 3 | 04 18 51.1 | 13 59 24 | 14.82 | 1.73 | 98.118.6 | 9.6 | 1953.78–2006.91 | 0.13 | LH 222n |
| 4 | 04 18 57.7 | 16 10 56 | 15.44 | 1.73 | 65.718.5 | 17.3 | 1950.94–2006.91 | 0.10 | |
| 5 | 04 19 41.8 | 16 45 22 | 17.00 | 2.42 | 88.342.9 | 17.8 | 1995.73–2006.91 | 0.08 | LH 214 |
| 6 | 04 20 50.3 | 13 45 53 | 17.32 | 2.42 | 80.932.8 | 11.4 | 1989.85–2010.66 | 0.08 | LHD 0418+1338 |
| 7 | 04 22 05.2 | 13 58 47 | 18.63 | 2.46 | 107.137.7 | 3.5 | 1995.73–2010.66 | 0.07 | Hy 6 |
| 8 | 04 26 19.1 | 17 03 02 | 14.93 | 1.92 | 102.811.5 | 9.9 | 1955.94–2007.18 | 0.12 | RH 230, VB |
| 9 | 04 27 05.3 | 13 10 33 | 16.44 | 2.03 | 83.112.9 | 8.1 | 1955.95–2006.91 | 0.09 | |
| 10 | 04 29 02.9 | 13 37 59 | 15.15 | 2.32 | 100.912.0 | 5.4 | 1955.95–2006.91 | 0.11 | LH 91,CFHTHy-16 |
| 11 | 04 30 04.2 | 16 04 08 | 15.02 | 2.04 | 91.317.2 | 14.6 | 1955.95–2006.91 | 0.12 | RH 281, LH 85, CFHTHy-14 |
| 12 | 04 31 16.4 | 15 00 12 | 14.69 | 1.92 | 104.017.9 | 11.2 | 1955.95–2006.91 | 0.13 | LH 68n, CFHTHy-12 |
| 13 | 04 32 51.2 | 17 30 09 | 17.83 | 2.67 | 113.325.7 | 23.0 | 1955.94–2006.91 | 0.08 | LHD 0429+1723 |
| 14 | 04 33 28.1 | 17 29 32 | 15.56 | 1.83 | 62.815.6 | 27.0 | 1955.94–2006.91 | 0.10 | |
4 Results and discussion
Our survey covered 23.4 deg2 in the core area of the Hyades (Fig. 1). We estimated the completeness and the limiting magnitude of the survey in the bands as described in Caballero et al. (2007). Our calculation shows that our survey is complete to 21.5 in the band and 20.5 in the band. The limiting magnitude of the survey is about 1.5–2 mag fainter than the completeness magnitude, i.e. the limiting magnitude is 23 for the band and 22.5 for . Since we used the same CCD camera, these values are similar to those of our Coma imaging survey (Melnikov & Eislöffel, 2012), but the Hyades () are closer to the Sun than the Coma open cluster () and therefore we can detect objects in the Hyades with an absolute magnitude that is 1.5 fainter than in the Coma cluster.
Combining TLS photometry with 2MASS IR we have selected 66 photometric candidates (Fig. 2 and Table LABEL:phot_cand) using the modern BT-Settl theoretical model (Baraffe et al., 2015; Allard, 2016). The photometric candidates span magnitudes from to 18.7, covering the mass range from to (67 Jupiter masses). The objects with correspond to spectral types from M2 down to L0 based on spectro-photometric classification from Kraus & Hillenbrand (2007), whereas the fainter objects () should have spectral types later than L0. At the adopted distance, the boundary between stellar and substellar objects lies at in the CMD (dashed horizontal line) assuming a Hyades age of 625 Myr.
The PM selection allowed us to discriminate the cluster members from field objects with PM lower or higher than that of the cluster. The PM selection for our photometric set resulted in 14 PM members, which are listed in Table 1 containing our photometry of the objects as well as their PM values. Coordinates of the objects extracted from the TLS frames are based on the J2000 epoch of the Guide Star Catalog v1.2. Only one PM member (TLS-Hy-7) is located well under the substellar borderline () and we classify it as a photometric BD.
4.1 Comparison with previous studies
Several studies of the Hyades during the last years were focused on improving the census of its lowest mass members. Some of the surveys tried to cover as much area as possible around the Hyades core using new all-sky surveys. For example, the Röser et al. (2011) and Goldman et al. (2013) studies are based on the PPMXL/Pan-STARRS1 surveys and did all-sky searches for Hyades members in a very wide region covering 6500 deg2 around the cluster centre (a radius of 30 pc). Other surveys were focused on the core area of this cluster trying to register substellar members towards the lowest masses, e.g. the Bouvier et al. (2008) survey. In our survey we used the same approach and tried to discover the faintest objects in the Hyades core. Nevertheless, our TLS and Bouvier et al. (2008) surveys do not cover the same area. A comparison of our survey with the spatial coverage of Bouvier’s study (16 deg2) shows that they overlap over 60% (13.5 sq. deg), i.e. our imaging survey covers an additional 10 deg2. Thus it is complementary to the Bouvier et al. study.
The Röser et al. (2011) and Goldman et al. (2013) surveys both used the same technique of kinematic selection (the convergent point method), and Goldman et al. (2013) published a list of 63 additional candidates not included in the Röser et al. (2011) list. Since the upper mass limit of our TLS survey is 0.15 , it does not overlap with the lower mass limit of the Röser et al. (2011) survey (). To check this we tried to cross-reference both our PM candidates and photometric candidates with the Röser et al. (2011) list, but, as expected, we found no common objects. The Goldman et al. (2013) survey has a lower mass limit of so that there could be some common sources. However, since the surface density of low-mass Hyades candidates in the survey is quite low in the core region, only 3 of 62 candidates from the Goldman et al. (2013) list are located within the area covered by our TLS fields. Nevertheless, we were able to cross-identify two objects with this survey: TLS-Hy-8 = 66.5793+17.0506 and TLS-Hy-12 (photometric candidate) = 67.8182+15.0034. The third object from the list of Goldman et al. (2013) at was too bright for the TLS survey.
Bouvier et al. (2008) selected 22 low-mass probable members based on their photometry and PM. Ten of the objects are brighter than and two BD candidates have . Therefore, the magnitudes of these objects were out of our photometric range. Of the ten objects lying within the TLS magnitude range, three objects are located outside of the TLS fields. Among the remaining seven objects there are three candidates in common: TLS-Hy-10=CFHTHy-16, TLS-Hy-11=CFHTHy-14, and TLS-Hy-12=CFHTHy-12. Four of the objects were not detected because of special observing conditions: CFHTHy-15 and -17 are components of a close double source (RHy 240AB, Reid, 1992), which was not resolved in our survey photometry, and we therefore removed these objects from our lists. The remaining two objects (CFHTHy-18 and -19) are located in the vicinity of very bright stars with spikes and strong halos, and therefore the method used was not able to detect and derive photometry for these objects. A comparison of our PM values of the objects in common with those of Bouvier et al. (2008) shows that they are in agreement within the rms errors.
We also searched for our objects in several earlier surveys covering the Hyades core region: Leggett & Hawkins (1988), Reid (1992), Leggett et al. (1994), and Hogan et al. (2008). The cross-identification is indicated in the ‘Notes’ column of Table 1. In addition to Bouvier et al. (2008), TLS-Hy-11 was also identified as a Hyades member in Reid (1992) (RHy 281) and TLS-Hy-10 was selected as a photometric members in Leggett & Hawkins (1988) (LH 91) and Leggett et al. (1994) (LHD0426+1331); LH 68 (TLS-Hy-12) and 222 (TLS-Hy-3) were marked as non-members (n) in Luyten et al. (1981) based on their PMs. However, our PM values calculated over 50 years of epoch difference agree well with other Hyades member candidates. According to the photometric distance obtained from UKIRT -photometry (Leggett & Hawkins, 1988) LH 222 is located outside the Hyades core. However, the UKIRT -magnitudes of LH 222 are considerably different from 2MASS -photometry (1 mag); this may be due to genuine variability of this object or may be a false detection. In the case of our and the 2MASS photometry, a location of LH 222 on both and NIR CMDs agrees well with the BT-Settl theoretical sequence for the Hyades distance. LH 68 was also selected as a probable member in Bouvier et al. (2008) based on the criteria of photometry and PM (CFHTHy-12).
We have selected only one object (TLS-Hy-7) lying near the substellar domain () and cross-identified it with Hy 6 from Hogan et al. (2008). Since the photometric error is large at these magnitudes, we are unable to ascertain whether the object is lying above or below this boundary. Thus, this candidate may be a BD or instead the lowest mass stellar member known. Casewell et al. (2014) observed this object with medium-resolution NIR spectroscopy and classified TLS-Hy-7 as a Hyades BD member with spectral type of M8–L2. This spectral classification agrees with our estimation (M9–L0) obtained from the spectro-photometric calibration (Kraus & Hillenbrand, 2007).
In total, ten previously selected Hyades members are rediscovered in our TLS survey (marked in the ‘Notes’ column in Table 1). Thus only four member candidates from our list are not identified in any of the previous surveys and no new BD candidates have been found.
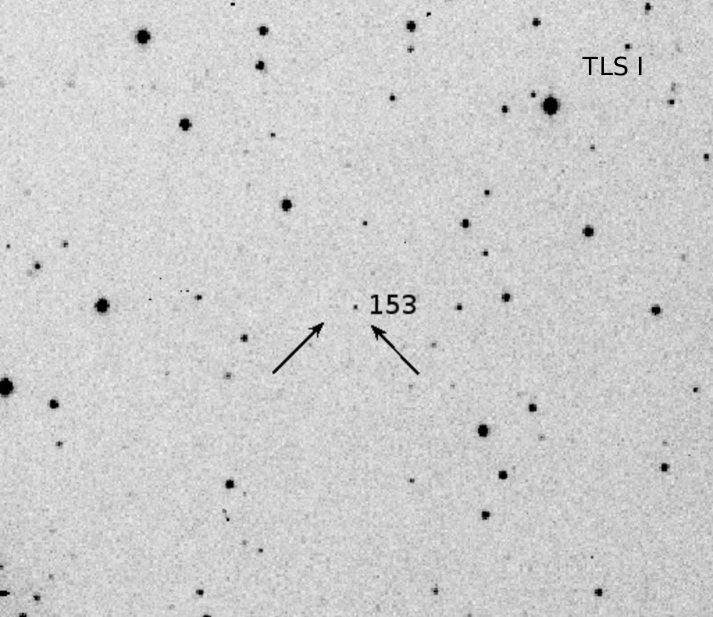
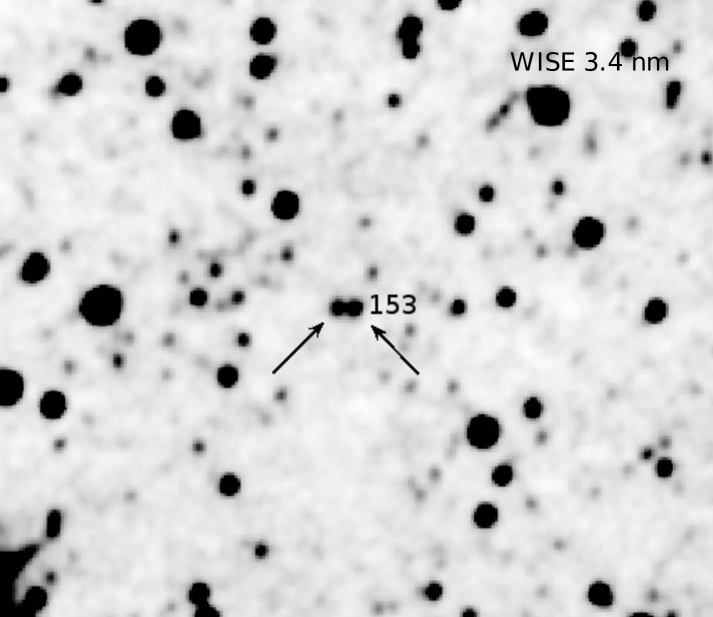
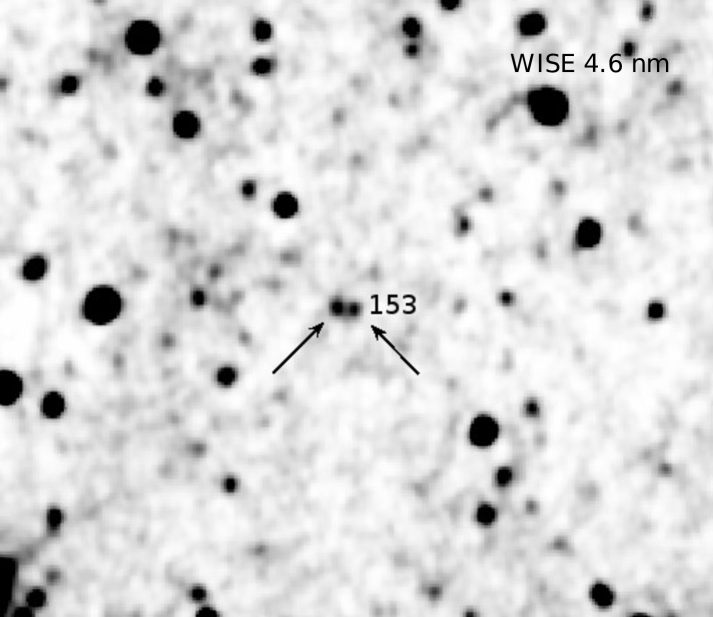
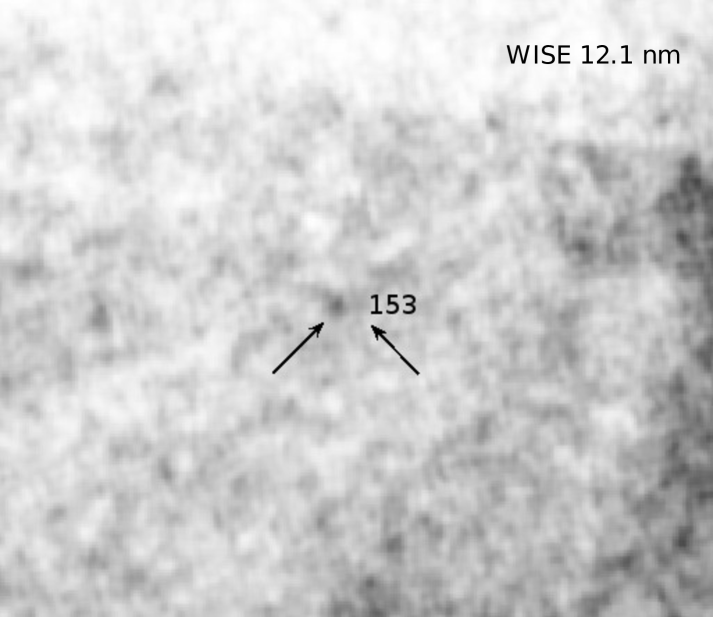
4.2 An infrared object of special interest: TLS-Hy-153
The object TLS-Hy-153 (RA DEC, , ) was selected as a photometric candidate, and it is located in the BD region on the CMD. Since this object is quite faint, it was not cross-identified with a 2MASS source, but only with a UKIDSS object. After transformation from (UKIDSS) to (2MASS) this object was placed on the CMD, but it was rejected from the list of photometric candidates due to its inconsistent colour index (). Moreover, the derived PM of the object does not agree with that of Hyades. TLS-Hy-153 is hardly visible on the -band image of the TLS survey. At the same time, an inspection of WISE images shows that this object is quite bright at 3.4 and 4.6 m (Fig. 4) and at UKIDSS band (2.2 m). Moreover, the WISE images reveal a bright companion (marked by an arrow) with a similar brightness. At 4.6 m this object is brighter than at 3.6 m and it is brighter than TLS-Hy-153 (comparing the peak flux of the central pixels). This IR companion (hereafter TLS-Hy-153-IR) can even be seen at 12.1 m. This IR object is also detected on the UKIDSS -band image: J041652.01+131610.0. The angular separation between the two components averaged from the high-resolution UKIDSS -map is 11″, which is 500 AU at the distance to the Hyades.
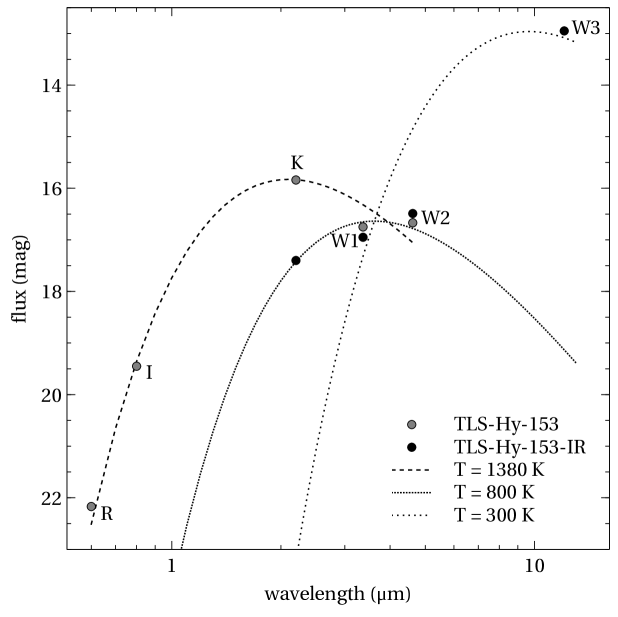
To estimate the temperature of the objects we constructed their SEDs from the available data: the TLS photometry, the WISE, and the UKIDSS surveys. The TLS-Hy-153 SED is based on the five data points measured in the bands; the UKIDSS band; and WISE W1,W2; whereas photometry data for TLS-Hy-153-IR are available from three WISE bands, W1, W2, and W3 (Fig. 5), and from the UKIDSS band. The fluxes of the close companion on the W1,W2 images were separated and calculated using PSF-photometry (IRAF.daophot), whereas the W3 flux of TLS-Hy-153-IR was estimated using aperture photometry; the fluxes were then converted to magnitudes with zero points provided by the WISE survey. Both objects are well resolved on the high-resolution UKIDSS -map and therefore we used their photometric magnitudes from the survey.
One can see that TLS-Hy-153 shows a maximum brightness at 2.2 m. We estimate the TLS-Hy-153 temperature by fitting its SED with a Planck function for a black body. If we assume that the radiation from the band comes from the stellar object, the best solution that fits the blue cut-off and the SED slope around the bands gives a flux distribution at K. For TLS-Hy-153-IR, the fit scaled to the IR emission in and W1–2 corresponds to a Planck function with a temperature of 800 K, whereas the W3 emission fits better with a black body at 300 K. This implies that the estimate of the TLS-Hy-153-IR temperature using a single Planck function may not be reliable because at these wavelengths different sources with different temperatures can contribute to the resultant flux. Indeed, measurements of the diameter of the TLS-Hy-153-IR image in different WISE bands show that the FWHM of its stellar profile in the W3 band is larger than in W1 or W2. Therefore, we suggest that TLS-Hy-153-IR represents an extremely faint object (an ultra-cold BD or a planet-like object) surrounded by a lower temperature structure such as a dust envelope or a circumstellar disk.
There are two possibilities to consider for the location of this binary object. The first is that this is a wide binary system located in the Hyades; however, as noted above, because of its faintness the PM of this object could only be obtained over the epoch difference 1997–2010 and does not support its cluster membership. On the other hand, the rms of the PM values are quite high. Therefore, we repeated the imaging of this area at the TLS 2m telescope with a longer exposure (20 min) in the band in 2015. The astrometry of the brighter companion on these images confirms the previous estimate of its PM direction, while the fainter companion is still not visible on these exposures. However, if the system is indeed a wide physical pair, the motion of TLS-Hy-153 around the common mass centre may affect the PM determination. Therefore, we cannot exclude the cluster membership of these objects.
A second possibility is that we are looking at a young, more distant system in the Taurus star-forming region (SFR). Since the Hyades are located in front of the Taurus SFR, objects in the SFR can be mixed up with genuine Hyades members. We note that the WISE images show a mini-cluster of bright IR objects around the young stellar object (YSO) 2MASS J04220042+1530212 (Rebull et al., 2011). Many of the objects are not visible on our TLS - and -band images, but four objects (TLS-Hy-107, -108, -109, -110) have been selected as photometric candidates in this area; however, they were all rejected after the PM selection. Since these objects are projected on the dim area (comparing this region with adjacent ones), all the IR objects might be members of the Taurus SFR. The TLS-Hy-153 system is located 25 to the south-east from this mini-cluster and may still belong to the periphery of the Taurus SFR. For the Taurus distance of 140 pc, the spatial distance between the objects will be very high: 1540 AU. On the other hand, the star density around TLS-Hy-153 is higher than around this IR cluster which means that the extinction is not strong in this area. However, isolated YSOs located near SFRs in an area without signs of dust clouds with strong extinction are a known phenomenon. Therefore, we neglect the interstellar extinction which is probably low in this area. Unfortunately, we do not know a value of the circumstellar extinction for this object which might be considerable in the case of YSOs. If we adopt a distance to the SFR as 140 pc (Kenyon et al., 1994) and its age as 2 Myr (Kenyon & Hartmann, 1995), according to the BT-Settl model TLS-Hy-153 is a very low-mass substellar object with () and K. We note, however, that all young BDs that have been found in the Taurus dust clouds so far have been found towards areas with high interstellar extinction. Another parameter which we can compare is the PM. The PM of TLS-Hy-153 ( mas yr-1, mas yr-1) obtained from the short epoch difference coincides within our rms with the PM of other members of the Taurus region (e.g. mas yr-1: Grankin, 2013; Ducourant et al., 2005). However, it is very unusual to find such an object so far from the core of the Taurus SFR. If we take the position of the dust cloud where many young stars such as DF Tau and DG Tau are located, 27m, =+25° 50′, the angular distance between TLS-Hy-153 and this potential birthplace would be and . To reach the current place within 2 Myr, the difference in velocity between the object and the mean Taurus SFR should be about 4 mas yr-1 and 22 mas yr-1 for and , respectively, which led to mas yr-1 and mas yr-1 for TLS-Hy-153. If we take the position of T Tau, which is also associated with a dust cloud and close to our target, the difference in the velocity will be less than mas yr-1 and mas yr-1. Unfortunately, the PM uncertainty for TLS-Hy-153 is quite high, which does not allow us to draw a conclusion on its birthplace. Nonetheless, TLS-Hy-153 and the accompanying IR object might represent an interesting wide system: one of the elements may be a BD and the other a planet-like object (or an ultra-cold BD).
4.3 Mass function
The previous studies found that the Hyades are probably a more massive cluster than the similarly aged open cluster in Coma. Röser et al. (2011) estimated a cluster tidal radius of 9 pc, which is about twice that of Melotte 111 (5–6 pc, Odenkirchen et al., 1998). Within this tidal radius Röser et al. (2011) found 364 stellar systems with the total mass of 275 . Reid (1992) estimated the Hyades gravitational binding radius to be as large as 10.5 pc, comprising a stellar population with a total mass of up to 480 .
The present-day mass function (PDMF) was investigated in detail by Bouvier et al. (2008) based on a large member sample compiled in the Prosser Stauffer database (Bouvier et al., 2008). This database, combined from many studies, lists more than 500 probable Hyades members and allowed them to build a PDMF spanning a range of stellar masses of . Bouvier et al. (2008) showed that the Hyades and Pleiades mass functions are similar in shape for masses and agree with a Salpeter slope (, Salpeter, 1955). However, for the lower masses the Hyades MF becomes shallower than for Pleiades and for a range of the Hyades MF agrees with a power law index of , whereas the Pleiades show for the same mass range. This Hyades MF slope has been calculated assuming that the radial distribution of BDs and VLM stars is the same and equals pc. A larger radius of the BD population ( pc) taken on the assumption of a fully relaxed cluster increases the potential amount of BDs, but cannot eliminate the difference between the MFs (Bouvier et al., 2008). This finding confirms that the low-mass MF of the Hyades is much more poorly populated than in the Pleiades cluster, which is much younger than the Hyades.
In order to build an updated PDMF of the Hyades, we combined our new results with the stellar mass statistics presented by Bouvier et al. (2008). In order to calculate the masses for our cluster member selection, we used the mass–magnitude relationships defined by the BT-Settl 625 Myr model (Allard, 2014). Since the isochrones are available for both - and -magnitudes, we estimated the masses from both bands independently. A comparison of the two estimates shows good agreement, within 0.01–0.02 . Therefore, we averaged the two values (see Table 1).
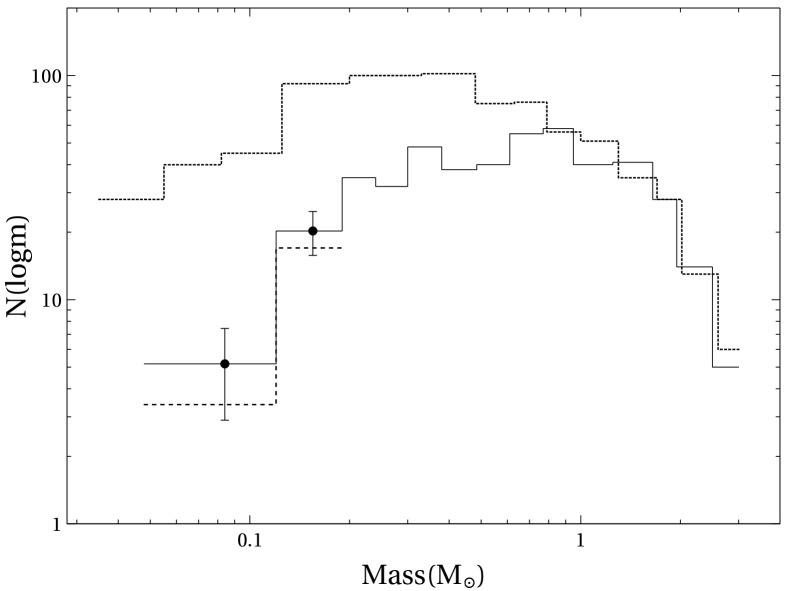
Figure 6 represents the resulting new, more complete Hyades PDMF including our data, the compiled published data for from the Prosser and Stauffer Open Cluster database, and the data from Bouvier et al. (2008). Since ten of our objects were rediscoveries from previous studies, only four of our new candidates have been added to update the known PDMF. The TLS member set was extrapolated to the whole cluster area by a factor, taking into account the ratio of the covered areas in the TLS and Bouvier surveys. The renormalised numbers have been added to the final MF. The error bars are based on the Poissonian statistics and also take into account the mass measurement errors converted from the photometric uncertainties. Only one object in our new sample falls within the lowest mass bin (0.048–0.12 ), whereas three objects have been added to the 0.12–0.19 bin. Adding our sample to the Bouvier et al. sample makes the mass spectrum a bit flatter over 0.05–0.20 and the difference between the Hyades and the Pleiades MFs is still clearly apparent (Fig. 6). We should take into account that this bin not only includes BDs, but also the low-mass stellar members. If our selected objects are genuine cluster members, the population in the lowest mass bin is more consistent with the core radius of 7 pc for BDs in the Hyades cluster (Bouvier et al., 2008), i.e. pc for the VLM stars and pc for BDs. From the resulting MF over this low-mass range, we find the slope with which is close to the value from Bouvier et al. (2008).
This result can be explained as a sequence of the continuing dynamical evolution of the Hyades, which are older than the Pleiades. Agekian & Belozerova (1979) showed that during the evolution of an open cluster, its members can escape from the cluster and form an extended halo around it. Comparing the shapes of the Hyades and Pleiades MFs, Bouvier et al. (2008) estimated that the Hyades must have lost 90% of their initial substellar population (). However, they concluded that currently 10–15 BDs could still be located within the Hyades cluster core, whereas initially the cluster harboured up to 200 BDs. Nevertheless, although we used the wide selection criteria which included the photometric errors and the cluster depth and also the potential natural colour dispersion (Reid, 1993), we did not find any new BD candidates and only four VLM candidates were added to the previous list of members. We also note that the area of the TLS survey was 10 deg2 higher than in Bouvier et al. (2008). Modern numerical simulations of the Hyades cluster predict that during the dynamical evolution, ‘evaporated’ BDs and other low-mass members will form elongated tails out of the main cluster core (Chumak et al., 2005). The modelling in Ernst et al. (2011) shows that the tidal tail of lost objects can reach a length of 800 pc after 625 Myr of evolution. Simple calculations show that if the escaping velocity is a few km/sec (for instance, km/s, Chumak et al., 2005), the former VLM member can recede from the cluster core on several tens of parsecs after 625 Myr of evolution and will be out of our selection criteria. Therefore, we cannot exclude that the observed VLM/BD desert might be a sequence of the situation when almost all the VLM/BD members have left the cluster core and even its halo.
Therefore, our results support the conclusion that the VLM/BDs deficiency in the Hyades is a consequence of the gradual removal of low-mass cluster members due to weak gravitational encounters during the continuous dynamical evolution of the cluster (Bouvier et al., 2008). Moreover, the general result from our survey combined with several previous wide surveys shows a lack of any considerable substellar population, which implies that the Hyades core has already lost most of these objects. The most foreground VLM members probably mixed with foreground dwarfs and migrated so that they are no longer projected on the cluster core. The background evaporated members that are projected onto the core are probably much fainter than those that are still located within the cluster volume, and the deeper imaging survey is required to detect such objects.
5 Conclusion
We have carried out a wide imaging survey of 23.4 deg2 around the core of the Hyades which partially overlaps with a similar optical survey by Bouvier et al. (2008). Analysis of the TLS photometry, together with 2MASS and derived PMs, led to a final list of 14 objects which satisfy the membership criteria for the Hyades. We identify four new low-mass member candidates, while a further ten stars from our list can be cross-identified with objects discovered in earlier studies. No new photometric substellar objects (BD) were discovered for the distance of the Hyades core. We rediscovered only Hy 6 (Hogan et al., 2008) as a PM member and classified it as a photometric substellar object candidate (BD) based on the comparison of the observed CMD with theoretical model isochrones. With our four new candidates added to the present-day mass function of the Hyades below , the updated mass function is close to that of Bouvier et al. (2008). However, low-resolution spectra of the objects in the red and near-infrared spectral domain are desirable in order to check their ages, which should coincide with the cluster age. In the case of a cluster membership, the objects should exhibit signs of relative youth, such as H in emission (Bouvier et al., 2008; Melnikov & Eislöffel, 2012).
Acknowledgements.
J.E. and S.M. acknowledge support from the American Astronomical Society under the 2005 Henri Chrétien International Research Grant. This publication has made use of data products from the Two Micron All-Sky Survey, which is a joint project of the University of Massachusetts and the Infrared Processing and Analysis Center/California Institute of Technology and the United Kingdom Infrared Deep Sky Survey. This research has made use of the SIMBAD database, operated at CDS, Strasbourg, France, and of the IRAF software distributed by NOAO.References
- Agekian & Belozerova (1979) Agekian, T. A. & Belozerova, M. A. 1979, AZh, 56, 9
- Allard (2014) Allard, F. 2014, in IAU Symposium, Vol. 299, Exploring the Formation and Evolution of Planetary Systems, ed. M. Booth, B. C. Matthews, & J. R. Graham, 271–272
- Allard (2016) Allard, F. 2016, in SF2A-2016: Proceedings of the Annual meeting of the French Society of Astronomy and Astrophysics, ed. C. Reylé, J. Richard, L. Cambrésy, M. Deleuil, E. Pécontal, L. Tresse, & I. Vauglin, 223–227
- Allard et al. (2012) Allard, F., Homeier, D., Freytag, B., & Sharp, C. M. 2012, in EAS Publications Series, Vol. 57, EAS Publications Series, ed. C. Reylé, C. Charbonnel, & M. Schultheis, 3–43
- Baraffe et al. (1998) Baraffe, I., Chabrier, G., Allard, F., & Hauschildt, P. H. 1998, A&A, 337, 403
- Baraffe et al. (2003) Baraffe, I., Chabrier, G., Barman, T. S., Allard, F., & Hauschildt, P. H. 2003, A&A, 402, 701
- Baraffe et al. (2015) Baraffe, I., Homeier, D., Allard, F., & Chabrier, G. 2015, A&A, 577, A42
- Bertin & Arnouts (1996) Bertin, E. & Arnouts, S. 1996, A&AS, 117, 393
- Boudreault et al. (2012) Boudreault, S., Lodieu, N., Deacon, N. R., & Hambly, N. C. 2012, MNRAS, 426, 3419
- Bouvier et al. (2008) Bouvier, J., Kendall, T., Meeus, G., et al. 2008, A&A, 481, 661
- Bouy et al. (2015) Bouy, H., Bertin, E., Sarro, L. M., et al. 2015, A&A, 577, A148
- Bryja et al. (1994) Bryja, C., Humphreys, R. M., & Jones, T. J. 1994, AJ, 107, 246
- Caballero et al. (2007) Caballero, J. A., Béjar, V. J. S., Rebolo, R., et al. 2007, A&A, 470, 903
- Caffau et al. (2011) Caffau, E., Ludwig, H.-G., Steffen, M., Freytag, B., & Bonifacio, P. 2011, Sol. Phys., 268, 255
- Casewell et al. (2006) Casewell, S. L., Jameson, R. F., & Dobbie, P. D. 2006, MNRAS, 365, 447
- Casewell et al. (2014) Casewell, S. L., Littlefair, S. P., Burleigh, M. R., & Roy, M. 2014, MNRAS, 441, 2644
- Chabrier et al. (2000) Chabrier, G., Baraffe, I., Allard, F., & Hauschildt, P. 2000, ApJ, 542, 464
- Chumak et al. (2005) Chumak, Y. O., Rastorguev, A. S., & Aarseth, S. J. 2005, Astronomy Letters, 31, 308
- Copenhagen University et al. (2006) Copenhagen University, O., Institute, A. O., Cambridge, Uk, & Real Instituto Y Observatorio de La Armada, F. E. S. 2006, VizieR Online Data Catalog, 1304
- de La Fuente Marcos & de La Fuente Marcos (2000) de La Fuente Marcos, R. & de La Fuente Marcos, C. 2000, Ap&SS, 271, 127
- Deluca & Weis (1981) Deluca, E. E. & Weis, E. W. 1981, PASP, 93, 32
- Dobbie et al. (2002) Dobbie, P. D., Kenyon, F., Jameson, R. F., et al. 2002, MNRAS, 329, 543
- Ducourant et al. (2005) Ducourant, C., Teixeira, R., Périé, J. P., et al. 2005, A&A, 438, 769
- Ernst et al. (2011) Ernst, A., Just, A., Berczik, P., & Olczak, C. 2011, A&A, 536, A64
- Gizis et al. (1999) Gizis, J. E., Reid, I. N., & Monet, D. G. 1999, AJ, 118, 997
- Goldman et al. (2013) Goldman, B., Röser, S., Schilbach, E., et al. 2013, A&A, 559, A43
- Grankin (2013) Grankin, K. N. 2013, Astronomy Letters, 39, 336
- Griffin et al. (1988) Griffin, R. F., Griffin, R. E. M., Gunn, J. E., & Zimmerman, B. A. 1988, AJ, 96, 172
- Hewett et al. (2006) Hewett, P. C., Warren, S. J., Leggett, S. K., & Hodgkin, S. T. 2006, MNRAS, 367, 454
- Hogan et al. (2008) Hogan, E., Jameson, R. F., Casewell, S. L., Osbourne, S. L., & Hambly, N. C. 2008, MNRAS, 388, 495
- Jones (1973) Jones, D. H. P. 1973, MNRAS, 161, 19P
- Kenyon et al. (1994) Kenyon, S. J., Dobrzycka, D., & Hartmann, L. 1994, AJ, 108, 1872
- Kenyon & Hartmann (1995) Kenyon, S. J. & Hartmann, L. 1995, ApJS, 101, 117
- Kraus & Hillenbrand (2007) Kraus, A. L. & Hillenbrand, L. A. 2007, AJ, 134, 2340
- Kroupa (1995) Kroupa, P. 1995, MNRAS, 277, 1522
- Landolt (1992) Landolt, A. U. 1992, AJ, 104, 340
- Leggett et al. (1994) Leggett, S. K., Harris, H. C., & Dahn, C. C. 1994, AJ, 108, 944
- Leggett & Hawkins (1988) Leggett, S. K. & Hawkins, M. R. S. 1988, MNRAS, 234, 1065
- Lodieu et al. (2014) Lodieu, N., Boudreault, S., & Béjar, V. J. S. 2014, MNRAS, 445, 3908
- Lodieu et al. (2012a) Lodieu, N., Deacon, N. R., & Hambly, N. C. 2012a, MNRAS, 422, 1495
- Lodieu et al. (2012b) Lodieu, N., Deacon, N. R., Hambly, N. C., & Boudreault, S. 2012b, MNRAS, 426, 3403
- Luyten et al. (1981) Luyten, W. J., Hill, G., & Morris, S. 1981, Proper Motion Survey, University of Minnesota, 59, 1
- Melnikov & Eislöffel (2012) Melnikov, S. & Eislöffel, J. 2012, A&A, 544, A111
- Odenkirchen et al. (1998) Odenkirchen, M., Soubiran, C., & Colin, J. 1998, New A, 3, 583
- Peña Ramírez et al. (2012) Peña Ramírez, K., Béjar, V. J. S., Zapatero Osorio, M. R., Petr-Gotzens, M. G., & Martín, E. L. 2012, ApJ, 754, 30
- Perryman et al. (1998) Perryman, M. A. C., Brown, A. G. A., Lebreton, Y., et al. 1998, A&A, 331, 81
- Rebull et al. (2011) Rebull, L. M., Koenig, X. P., Padgett, D. L., et al. 2011, ApJS, 196, 4
- Reid & Hawley (1999) Reid, I. N. & Hawley, S. L. 1999, AJ, 117, 343
- Reid & Mahoney (2000) Reid, I. N. & Mahoney, S. 2000, MNRAS, 316, 827
- Reid (1992) Reid, N. 1992, MNRAS, 257, 257
- Reid (1993) Reid, N. 1993, MNRAS, 265, 785
- Robin et al. (2003) Robin, A. C., Reylé, C., Derrière, S., & Picaud, S. 2003, A&A, 409, 523
- Röser et al. (2011) Röser, S., Schilbach, E., Piskunov, A. E., Kharchenko, N. V., & Scholz, R.-D. 2011, A&A, 531, A92
- Rossow (1978) Rossow, W. B. 1978, Icarus, 36, 1
- Salpeter (1955) Salpeter, E. E. 1955, ApJ, 121, 161
- Skrutskie et al. (2006) Skrutskie, M. F., Cutri, R. M., Stiening, R., et al. 2006, AJ, 131, 1163
- Stauffer et al. (2007) Stauffer, J. R., Hartmann, L. W., Fazio, G. G., et al. 2007, ApJS, 172, 663
- Taylor & Joner (2002) Taylor, B. J. & Joner, M. D. 2002, in Bulletin of the American Astronomical Society, Vol. 34, American Astronomical Society Meeting Abstracts #200, 655
- Terlevich (1987) Terlevich, E. 1987, MNRAS, 224, 193
- Wang et al. (2014) Wang, P. F., Chen, W. P., Lin, C. C., et al. 2014, ApJ, 784, 57
- Zapatero Osorio et al. (2014) Zapatero Osorio, M. R., Gálvez Ortiz, M. C., Bihain, G., et al. 2014, A&A, 568, A77
Appendix A Hyades photometric member candidates
In Table LABEL:phot_cand, we provide a list of 66 optically selected Hyades member candidates inferred from an CMD that were selected for follow-up based on 2MASS photometry.
| Object | 2MASS | RATLS | DECTLS | SpT | SpT | |||||
|---|---|---|---|---|---|---|---|---|---|---|
| TLS-Hy-.. | (J2000) | (mag) | (mag) | 2MASS | ||||||
| 101 | 04170259+1244198 | 04 17 02.6 | 12 44 20 | 16.15 0.01 | 1.95 0.02 | 14.02 | 13.45 | 13.19 | M6 | M7 |
| 1 | 04173123+1523010 | 04 17 31.3 | 15 23 01 | 14.88 0.01 | 1.61 0.01 | 13.17 | 12.46 | 12.18 | M5 | M6 |
| 102 | 04175203+1536240 | 04 17 52.0 | 15 36 24 | 15.65 0.01 | 1.90 0.01 | 13.53 | 12.91 | 12.64 | M5 | M6 |
| 2 | 04180046+1335570 | 04 18 00.5 | 13 35 58 | 16.04 0.01 | 2.29 0.01 | 14.13 | 13.54 | 13.18 | M6 | M7 |
| 103 | 04182141+1651372 | 04 18 21.4 | 16 51 37 | 14.55 0.01 | 1.59 0.01 | 12.79 | 12.19 | 11.93 | M5 | M5 |
| 3 | 04185110+1359240 | 04 18 51.1 | 13 59 24 | 14.82 0.01 | 1.73 0.01 | 12.87 | 12.30 | 12.00 | M5 | M5 |
| 4 | 04185767+1610553 | 04 18 57.7 | 16 10 56 | 15.44 0.01 | 1.73 0.01 | 13.64 | 13.03 | 12.71 | M5 | M6 |
| 104 | 04190236+1305327 | 04 19 02.3 | 13 05 33 | 18.52 0.05 | 2.65 0.13 | 15.36 | 14.85 | 14.45 | M9 | L0 |
| 105 | 04193697+1433329 | 04 19 37.0 | 14 33 33 | 17.06 0.01 | 2.36 0.02 | 14.36 | 13.67 | 13.26 | M7 | M8 |
| 5 | 04194169+1645222 | 04 19 41.8 | 16 45 22 | 17.00 0.01 | 2.42 0.01 | 14.43 | 13.86 | 13.53 | M7 | M8 |
| 106 | 04195465+1647274 | 04 19 54.7 | 16 47 28 | 15.43 0.01 | 1.83 0.01 | 13.43 | 12.73 | 12.41 | M5 | M6 |
| 6 | 04205016+1345531 | 04 20 50.3 | 13 45 53 | 17.32 0.02 | 2.42 0.04 | 14.27 | 13.56 | 13.06 | M7 | M7 |
| 107 | 04211753+1530035 | 04 21 17.6 | 15 30 04 | 17.17 0.01 | 2.27 0.02 | 14.42 | 13.74 | 13.26 | M7 | M8 |
| 108 | 04215127+1532560 | 04 21 51.3 | 15 32 57 | 18.42 0.05 | 2.20 0.09 | 15.46 | 14.04 | 13.46 | M8 | M8 |
| 109 | 04215218+1519409 | 04 21 52.2 | 15 19 42 | 16.72 0.01 | 2.06 0.02 | 14.24 | 13.47 | 13.09 | M6 | M7 |
| 7 | 04220512+1358474 | 04 22 05.2 | 13 58 47 | 18.63 0.03 | 2.46 0.09 | 15.50 | 14.81 | 14.25 | M9 | L0 |
| 110 | 04223075+1526310 | 04 22 30.7 | 15 26 32 | 17.23 0.02 | 2.32 0.04 | 14.36 | 13.55 | 13.08 | M7 | M7 |
| 111 | 04223593+1402256 | 04 22 36.0 | 14 02 25 | 15.71 0.01 | 1.86 0.01 | 13.67 | 12.96 | 12.67 | M5 | M6 |
| 112 | 04223914+1657504 | 04 22 39.1 | 16 57 50 | 15.01 0.01 | 1.68 0.01 | 13.07 | 12.54 | 12.26 | M5 | M6 |
| 113 | 04224621+1227080 | 04 22 46.2 | 12 27 09 | 16.08 0.02 | 1.95 0.03 | 14.04 | 13.48 | 13.13 | M6 | M7 |
| 114 | 04225357+1308433 | 04 22 53.6 | 13 08 44 | 14.95 0.01 | 1.74 0.01 | 12.95 | 12.22 | 11.93 | M5 | M5 |
| 115 | 04232421+1559537 | 04 23 24.2 | 15 59 55 | 17.34 0.02 | 2.29 0.04 | 14.65 | 13.99 | 13.60 | M7 | M9 |
| 116 | 04232470+1541451 | 04 23 24.7 | 15 41 43 | 17.28 0.02 | 2.41 0.04 | 14.67 | 14.12 | 13.79 | M7 | M9 |
| 117 | 04232781+1702288 | 04 23 27.8 | 17 02 29 | 15.03 0.01 | 1.74 0.01 | 13.07 | 12.52 | 12.20 | M5 | M6 |
| 118 | 04233547+1552267 | 04 23 35.5 | 15 52 28 | 14.22 0.01 | 1.77 0.01 | 12.21 | 11.57 | 11.29 | M4 | M5 |
| 119 | 04235702+1632458 | 04 23 57.0 | 16 32 46 | 14.16 0.01 | 1.69 0.01 | 12.27 | 11.72 | 11.44 | M4 | M5 |
| 120 | 04240478+1424268 | 04 24 04.8 | 14 24 27 | 15.25 0.01 | 1.76 0.01 | 13.44 | 12.87 | 12.64 | M5 | M6 |
| 121 | 04240618+1439207 | 04 24 06.2 | 14 39 21 | 14.92 0.01 | 1.73 0.01 | 13.11 | 12.53 | 12.28 | M5 | M6 |
| 122 | 04240703+1332409 | 04 24 07.0 | 13 32 41 | 15.80 0.01 | 2.06 0.01 | 13.38 | 12.82 | 12.51 | M6 | M6 |
| 123 | 04243380+1529345 | 04 24 33.8 | 15 29 36 | 15.04 0.01 | 2.20 0.01 | 12.72 | 12.05 | 11.75 | M5 | M5 |
| 124 | 04243861+1604462 | 04 24 38.6 | 16 04 47 | 15.44 0.01 | 1.82 0.01 | 13.63 | 13.04 | 12.70 | M5 | M6 |
| 125 | 04251419+1541079 | 04 25 14.3 | 15 41 08 | 17.70 0.02 | 2.69 0.04 | 14.71 | 13.94 | 13.49 | M7 | M9 |
| 126 | 04252314+1735150 | 04 25 23.1 | 17 35 15 | 17.71 0.02 | 2.43 0.07 | 14.86 | 14.27 | 13.74 | M7 | L0 |
| 127 | 04253933+1723033 | 04 25 39.3 | 17 23 03 | 15.73 0.01 | 1.91 0.01 | 13.75 | 13.18 | 12.87 | M5 | M5 |
| 128 | 04260896+1310379 | 04 26 08.9 | 13 10 38 | 15.59 0.01 | 1.83 0.01 | 13.40 | 12.72 | 12.38 | M5 | M6 |
| 129 | 04261090+1408590 | 04 26 10.9 | 14 08 57 | 15.75 0.01 | 2.05 0.01 | 13.63 | 13.14 | 12.79 | M6 | M6 |
| 8 | 04261903+1703021 | 04 26 19.1 | 17 03 02 | 14.93 0.01 | 1.92 0.01 | 12.87 | 12.28 | 11.91 | M5 | M5 |
| 130 | 04263477+1339146 | 04 26 34.7 | 13 39 14 | 14.98 0.01 | 1.74 0.01 | 13.18 | 12.58 | 12.28 | M5 | M6 |
| 131 | 04264240+1638001 | 04 26 42.4 | 16 38 00 | 15.45 0.01 | 1.76 0.01 | 13.54 | 12.97 | 12.63 | M5 | M6 |
| 132 | 04270289+1558224 | 04 27 02.9 | 15 58 24 | 14.83 0.03 | 1.93 0.05 | 12.90 | 12.18 | 11.80 | M5 | M5 |
| 9 | 04270528+1310323 | 04 27 05.3 | 13 10 33 | 16.44 0.01 | 2.03 0.01 | 14.32 | 13.71 | 13.36 | M6 | M8 |
| 133 | 04273932+1507345 | 04 27 39.2 | 15 07 34 | 15.54 0.01 | 2.23 0.01 | 13.34 | 12.80 | 12.47 | M5 | M6 |
| 134 | 04284199+1533535 | 04 28 42.0 | 15 33 54 | 14.78 0.01 | 1.82 0.01 | 12.88 | 12.29 | 12.04 | M5 | M5 |
| 135 | 04285859+1517386 | 04 28 58.6 | 15 17 38 | 15.07 0.01 | 1.95 0.01 | 13.06 | 12.38 | 12.08 | M5 | M6 |
| 10 | 04290287+1337586 | 04 29 02.9 | 13 37 59 | 15.15 0.01 | 2.32 0.01 | 12.65 | 11.94 | 11.62 | M5 | M5 |
| 11 | 04300417+1604079 | 04 30 04.2 | 16 04 08 | 15.02 0.01 | 2.04 0.02 | 12.88 | 12.33 | 11.99 | M5 | M5 |
| 136 | 04301227+1301086 | 04 30 12.3 | 13 01 09 | 16.48 0.02 | 2.07 0.03 | 14.14 | 13.54 | 13.16 | M6 | M7 |
| 137 | 04302653+1737482 | 04 30 26.5 | 17 37 48 | 15.38 0.01 | 1.75 0.01 | 13.55 | 12.92 | 12.64 | M5 | M6 |
| 138 | 04302914+1347595 | 04 30 29.1 | 13 48 01 | 14.87 0.01 | 1.82 0.01 | 12.84 | 12.07 | 11.72 | M5 | M5 |
| 139 | 04304840+1455210 | 04 30 48.4 | 14 55 21 | 15.10 0.01 | 1.68 0.01 | 13.31 | 12.64 | 12.33 | M5 | M6 |
| 140 | 04305333+1725355 | 04 30 53.3 | 17 25 36 | 14.78 0.01 | 1.76 0.02 | 13.05 | 12.41 | 12.17 | M5 | M6 |
| 141 | 04310937+1706564 | 04 31 09.3 | 17 06 56 | 15.22 0.02 | 1.73 0.02 | 13.37 | 12.83 | 12.54 | M5 | M6 |
| 12 | 04311634+1500122 | 04 31 16.4 | 15 00 12 | 14.69 0.01 | 1.92 0.01 | 12.63 | 12.07 | 11.71 | M5 | M5 |
| 142 | 04312630+1329547 | 04 31 26.3 | 13 29 55 | 15.19 0.01 | 1.73 0.01 | 13.32 | 12.78 | 12.46 | M5 | M5 |
| 143 | 04315853+1300465 | 04 31 58.5 | 13 00 47 | 15.41 0.01 | 1.76 0.01 | 13.31 | 12.58 | 12.23 | M5 | M6 |
| 144 | 04323779+1437237 | 04 32 37.7 | 14 37 25 | 15.49 0.01 | 1.80 0.01 | 13.75 | 13.21 | 12.81 | M5 | M7 |
| 145 | 04323801+1508525 | 04 32 38.0 | 15 08 52 | 16.87 0.01 | 2.33 0.02 | 13.92 | 13.14 | 12.73 | M7 | M6 |
| 13 | 04325119+1730092 | 04 32 51.2 | 17 30 09 | 17.83 0.02 | 2.67 0.06 | 14.69 | 13.99 | 13.56 | M8 | M9 |
| 146 | 04325917+1652587 | 04 32 59.1 | 16 52 58 | 15.11 0.01 | 1.74 0.01 | 13.23 | 12.54 | 12.24 | M5 | M6 |
| 14 | 04332808+1729317 | 04 33 28.1 | 17 29 32 | 15.56 0.01 | 1.83 0.01 | 13.71 | 13.15 | 12.86 | M5 | M6 |
| 147 | 04333831+1712198 | 04 33 38.3 | 17 12 18 | 14.75 0.01 | 1.86 0.01 | 12.81 | 12.23 | 11.91 | M5 | M5 |
| 148 | 04335100+1257033 | 04 33 51.0 | 12 57 05 | 16.11 0.01 | 2.11 0.02 | 13.86 | 13.29 | 12.95 | M6 | M7 |
| 149 | 04335913+1738506 | 04 33 59.0 | 17 38 50 | 15.92 0.01 | 1.98 0.01 | 13.90 | 13.35 | 12.99 | M6 | M7 |
| 150 | 04341755+1711312 | 04 34 17.5 | 17 11 31 | 15.08 0.01 | 2.05 0.01 | 12.88 | 12.27 | 11.94 | M5 | M5 |
| 151 | 04342571+1426147 | 04 34 25.8 | 14 26 15 | 15.88 0.01 | 1.99 0.01 | 13.84 | 13.31 | 13.01 | M6 | M7 |
| 152 | 04361002+1447125 | 04 36 10.0 | 14 47 12 | 17.43 0.01 | 2.49 0.04 | 14.83 | 14.20 | 13.81 | M7 | L0 |
| Object | epoch | Notes | Object | epoch | Notes | ||||
|---|---|---|---|---|---|---|---|---|---|
| (mas yr-1) | (mas yr-1) | (mas yr-1) | (mas yr-1) | ||||||
| 101 | 12.4 | 6.3 | 1953.78–2010.67 | 127 | 14.7 | 7.6 | 1955.94–2007.18 | VB? | |
| 102 | 19.7 | 23.4 | 1950.94–2006.91 | 128 | 12.0 | 7.2 | 1955.95–2006.91 | ||
| 103 | 20.5 | 18.5 | 1950.94–2006.91 | 129 | 12.7 | 6.1 | 1955.95–2009.69 | ||
| 104 | 13.8 | 33.6 | 1995.73–2010.66 | VB | 130 | 11.2 | 5.2 | 1955.95–2009.69 | VB? |
| 105 | 18.2 | 4.6 | 1953.78–2006.91 | 131 | 11.8 | 10.4 | 1955.94–2006.91 | VB? | |
| 106 | 20.6 | 12.3 | 1950.94–2006.91 | 132 | 18.9 | 16.6 | 1955.94–2006.91 | ||
| 107 | 14.8 | 9.1 | 1955.95–2007.22 | 133 | 14.3 | 6.5 | 1955.95–2007.22 | ||
| 108 | 25.1 | 12.9 | 1989.85–2010.67 | 134 | 14.4 | 13.0 | 1955.95–2007.22 | ||
| 109 | 12.0 | 14.1 | 1955.95–2007.22 | 135 | 15.2 | 12.0 | 1955.95–2007.22 | ||
| 110 | 29.8 | 17.1 | 1989.85–2010.67 | 136 | 16.1 | 13.9 | 1955.95–2006.91 | ||
| 111 | 13.1 | 4.5 | 1955.95–2009.69 | 137 | 11.0 | 15.3 | 1955.95–2007.18 | VB? | |
| 112 | 11.2 | 10.0 | 1955.95–2007.18 | 138 | 15.8 | 9.7 | 1955.95–2006.91 | ||
| 113 | 2.6 | 3.0 | 1955.95–2010.67 | 139 | 12.2 | 7.5 | 1955.95–2006.91 | ||
| 114 | 13.7 | 9.6 | 1955.95–2006.91 | VB | 140 | 10.0 | 15.5 | 1955.95–2007.18 | VB? |
| 115 | 43.6 | 22.5 | 1989.85–2010.67 | 141 | 17.5 | 14.4 | 1955.94–2007.18 | VB? | |
| 116 | 34.3 | 16.6 | 1989.85–2010.67 | 142 | 10.7 | 6.5 | 1955.95–2006.91 | ||
| 117 | 12.4 | 8.3 | 1955.95–2007.18 | 143 | 9.2 | 7.5 | 1955.95–2006.91 | ||
| 118 | 14.5 | 16.6 | 1955.95–2007.22 | VB | 144 | 13.1 | 9.9 | 1955.95–2010.67 | |
| 119 | 13.1 | 11.5 | 1955.95–2006.91 | 145 | 14.1 | 10.3 | 1955.95–2006.91 | ||
| 120 | 11.9 | 4.5 | 1955.95–2010.67 | 146 | 15.4 | 22.4 | 1955.94–2006.91 | ||
| 121 | 15.3 | 4.8 | 1955.95–2007.22 | 147 | 15.3 | 20.2 | 1955.94–2006.91 | ||
| 122 | 14.9 | 6.1 | 1955.95–2009.69 | 148 | 21.4 | 7.0 | 1955.95–2006.91 | ||
| 123 | 13.8 | 16.8 | 1955.94–2007.22 | VB? | 149 | 4.0 | 1.0 | 1955.95–2006.91 | |
| 124 | 12.9 | 13.1 | 1955.94–2008.84 | 150 | 11.1 | 21.8 | 1955.95–2006.91 | ||
| 125 | 9.8 | 7.6 | 1955.94–2009.68 | VB? | 151 | 10.1 | 6.3 | 1955.95–2010.67 | |
| 126 | 7.6 | 7.4 | 1995.73–2010.67 | VB? | 152 | 19.4 | 10.7 | 1989.94–2010.68 | VB? |
VB = a visual binary (partially resolved system), VB? = a possible visual binary (resolved system)