Emergent memory in cell signaling: Persistent adaptive dynamics in cascades can arise from the diversity of relaxation time-scales

Tanmay Mitra1,2, Shakti N. Menon1 and Sitabhra Sinha1,2 1The Institute of Mathematical Sciences, CIT Campus, Taramani, Chennai 600113, India.
2Homi Bhabha National Institute, Anushaktinagar, Mumbai 400 094, India.
Abstract

The mitogen-activated protein kinase (MAPK) signaling cascade, an evolutionarily conserved motif present in all eukaryotic cells, is involved in coordinating critical cell-fate decisions, regulating protein synthesis, and mediating learning and memory. While the steady-state behavior of the pathway stimulated by a time-invariant signal is relatively well-understood, we show using a computational model that it exhibits a rich repertoire of transient adaptive responses to changes in stimuli. When the signal is switched on, the response is characterized by long-lived modulations in frequency as well as amplitude. On withdrawing the stimulus, the activity decays over timescales much longer than that of phosphorylation-dephosphorylation processes, exhibiting reverberations characterized by repeated spiking in the activated MAPK concentration. The long-term persistence of such post-stimulus activity suggests that the cascade retains memory of the signal for a significant duration following its removal, even in the absence of any explicit feedback or cross-talk with other pathways. We find that the molecular mechanism underlying this behavior is related to the existence of distinct relaxation rates for the different cascade components. This results in the imbalance of fluxes between different layers of the cascade, with the repeated reuse of activated kinases as enzymes when they are released from sequestration in complexes leading to one or more spike events following the removal of the stimulus. The persistent adaptive response reported here, indicative of a cellular “short-term” memory, suggests that this ubiquitous signaling pathway plays an even more central role in information processing by eukaryotic cells.

pacs:
87.16.Xa,87.17.Aa,87.18.Vf

I Introduction

Intra-cellular signaling networks are paradigmatic examples of complex adaptive systems that exhibit a rich repertoire of responses to stimuli IyengarEm1999 . Such networks mediate the response of a cell to a wide variety of extra- and intra-cellular signals primarily through a sequence of enzyme-substrate biochemical reactions Lahav2013 ; Kholodenko2006 . While the complexity of the entire signaling system is daunting Iyengar1999 , it is possible to gain an insight into how it functions by focusing on a key set of frequently occurring motifs. These often take the form of linear signaling cascades, referred to as pathways. One of the best known of these pathways is the mitogen-activated protein kinase (MAPK) cascade that is present in all eukaryotic cells Johnson1999 ; Seger1995 . It is involved in regulating a range of vital cellular functions, including proliferation and apoptosis Seger1995 , stress response Cooper1995 and gene expression Karin1996 . This signaling module comprises a sequential arrangement of three protein kinases, viz., MAPK, MAPK kinase (MAP2K) and MAPK kinase kinase (MAP3K). Modular function is initiated when extracellular signals stimulate membrane-bound receptors upstream of the cascade, with the information being relayed to MAP3K by a series of intermediaries. Activated kinases in each layer of the module function as enzymes for phosphorylating (and thereby activating) the kinase in the level immediately downstream, with the subsequent deactivation being mediated by corresponding dephosphorylating enzymes known as phosphatases (P’ase). The terminal kinase in this cascade, i.e., MAPK, transmits the signal further downstream by phosphorylating various proteins including transcription regulators Alberts6thed . Extensive investigations into the steady-state behavior of the cascade have contributed towards an in-depth understanding of several emergent features including ultrasensitivity Ferrell1996 , and oscillations Shankaran2009 ; Qiao2007 that arise through retrograde propagation of activity Sitabhra2013 ; Ventura2008 . One of the striking features of the cascade is the occurrence of bistability which allows the system to switch between two possible states corresponding to low and high activity Kholodenko2004 ; Herzel2007 ; KholodenkoBS2006 ; Qiao2007 ; Ferrell2002 . This provides a post-transcriptional mechanism for obtaining a sustained response from transient signals, i.e., cellular memory Inniss2013 ; Xiong2003 .

Memory can be understood as long-term alterations in the state of a system in response to environmental changes, which allow the system to retain information about transient signals long after being exposed to them Inniss2013 . This can arise in the cell through mechanisms such as auto-regulatory transcriptional positive feedback Silver2007 and nucleosomal modifications Burrill2010 . In the context of cell-fate determination, it has been shown that an irreversible biochemical response can be generated from a short-lived stimulus through feedback-based bistability Xiong2003 . This corresponds to a permanent alteration of the state of the system, thereby actively maintaining ‘memory’ of the signal. As bistability has also been observed to arise through multi-site phosphorylation in signaling modules, protein phosphorylation has been suggested as a plausible post-transcriptional mechanism for cellular memory Gunawardena2005 ; Hadac2013 ; Inniss2013 . In particular, there have been extensive investigations of the MAPK cascade as it integrates a large range of signals received by the cell in order to control numerous cellular decisions Carew2013 ; Tsien2001 ; Sweatt2001 ; Schaller2004 ; Bonnet2005 ; Flavell2002 . While these investigations have considered the steady state behavior of the system, one may also observe transitory modulations in the response of the cascade in a changing environment. The latter could encode information about prior stimuli to which the system was exposed, and can be a potential mechanism for imparting a form of “short-term” memory to the signaling cascade.

In this paper we show that a linear MAPK cascade can indeed exhibit short-term memory through transient modulations in its response to an environmental change. Crucially, this can arise even in the absence of explicit feedback between different layers or cross-talk with other pathways. These modulations can persist long after the initial trigger, lasting for durations that are several orders of magnitude longer than the time-scales associated with phosphorylation-dephosphorylation processes. We demonstrate that this occurs both when a signal begins activating the MAPK cascade, as well as when it is withdrawn. On application of the stimulus, the module exhibits long-lived frequency and amplitude modulations in the activation profile of the constituent kinases. Following the withdrawal of stimulus, activity in the cascade decays over an extremely long time-scale, during which reverberatory dynamics, characterized by large-amplitude spiking in MAP Kinase activity, can be observed. We explain the emergence of such long-lived memory of the withdrawn stimulus in terms of the imbalance of fluxes between different layers of the cascade, which results from the diversity of relaxation time-scales of the cascade components, and the reuse of activated kinases as enzymes when they are released from sequestration. This phenomenon is seen to be robust with respect to variations in the molecular concentrations of the constituent kinases and phosphatases. Our results reveal that a biochemical signaling module as simple as the MAPK cascade is capable of exhibiting short-term memory that is manifested as persistent modulations in the adaptive response of the system to changes in stimuli.

II Methods

The dynamics of the three layer MAPK signaling cascade has been simulated using the Huang-Ferrell model Ferrell1996 . Each of the constituent kinase and phosphatase-mediated enzyme-substrate reactions comprise (i) a reversible step corresponding to the formation of the enzyme-substrate complex and (ii) an irreversible product formation step corresponding to the activation/deactivation of a kinase, as described in the Supplementary Information. The time-evolution of the molecular concentrations of the different components of the cascade are modeled using a set of coupled ordinary differential equations (see Supplementary Information) that are integrated using the stiff solver ode15s implemented in MATLAB Release 2010b. Note that the quasi-steady-state hypothesis has not been invoked Wolkenhauer2007 . To ensure that initially all kinases are non-phosphorylated we prepare the initial resting state of the system by simulating it for a long duration (106similar-toabsentsuperscript106\sim 10^{6} mins) in the absence of any signal. Subsequently MAP3K is exposed to a stimulus of amplitude S𝑆S and duration 500050005000 minutes. Following the removal of the stimulus, we continue to simulate the system until it returns to the resting state or the simulation duration exceeds 104superscript10410^{4} minutes.

We have analyzed the long-lived reverberatory activity of the cascade after the removal of the stimulus by using the following measures:

(i) The primary recovery time (τPRsubscript𝜏PR\tau_{\rm PR}). Following the activation of the cascade by introducing a stimulus, the maximum concentration Rmaxsubscript𝑅maxR_{\rm max} of MAPK∗∗ is recorded (Note that ∗∗ represents a doubly phosphorylated kinase while indicates that it is singly phosphorylated). On removing the stimulus, MAPK activity starts to decay. The time taken for MAPK∗∗ to monotonically decrease to half of Rmaxsubscript𝑅maxR_{\rm max} is defined as the primary recovery time (τPRsubscript𝜏PR\tau_{\rm PR}).

(ii) Number of spikes during relaxation (Nrsubscript𝑁𝑟N_{r}). Following primary recovery, MAPK activity may exhibit a series of spikes, which are defined to be occurring whenever MAPK∗∗ concentration exceeds 70%percent7070\% of Rmaxsubscript𝑅maxR_{\rm max}. The number of such spikes that are observed before the cascade reaches its resting state is designated as Nrsubscript𝑁𝑟N_{r}.

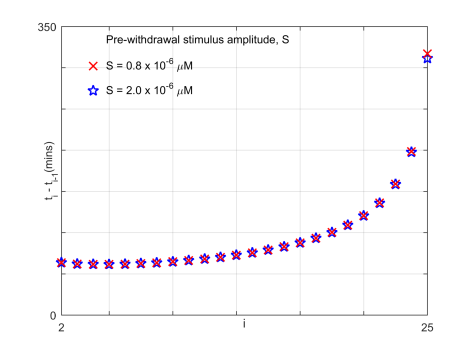
(iii) The total duration of reverberatory activity (τrsubscript𝜏𝑟\tau_{r}). When spiking is observed in MAPK activity following the removal of the applied stimulus, the reverberatory activity duration is defined as the interval between the termination of primary recovery and the final spike event, i.e., τr=tfinalτPRsubscript𝜏𝑟subscript𝑡𝑓𝑖𝑛𝑎𝑙subscript𝜏𝑃𝑅\tau_{r}=t_{final}-\tau_{PR}. The time of the i𝑖ith spike tisubscript𝑡𝑖t_{i} is defined as the instant when MAPK activity reaches maximum during that particular event. For τPR>6000subscript𝜏𝑃𝑅6000\tau_{PR}>6000 mins, the total duration of the reverberatory activity may not be measured accurately as the total simulation duration does not exceed 104superscript10410^{4} minutes.

(iv) The total memory time (τmsubscript𝜏𝑚\tau_{m}). The total duration of memory activity following removal of the applied stimulus is defined as the sum of the primary recovery time and the total duration of reverberatory activity, i.e., τm=τPR+τrsubscript𝜏𝑚subscript𝜏𝑃𝑅subscript𝜏𝑟\tau_{m}=\tau_{PR}+\tau_{r}. Note that when the steady-state behavior of the cascade in presence of the signal is oscillatory, on withdrawing the signal the activity may decay extremely rapidly resulting in τm0subscript𝜏𝑚0\tau_{m}\approx 0.

(v) Relaxation time (τxsubscript𝜏x\tau_{\rm x}). For the situations where the steady state corresponds to a fixed-point attractor we define a relaxation time τxsubscript𝜏x\tau_{\rm x} for each constituent of the cascade. This is the time required by its concentration to evolve to the half-way point between the resting state and steady state values.

Refer to caption
Figure 1: Adaptive response of MAPK cascade to a changing stimulus. (a) Schematic representation of a linear MAPK cascade comprising three layers. Signaling is initiated by a stimulus S activating MAPK kinase kinase (MAP3K). Activation/deactivation of kinases is achieved by adding/removing phosphate groups, which is referred to as phosphorylation/dephosphorylation respectively. The activated MAP3K regulates the phosphorylation of MAPK kinase (MAP2K). Doubly phosphorylated MAP2K, in its turn, controls the activation of MAPK. The response of the cascade to the signal is measured in terms of MAPK activity, viz., the concentration of doubly phosphorylated MAPK. Deactivation of a phosphorylated kinase is regulated by the corresponding phosphatase (indicated by P’ase) in the corresponding layer of the cascade. The numbers 14141-4 represent the sequence of events that lead to the emergence of a large amplitude spiking response following the withdrawal of the stimulus. The enzyme-substrate protein complex formed during activation of MAPK by doubly phosphorylated MAP2K is indicated by “c”. Broken lines have been used to highlight the principal processes that drive the reverberatory dynamics, which functions as a memory of the signal (see text for details). (b) Schematic illustrating the emergence of long-lived transient modulations of MAPK activity in response to initiation of a signal of optimal strength S𝑆S. Withdrawing the stimulus can result in persistent large-amplitude spiking in the response of MAPK, suggestive of a form of “short-term” memory. The maximum response of MAPK to the stimulus is denoted by Rmaxsubscript𝑅maxR_{\rm max}. The primary recovery time (τPRsubscript𝜏𝑃𝑅\tau_{PR}) is characterized as the duration following withdrawal of stimulus after which MAPK activity decreases to its half-maximum value (Rmax/2subscript𝑅max2R_{\rm max}/2) for the first time. The duration over which reverberatory dynamics occurs is indicated by τrsubscript𝜏𝑟\tau_{r}, while the total duration for which memory of the withdrawn stimulus persists is τm=τPR+τrsubscript𝜏𝑚subscript𝜏𝑃𝑅subscript𝜏𝑟\tau_{m}=\tau_{PR}+\tau_{r}.

III Results

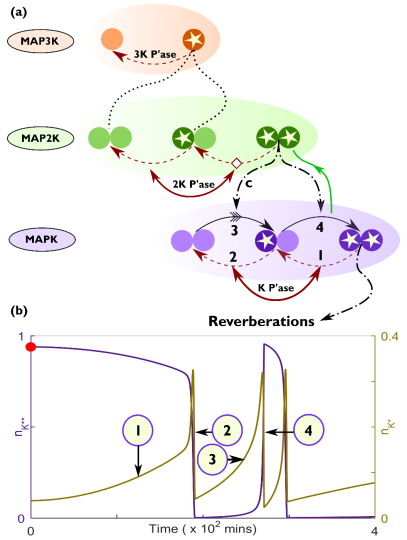
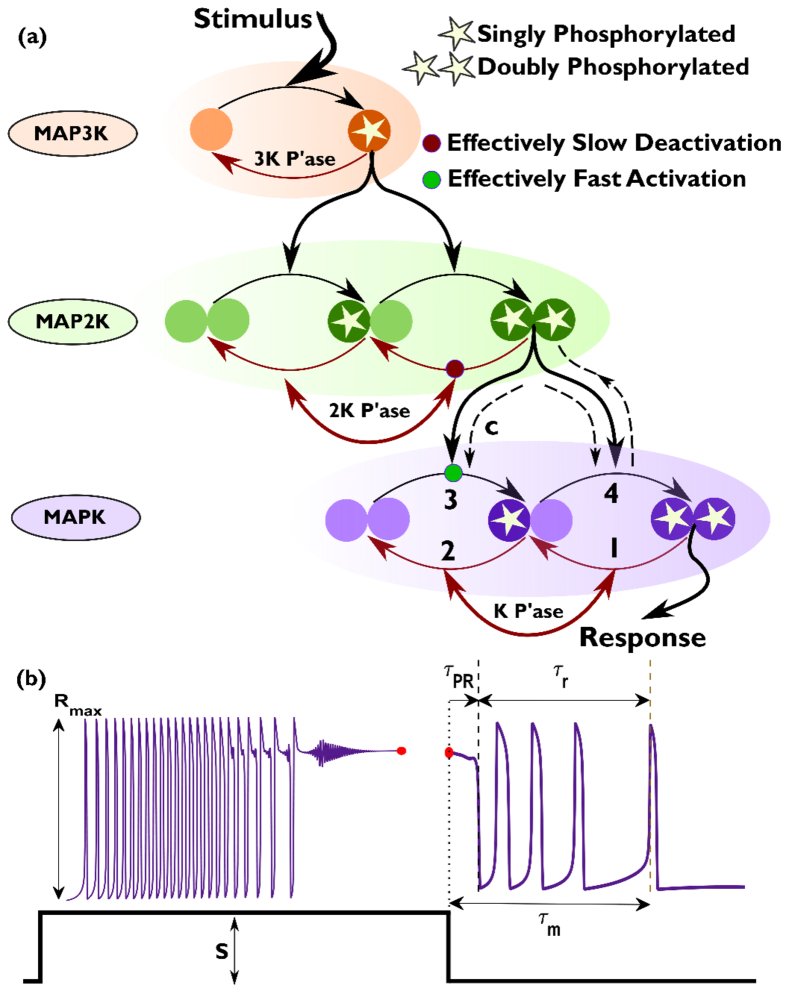
Emergence of persistent modulations in kinase activity. For the results reported in this paper we consider the Huang-Ferrell model of the MAPK signaling cascade Ferrell1996 , schematically shown in Fig. 1 (a). Typically, investigations into the dynamics of this model focus on the steady-state response to sustained stimulation. In contrast, here we report on the transient activity of the system following a change in the stimulus. Specifically, we describe the response immediately following the introduction of a signal of amplitude S𝑆S and that following its removal. Our results reveal that such transients can be unexpectedly long-lived, lasting for durations that are much longer compared to the time-scales associated with the phosphorylation and dephosphorylation processes in the cascade (Fig. 1, b).

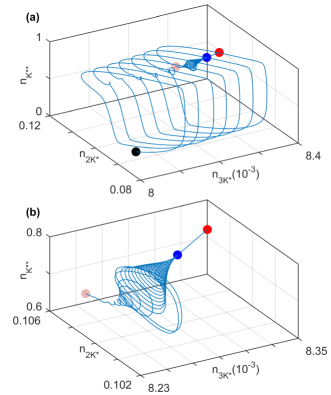
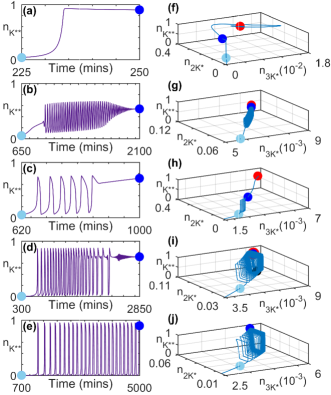
We first report the behavior of a cascade that is initially in the resting state (characterized by the absence of any phosphorylated components) when it is exposed to a signal. The transient activity that immediately follows exhibits several non-trivial features such as regular spiking in the activity of MAP2K and MAPK depending on the total concentrations of the kinases (Fig. 2, b-e) and the signal strength. For a fixed initial state and signal strength, the spikes can further show modulation in their frequency (Fig. 2, c-e) as well as amplitude (Fig. 2, b and d). In certain cases, both types of modulation can be observed (Fig. 2, d). In the representative time series of MAPK activity shown in Fig. 2(a-e), the system dynamics eventually converges to a stable fixed point (Fig. 2, a-d) or a stable limit cycle (Fig. 2, e), with the attractors being independent of initial conditions (corresponding phase space projections are shown in Fig. 2, f-i). Note that when phosphorylated components are initially present, the system reaches the asymptotic state faster.

Refer to caption
Figure 2: Transient activity in MAPK cascade immediately following the application of a stimulus having amplitude S=1.2×10⁶μM𝑆1.2superscript106𝜇𝑀S=1.2\times 10^{-6}\mu M at t=0𝑡0t=0. (a-e) Characteristic time series for the normalized concentration of doubly phosphorylated MAPK (nKsubscript𝑛superscript𝐾absentn_{K^{**}}) shown for different total concentrations of kinases. The concentration of active MAPK is insignificant prior to the time periods shown in panels (a-e). (f-j) Trajectories representing the evolution of the systems in panels (a-e) in the projection of the phase-space on the planes comprising normalized concentrations of active MAP3K (n3Ksubscript𝑛3superscript𝐾n_{3K^{*}}), singly phosphorylated MAP2K (n2Ksubscript𝑛2superscript𝐾n_{2K^{*}}) and active MAPK (nKsubscript𝑛superscript𝐾absentn_{K^{**}}). The concentrations have been normalized by the total concentration of MAP3K ([3K]totsubscriptdelimited-[]3𝐾𝑡𝑜𝑡[3K]_{tot}), MAP2K ([2K]totsubscriptdelimited-[]2𝐾𝑡𝑜𝑡[2K]_{tot}) and MAPK ([K]totsubscriptdelimited-[]𝐾𝑡𝑜𝑡[K]_{tot}), respectively. The light blue and dark blue markers in each of the panels (f-j) demarcate the portion of the trajectories that correspond to the time series shown in panels (a-e). The steady state of the system is represented by a red marker in panels (f-i). In panels (e) and (j), the system converges to a stable limit cycle. For details of parameter values for the systems shown in each of the panels see Supplementary Information.
Refer to caption
Figure 3: Transient activity in MAPK cascade immediately following the withdrawal (at t=0𝑡0t=0) of an applied stimulus having amplitude S=1.2×10⁶μM𝑆1.2superscript106𝜇𝑀S=1.2\times 10^{-6}\mu M. (a-e) Characteristic time series for the normalized concentration of doubly phosphorylated MAPK (nKsubscript𝑛superscript𝐾absentn_{K^{**}}) shown for different total concentrations of kinases. (f-j) Trajectories representing the evolution of the systems in panels (a-e) in the projection of the phase-space on the planes comprising normalized concentrations of active MAP3K (n3Ksubscript𝑛3superscript𝐾n_{3K^{*}}), singly phosphorylated MAPK (n2Ksubscript𝑛2superscript𝐾n_{2K^{*}}) and active MAPK (nKsubscript𝑛superscript𝐾absentn_{K^{**}}). The concentrations have been normalized by the total concentration of MAP3K ([3K]totsubscriptdelimited-[]3𝐾𝑡𝑜𝑡[3K]_{tot}), MAP2K ([2K]totsubscriptdelimited-[]2𝐾𝑡𝑜𝑡[2K]_{tot}) and MAPK ([K]totsubscriptdelimited-[]𝐾𝑡𝑜𝑡[K]_{tot}), respectively. The steady state of the system prior to the withdrawal of the stimulus is represented by a red marker (panels f-i). The system in panels (e) and (j) is seen to relax from a state characterized by stable limit cycle oscillations (represented by the blue marker). In each trajectory shown in (f-j) the grey marker denotes the state of the system corresponding to the final time point in panels (a-e). The concentration of active MAPK is close to its resting state value following the time period shown in (a-e). The parameter values for each panel are same as those for the corresponding panels in Fig. 2.

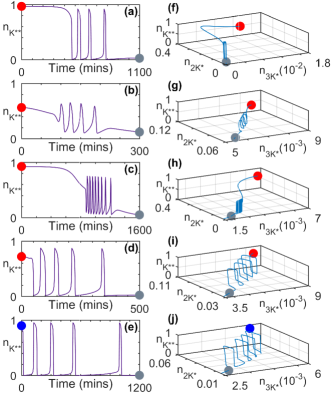
When the signal is withdrawn, the signaling cascade can respond with large-amplitude spiking behavior in the MAPK activity before eventually relaxing to the resting state (Fig. 3). These phenomena are seen for a range of stimuli strengths and are indicative of a form of memory that can be achieved without explicit feedback or inter-pathway crosstalk. An essential condition for observing the reverberatory activity is that prior to withdrawing the applied stimulus, the system state has been driven above the low-amplitude response regime. The complex modulations seen in these figures may arise as a result of coexisting attractors. For example, in Fig. 2 (d) the system state spends considerable time in the basin of attraction of a limit cycle before approaching a stable fixed point (see Supplementary Information for details).

Refer to caption
Figure 4: Processes underlying emergent memory and reverberatory dynamics in the MAPK cascade. (a) A characteristic time-series for the normalized concentrations of singly and doubly phosphorylated MAPK (nKsubscript𝑛superscript𝐾n_{K^{*}} and nKsubscript𝑛superscript𝐾absentn_{K^{**}}, respectively) following the removal of an applied stimulus of amplitude S=2.0×10⁶μM𝑆2.0superscript106𝜇𝑀S=2.0\times 10^{-6}\mu M at t=0𝑡0t=0. The numbers (14141-4) represent the sequence of events that lead to the emergence of the post-stimulus large-amplitude spiking activity shown schematically in Fig. 1 (b). (b) Normalized chemical flux NFluxsubscript𝑁FluxN_{\rm Flux} of MAPK and MAP2K∗∗ shown for the segment of the time-series where the spiking behavior in nKsubscript𝑛superscript𝐾absentn_{K^{**}} is observed following the withdrawal of the stimulus to MAP3K [demarcated by broken vertical lines in (a)]. (c) Normalized chemical flux NFluxsubscript𝑁FluxN_{\rm Flux} of MAPK∗∗ shown along with the difference between the normalized fluxes of MAP2K∗∗ and MAPK for the duration indicated by broken vertical lines in (b) corresponding to the peak in the spiking activity of MAPK∗∗. For both panels (b) and (c), normalization of flux is with respect to the maximum of the flux for MAPK∗∗. (d) Characteristic time-series for the reverberatory activity of MAPK following the withdrawal of a stimulus of amplitude S=1.2×10⁶μM𝑆1.2superscript106𝜇𝑀S=1.2\times 10^{-6}\mu M at t=0𝑡0t=0, showing the normalized concentration of MAPK∗∗ (nKsubscript𝑛superscript𝐾absentn_{K^{**}}) along with that of the protein complex MAP2K∗∗.MAPK (n2K.Ksubscript𝑛formulae-sequence2superscript𝐾absent𝐾n_{2K^{**}.K} = [MAP2K∗∗.MAPK]/[2K]totsubscriptdelimited-[]2𝐾𝑡𝑜𝑡[2K]_{tot}). The reference line shows that the peak normalized concentration of the protein complex eventually decreases over time. For details of parameter values for (a-c) see Supplementary Information. The parameter values for panel (d) are same as those in Fig. 3(d). The steady state of the system prior to the withdrawal of the stimulus is represented by a red marker [panels (a) and (d)] while the grey marker in (d) corresponds the final time point in Fig. 3(d).
Refer to caption
Figure 5: Components of the MAPK cascade exhibit relaxation behavior occurring over a broad range of time-scales. Decay of activity is shown after withdrawing an applied stimulus of amplitude S=1.2×10⁶μM𝑆1.2superscript106𝜇𝑀S=1.2\times 10^{-6}\mu M. (a) The relaxation times τxsubscript𝜏x\tau_{\rm x} of the different molecular species (non- , singly- and doubly phosphorylated kinase proteins) in each of the layers of the cascade vary with the total concentration of MAP2K. The nature of this dependence is distinct for lower and higher values of [2K]totsubscriptdelimited-[]2𝐾𝑡𝑜𝑡[2K]_{tot}, which is most prominently observed in the lower layers of the cascade. (b) The occurrence of distinct regimes in the relaxation behavior of MAPK∗∗ for different [2K]totsubscriptdelimited-[]2𝐾𝑡𝑜𝑡[2K]_{tot} is related to the corresponding increase in the steady state value attained by MAPK∗∗ concentration under sustained stimulation of the cascade. At a specific value of the steady-state normalized MAPK activity nKsubscript𝑛superscript𝐾absentn_{K^{**}}, we observe a crossover from the regime characterized by slowly increasing τxsubscript𝜏x\tau_{\rm x} seen at lower total concentrations of MAP2K to a regime where τxsubscript𝜏x\tau_{\rm x} increases relatively rapidly for higher [2K]totsubscriptdelimited-[]2𝐾𝑡𝑜𝑡[2K]_{tot}. (c) The crossover behavior is also observed in the dependence of the closely related measure τPRsubscript𝜏PR\tau_{\rm PR}, the primary recovery time (see Methods), on [2K]totsubscriptdelimited-[]2𝐾𝑡𝑜𝑡[2K]_{tot}. The difference between the two regimes become more prominent upon increasing the total concentration of MAP3K ([3K]totsubscriptdelimited-[]3𝐾𝑡𝑜𝑡[3K]_{tot}). For both panels (a) and (b) [K]tot=0.8μMsubscriptdelimited-[]𝐾𝑡𝑜𝑡0.8𝜇𝑀[K]_{tot}=0.8\mu M and [3K]tot=2.0nMsubscriptdelimited-[]3𝐾𝑡𝑜𝑡2.0𝑛𝑀[3K]_{tot}=2.0nM, while for panel (c), [K]tot=0.8μMsubscriptdelimited-[]𝐾𝑡𝑜𝑡0.8𝜇𝑀[K]_{tot}=0.8\mu M. For details of all other parameter values see Supplementary Information.
Refer to caption
Figure 6: Dependence of reverberatory activity on the total kinase concentrations, viz., [K]totsubscriptdelimited-[]𝐾𝑡𝑜𝑡[K]_{tot}, [2K]totsubscriptdelimited-[]2𝐾𝑡𝑜𝑡[2K]_{tot} and [3K]totsubscriptdelimited-[]3𝐾𝑡𝑜𝑡[3K]_{tot}. (a-b) The number of spikes Nrsubscript𝑁𝑟N_{r}, (c-d) the total memory time τmsubscript𝜏𝑚\tau_{m} (in minutes) and (e-f) isosurfaces for Nrsubscript𝑁𝑟N_{r} observed on withdrawing an applied stimulus of amplitude S𝑆S [=0.8×10⁶μMabsent0.8superscript106𝜇𝑀=0.8\times 10^{-6}\mu M for (a,c,e) and 1.2×10⁶μM1.2superscript106𝜇𝑀1.2\times 10^{-6}\mu M for (b,d,f)] are shown as functions of total concentrations of the three kinases. (g) The primary recovery time τPRsubscript𝜏PR\tau_{\rm PR} (stars) and the total duration of reverberatory activity τrsubscript𝜏𝑟\tau_{r} (filled circles) are shown for different values of Nrsubscript𝑁𝑟N_{r} (indicated by the color bar). While τPRsubscript𝜏PR\tau_{\rm PR} increases monotonically with increasing total MAPK concentration, τrsubscript𝜏𝑟\tau_{r} shows a more complex dependence ([2K]tot=3μMsubscriptdelimited-[]2𝐾𝑡𝑜𝑡3𝜇𝑀[2K]_{tot}=3\mu M and [3K]tot=4nMsubscriptdelimited-[]3𝐾𝑡𝑜𝑡4𝑛𝑀[3K]_{tot}=4nM). (h) The dependence of τrsubscript𝜏𝑟\tau_{r} on [K]totsubscriptdelimited-[]𝐾𝑡𝑜𝑡[K]_{tot} for different values of Nrsubscript𝑁𝑟N_{r} has a similar nature for different choices of [3K]totsubscriptdelimited-[]3𝐾𝑡𝑜𝑡[3K]_{tot} (indicated by the color bar, [2K]tot=3μMsubscriptdelimited-[]2𝐾𝑡𝑜𝑡3𝜇𝑀[2K]_{tot}=3\mu M). Note that for panel (h), we consider only situations where the system attains a steady state on maintaining stimulation. For details of all other parameter values see Supplementary Information.

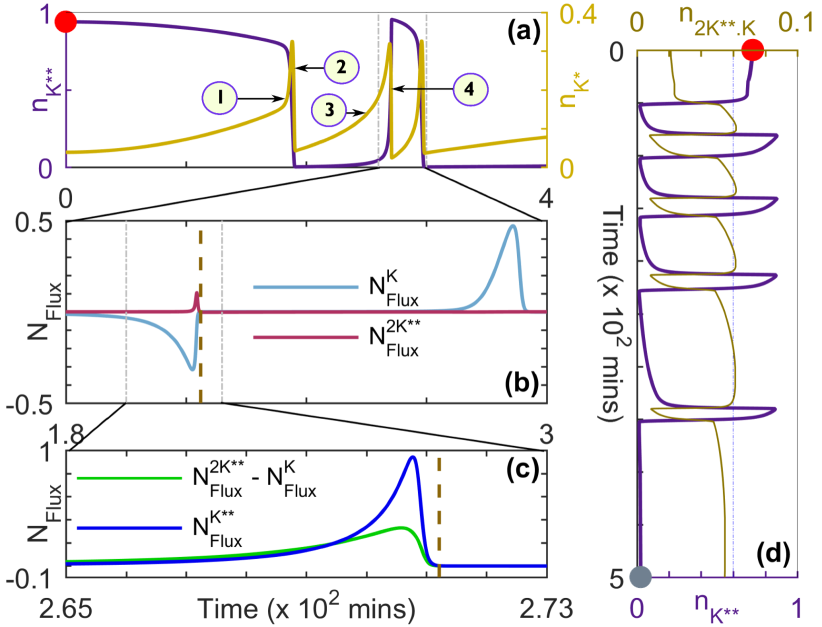
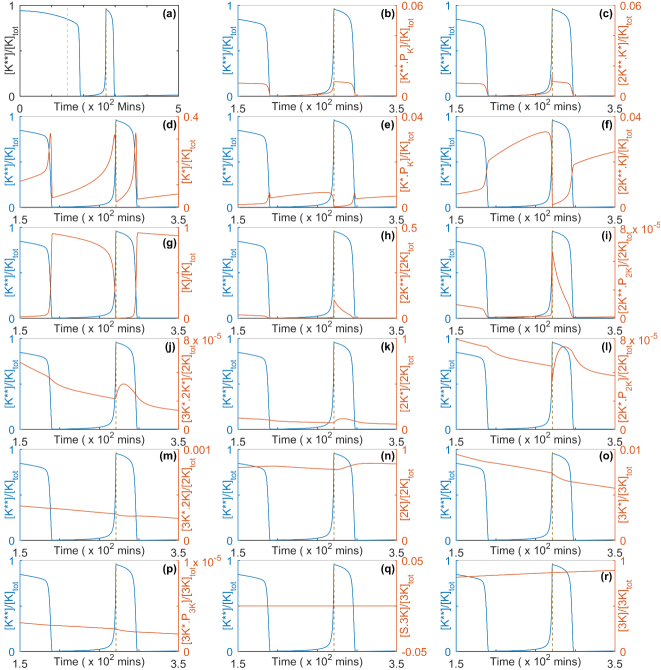
Processes underlying long-lived memory and reverberatory dynamics. When the stimulus is withdrawn from the MAPK cascade, the decline in MAP Kinase activity comes about through MAPK∗∗ binding to MAPK P’ase which dephosphorylates it, resulting in an increased concentration of MAPK [Step 111, Figs. 1(a) and 4(a)]. In turn, the phosphatase binds to MAPK thereby deactivating it to MAPK which results in an extremely rapid decline in the concentration of MAPK (Step 222). Concurrently, the deactivation of MAP2K∗∗ is delayed, as most of it is bound in the complex MAP2K∗∗.MAPK that has a long time-scale of disassociation. To proceed further we can analyze the constituent processes in terms of the normalized chemical flux NFluxsubscript𝑁FluxN_{\rm Flux} of a molecular species, i.e., its rate of growth expressed relative to the maximum rate of growth of MAPK∗∗. We observe that the suppression of MAP2K∗∗ deactivation mentioned above results in its normalized chemical flux exceeding that of MAPK [Fig. 4(b)]. Thus, there is a net growth in activity in the MAP Kinase layer as whenever MAP2K∗∗ is released from the complex, it is available to phosphorylate MAPK which results in an increase in the concentration of MAPK (Step 333). The resulting rise in MAPK manifests as a spike in its concentration [Fig. 4(a)], and it subsequently gets phosphorylated again to increase MAPK∗∗ concentration even in the absence of any stimulation (Step 444). When the net difference between the normalized flux of MAP2K∗∗ and MAPK reaches a maximum, the normalized chemical flux of MAPK∗∗ attains its highest value and consequently peak activity of MAP Kinase is observed [Fig. 4(c)]. Thus, steps 1-4 represent one complete cycle of MAP Kinase reverberatory activity characterized by an initial decline and a subsequent rise in MAPK∗∗ concentration. These steps are subsequently repeated a number of times resulting in a series of spikes in MAPK activity [Fig. 4(d)]. The abrupt nature of the rise and fall of MAP Kinase activity that manifests as spikes is a consequence of the bistable nature of the dynamics in the MAPK layer of the cascade Kholodenko2004 ; KholodenkoBS2006 . We note that similar spiking behavior is also observed in the activity of MAP2K, with the phase of the MAP2K∗∗ spikes shifted slightly forward with respect to the corresponding ones in MAPK∗∗, which suggests that they result from retrograde propagation of activity from the MAPK to the MAP2K layer Ventura2008 . On the other hand, MAP3K shows a monotonic decline in its activity following the removal of the stimulus.

In order to characterize in detail the memory of prior activity retained by the cascade which is manifested as long-lived transient reverberations following the withdrawal of stimulus, we use the following measures (see Methods): (i) the primary recovery time (τPRsubscript𝜏PR\tau_{\rm PR}), (ii) the number of spikes (Nrsubscript𝑁𝑟N_{r}) that occur during the relaxation process, (iii) the temporal intervals between successive spikes (titi1subscript𝑡𝑖subscript𝑡𝑖1t_{i}-t_{i-1}, where tisubscript𝑡𝑖t_{i} is the time of occurrence of the i𝑖ith spike event) and (iv) the total duration of reverberatory activity (τrsubscript𝜏𝑟\tau_{r}) following primary recovery. The total memory time (τmsubscript𝜏𝑚\tau_{m}) is the sum of τPRsubscript𝜏PR\tau_{\rm PR} and τrsubscript𝜏𝑟\tau_{r} as indicated in Fig. 1 (b). In the following we use these measures to present a detailed characterization of the behavior of the cascade components over a range of parameter values (Figs. 5-7).

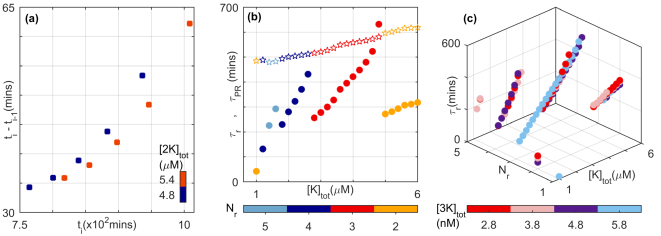
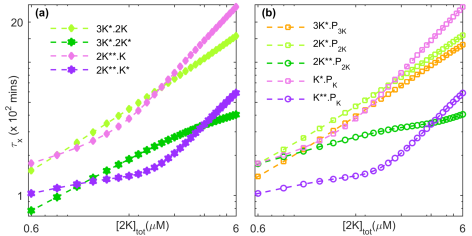
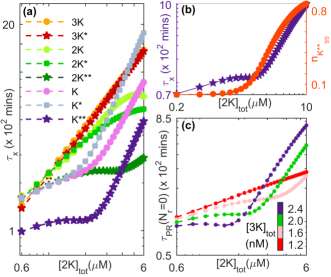
MAP Kinase cascade components have different recovery timescales. As mentioned earlier, the emergence of long-lived reverberatory activity of MAPK following the withdrawal of an applied stimulus can be linked to the flux imbalance of different cascade components which suggests significant differences in their rates of relaxation. As shown in Fig. 5 (a), this is indeed the case, even for parameter regimes where no spiking activity of MAPK is observed (i.e., Nr=0subscript𝑁𝑟0N_{r}=0). As can be seen, the nature of increase of the relaxation time with increasing total concentrations of kinase protein MAP2K is distinct for the different molecular species and also depends on the state of their phosphorylation. In the lower layers of the cascade, we also find a crossover between two regimes seen at lower and higher values of [2K]totsubscriptdelimited-[]2𝐾𝑡𝑜𝑡[2K]_{tot} respectively. These regimes are characterized by relatively slow and rapid increases (respectively) in the recovery times with increasing [2K]totsubscriptdelimited-[]2𝐾𝑡𝑜𝑡[2K]_{tot}, and appear to be related to the steady-state value attained by MAPK activity upon sustained stimulation of the cascade for the corresponding value of [2K]totsubscriptdelimited-[]2𝐾𝑡𝑜𝑡[2K]_{tot} [Fig. 5 (b)]. The crossover between the two regimes is seen to occur for a value of [2K]totsubscriptdelimited-[]2𝐾𝑡𝑜𝑡[2K]_{tot} for which 17%similar-toabsentpercent17\sim 17\% of MAPK is activated for the parameter values used in Fig. 5 (b).

The distinct regimes are also observed in the dependence of the primary recovery time τPRsubscript𝜏PR\tau_{\rm PR} on [2K]totsubscriptdelimited-[]2𝐾𝑡𝑜𝑡[2K]_{tot} [Fig. 5(c)]. As can be observed, the difference between the regimes becomes more pronounced with an increase in the total concentration of MAP3K. An important point to note is that for lower values of [2K]totsubscriptdelimited-[]2𝐾𝑡𝑜𝑡[2K]_{tot}, the recovery time decreases with increasing [3K]totsubscriptdelimited-[]3𝐾𝑡𝑜𝑡[3K]_{tot} while the reverse trend is seen for higher values of [2K]totsubscriptdelimited-[]2𝐾𝑡𝑜𝑡[2K]_{tot}. We have verified that increasing the stimulus amplitude S𝑆S while keeping the total MAP3K concentration fixed has a similar effect on the relaxation behavior of activated MAPK (see Supplementary Information). As increasing total concentration of MAP2K results in increased steady-state activity of MAPK, we conclude that, in general, higher activity states of MAPK are associated with increasing relaxation time when either the signal or the substrate (MAP3K) is increased. Conversely, for states characterized by much lower MAPK activity, larger values of S𝑆S or [3K]totsubscriptdelimited-[]3𝐾𝑡𝑜𝑡[3K]_{tot} results in reduced relaxation periods.

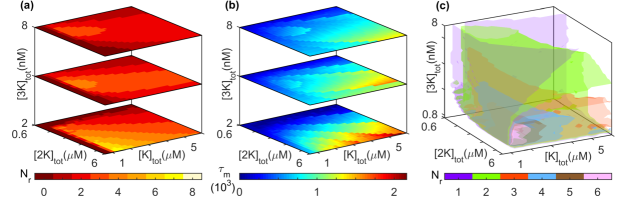
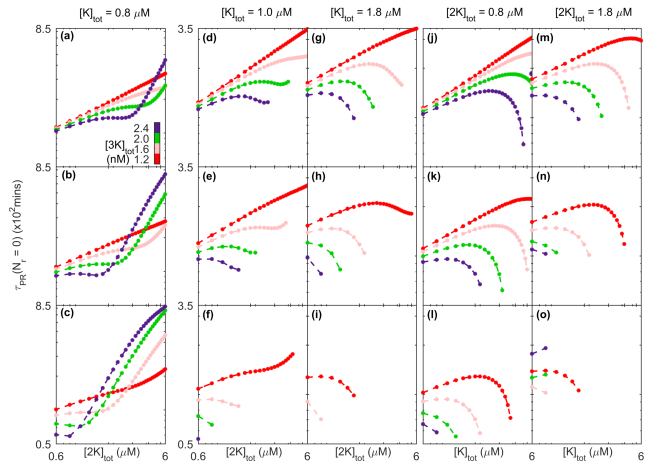
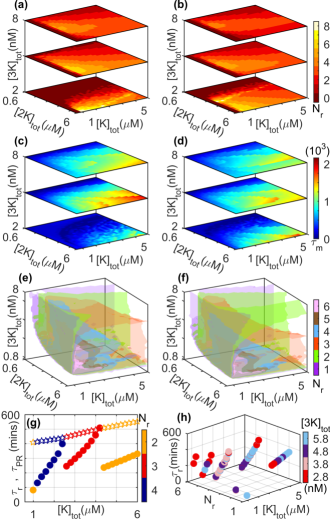
Dependence of reverberatory activity on total kinase concentrations. Diverse cellular environments are characterized by different total concentrations of the various molecular components of the MAPK cascade. Thus, in order to determine the robustness of spiking and reverberatory activity following the removal of an applied stimulus, it is important to see how they are affected by varying total kinase concentrations. Such a study will also indicate the ease with which these phenomena can be experimentally observed. Fig. 6 shows the variation of different measures of reverberatory activity on the total concentrations of MAPK, MAP2K and MAP3K. While there is a complex dependence on these parameters for the exact number of spikes Nrsubscript𝑁𝑟N_{r} and the duration of the total memory time τmsubscript𝜏𝑚\tau_{m}, the phenomenon of reverberatory activity following withdrawal of stimulation can be observed over a large range of the parameter space, underlining its robustness. We also observe that on increasing [3K]totsubscriptdelimited-[]3𝐾𝑡𝑜𝑡[3K]_{tot}, the response of Nrsubscript𝑁𝑟N_{r} to variation in [K]totsubscriptdelimited-[]𝐾𝑡𝑜𝑡[K]_{tot} and [2K]totsubscriptdelimited-[]2𝐾𝑡𝑜𝑡[2K]_{tot} becomes relatively homogeneous. Increasing the stimulus amplitude S𝑆S [compare panels (a,c,e) with (b,d,f) of Fig. 6] does not seem to alter the qualitative nature of the variation in Nrsubscript𝑁𝑟N_{r} and τmsubscript𝜏𝑚\tau_{m} over the parameter space in general, although we do observe that the domains corresponding to different values of Nrsubscript𝑁𝑟N_{r} occupy different regions [Fig. 6(e and f)]. Note that for low [3K]totsubscriptdelimited-[]3𝐾𝑡𝑜𝑡[3K]_{tot}, high values of Nrsubscript𝑁𝑟N_{r} are observed to coexist with low values of τmsubscript𝜏𝑚\tau_{m} [Fig. 6(a,c and b,d)]. While it may appear surprising that these two measures of memory are not in consonance in this region of parameter space, it can be explained by noting that the stimulated system is in an oscillatory state, and following the removal of the signal these relatively high-frequency oscillations cease after a short duration. Fig. 6 (g) suggests that the variation seen in τmsubscript𝜏𝑚\tau_{m} as a function of the total MAPK concentration for a specific Nrsubscript𝑁𝑟N_{r} is mostly governed by τrsubscript𝜏𝑟\tau_{r}, the total duration of reverberatory activity, with the corresponding dependence of τPRsubscript𝜏𝑃𝑅\tau_{PR} on [K]totsubscriptdelimited-[]𝐾𝑡𝑜𝑡[K]_{tot} being weak.

As the total MAPK concentration is increased, we observe that while the primary recovery time increases almost linearly, the nature of the reverberatory dynamics as reflected in τrsubscript𝜏𝑟\tau_{r} shows a more complex dependence on [K]totsubscriptdelimited-[]𝐾𝑡𝑜𝑡[K]_{tot} [Fig. 6 (g)]. If for a given value of [K]totsubscriptdelimited-[]𝐾𝑡𝑜𝑡[K]_{tot} the MAPK activity following withdrawal of the stimulus shows Nrsubscript𝑁𝑟N_{r} spikes over a duration of τrsubscript𝜏𝑟\tau_{r}, then on increasing [K]totsubscriptdelimited-[]𝐾𝑡𝑜𝑡[K]_{tot} the time-interval between the spikes increases (thereby resulting in an increase of τrsubscript𝜏𝑟\tau_{r}) until a critical value beyond which the last of the Nrsubscript𝑁𝑟N_{r} spike no longer appears. Thus, at this point Nrsubscript𝑁𝑟N_{r} reduces by unity with a concomitant drop in τrsubscript𝜏𝑟\tau_{r}. This series of events is repeated for steadily decreasing values of Nrsubscript𝑁𝑟N_{r} as the total MAPK concentration is increased further. Each value of Nrsubscript𝑁𝑟N_{r} is associated with a characteristic rate of increase in τrsubscript𝜏𝑟\tau_{r} with [K]totsubscriptdelimited-[]𝐾𝑡𝑜𝑡[K]_{tot}. With a reduction in Nrsubscript𝑁𝑟N_{r} (as a result of increasing [K]totsubscriptdelimited-[]𝐾𝑡𝑜𝑡[K]_{tot}), this rate is found to decrease as well, which suggests a saturation of the system response. These results are robust with respect to different choices of total MAP3K concentration as can be seen from Fig. 6(h), suggesting that similar behavior will be seen for a range of strengths for the applied signal (see Supplementary Information).

Refer to caption
Figure 7: Dependence of reverberatory activity on the total concentrations of the phosphatases MAPK P’ase ([PK]delimited-[]subscript𝑃𝐾[P_{K}]), MAP2K P’ase, ([P2K]delimited-[]subscript𝑃2𝐾[P_{2K}]) and MAP3K P’ase ([P3K]delimited-[]subscript𝑃3𝐾[P_{3K}]). (a) The number of spikes Nrsubscript𝑁𝑟N_{r} and (b) the total memory time τmsubscript𝜏𝑚\tau_{m} (in minutes) observed on withdrawing an applied stimulus of amplitude S𝑆S =0.8×10⁶μMabsent0.8superscript106𝜇𝑀=0.8\times 10^{-6}\mu M. Situations where the primary recovery time is longer than a maximum or cut-off value (see Methods), such that the duration of the reverberatory dynamics cannot be properly measured, are indicated by the color corresponding to “U”. (c) The interval between successive spikes i1𝑖1i-1 and i𝑖i increases with time (tisubscript𝑡𝑖t_{i} being the time of occurrence of the i𝑖ith spike). As the MAPK P’ase concentration is increased, the durations of these intervals are seen to increase. The total concentrations of the other two phosphatases are maintained at [P2K]=680pMdelimited-[]subscript𝑃2𝐾680𝑝𝑀[P_{2K}]=680pM and [P3K]=10pMdelimited-[]subscript𝑃3𝐾10𝑝𝑀[P_{3K}]=10pM. (d) The variation of primary recovery time τPRsubscript𝜏PR\tau_{\rm PR} (stars) and the total duration of reverberatory activity τrsubscript𝜏𝑟\tau_{r} (filled circles) as a function of total MAPK P’ase concentration are shown for different values of Nrsubscript𝑁𝑟N_{r} (indicated by the color bar). While τPRsubscript𝜏PR\tau_{\rm PR} decreases monotonically with increasing [PK]delimited-[]subscript𝑃𝐾[P_{K}], τrsubscript𝜏𝑟\tau_{r} shows a more complex dependence ([P2K]=200pMdelimited-[]subscript𝑃2𝐾200𝑝𝑀[P_{2K}]=200pM and [P3K]=6pMdelimited-[]subscript𝑃3𝐾6𝑝𝑀[P_{3K}]=6pM). (e) Dependence of the total memory time τmsubscript𝜏𝑚\tau_{m} on total MAPK P’ase concentration ([PK]delimited-[]subscript𝑃𝐾[P_{K}] shown in log scale) for different total concentrations of MAP2K P’ase (values indicated above each of the three panels) and MAP3K P’ase (indicated using different colors as shown in the color bar). Note that we consider only situations where the system attains a steady state on maintaining stimulation. For details of all other parameter values see Supplementary Information.

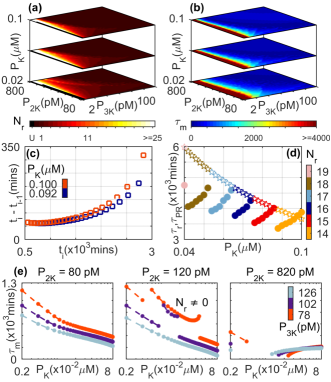
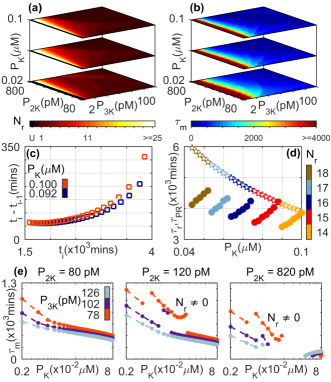
Dependence of reverberatory activity on total phosphatase concentrations. We have also investigated the role that phosphatase availability plays on the reverberatory activity of the cascade following the withdrawal of the stimulus. As is the case for total kinase concentrations shown in Fig. 6, we see from Fig. 7 (a-b) that the number of spikes Nrsubscript𝑁𝑟N_{r} and the duration of total memory time τmsubscript𝜏𝑚\tau_{m} depend on the total concentrations of the phosphatases MAPK P’ase, MAP2K P’ase, and MAP3K P’ase. For larger values of the concentrations, viz., [PK]delimited-[]subscript𝑃𝐾[P_{K}], [P2K]delimited-[]subscript𝑃2𝐾[P_{2K}] and [P3K]delimited-[]subscript𝑃3𝐾[P_{3K}], respectively, the system operates in the low-amplitude response regime. As mentioned earlier, the reverberatory MAPK dynamics during recovery following withdrawal of the applied stimulus will not be seen in this regime. As the phosphatase concentrations are decreased, spiking behavior of MAPK activity is observed with both τmsubscript𝜏𝑚\tau_{m} and Nrsubscript𝑁𝑟N_{r} attaining high values in an optimal range. The large variation seen in τmsubscript𝜏𝑚\tau_{m} [Fig. 7 (b)] arises as regions in [P2K]delimited-[]subscript𝑃2𝐾[P_{2K}]-[P3K]delimited-[]subscript𝑃3𝐾[P_{3K}] parameter space characterized by the same value of Nrsubscript𝑁𝑟N_{r} are seen to exhibit a range of different values of τrsubscript𝜏𝑟\tau_{r} and τPRsubscript𝜏𝑃𝑅\tau_{PR} [Fig. 7 (d)]. For reverberatory activity associated with a specific Nrsubscript𝑁𝑟N_{r}, we observe that the duration τrsubscript𝜏𝑟\tau_{r} increases with increasing total MAPK P’ase concentration. This is a consequence of the intervals between successive spikes (titi1subscript𝑡𝑖subscript𝑡𝑖1t_{i}-t_{i-1}) increasing with [PK]delimited-[]subscript𝑃𝐾[P_{K}] as is shown in Fig. 7 (c). Note that the results are qualitatively similar for different amplitudes of the applied stimulus (see Supplementary Information). However, increasing [PK]delimited-[]subscript𝑃𝐾[P_{K}] results also in decreased time for primary recovery τPRsubscript𝜏𝑃𝑅\tau_{PR} [Fig. 7 (d)], which in conjunction with the previously mentioned result leads to non-monotonic dependence of the total memory time τmsubscript𝜏𝑚\tau_{m} on phosphatase availability. While this non-monotonicity is suggested in Fig. 7 (b), it is shown clearly in Fig. 7 (e) where the central panel corresponds to situations where spiking behavior is observed in MAPK activity. Investigation into the dependence of τmsubscript𝜏𝑚\tau_{m} on PKsubscript𝑃𝐾P_{K} [Fig. 7(e)] reveals that the range of [PK]delimited-[]subscript𝑃𝐾[P_{K}] over which reverberatory activity (i.e., Nr0subscript𝑁𝑟0N_{r}\neq 0) occurs is demarcated by discontinuities in the functional dependence of τmsubscript𝜏𝑚\tau_{m} on PKsubscript𝑃𝐾P_{K}. For intermediate P2Ksubscript𝑃2𝐾P_{2K} [Fig. 7(e), central panel] where the system attains a steady state on maintaining stimulation, the spiking activity following withdrawal of the stimulus becomes more prominent for low total concentration of MAP3K P’ase. For higher P2Ksubscript𝑃2𝐾P_{2K} [Fig. 7(e), right panel] where the system becomes oscillatory over an intermediate range of [PK]delimited-[]subscript𝑃𝐾[P_{K}], reverberatory activity is observed over a broader range of [P3K]delimited-[]subscript𝑃3𝐾[P_{3K}]. While we have assumed that the same phosphatase acts on both the singly and doubly phosphorylated forms of the kinase in a particular layer of the cascade (as in the canonical Huang-Ferrell model), we have explicitly verified that our results are not sensitively dependent on this.

IV Discussion

In this paper we have shown that an isolated MAPK signaling module can serve as a fundamental motif in the intra-cellular signaling network for imparting a form of short-term memory to the cell. The emergence of long-lived reverberatory activity reported here arises from the diversity of relaxation timescales for the different components of the MAP Kinase cascade, which results in flux imbalance between activation of the MAPK layer and deactivation in the MAP2K layer. One may therefore expect to observe results qualitatively similar to what has been reported here whenever the system has disparate timescales regardless of the actual molecular concentrations and kinetic rates which can vary substantially across different cells Stumpf2016 ; Legewie2013 ; Das2013 . Thus, as the MAPK cascade is present in all eukaryotic cells Seger1995 ; Johnson1999 , the mechanism for short-term memory in such a signaling cascade that is presented here may hold for such cells in general. As the duration of MAPK∗∗ activity is critical for many cellular decisions Marshall1995 , e.g., the prolonged activation of ERK resulting in its translocation to the nucleus Seger2011 , the persistent reverberatory activity seen here may play a non-trivial role in regulation of cellular functions.

The basal level activity of MAPK in a normal cell is maintained at a low proportion of the total MAPK concentration and serves several biological functions Kosik1998 . We observe a crossover between two qualitatively distinct regimes of relaxation behavior of MAPK∗∗ occurring at a steady state that is characterized by relatively low proportion of activation of the available MAPK [17%similar-toabsentpercent17\sim 17\% in Fig. 5 (b)]. Thus, there appears to be an effective threshold for MAPK activity (which may be related to its basal state level) that demarcates the different relaxation regimes following the removal of the applied stimulus. A similar crossover is also observed for the primary recovery time τPRsubscript𝜏𝑃𝑅\tau_{PR}.

It is known that ERK MAPK isoforms (e.g., p42 and p44) are abundantly expressed in non-dividing terminally differentiated neurons Sweatt2001 . Activation of MAPK by spaced stimulation is known to be responsible for morphological changes in dendrites Tsien2001 . Studies also suggest that the activation of the MAPK pathway is linked with associative learning in the mammalian nervous system, synaptic plasticity and neurological memory Carew2013 ; Tsien2001 ; Carew2008 ; Sweatt1998 ; Sweatt2001 . An intriguing possibility suggested by the results reported here is that the observed repeated spiking in MAPK activity may function as an effective temporally spaced signal to the nucleus of a neuron. This can then facilitate subsequent changes in the cell required for memory formation.

Another well-known example of eukaryotic cellular memory is observed during chemotactic migration along the gradient of a chemical signal Rappel2014 ; Shah2016 . The directionality of migration is known to persist for a certain duration, even if the chemical gradient is altered or becomes static. Studies show that the protein Moesin contributes to the long-lived rigidity of the cytoskeleton assembly that subsequently leads to the directional memory in polarized migrating cells Shah2016 . However, the intra-cellular processes that underlie the persistent activity of Moesin in the absence of a gradient mediated signal are still largely unknown. Evidence suggests that the regulation of Moesin and other ERM proteins are linked with the activity of the MAPK pathway Huang2009 ; Wang2006 . The long-term reverberatory activity of MAPK following the withdrawal of a stimulus that is reported here may be a possible mechanism underlying such persistent cellular behavior.

To conclude, we have shown the possibility of long-lived reverberatory activity in a signaling cascade following the withdrawal of external stimuli. Our results suggest a mechanism through which the intra-cellular signaling system can encode short-term memory of signals to which the cell was previously exposed. The large-amplitude spiking activity of MAPK following the removal of a prior stimulus may also provide a mechanism for signal integration and learning when the cascade is repeatedly stimulated. We note that there may be additional factors not considered here that may lengthen the persistence of reverberatory activity, including scaffold proteins that increase the lifetime of kinase complexes. Our results suggest that the MAPK cascade potentially has a key role in shaping the information processing capabilities of eukaryotic cells in diverse environments.

Acknowledgements.
SNM is supported by the IMSc Complex Systems Project (12thsuperscript12th12^{\rm th} Plan). The simulations required for this work were done in the High Performance Computing facility (Nandadevi and Satpura) of IMSc which is partially funded by DST (SR/NM/NS-44/2009). We thank James Ferrell, Upinder Bhalla, Tharmaraj Jesan, Uddipan Sarma, Bhaskar Saha, Jose Faro, Vineeta Bal, J. Krishnan, Mukund Thattai, Marsha Rosner and Pamela Silver for helpful discussions.

References

  • (1) U. S. Bhalla and R. Iyengar, Science 283, 381 (1999).
  • (2) J. E. Purvis and G. Lahav, Cell 152, 945 (2013).
  • (3) B. N. Kholodenko, Nat. Rev. Mol. Cell Bio. 7, 165 (2006).
  • (4) G. Weng, U. S. Bhalla, and R. Iyengar, Science 284, 92 (1999).
  • (5) C. Widmann, S. Gibson, M. B. Jarpe, and G. L. Johnson, Physiol. Rev. 79, 143 (1999).
  • (6) R. Seger and E. G. Krebs, FASEB J. 9, 726 (1995).
  • (7) A. J. Waskiewicz and J. A. Cooper, Curr. Opin. Cell Biol. 7, 798 (1995).
  • (8) B. Su and M. Karin, Curr. Opin. Immunol. 8, 402 (1996).
  • (9) B. Alberts, A. Johnson, J. Lewis, D. Morgan, M. Raff, K. Roberts, and P. Walter, Molecular Biology of the Cell, 6th Ed. (Garland Science, New York, 2014).
  • (10) C. Y. Huang and J. E. Ferrell, Proc. Natl. Acad. Sci. USA 93, 10078 (1996).
  • (11) H. Shankaran, D. L. Ippolito, W. B. Chrisler, H. Resat, N. Bollinger, L. K. Opresko, and H. S. Wiley, Mol. Sys. Biol. 5, 332 (2009).
  • (12) L. Qiao, R. B. Nachbar, I. G. Kevrekidis, and S. Y. Shvartsman, PLOS Comput. Biol. 3, e184 (2007).
  • (13) T. Jesan, U. Sarma, S. Halder, B. Saha, and S. Sinha, PLOS One 8, e64409 (2013).
  • (14) A. C. Ventura, J. A. Sepulchre, and S. D. Merajver, PLOS Comput. Biol. 4, e1000041 (2008).
  • (15) N. I. Markevich, J. B. Hoek, and B. N. Kholodenko, J. Cell Biol. 164, 353 (2004).
  • (16) S. Legewie, B. Schoeberl, N. Blüthgen, and H. Herzel, Biophys. J. 93, 2279 (2007).
  • (17) F. Ortega, J. L. Garcés, F. Mas, B. N. Kholodenko, and M. Cascante, FEBS J. 273, 3915 (2006).
  • (18) J. E. Ferrell, Curr. Opin. Cell Biol. 14, 140 (2002).
  • (19) M. C. Inniss and P. A. Silver, Curr. Biol. 23, R812 (2013).
  • (20) W. Xiong and J. E. Ferrell, Nature (London) 426, 460 (2003).
  • (21) C. M. Ajo-Franklin, D. A. Drubin, J. A. Eskin, E. P. Gee, D. Landgraf, I. Phillips, and P. A. Silver, Gene. Dev. 21, 2271 (2007).
  • (22) D. R. Burrill and P. A. Silver, Cell 140, 13 (2010).
  • (23) J. Gunawardena, Proc. Natl. Acad. Sci. USA 102, 14617 (2005).
  • (24) O. Hadac, I. Schreiber, and M. Pribyl, J. Chem. Phys. 138, 065102 (2013).
  • (25) G. T. Philips, X. Ye, A. M. Kopec, and T. J. Carew, J. Neurosci. 33, 7565 (2013).
  • (26) G. Y. Wu, K. Deisseroth, and R. W. Tsien, Nat. Neurosci. 4, 151 (2001).
  • (27) J. D. Sweatt, J. Neurochem. 76, 1 (2001).
  • (28) C. Huang, K. Jacobson, and M. D. Schaller, J. Cell Sci. 117, 4619 (2004).
  • (29) C. Dong, R. J. Davis, and R. A. Flavell, Ann. Rev. Immunol. 20, 55 (2002).
  • (30) G. Altan-Bonnet and R. N. Germain, PLOS Biol. 3, e356 (2005).
  • (31) T. Millat, E. Bullinger, J. Rohwer, and O. Wolkenhauer, Math. Biosci. 207, 40 (2007).
  • (32) S. Filippi, C. P. Barnes, P. D. Kirk, T. Kudo, K. Kunida, S. S. McMahon, T. Tsuchiya, T. Wada, S. Kuroda, and M. P. Stumpf, Cell Rep. 15, 2524 (2016).
  • (33) M. Jeschke, S. Baumgärtner, and S. Legewie, PLOS Comput. Biol. 9, e1003357 (2013).
  • (34) S. Mukherjee, S. C. Seok, V. J. Vieland, and J. Das, Proc. Natl. Acad. Sci. USA 110, 18531 (2013).
  • (35) C. J. Marshall, Cell 80, 179 (1995).
  • (36) A. Plotnikov, E. Zehorai, S. Procaccia, and R. Seger, BBA-Mol. Cell Res. 1813, 1619 (2011).
  • (37) Q. Lu, M. Paredes, J. Zhang, and K. S. Kosik, Mol. Cell. Biol. 18, 3257 (1998).
  • (38) X. Ye, J. L. Shobe, S. K. Sharma, A. Marina, and T. J. Carew, Proc. Natl. Acad. Sci. USA 105, 20511 (2008).
  • (39) C. M. Atkins, J. C. Selcher, J. J. Petraitis, J. M. Trzaskos, and J. D. Sweatt, Nat. Neurosci. 1, 602 (1998).
  • (40) M. Skoge, H. Yue, M. Erickstad, A. Bae, H. Levine, A. Groisman, W. F. Loomis, and W. J. Rappel, Proc. Natl. Acad. Sci. USA 111, 14448 (2014)
  • (41) H. V. Prentice-Mott, Y. Meroz, A. Carlson, M. A. Levine, M. W. Davidson, D. Irimia, G. T. Charras, L. Mahadevan, and J. V. Shah, Proc. Natl. Acad. Sci. USA 113, 1267 (2016).
  • (42) X. Guo, L. Wang, B. Chen, Q. Li, J. Wang, M. Zhao, W. Wu, P. Zhu, X. Huang, and Q. Huang, Am. J. Physiol.-Heart C. 297, H238 (2009).
  • (43) M. Koss, G. R. Pfeiffer, Y. Wang, S. T. Thomas, M. Yerukhimovich, W. A. Gaarde, C. M. Doerschuk, and Q. Wang, J. Immunol. 176, 1218 (2006).

SUPPLEMENTARY INFORMATION

S1 The Model Equations

Table S1: Components of the MAPK Cascade
Component Notation Symbol
Mitogen-activated Protein Kinase Kinase Kinase MAP3K 3K
Singly Phosphorylated Mitogen-activated Protein Kinase Kinase Kinase MAP3K* 3K*
Mitogen-activated Protein Kinase Kinase MAP2K 2K
Singly Phosphorylated Mitogen-activated Protein Kinase Kinase MAP2K* 2K*
Doubly Phosphorylated Mitogen-activated Protein Kinase Kinase MAP2K** 2K**
Mitogen-activated Protein Kinase MAPK K
Singly Phosphorylated Mitogen-activated Protein Kinase MAPK* K*
Doubly Phosphorylated Mitogen-activated Protein Kinase MAPK** K**
MAP3K-Phosphatase 3K P’ase P3K
MAP2K-Phosphatase 2K P’ase P2K
MAPK-Phosphatase K P’ase PK

The three layer MAPK cascade comprises the following enzyme-substrate reactions:

S+3Kk1k1S.3Kk2S+3Ksuperscriptsubscript𝑘2𝑆3𝐾superscriptsubscript𝑘1subscript𝑘1absent𝑆.3𝐾𝑆3superscript𝐾S+3K\begin{array}[]{c}{\stackrel{{\scriptstyle k_{1}}}{{\longrightarrow}}}\\ {\xleftarrow[k_{-1}]{}}\end{array}S.3K\stackrel{{\scriptstyle k_{2}}}{{\longrightarrow}}S+3K^{*}
P3K+3Kkp1kp13K.P3Kkp2P3K+3Kformulae-sequencesubscript𝑃3𝐾3superscript𝐾superscript𝑘subscript𝑝1𝑘subscript𝑝1absent3superscript𝐾superscript𝑘subscript𝑝2subscript𝑃3𝐾subscript𝑃3𝐾3𝐾P_{3K}+3K^{*}\begin{array}[]{c}{\stackrel{{\scriptstyle kp_{1}}}{{\longrightarrow}}}\\ {\xleftarrow[kp_{-1}]{}}\end{array}3K^{*}.P_{3K}\stackrel{{\scriptstyle kp_{2}}}{{\longrightarrow}}P_{3K}+3K
3K+2Kk3k33K.2Kk43K+2Ksuperscriptsubscript𝑘43superscript𝐾2𝐾superscriptsubscript𝑘3subscript𝑘3absent3superscript𝐾.2𝐾3superscript𝐾2superscript𝐾3K^{*}+2K\begin{array}[]{c}{\stackrel{{\scriptstyle k_{3}}}{{\longrightarrow}}}\\ {\xleftarrow[k_{-3}]{}}\end{array}3K^{*}.2K\stackrel{{\scriptstyle k_{4}}}{{\longrightarrow}}3K^{*}+2K^{*}
P2K+2Kkp3kp32K.P2Kkp4P2K+2Kformulae-sequencesubscript𝑃2𝐾2superscript𝐾superscript𝑘subscript𝑝3𝑘subscript𝑝3absent2superscript𝐾superscript𝑘subscript𝑝4subscript𝑃2𝐾subscript𝑃2𝐾2𝐾P_{2K}+2K^{*}\begin{array}[]{c}{\stackrel{{\scriptstyle kp_{3}}}{{\longrightarrow}}}\\ {\xleftarrow[kp_{-3}]{}}\end{array}2K^{*}.P_{2K}\stackrel{{\scriptstyle kp_{4}}}{{\longrightarrow}}P_{2K}+2K
3K+2Kk5k53K.2Kk63K+2Ksuperscriptsubscript𝑘63superscript𝐾2superscript𝐾superscriptsubscript𝑘5subscript𝑘5absent3superscript𝐾.2superscript𝐾3superscript𝐾2superscript𝐾absent3K^{*}+2K^{*}\begin{array}[]{c}{\stackrel{{\scriptstyle k_{5}}}{{\longrightarrow}}}\\ {\xleftarrow[k_{-5}]{}}\end{array}3K^{*}.2K^{*}\stackrel{{\scriptstyle k_{6}}}{{\longrightarrow}}3K^{*}+2K^{**}
P2K+2Kkp5kp52K.P2Kkp6P2K+2Kformulae-sequencesubscript𝑃2𝐾2superscript𝐾absentsuperscript𝑘subscript𝑝5𝑘subscript𝑝5absent2superscript𝐾absentsuperscript𝑘subscript𝑝6subscript𝑃2𝐾subscript𝑃2𝐾2superscript𝐾P_{2K}+2K^{**}\begin{array}[]{c}{\stackrel{{\scriptstyle kp_{5}}}{{\longrightarrow}}}\\ {\xleftarrow[kp_{-5}]{}}\end{array}2K^{**}.P_{2K}\stackrel{{\scriptstyle kp_{6}}}{{\longrightarrow}}P_{2K}+2K^{*}
2K+Kk7k72K.Kk82K+Kformulae-sequence2superscript𝐾absent𝐾superscriptsubscript𝑘7subscript𝑘7absent2superscript𝐾absentsuperscriptsubscript𝑘8𝐾2superscript𝐾absentsuperscript𝐾2K^{**}+K\begin{array}[]{c}{\stackrel{{\scriptstyle k_{7}}}{{\longrightarrow}}}\\ {\xleftarrow[k_{-7}]{}}\end{array}2K^{**}.K\stackrel{{\scriptstyle k_{8}}}{{\longrightarrow}}2K^{**}+K^{*}
PK+Kkp7kp7K.PKkp8PK+Kformulae-sequencesubscript𝑃𝐾superscript𝐾superscript𝑘subscript𝑝7𝑘subscript𝑝7absentsuperscript𝐾superscript𝑘subscript𝑝8subscript𝑃𝐾subscript𝑃𝐾𝐾P_{K}+K^{*}\begin{array}[]{c}{\stackrel{{\scriptstyle kp_{7}}}{{\longrightarrow}}}\\ {\xleftarrow[kp_{-7}]{}}\end{array}K^{*}.P_{K}\stackrel{{\scriptstyle kp_{8}}}{{\longrightarrow}}P_{K}+K
2K+Kk9k92K.Kk102K+Kformulae-sequence2superscript𝐾absentsuperscript𝐾superscriptsubscript𝑘9subscript𝑘9absent2superscript𝐾absentsuperscriptsubscript𝑘10superscript𝐾2superscript𝐾absentsuperscript𝐾absent2K^{**}+K^{*}\begin{array}[]{c}{\stackrel{{\scriptstyle k_{9}}}{{\longrightarrow}}}\\ {\xleftarrow[k_{-9}]{}}\end{array}2K^{**}.K^{*}\stackrel{{\scriptstyle k_{10}}}{{\longrightarrow}}2K^{**}+K^{**}
PK+Kkp9kp9K.PKkp10PK+Kformulae-sequencesubscript𝑃𝐾superscript𝐾absentsuperscript𝑘subscript𝑝9𝑘subscript𝑝9absentsuperscript𝐾absentsuperscript𝑘subscript𝑝10subscript𝑃𝐾subscript𝑃𝐾superscript𝐾P_{K}+K^{**}\begin{array}[]{c}{\stackrel{{\scriptstyle kp_{9}}}{{\longrightarrow}}}\\ {\xleftarrow[kp_{-9}]{}}\end{array}K^{**}.P_{K}\stackrel{{\scriptstyle kp_{10}}}{{\longrightarrow}}P_{K}+K^{*}

The above enzyme-substrate reactions can be expressed in terms of the following coupled ordinary differential equations (ODEs):

d[3K]dt𝑑delimited-[]3𝐾𝑑𝑡\displaystyle\frac{d[3K]}{dt} =\displaystyle= k1.[S.3K]+kp2.[3K.P3K]k1.[S].[3K],\displaystyle k_{-1}.[S.3K]+kp_{2}.[3K^{*}.P_{3K}]-k_{1}.[S].[3K]\,,
d[S.3K]dt𝑑delimited-[]𝑆.3𝐾𝑑𝑡\displaystyle\frac{d[S.3K]}{dt} =\displaystyle= k1.[S].[3K](k1+k2).[S.3K],formulae-sequencesubscript𝑘1delimited-[]𝑆delimited-[]3𝐾subscript𝑘1subscript𝑘2delimited-[]𝑆.3𝐾\displaystyle k_{1}.[S].[3K]-(k_{-1}+k_{2}).[S.3K]\,,
d[3K.P3K]dt\displaystyle\frac{d[3K^{*}.P_{3K}]}{dt} =\displaystyle= kp1.[P3Kf].[3K](kp2+kp1).[3K.P3K],\displaystyle kp_{1}.[P^{f}_{3K}].[3K^{*}]-(kp_{2}+kp_{-1}).[3K^{*}.P_{3K}]\,,
d[3K]dt𝑑delimited-[]3superscript𝐾𝑑𝑡\displaystyle\frac{d[3K^{*}]}{dt} =\displaystyle= k2.[S.3K]+kp1.[3K.P3K]kp1.[P3Kf].[3K]\displaystyle k_{2}.[S.3K]+kp_{-1}.[3K^{*}.P_{3K}]-kp_{1}.[P^{f}_{3K}].[3K^{*}]
+(k3+k4).[3K.2K]k3.[3K].[2K]formulae-sequencesubscript𝑘3subscript𝑘4delimited-[]3superscript𝐾.2𝐾subscript𝑘3delimited-[]3superscript𝐾delimited-[]2𝐾\displaystyle+(k_{-3}+k_{4}).[3K^{*}.2K]-k_{3}.[3K^{*}].[2K]
+(k5+k6).[3K.2K]k5.[3K].[2K],formulae-sequencesubscript𝑘5subscript𝑘6delimited-[]3superscript𝐾.2superscript𝐾subscript𝑘5delimited-[]3superscript𝐾delimited-[]2superscript𝐾\displaystyle+(k_{-5}+k_{6}).[3K^{*}.2K^{*}]-k_{5}.[3K^{*}].[2K^{*}]\,,
d[2K]dt𝑑delimited-[]2𝐾𝑑𝑡\displaystyle\frac{d[2K]}{dt} =\displaystyle= k3.[3K.2K]+kp4.[2K.P2K]k3.[3K].[2K],\displaystyle k_{-3}.[3K^{*}.2K]+kp_{4}.[2K^{*}.P_{2K}]-k_{3}.[3K^{*}].[2K]\,,
d[3K.2K]dt𝑑delimited-[]3superscript𝐾.2𝐾𝑑𝑡\displaystyle\frac{d[3K^{*}.2K]}{dt} =\displaystyle= k3.[3K].[2K](k3+k4).[3K.2K],formulae-sequencesubscript𝑘3delimited-[]3superscript𝐾delimited-[]2𝐾subscript𝑘3subscript𝑘4delimited-[]3superscript𝐾.2𝐾\displaystyle k_{3}.[3K^{*}].[2K]-(k_{-3}+k_{4}).[3K^{*}.2K]\,,
d[2K.P2K]dt\displaystyle\frac{d[2K^{*}.P_{2K}]}{dt} =\displaystyle= kp3.[P2Kf].[2K](kp4+kp3).[2K.P2K],\displaystyle kp_{3}.[P^{f}_{2K}].[2K^{*}]-(kp_{4}+kp_{-3}).[2K^{*}.P_{2K}]\,,
d[2K]dt𝑑delimited-[]2superscript𝐾𝑑𝑡\displaystyle\frac{d[2K^{*}]}{dt} =\displaystyle= k4.[3K.2K]+kp3.[2K.P2K]kp3.[P2Kf].[2K]\displaystyle k_{4}.[3K^{*}.2K]+kp_{-3}.[2K^{*}.P_{2K}]-kp_{3}.[P^{f}_{2K}].[2K^{*}]
+k5.[3K.2K]k5.[3K].[2K]+kp6.[2K.P2K],\displaystyle+k_{-5}.[3K^{*}.2K^{*}]-k_{5}.[3K^{*}].[2K^{*}]+kp_{6}.[2K^{**}.P_{2K}]\,,
d[3K.2K]dt𝑑delimited-[]3superscript𝐾.2superscript𝐾𝑑𝑡\displaystyle\frac{d[3K^{*}.2K^{*}]}{dt} =\displaystyle= k5.[3K].[2K](k6+k5).[3K.2K],formulae-sequencesubscript𝑘5delimited-[]3superscript𝐾delimited-[]2superscript𝐾subscript𝑘6subscript𝑘5delimited-[]3superscript𝐾.2superscript𝐾\displaystyle k_{5}.[3K^{*}].[2K^{*}]-(k_{6}+k_{-5}).[3K^{*}.2K^{*}]\,,
d[2K.P2K]dt\displaystyle\frac{d[2K^{**}.P_{2K}]}{dt} =\displaystyle= kp5.[P2Kf].[2K](kp6+kp5).[2K.P2K],\displaystyle kp_{5}.[P^{f}_{2K}].[2K^{**}]-(kp_{6}+kp_{-5}).[2K^{**}.P_{2K}]\,,
d[2K]dt𝑑delimited-[]2superscript𝐾absent𝑑𝑡\displaystyle\frac{d[2K^{**}]}{dt} =\displaystyle= k6.[3K.2K]+kp5.[2K.P2K]kp5.[P2Kf].[2K]\displaystyle k_{6}.[3K^{*}.2K^{*}]+kp_{-5}.[2K^{**}.P_{2K}]-kp_{5}.[P^{f}_{2K}].[2K^{**}]
+(k7+k8).[2K.K]k7.[2K].[K]\displaystyle+(k_{-7}+k_{8}).[2K^{**}.K]-k_{7}.[2K^{**}].[K]
+(k9+k10).[2K.K]k9.[2K].[K],\displaystyle+(k_{-9}+k_{10}).[2K^{**}.K^{*}]-k_{9}.[2K^{**}].[K^{*}]\,,
d[K]dt𝑑delimited-[]𝐾𝑑𝑡\displaystyle\frac{d[K]}{dt} =\displaystyle= k7.[2K.K]+kp8.[K.PK]k7.[2K].[K],\displaystyle k_{-7}.[2K^{**}.K]+kp_{8}.[K^{*}.P_{K}]-k_{7}.[2K^{**}].[K]\,,
d[2K.K]dt\displaystyle\frac{d[2K^{**}.K]}{dt} =\displaystyle= k7.[2K].[K](k8+k7).[2K.K],\displaystyle k_{7}.[2K^{**}].[K]-(k_{8}+k_{-7}).[2K^{**}.K]\,,
d[K.PK]dt\displaystyle\frac{d[K^{*}.P_{K}]}{dt} =\displaystyle= kp7.[PKf].[K](kp7+kp8).[K.PK],\displaystyle kp_{7}.[P^{f}_{K}].[K^{*}]-(kp_{-7}+kp_{8}).[K^{*}.P_{K}]\,,
d[K]dt𝑑delimited-[]superscript𝐾𝑑𝑡\displaystyle\frac{d[K^{*}]}{dt} =\displaystyle= k8.[2K.K]+kp7.[K.PK]kp7.[PKf].[K]\displaystyle k_{8}.[2K^{**}.K]+kp_{-7}.[K^{*}.P_{K}]-kp_{7}.[P^{f}_{K}].[K^{*}]
+k9.[2K.K]k9.[2K].[K]+kp10.[K.PK],\displaystyle+k_{-9}.[2K^{**}.K^{*}]-k_{9}.[2K^{**}].[K^{*}]+kp_{10}.[K^{**}.P_{K}]\,,
d[2K.K]dt\displaystyle\frac{d[2K^{**}.K^{*}]}{dt} =\displaystyle= k9.[2K].[K](k9+k10).[2K.K],\displaystyle k_{9}.[2K^{**}].[K^{*}]-(k_{-9}+k_{10}).[2K^{**}.K^{*}]\,,
d[K.PK]dt\displaystyle\frac{d[K^{**}.P_{K}]}{dt} =\displaystyle= kp9.[PKf].[K](kp9+kp10).[K.PK],\displaystyle kp_{9}.[P^{f}_{K}].[K^{**}]-(kp_{-9}+kp_{10}).[K^{**}.P_{K}]\,,
d[K]dt𝑑delimited-[]superscript𝐾absent𝑑𝑡\displaystyle\frac{d[K^{**}]}{dt} =\displaystyle= k10.[2K.K]+kp9.[K.PK]kp9.[PKf].[K].\displaystyle k_{10}.[2K^{**}.K^{*}]+kp_{-9}.[K^{**}.P_{K}]-kp_{9}.[P^{f}_{K}].[K^{**}]\,.

where

[S]delimited-[]𝑆\displaystyle[S] =[S]tot[S.3K],absentsubscriptdelimited-[]𝑆totdelimited-[]𝑆.3𝐾\displaystyle=[S]_{\rm tot}-[S.3K]\,,\;\;
[P3Kf]delimited-[]subscriptsuperscript𝑃𝑓3𝐾\displaystyle[P^{f}_{3K}] =[P3K][3K.P3K],\displaystyle=[P_{3K}]-[3K^{*}.P_{3K}]\,,\;\;
[P2Kf]delimited-[]subscriptsuperscript𝑃𝑓2𝐾\displaystyle[P^{f}_{2K}] =[P2K][2K.P2K][2K.P2K],\displaystyle=[P_{2K}]-[2K^{*}.P_{2K}]\ -[2K^{**}.P_{2K}]\,,\;\;
[PKf]delimited-[]subscriptsuperscript𝑃𝑓𝐾\displaystyle[P^{f}_{K}] =[PK][K.PK][K.PK].\displaystyle=[P_{K}]-[K^{*}.P_{K}]\ -[K^{**}.P_{K}]\,.

It is explicitly ensured that the total concentrations of all individual kinases and phosphatases are conserved at all times. The concentrations of the different molecular species can vary over several orders of magnitudes. We have therefore numerically solved the equations using low relative and absolute tolerances in order to ensure the accuracy of the resulting time-series.

S2 System Parameters

The numerical values for the reaction rates are obtained from Ref. [13], and are listed in Table S2.

Table S2: Reaction Rates
Rate constant Value Units
k1subscript𝑘1k_{1} 1002 (μM.min)1(\mu M.{\rm min})^{-1}
k1subscript𝑘1k_{-1} 150 min1superscriptmin1{\rm min}^{-1}
k2subscript𝑘2k_{2} 150 min1superscriptmin1{\rm min}^{-1}
kp1𝑘subscript𝑝1kp_{1} 1002 (μM.min)1(\mu M.{\rm min})^{-1}
kp1𝑘subscript𝑝1kp_{-1} 150 min1superscriptmin1{\rm min}^{-1}
kp2𝑘subscript𝑝2kp_{2} 150 min1superscriptmin1{\rm min}^{-1}
k3subscript𝑘3k_{3} 1002 (μM.min)1(\mu M.{\rm min})^{-1}
k3subscript𝑘3k_{-3} 30 min1superscriptmin1{\rm min}^{-1}
k4subscript𝑘4k_{4} 30 min1superscriptmin1{\rm min}^{-1}
kp3𝑘subscript𝑝3kp_{3} 1002 (μM.min)1(\mu M.{\rm min})^{-1}
kp3𝑘subscript𝑝3kp_{-3} 150 min1superscriptmin1{\rm min}^{-1}
kp4𝑘subscript𝑝4kp_{4} 150 min1superscriptmin1{\rm min}^{-1}
k5subscript𝑘5k_{5} 1002 (μM.min)1(\mu M.{\rm min})^{-1}
k5subscript𝑘5k_{-5} 30 min1superscriptmin1{\rm min}^{-1}
k6subscript𝑘6k_{6} 30 min1superscriptmin1{\rm min}^{-1}
kp5𝑘subscript𝑝5kp_{5} 1002 (μM.min)1(\mu M.{\rm min})^{-1}
kp5𝑘subscript𝑝5kp_{-5} 150 min1superscriptmin1{\rm min}^{-1}
kp6𝑘subscript𝑝6kp_{6} 150 min1superscriptmin1{\rm min}^{-1}
k7subscript𝑘7k_{7} 1002 (μM.min)1(\mu M.{\rm min})^{-1}
k7subscript𝑘7k_{-7} 30 min1superscriptmin1{\rm min}^{-1}
k8subscript𝑘8k_{8} 30 min1superscriptmin1{\rm min}^{-1}
kp7𝑘subscript𝑝7kp_{7} 1002 (μM.min)1(\mu M.{\rm min})^{-1}
kp7𝑘subscript𝑝7kp_{-7} 150 min1superscriptmin1{\rm min}^{-1}
kp8𝑘subscript𝑝8kp_{8} 150 min1superscriptmin1{\rm min}^{-1}
k9subscript𝑘9k_{9} 1002 (μM.min)1(\mu M.{\rm min})^{-1}
k9subscript𝑘9k_{-9} 150 min1superscriptmin1{\rm min}^{-1}
k10subscript𝑘10k_{10} 150 min1superscriptmin1{\rm min}^{-1}
kp9𝑘subscript𝑝9kp_{9} 1002 (μM.min)1(\mu M.{\rm min})^{-1}
kp9𝑘subscript𝑝9kp_{-9} 150 min1superscriptmin1{\rm min}^{-1}
kp10𝑘subscript𝑝10kp_{10} 150 min1superscriptmin1{\rm min}^{-1}
Table S3: Total concentration (in μM𝜇𝑀\mu M) of the kinase proteins for Fig. 4 (panels a–c) and Fig. 7
[K]totsubscriptdelimited-[]𝐾𝑡𝑜𝑡[K]_{tot} [2K]totsubscriptdelimited-[]2𝐾𝑡𝑜𝑡[2K]_{tot} [3K]totsubscriptdelimited-[]3𝐾𝑡𝑜𝑡[3K]_{tot}
4.8 1.2 0.0030
Table S4: Total concentration (in μM𝜇𝑀\mu M) of the phosphatase proteins for Figs. 2–6
Phosphatase Protein Value
MAP3K-Phosphatase 1×1041superscript1041\times 10^{-4}
MAP2K-Phosphatase 3×1043superscript1043\times 10^{-4}
MAPK-Phosphatase 0.05
Table S5: Total concentration (in μM𝜇𝑀\mu M) of the kinase proteins for Figs. 2–3
Panels [K]totsubscriptdelimited-[]𝐾𝑡𝑜𝑡[K]_{tot} [2K]totsubscriptdelimited-[]2𝐾𝑡𝑜𝑡[2K]_{tot} [3K]totsubscriptdelimited-[]3𝐾𝑡𝑜𝑡[3K]_{tot}
(a) and (f) 3.0 3.0 0.0080
(b) and (g) 1.0 2.4 0.0024
(c) and (h) 1.2 6.0 0.0028
(d) and (i) 2.0 2.2 0.0024
(e) and (j) 4.8 6.0 0.0014

S3 Supplementary Figures

Refer to caption
Figure S1: Magnified views of the phase space trajectory shown in Fig. 2(i). The blue markers correspond to the final point in the time series displayed in Fig. 2(d), while the red markers indicate the fixed point of the dynamical system in the presence of stimulus. (a) Magnified view of the trajectory beginning from the black marker shown in Fig. 2(i). The pink marker denotes the starting point of the segment of the trajectory displayed in panel (b). (b) Further magnification of the section of phase-plane trajectory shown in (a), corresponding to the duration when the system moves away from the unstable limit cycle and converges to the stable fixed point.
Refer to caption
Figure S2: Processes underlying long-lived memory and reverberatory dynamics. (a) Schematic representation of MAPK cascade showing the processes that occur subsequent to removing a stimulus. The numbers (14141-4) represent the sequence of events that lead to the emergence of the post-stimulus large-amplitude spiking activity shown in (b). The enzyme-substrate protein complex formed during activation of MAPK by doubly phosphorylated MAP2K is indicated by “c”. The green arrow from the MAPK layer to the MAP2K layer represents the release of doubly phosphorylated MAP2K from downstream complexes. (b) A characteristic time-series for the normalized concentration of singly and doubly phosphorylated MAPK (nKsubscript𝑛superscript𝐾n_{K^{*}} and nKsubscript𝑛superscript𝐾absentn_{K^{**}}, respectively) following the removal of an applied stimulus of amplitude S=2.0×10⁶μM𝑆2.0superscript106𝜇𝑀S=2.0\times 10^{-6}\mu M at t=0𝑡0t=0. The numbers (14141-4) represent the same events shown in (a). The total concentrations of the kinases and phosphatases used for generating the time-series are provided in Tables S3 and S4, respectively.
Refer to caption
Figure S3: Characteristic dynamics of the molecular components of the MAP Kinase cascade following withdrawal of a stimulus. (a) The time-series of the normalized concentration of doubly phosphorylated MAPK ([K]/[K]totdelimited-[]superscript𝐾absentsubscriptdelimited-[]𝐾𝑡𝑜𝑡[K^{**}]/[K]_{tot}) following removal of an applied stimulus with amplitude S=2.0×10⁶μM𝑆2.0superscript106𝜇𝑀S=2.0\times 10^{-6}\mu M at t=0𝑡0t=0. (b-r) Time-series of the normalized concentrations of the different components of the MAPK cascade, shown starting from t=150𝑡150t=150 minutes after withdrawing the stimulus, displayed together with the time-series of normalized MAPK activity [K]/[K]totdelimited-[]superscript𝐾absentsubscriptdelimited-[]𝐾𝑡𝑜𝑡[K^{**}]/[K]_{tot}. The total concentrations of the kinases and phosphatases used for generating the figures are provided in Tables S3 and S4, respectively.
Refer to caption
Figure S4: Dependence of reverberatory activity on the total kinase concentrations, viz., MAPK ([K]totsubscriptdelimited-[]𝐾𝑡𝑜𝑡[K]_{tot}), MAP2K ([2K]totsubscriptdelimited-[]2𝐾𝑡𝑜𝑡[2K]_{tot}) and MAP3K ([3K]totsubscriptdelimited-[]3𝐾𝑡𝑜𝑡[3K]_{tot}). (a) The number of post-stimulus spikes Nrsubscript𝑁𝑟N_{r}, (b) the total memory time τmsubscript𝜏𝑚\tau_{m} (in minutes), and (c) isosurfaces for Nrsubscript𝑁𝑟N_{r} observed on withdrawing an applied stimulus of amplitude S=2.0×10⁶μM𝑆2.0superscript106𝜇𝑀S=2.0\times 10^{-6}\mu M, are shown as functions of the three total kinase concentrations. The total concentrations of the phosphatases are held fixed for (a-c) and are provided in Table S4.
Refer to caption
Figure S5: Characterization of the reverberatory dynamics observed after withdrawing a stimulus having amplitude S=2.0×10⁶μM𝑆2.0superscript106𝜇𝑀S=2.0\times 10^{-6}\mu M. (a) The interval between successive spikes i1𝑖1i-1 and i𝑖i increases with time (tisubscript𝑡𝑖t_{i} being the time of occurrence of the i𝑖ith spike) for two distinct total concentrations of MAP2K. The total concentrations of MAPK and MAP3K are [K]tot=1.2μMsubscriptdelimited-[]𝐾𝑡𝑜𝑡1.2𝜇𝑀[K]_{tot}=1.2\mu M and [3K]tot=2.8nMsubscriptdelimited-[]3𝐾𝑡𝑜𝑡2.8𝑛𝑀[3K]_{tot}=2.8nM, respectively. (b) The primary recovery time τPRsubscript𝜏PR\tau_{\rm PR} (stars) and the total duration of reverberatory activity τrsubscript𝜏𝑟\tau_{r} (filled circles) are shown for different values of Nrsubscript𝑁𝑟N_{r} (indicated by the color bar). While τPRsubscript𝜏PR\tau_{\rm PR} increases monotonically with increasing total MAPK concentration, τrsubscript𝜏𝑟\tau_{r} shows a more complex dependence ([2K]tot=3μMsubscriptdelimited-[]2𝐾𝑡𝑜𝑡3𝜇𝑀[2K]_{tot}=3\mu M and [3K]tot=4nMsubscriptdelimited-[]3𝐾𝑡𝑜𝑡4𝑛𝑀[3K]_{tot}=4nM). (c) The dependence of τrsubscript𝜏𝑟\tau_{r} on [K]totsubscriptdelimited-[]𝐾𝑡𝑜𝑡[K]_{tot} for different values of Nrsubscript𝑁𝑟N_{r} has a similar nature for different choices of [3K]totsubscriptdelimited-[]3𝐾𝑡𝑜𝑡[3K]_{tot} (indicated by the color bar, [2K]tot=3μMsubscriptdelimited-[]2𝐾𝑡𝑜𝑡3𝜇𝑀[2K]_{tot}=3\mu M). Note that for panel (c), we consider only situations where the system attains a steady state on maintaining the stimulation. For the total concentrations of the phosphatases see Table S4.
Refer to caption
Figure S6: Protein complexes in the MAPK cascade exhibit relaxation behavior occurring over a broad range of time-scales. Decay of activity is shown after withdrawing an applied stimulus of amplitude S=1.2×10⁶μM𝑆1.2superscript106𝜇𝑀S=1.2\times 10^{-6}\mu M. The relaxation times τxsubscript𝜏x\tau_{\rm x} of the different molecular species, viz., (a) the protein complexes between non-phosphorylated and singly phosphorylated (non-active) kinase proteins and the doubly phosphorylated (active) kinase protein of the preceding layer, and (b) the protein complexes between the phosphorylated (singly- or doubly-) kinase proteins and the phosphatase that carries out dephosphorylation in the corresponding layer of the MAPK cascade, vary with the total concentration of MAP2K. The nature of this dependence is distinct for lower and higher values of [2K]totsubscriptdelimited-[]2𝐾𝑡𝑜𝑡[2K]_{tot}. For both panels, [K]tot=0.8μMsubscriptdelimited-[]𝐾𝑡𝑜𝑡0.8𝜇𝑀[K]_{tot}=0.8\mu M and [3K]tot=0.0020μMsubscriptdelimited-[]3𝐾𝑡𝑜𝑡0.0020𝜇𝑀[3K]_{tot}=0.0020\mu M. The total concentrations of the phosphatases are provided in Table S4.
Refer to caption
Figure S7: Dependence of the primary recovery time τPRsubscript𝜏𝑃𝑅\tau_{PR} on (a-i) the total concentration of MAP2K ([2K]totsubscriptdelimited-[]2𝐾𝑡𝑜𝑡[2K]_{tot}) and on (j-o) the total concentration of MAPK ([K]totsubscriptdelimited-[]𝐾𝑡𝑜𝑡[K]_{tot}) for different values of the total concentration of MAP3K ([3K]totsubscriptdelimited-[]3𝐾𝑡𝑜𝑡[3K]_{tot}), obtained upon removing stimuli having different amplitudes S𝑆S. Panels (a,d,g,j,m) are for S=0.8×10⁶μM𝑆0.8superscript106𝜇𝑀S=0.8\times 10^{-6}\mu M, panels (b,e,h,k,n) are for S=1.2×10⁶μM𝑆1.2superscript106𝜇𝑀S=1.2\times 10^{-6}\mu M, and panels (c,f,i,l,o) are for S=2.0×10⁶μM𝑆2.0superscript106𝜇𝑀S=2.0\times 10^{-6}\mu M. We have only considered situations where the system reaches a steady state upon application of a time-invariant stimulus, and that do not show any reverberatory activity (Nr=0subscript𝑁𝑟0N_{r}=0) during relaxation to the resting state. The curves in panels (a-i) are obtained for different values of [K]totsubscriptdelimited-[]𝐾𝑡𝑜𝑡[K]_{tot}, namely, (a-c) [K]tot=0.8μMsubscriptdelimited-[]𝐾𝑡𝑜𝑡0.8𝜇𝑀[K]_{tot}=0.8\mu M, (d-f) [K]tot=1.0μMsubscriptdelimited-[]𝐾𝑡𝑜𝑡1.0𝜇𝑀[K]_{tot}=1.0\mu M, and (g-i) [K]tot=1.8μMsubscriptdelimited-[]𝐾𝑡𝑜𝑡1.8𝜇𝑀[K]_{tot}=1.8\mu M. The curves in panels (j-o) are obtained for different values of [2K]totsubscriptdelimited-[]2𝐾𝑡𝑜𝑡[2K]_{tot}, namely, (j-l) [2K]tot=0.8μMsubscriptdelimited-[]2𝐾𝑡𝑜𝑡0.8𝜇𝑀[2K]_{tot}=0.8\mu M, and (m-o) [2K]tot=1.8μMsubscriptdelimited-[]2𝐾𝑡𝑜𝑡1.8𝜇𝑀[2K]_{tot}=1.8\mu M. The total concentrations of the phosphatases for all panels are given in Table S4.
Refer to caption
Figure S8: Dependence of reverberatory activity on the total concentrations of the phosphatases MAPK P’ase ([PK]delimited-[]subscript𝑃𝐾[P_{K}]), MAP2K P’ase, ([P2K]delimited-[]subscript𝑃2𝐾[P_{2K}]) and MAP3K P’ase ([P3K]delimited-[]subscript𝑃3𝐾[P_{3K}]). (a) The number of spikes Nrsubscript𝑁𝑟N_{r} and (b) the total memory time τmsubscript𝜏𝑚\tau_{m} (in minutes) observed on withdrawing an applied stimulus of amplitude S=2.0×10⁶μM𝑆2.0superscript106𝜇𝑀S=2.0\times 10^{-6}\mu M. Situations where the primary recovery time is longer than a maximum or cut-off value (see Methods), such that the reverberatory nature of the dynamics cannot be properly measured, are indicated by the color corresponding to “U”. (c) The interval between successive spikes i1𝑖1i-1 and i𝑖i increases with time (tisubscript𝑡𝑖t_{i} being the time of occurrence of the i𝑖ith spike). As the MAPK P’ase concentration is increased, the durations of these intervals are seen to increase. The total concentrations of the other two phosphatases are maintained at [P2K]=680pMdelimited-[]subscript𝑃2𝐾680𝑝𝑀[P_{2K}]=680pM and [P3K]=10pMdelimited-[]subscript𝑃3𝐾10𝑝𝑀[P_{3K}]=10pM. (d) The variation of primary recovery time τPRsubscript𝜏PR\tau_{\rm PR} (stars) and the total duration of reverberatory activity τrsubscript𝜏𝑟\tau_{r} (filled circles) as a function of total MAPK P’ase concentration are shown for different values of Nrsubscript𝑁𝑟N_{r} (indicated by the color bar). While τPRsubscript𝜏PR\tau_{\rm PR} decreases monotonically with increasing [PK]delimited-[]subscript𝑃𝐾[P_{K}], τrsubscript𝜏𝑟\tau_{r} shows a more complex dependence ([P2K]=200pMdelimited-[]subscript𝑃2𝐾200𝑝𝑀[P_{2K}]=200pM and [P3K]=6pMdelimited-[]subscript𝑃3𝐾6𝑝𝑀[P_{3K}]=6pM). (e) Dependence of the total memory time τmsubscript𝜏𝑚\tau_{m} on total MAPK P’ase concentration ([PK]delimited-[]subscript𝑃𝐾[P_{K}] shown in log scale) for different total concentrations of MAP2K P’ase (values indicated above each of the three panels) and MAP3K P’ase (indicated using different colors as shown in the color bar). Note that we consider only situations where the system attains a steady state on maintaining stimulation. For details of the total concentrations of the kinases, see Table S3.
Refer to caption
Figure S9: The time interval between successive spikes i1𝑖1i-1 and i𝑖i obtained after removing a stimulus, increases with the number of spike events (i𝑖i being the event number of the i𝑖ith spike). The trend appears to be independent of the stimulus amplitude S𝑆S. The total concentrations of the phosphatases are PK=0.1μMsubscript𝑃𝐾0.1𝜇𝑀P_{K}=0.1\mu M, P2K=680pMsubscript𝑃2𝐾680𝑝𝑀P_{2K}=680pM and P3K=10pMsubscript𝑃3𝐾10𝑝𝑀P_{3K}=10pM, respectively. The total concentrations of the kinases are provided in Table S3.