Ferromagnetic Quantum Critical Point in CePd2P2 with Pd Ni Substitution
Abstract
An investigation of the structural, thermodynamic, and electronic transport properties of the isoelectronic chemical substitution series Ce(Pd1-xNix)2P2 is reported, where a possible ferromagnetic quantum critical point is uncovered in the temperature - concentration () phase diagram. This behavior results from the simultaneous contraction of the unit cell volume, which tunes the relative strengths of the Kondo and RKKY interactions, and the introduction of disorder through alloying. Near the critical region at 0.7, the rate of contraction of the unit cell volume strengthens, indicating that the cerium -valence crosses over from trivalent to a non-integer value. Consistent with this picture, x-ray absorption spectroscopy measurements reveal that while CePd2P2 has a purely trivalent cerium -state, CeNi2P2 has a small ( 10 %) tetravalent contribution. In a broad region around , there is a breakdown of Fermi liquid temperature dependences, signaling the influence of quantum critical fluctuations and disorder effects. Measurements of clean CePd2P2 furthermore show that applied pressure has a similar initial effect to alloying on the ferromagnetic order. From these results, CePd2P2 emerges as a keystone system to test theories such as the Belitz-Kirkpatrick-Vojta model for ferromagnetic quantum criticality, where distinct behaviors are expected in the dirty and clean limits.
- PACS numbers
-
PACS
pacs:
Valid PACS appear hereI Introduction
Heavy fermion -electron intermetallics continue to attract interest because many of them exhibit complex phase diagrams with diverse phenomena including nematic electronic states, charge and spin instabilities, and unconventional superconductivity. Stewart01 ; Rosch07 ; Gegenwart08 ; Pfleiderer09 ; brando16 In many cases this is related to a competition between the RKKY and Kondo interactions, which mediate magnetism and compensate localized spins, respectively. Doniach_77 ; kondo ; ruderman ; kasuya ; yosida The fine balance between these interactions can cause a magnetic ordering temperature to be continuously suppressed towards zero temperature at a quantum critical point (QCP). As this occurs novel behaviors often emerge including the breakdown of Fermi liquid behavior and the emergence of superconductivity. Pfleiderer09 ; mathur98 ; thompson12 This has led to a viewpoint that quantum critical fluctuations of an order parameter are key for producing novel phenomena, and this phenomenology even spans diverse families of materials that are distinct from -electron intermetallics: e.g., cuprate and iron-based superconductors, ramshaw15 ; paglione10 organic superconductors, leyraud09 charge density wave systems, gruner17 and others.
There nonetheless remain many open questions, including how the specific type of magnetism being suppressed influences a quantum critical region. The earliest theories of quantum phase transitions focused on ferromagnetism, stoner and the seminal work of Hertz and Millis predicted that a ferromagnetic phase transition would remain continuous to zero temperature. hertz ; millis More recent work by Belitz-Kirkpatrick-Vojta (BKV) demonstrates instead that for clean materials in two and three dimensions a zero temperature transition from ferromagnetism to paramagnetism is discontinuous. brando16 ; Belitz12 ; belitz99 ; belitz05 ; belitz15 The first order change at the phase boundary prevents diverging fluctuations of the magnetic order parameter. This is in contrast to what is seen near second order antiferromagnetic QCPs where the order parameter diverges, and may interfere with phenomena such as unconventional superconductivity. The BKV theory also predicts that there is a tricritical point that separates a high temperature line of second order phase transitions from a low temperature line of first order phase transitions, where the application of a magnetic field produces wing-like second order phase boundaries that intercept zero temperature. In disordered systems the tricritical point is pushed below zero temperature and the second order phase boundary extends to zero temperature. This has spurred interest in ferromagnetic quantum criticality in disordered metals, where an intriguing possibility is that they might host anomalous metallic states and even unconventional superconductivity. belitz99 ; belitz05 ; belitz15 ; brando16 ; huang13 ; Nakatsuji08 It is noteworthy that while there are U- and Yb- based ferromagnetic superconductors saxena2001 ; huy ; aoki2001 ; akazawa_2004 ; ner11 , there are no cerium-based analogues despite some electronic similarities between the associated 5 and 4 states.
CePd2P2 was recently reported to be a correlated electron ferromagnet crystallizing in the well-known ThCr2Si2-type structure tran14 ; ikeda15 , while its isoelectronic volume compressed analogue CeNi2P2 exhibits a nonmagnetic ground state. jeitschko ; chen ; Dra This suggests that the Pd Ni alloy series could host a ferromagnetic QCP. We synthesized single crystal specimens of Ce(Pd1-xNix)2P2 for 0 1, where the contracting unit cell volume applies a chemical pressure. X-ray diffraction and magnetic susceptibility measurements show that the cerium ions remain nearly trivalent up to 0.66, where the rate of unit cell volume contraction increases, signaling a change in the -electron valence. X-ray absorption spectroscopy measurements for CePd2P2 and CeNi2P2 reinforce this view by revealing trivalent and trivalent with a small fraction of tetravalent -electron character, respectively. Features associated with the ferromagnetic ordering are evident for 0 0.69 in the magnetic susceptibility, heat capacity, and electrical resistivity, where the ordering temperature is continuously suppressed towards zero at an extrapolated critical value of 0.7. In the critical region there is chemical disorder which allows the phase transition to remain second order, even as it approaches zero temperature. This results in a putative ferromagnetic QCP, around which there are indications for a breakdown of Fermi liquid behavior: in particular, the heat capacity divided by temperature diverges nearly logarithmically with decreasing . There is also evidence that the disorder contributes to the unusual temperature dependences by producing a quantum Griffiths phase that extends over a broad -range. Griffiths1969 ; vojta ; sereni07 ; Westerkamp09 We furthermore find that for clean CePd2P2, applied pressure initially suppresses the ferromagnetism in a manner similar to that of Pd Ni substitution. Therefore, this system offers the opportunity to study behavior at a disordered ferromagnetic quantum critical point and eventually to compare to the ordered analogue, as is needed to test the BKV theory and to ultimately design new QCP materials.
II Experimental Methods
Single crystals of Ce(Pd1-xNix)2P2 were grown from elements with purities 99.9% in a molten flux of Pd, Ni and P. The reaction ampoules were prepared by loading the elements in the ratio Ce:Pd:Ni:P ; 1:11(1-):11:8 into a 2 mL alumina crucible for each of the nominal Ni concentrations. The crucibles were sealed under vacuum in quartz ampoules and heated to at a rate of /hour, held at for 6 hours, heated to at a rate of /hour, held at for 6 hours, heated to at a rate of /hour, kept at for 3 hours, and then cooled at a rate of /hour to . At this temperature, the remaining flux was separated from the crystals by centrifuging. Single-crystal platelets with typical dimensions of several millimeters on a side and several millimeters in thickness were collected.
The crystal structure and chemical composition were verified by powder x-ray-diffraction (XRD) and energy dispersive spectrometer (EDS) analysis. EDS results are shown in Fig. 1a, where the measured concentration is compared to the nominal concentration . Throughout the rest of the manuscript we use unless otherwise specified. Magnetization () measurements were carried out for single crystals at temperatures 1.8 300 K under an applied magnetic field of 5 kOe for applied both parallel () and perpendicular () to the axis using a Quantum Design VSM Magnetic Property Measurement System. The AC magnetic susceptibility ’() for selected concentrations was also measured using the same apparatus. Electrical resistivity measurements for temperatures 0.5 300 K were performed in a four-wire configuration and the heat capacity was measured for 0.39 20 K using a Quantum Design Physical Property Measurement System. () measurements under applied pressure were performed using a piston cylinder pressure cell with Daphne 7474 oil as the pressure transmitting medium. The pressure is determined by the shift in ruby flourescence peaks and are the values determined below 10 K. These measurements were performed at the National High Magnetic Field Laboratory DC field User facility using standard He3 cryostats.
Samples were analyzed using Ce L3-edge X-ray absorption spectroscopy (XANES) at the Stanford Synchrotron Radiation Lightsource (SSRL) on beam line 11-2. Single crystals of the compounds were ground and diluted with boron nitride and painted onto 0.5 mil Kapton tape, the tape was attached to an aluminum sample plate and loaded into a liquid helium cryostat. A single energy was selected using a liquid-N2-cooled double-crystal monochromator utilizing Si(220) ( = 0) crystals. The crystals were detuned by 70% at 6100 eV to remove higher order harmonics. Spectra were measured in fluorescence mode using a Lytle detector equipped with a Ti filter (3 absorption lengths) at two different temperatures, 85 K and 10 K. A Cr-calibration foil was placed downstream of the sample and spectra were calibrated to the first reflection point of Cr(5989.0 eV). Using the Athena11 software package, L3-edge spectral were background subtracted and normalized at (5723 eV). A deconvoluted model for the Ce L3-edge XANES data was obtained using a modified version of EDG-FIT nolas in IGOR 6.0. Using this least-squares algorithm spectra were modeled with a minimum number of pseudo-Voight functions (50:50 Lorentzian:Gaussian) and a 1:1 ratio of arctangent and error function. The areas under the pre-edge peaks (hereafter defined as the intensity) were equal to the FWHM x peak height.
Single energy images, elemental maps, and Ce M5,4-edge x-ray absorption spectra (XANES) ev07 were acquired using the scanning transmission x-ray microscope (STXM) instrument at the spectromicroscopy beamline 10ID-1 at the Canadian Light Source (CLS) according to data acquisition methodology described previously. min17 ; man18 ; ha18
III Results
Powder X-ray diffraction measurements show that the ThCr2Si2-type structure persists across entire the Pd Ni substitution series, while the tetragonal lattice constants ( and ) and the unit cell volume () decrease with increasing (Fig. 1). Up to 0.66 the trends are consistent with Vegard’s law, where the linear lattice contraction is due to the smaller size of Ni by comparison to Pd. This suggests that over this -range the room temperature Ce valence remains constant. For 0.66 the unit cell volume continues to decrease linearly, but with a larger slope, signaling a change in the cerium valence. The volume contraction results in a chemical pressure which is estimated to be near 7.5 GPa for 0.66 and 13.6 GPa at = 0.96. These values are calculated using the Birch-Murnaghan equation , where the value of the bulk modulus for CeCu2Si2 ( 110 GPa) is used. spain86

The magnetic susceptibility vs temperature and magnetization vs for data are shown in Fig. 2. As previously reported for polycrystalline specimens, tran14 ferromagnetic ordering appears in for 0 as a sharp increase at 28.5 K, which we define as the peak in / (not shown). For , rapidly saturates towards 1.93 . The evolution of the ferromagnetic order with is determined using these quantities, where decreases linearly and is extrapolated to intercept zero temperature near 0.7. The persistence of the ferromagnetism into the critical -region is seen in the curves, which remain hysteretic even as is smoothly suppressed (Figs. 2d and e). For , the magnitudes of and continue to decrease and become similar to that of paramagnetic CeNi2P2 as approaches 1. chen
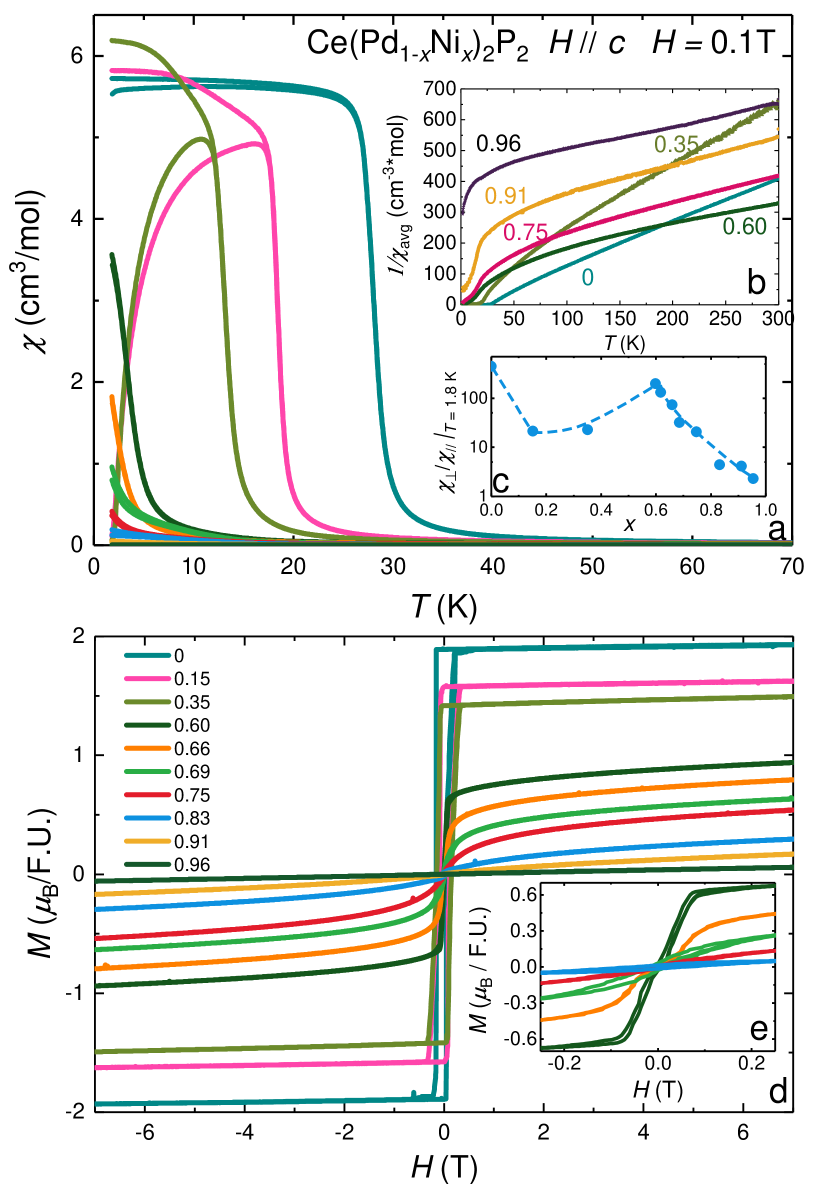
The high temperature Curie-Weiss behavior provides further insight into the -evolution of the -electron state, magnetocrystalline anisotropy, and strength of the Kondo hybridization. There is a strong evolution in the magnetic anisotropy / between the and directions: while it decreases by roughly a factor of 10 to approach / 20 near 0.35, it recovers to nearly the 0 value at 0.6 and finally decreases to become isotropic at 1 (Fig. 2c). In order to analyze this data using Curie-Weiss fits, we calculate the average susceptibility, defined as = (2 + )/3 (Fig. 2b). For = 0, is consistent with earlier results for polycrystalline specimens tran14 , yielding an effective magnetic moment = 2.4 (trivalent cerium) and a Curie-Weiss temperature = 2 K. Pd Ni substitution causes to increase to a value near -193 K at = 0.66, and afterwards to even larger negative values. This is a common feature in Ce-based materials with strong hybridization between the - and conduction electrons and indicates that the Kondo interaction strengthens with increasing . sereni07
To further evaluate the effect of Pd Ni substitution on the Ce -electron state, Ce L3-edge X-ray absorption spectra (XANES) were obtained from single crystals of CeNi2P2 and CePd2P2, the end members of the series. Ce3+ usually show a single absorption peak at ca. 5723-5725 eV, whereas Ce4+ exhibits a “double-white line” feature with maxima at ca. 5724-5728 and 5736-5739 eV. As shown in Fig. 3, the Ce L3-edge spectrum from CePd2P2 is typical of Ce3+, containing a single pronounced absorption peak with a maximum at 5725.2 eV (FWHM = 6.60 eV). Although substituting Ni for Pd has essentially no impact on the main absorption peak energy (maximum = 5725.1 eV), subtle spectral changes emerges; most notably, the main absorption peak broadens by 1.24 eV (FWHM = 7.84 eV) and a minor post-edge feature emerges near 5735 eV. Additionally, spectra obtained from CeNi2P2 and CePd2P2 are unchanged as a function of temperature between 85 and 10 K.
To characterize the origin of these changes, the Ce L3-edge XANES spectra are modeled using a least-squares algorithm between 5705 and 5741 eV. Although the entire fitted region for CePd2P2 is easily modeled by the combination of a single peak at 5725.2 eV and a step-function at 5724.4 eV, an analogous model for CeNi2P2 does not adequately represent the data. In particular, there is substantial misfit associated with the post-edge feature that is absent in the CePd2P2 spectrum. Hence, three peaks and a step-function are needed to model the CeNi2P2 spectrum. The main absorption peak is at 5725.1 eV, the step function at 5723.0 eV, and two post-edge peaks are fit at 5732.6 and 5735.7 eV. We believe it is of no coincidence that the highest-energy post-edge peak (at 5735.7 eV) occurs at a similar energy to the higher energy peak of the “double-white line” feature typically observed for Ce4+ (between 5736 and 5739 eV). bianconi1987 ; kaindl1988 ; sham2005 ; walter2009 ; loble2015 ; bogart2015 ; cary2016 ; kratsova2016 ; antonio2017 ; toscani2016 Hence, these data are interpreted as indicating that CeNi2P2 contains a mixture of Ce3+ and Ce4+. Comparison of the intensities (FWHM x peak height) of the main absorption peak (intensity = 8.8) with the small post-edge peaks (intensities = 0.2 and 0.4) suggests that CeNi2P2 contains on the order of 7(1)% Ce.
XANES data at the M5,4-edge were obtained to corroborate the L3-edge measurements. The spectroscopic approach can be advantageous for probing 4 orbital occupation and mixing, especially for systems with mixed valence or multiconfigurational ground states. bianconi1987 ; dex87 ; kaindl1988 ; ani11 ; ani12 ; hu00 ; kaindl84 ; le85 ; ra92 The background subtracted and normalized M5,4-edge spectra for CeNi2P2 and CePd2P2 are provided in Fig. 4. The M5,4-edge spectra are split into low energy M5 (3) and high energy M4 (3) edges due to spin-orbit coupling with the 3 core hole. For both CeNi2P2 and CePd2P2 as well as the CeCl63- reference, the M5,4-edge exhibits a characteristic “sawtooth” pattern with fine structure that closely resembles expectations from theory for a 34 final state and an isolated Ce3+ ion. le85 For the Ce4+ reference, CeCl62-, both the M5- and M4-edges are split into intense main peaks and additional satellite features about 5 eV higher in energy. le85 ; am16 ; hu97 ; jean98 ; dong03 Upon close inspection, weak satellite features are also present 887.3 and 905.4 eV in the Ce M5,4-edge spectrum for CeNi2P2. Previous calculations have attributed the presence of satellite features in the M5,4-edge XANES spectra of formally Ce4+ compounds to interaction of 34 and 34 configurations in the final state. ra92 ; ani13 In this general sense the M5,4-edge XANES spectrum of CeNi2P2 resembles that of the molecular compound (Et4N)2CeCl6 in addition to extended solids and intermetallics such as CeO2 and CeRh3. kaindl84 Because transitions associated with the 34 and 34 final states are not well-resolved in the M5,4-edge spectra, the intensity of the satellite features cannot be directly related to the amounts of Ce4+, or 4 character in the ground state for CeNi2P2. However, the presence of small satellite features in the Ce M5,4-edge spectrum for CeNi2P2, and the lack thereof for CePd2P2, is consistent with the observation of 10% Ce4+ character in the ground state of CeNi2P2.


The heat capacity divided by vs. data are shown in Fig. 5a, which further expose the ordered state and underlying electronic behavior. The 0 ferromagnetism appears as a lambda-like feature near 28.5 K, consistent with a second order phase transition. With increasing , moves to lower temperatures and up to 0.35 the shape of phase transition is preserved but its overall size grows. This indicates that even as is suppressed the associated entropy is conserved. Between 0.35 0.69, the ferromagnetic feature broadens and is superimposed on an increasing background. The broadening of the phase transition is attributed to chemical/structural disorder which is maximal near the middle of the substitution series. As approaches zero near 0.7, diverges nearly continuously down to 0.5 K. This is a common feature of ‘non-Fermi-liquid’ behavior near a quantum critical point in correlated -electron materials and may be associated with quantum critical fluctuation of the magnetic order parameter. Stewart01 ; Rosch07 ; Gegenwart08 ; Pfleiderer09 ; brando16 For larger the divergence weakens and finally tends to saturate at low temperature for = 0.96 in a manner that is similar to CeNi2P2, indicating the recovery of the paramagnetic Fermi liquid state.
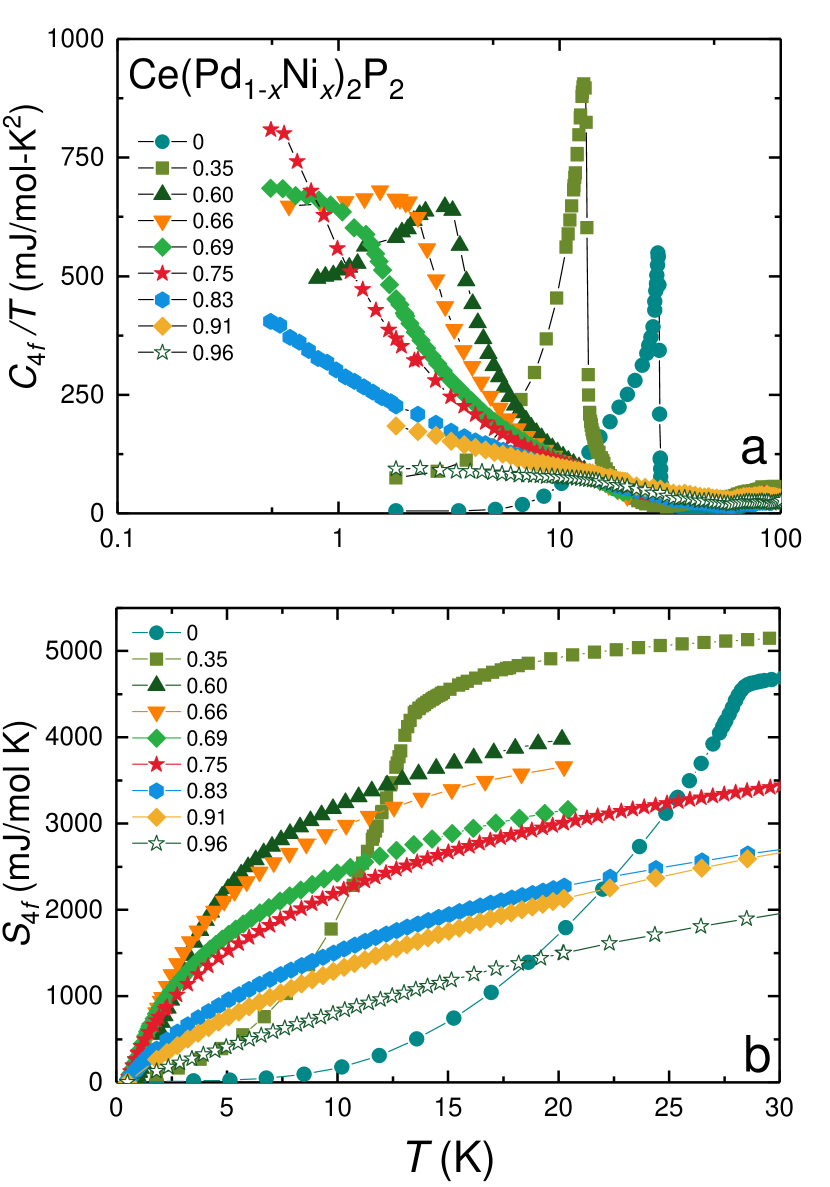
The 4 contribution to the entropy vs. is shown in Fig. 5b. was calculated by subtracting for the nonmagnetic analogue La(Pd1-xNix)2P2 from that of Ce(Pd1-xNix)2P2 and subsequently integrating from 0.5 K. The nonmagnetic lattice term was approximated by summing the heat capacities of LaPd2P2 and LaNi2P2 in the ratios (1-):. While this approach slightly underestimates the total 4 entropy and only approximates the lattice contribution to the heat capacity, it provides a consistent way to assess the evolution of with . reaches 0.88ln2 at for 0. This is slightly reduced from the full entropy of a a doublet ground state and indicates weak Kondo screening of the -moment by the conduction electrons. tran14 ; ikeda15 In the -region where the phase transition remains sharp (0 0.35), consistently recovers to similar values at , suggesting that the strength of the hybridization changes little over this range. For specimens with larger concentrations that still show ferromagnetism but have broadened phase transitions (0.35 0.69), the entropy recovered at grows smaller with increasing , revealing strengthening hybridization. For concentrations in the no order region ( ) is significantly reduced from that seen at lower and increases smoothly with increasing in a manner consistent with there being strong Kondo hybridization between the - and conduction electrons.Doniach_77 ; kondo

The temperature dependences of the electrical resistivity normalized to the room temperature value vs. for the entire substitution series are shown in Fig. 6. The behavior for 0 is consistent with earlier results, where the resistivity decreases with decreasing and evolves through a kink near 28.5 K that further reduces the electronic scattering due to the removal of magnetic fluctuations. tran14 Here, the residual resistivity ratio 12. For 0 0.35 decreases due to increasing disorder, but the reduction in / at remains sharp. The - dependence of the residual resistivity is shown in Fig. 6c, where the doping introduces a substantial amount of disorder which results in a large residual resistivity near the critical region ( 300 cm). Based on this, we estimate that the specimens in this concentration range belong to the second regime as described in the BKV theory, brando16 ; Belitz12 where is several hundred cm. Over this -range the phase transition is preceded in temperature a growing upturn in / which indicates a gradual strengthening hybridization between the - and conduction electron states. For larger the phase transition broadens due to increasing disorder and continues to be suppressed until it is no longer visible near 0.7.
In order to further examine the tuning mechanisms that control the ordered state in CePd2P2, we performed measurements of the electrical resistivity under hydrostatic pressure (Fig. 6d). We find that the ferromagnetic phase transition is monotonically suppressed with increasing pressure at a rate of 2.4 K/GPa, and from this we estimate that an applied pressure of 12 GPa would be needed to fully suppress the ferromagnetism to zero temperature in the parent compound. In order to directly compare this result to what is seen for Pd Ni substitution, we convert the applied pressure to change in unit cell volume and then associate this value with a Ni concentration. Results for a typical bulk modulus 110 GPa (similar to what is observed for CeCu2Si2 spain86 ) are shown as open stars in Fig. 8a, where the slope of is weaker than that seen in the substitution series.
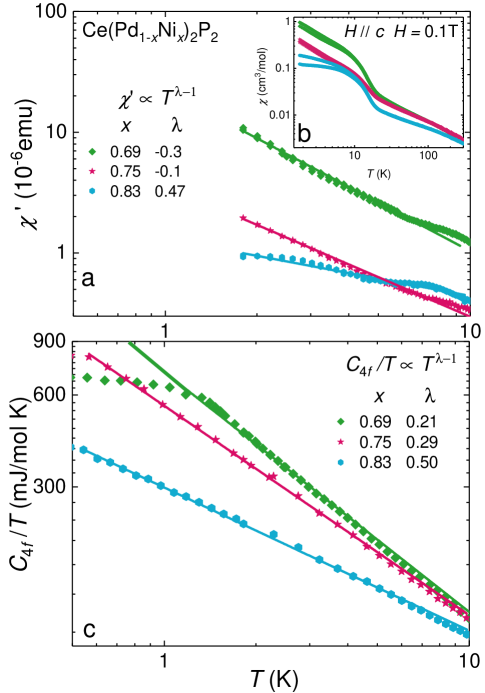
Finally, in order to assess whether chemical disorder produces magnetic clustering behavior that impacts the low temperature behavior in the large -region, AC magnetic susceptibility ’ measurements were performed for selected concentrations (Fig 7a). For the data can be fit using the formula ’ , where becomes less negative with increasing and changes sign to become positive for 0.83. This type of behavior is expected if chemical disorder produces cluster regions with short range magnetic correlations while the bulk state remains paramagnetic: e.g., as for a quantum Griffiths phase (QGP). Griffiths1969 ; vojta ; sereni07 ; Westerkamp09 Similar fits were carried out for over a broader temperature range, which also reveal a systematic evolution in that might be consistent with a QGP. Over the same -range, we find that there is a weak and hysteretic increase in () that disappears before = 1 (Fig. 7b). While this feature indicates the persistence of short range ferromagnetic interactions for , it does not appear in other bulk measurements such as the heat capacity. We furthermore point out that the power-law behavior extends over a broad -range, which is in contrast to the contained v-shaped region that is often seen for ordered materials with quantum critical behavior Stewart01 ; Rosch07 ; Gegenwart08 ; Pfleiderer09 . While these measurements are suggestive of QGP behavior, further work is still needed: e.g., the trends at lower temperatures should be established.

IV Discussion
Fig. 8 shows the - phase diagram and the evolution of several quantities vs. . is suppressed linearly with , and is extrapolated to approach zero temperature near 0.7. For 0 we also plot results from measurements under applied pressure, where chemical and applied pressure both continuously suppress . If we assume 220 GPa (closed stars) then both chemical and applied pressure suppress at the same rate. A more realistic value of 110 GPa (open stars) results in a more gradual suppression of . Regardless of which is chosen, it is clear that the main tuning parameter that controls is the unit cell volume, which likely changes the relative strengths of the Kondo and RKKY interactions in a Doniach-like scenario.Doniach_77 This argument is strengthened by considering that for Kondo lattice systems an estimate of the Kondo energy scale can be made using the expression = . thy75 As shown Fig. 8a, increases with increasing , suggesting a strengthening Kondo energy scale. For 0.7 there is also evidence that the -electron state is distinct from what is seen for : i.e., the cerium -valence evolves away from a purely trivalent state. This is revealed through: (1) a deviation from Vegard’s law and (2) in the XANES measurements of the end-member compounds, which show that CePd2P2 has a 3+ -electron valence, while CeNi2P2 shows an admixture of 3+ and 4+. A more detailed study of the region near is still needed to determine whether or not this change in the substitution series is abrupt or gradual.
An important feature of this substitution series is that the phase transition remains second order across the entire ferromagnetic -regime. This is likely because disorder influences the intermediate substitution region: e.g., as seen in the broadening of the phase transition in heat capacity and the growing residual resistivity that peaks near 0.6. This provides the conditions that are expected from the BKV theory for a disordered ferromagnetic quantum critical point near 0.7. At the same time, there is some evidence that the disorder leads to magnetic clustering behavior that might be consistent with a quantum Griffiths phase. Further work is needed to verify this scenario and its impact on the possible quantum critical behavior, such as measurements at lower temperatures to establish the powerlaw behavior. In future work, it will also be useful to compare to clean and lightly substituted CePd2P2 under applied pressure, where the evolution from first order to second order behavior can be systematically followed.
Finally, we make a comparison to some related materials. For instance, the prototypical antiferromagnetic quantum critical point alloy series CeCu2Si2-xGex, Knebel shows a qualitatively similar evolution of the low temperature phenomena. In particular, for follows a logarithmic in temperature divergence with a value near 0.9 J/mol K2 at low temperatures that is replaced by antiferromagnetic order with increasing unit cell volume. An important difference is that for this system the critical region is near 0 and the amount of disorder is small by comparison to what is seen in our series. Another closely related alloy series is CePd2As2-xPx, shang which features a transformation from ferromagnetic to antiferromagnetic order going from P As but does not have obvious features associated with quantum criticality or a quantum Griffiths phase. In this series, it appears that the nonisoelectronic chemical substitution mainly tunes the sign of the magnetic exchange. We finally point out that although the alloy series CeRh1-xPdx sereni07 crystallizes in a different structure, there are remarkable similarities to what we have observed for Ce(Pd1-xNix)2P2: including that the ferromagnetic order is suppressed towards zero temperature in the disordered -region. In the same area of the phase diagram there is evidence for a change of the cerium valence and the presence of a quantum Griffiths phase. It will be useful to study these systems together to assess the universality of model for ferromagnetic quantum criticality, including the BKV theory.
V Conclusions
These results reveal that Ce(Pd1-xNix)2P2 is a useful example of a cerium-based intermetallic with a disordered ferromagnetic QCP and accompanying breakdown of Fermi liquid behavior. We also find that for CePd2P2 a pressure of 12 GPa would likely be sufficient to access the tricritical point and first order quantum phase transition that is expected in the clean limit. It will be interesting to compare the electronic states that appear near and to test expectations from BKV theory. Further comparison to more conventional antiferromagnetic QCPs is also of interest, where an important question is whether unconventional superconductivity can occur near a disordered ferromagnetic QCP. belitz99 ; belitz05 ; belitz15 ; brando16 ; huang13 ; Nakatsuji08 ; Griffiths1969 ; vojta ; sereni07 ; Westerkamp09
VI Acknowledgements
A portion of this work was performed at the National High Magnetic Field Laboratory (NHMFL), which is supported by National Science Foundation Cooperative Agreement No. DMR-1157490 and DMR-1644779, and the State of Florida. Research of RB, YL, DG, KH, WP, WLN, SAK and TAS were supported in part by the Center for Actinide Science and Technology, an Energy Frontier Research Center funded by the U.S. Department of Energy (DOE), Office of Science, Basic Energy Sciences (BES), under Award Number DE-SC0016568. MC was supported by DOE-BES through Award No. DE-339SC0002613. Portions of this work were supported by the LANL named fellowship program; the Agnew National Security Fellowship (SEB) and the Glenn T. Seaborg Institutes Postdoctoral Fellowship program at LANL (MGF). Use of the Stanford Synchrotron Radiation Lightsource, SLAC National Accelerator Laboratory, was supported by the U.S. Department of Energy, Office of Science, Office of Basic Energy Sciences under Contract No. DE-AC02-76SF00515. The SSRL Structural Molecular Biology Program is supported by the DOE Office of Biological and Environmental Research, and by the National Institutes of Health, National Institute of General Medical Sciences (including P41GM103393). This work was also supported by the Joint Plasma Physics Program of the National Science Foundation and the Department of Energy under grant DE-SC0016251 (GTS). SM was supported by the Director, Office of Science, Office of Basic Energy Sciences, Division of Chemical Sciences, Geosciences, and Biosciences Heavy Element Chemistry Program of the U.S. Department of Energy (DOE) at LBNL under Contract No. DE-AC02-05CH11231. M5,4-edge spectra described in this paper was measured at the Canadian Light Source, which is supported by the Canada Foundation for Innovation, Natural Sciences and Engineering Research Council of Canada, the University of Saskatchewan, the Government of Saskatchewan, Western Economic Diversification Canada, the National Research Council Canada, and the Canadian Institutes of Health Research.
References
- (1) G. R. Stewart, Reviews of Modern Physics 73, 797-855 (2001).
- (2) H. v. Löhneysen, A. Rosch, M. Vojta, and P. Wölfle, Reviews of Modern Physics 79, 1015-1075 (2007).
- (3) P. Gegenwart, Q. Si, and F. Steglich, Nature Physics 4, 186-197 (2008).
- (4) C. Pfleiderer, Reviews of Modern Physics 81, 1551-1624 (2009).
- (5) M. Brando, D. Belitz, F. M. Grosche, T. R. Kirkpatrick, Reviews of Modern Physics 88, 025006 (2016).
- (6) S. Doniach, Physica B + C 91, 231-234 (1977).
- (7) J. Kondo, progress of Theoretical Physics 32, 37-49 (1964).
- (8) M. A. Ruderman, C. Kittel, Physical Review 96, 99-102 (1954).
- (9) T. Kasuya, progress of Theoretical Physics 16, 45-57 (1956).
- (10) K. Yosida, Physical Review 106, 893-898 (1957).
- (11) N. D. Mathur, F. M. Grosche, S. R. Julian, I. R. Walker, D. M. Freye, R. K. W. Haselwimmer, G. G. Lonzaric, Nature 394, 39–43 (1998).
- (12) J. D. Thompson, Z. Fisk, Journal of the Physical Society of Japan 81, 011002 (2012).
- (13) B. J. Ramshaw, S. E. Sebastian, R. D. McDonald, James Day, B. S. Tan, Z. Zhu, J. B. Betts, R. Liang, D. A. Bonn, W. N. Hardy, N. Harrison, Science 348, 317-320 (2015).
- (14) J. P. Paglione, R. L. Greene, Nature Physics 6, 645-658 (2010).
- (15) N. Doiron-Leyraud, P. Auban-Senzier, S. R. de Cotret, C. Bourbonnais, D. Jérome, K. Bechgaard, L. Taillefer, Physical Review B 80, 214531 (2009).
- (16) T. Gruner, D. Jang, Z. Huesges, R. Cardoso-Gil, G. H. Fecher, M. M. Koza, O. Stockert, A. P. Mackenzie, M. Brando, and C. Geibel, Nature Physics 13, 967-972 (2017).
- (17) E. C. Stoner, Proceedings of the Royal Society A 165, 372-414 (1938).
- (18) J. A. Hertz, Physical Review B 14, 1165-1184 (1976).
- (19) A. J. Millis, Physical Review B 48, 7183-7196 (1993).
- (20) T. R. Kirkpatrick and D. Belitz, Physical Review B 85, 134451 (2012).
- (21) D. Belitz, T. R. Kirkpatrick, and Thomas Vojta, Physical Review Letters 82, 4707 (1999).
- (22) D. Belitz,1 T. R. Kirkpatrick,2 and Jörg Rollbühler, Physical Review Letters 94, 247205 (2005).
- (23) T. R. Kirkpatrick1 and D. Belitz, Physical Review B 91, 214407 (2015).
- (24) K. Huang, J. J. Hamlin, R. E. Baumbach, M. Janoschek, N. Kanchanavatee, D. A. Zocco, F. Ronning, M. B. Maple, Physical Review B 87, 054513 (2013).
- (25) S. Nakatsuji, K. Kuga, Y. Machida, T. Tayama, T. Sakakibara, Y. Karaki, H. Ishimoto, S. Yonezawa, Y. Maeno, E. Pearson, G. G. Lonzarich, L. Balicas, H. Lee, Z. Fisk, Nature Physics 4, 603-607 (2008).
- (26) S. S. Saxena, P. Agarwal, K. Ahilan, F. M. Grosche, R. K. W. Haselwimmer, M. J. Steiner, E. Pugh, I. R. Walker, S. R. Julian, P. Monthoux, G. G. Lonzarich, A. Huxley, I. Sheikin, D. Braithwaite, J. Flouquet, Nature 406, 587-592 (2000).
- (27) N. T. Huy, A. Gasparini, D. E. de Nijs, Y. Huang, J. C. P. Klaasse, T. Gortenmulder, A. de Visser, A. Hamann, T. Görlach, H. v. Löhneysen, Physical Review Letters 99, 067006 (2007).
- (28) D. Aoki, A. Huxley, E. Ressouche, D. Braithwaite, J. Flouquet, J.-P. Brison, E. Lhotel, C. Paulsen, Nature 413, 613-616 (2001).
- (29) T. Akazawa, H. Hidaka, H. Kotegawa, T. C. Kobayashi, T. Fujiwara, E. Yamamoto, Y. Haga, R. Settai, Y. Ōnuki, Physica B: Condensed Matter 359-361, 1138-1140 (2005).
- (30) C. Krellner, S. Lausberg, A. Steppke, M. Brando, L. Pedrero, H. Pfau, S. Tencé, H. Rosner, F. Steglich and C. Geibel, New Journal of Physics 13, 103014 (2011).
- (31) V. H. Tran, Z. Bukowski, Journal of Physics: Condensed Matter 26, 255602 (2014).
- (32) Y. Ikeda, H. Yoshizawa, S. Konishi, S. Araki, T. C. Kobayashi, T. Yokoo, S. Ito, Journal of Physics: Conference Series 592, 012013 (2015).
- (33) W. Jeitschko and M. Reehuis, Journal of Physics and Chemistry of Solids 48, 667-673 (1987).
- (34) J. Chen, Z. Wang, Y. Li, C. Feng, J. Dai, G. Cao, Z.-A. Xu, Q. Si, arxiv:1704.02487(2017).
- (35) G. Drachuck, A. E. Böhmer, S. L.Bud’ko, P. C. Caneld, Journal of Magnetism and Magnetic Materials 417, 420-433 (2016).
- (36) Robert B. Griffiths, Physical Review Letters 23, 17 (1969).
- (37) T. Vojta, Journal of Low Temperature Physics 161, 299–323 (2010).
- (38) T. Westerkamp, M. Deppe, R. Küchler, M. Brando, C. Geibel, P. Gegenwart, A. P. Pikul, and F. Steglich, Physical Review Letters 102, 206404 (2009).
- (39) J. G. Sereni, T. Westerkamp, R. Küchler, N. Caroca-Canales, P. Gegenwart, and C. Geibel, Physical Review B 75, 024432 (2007).
- (40) G. N. George, EDG-FIT.
- (41) K. V. Kaznatcheev, C. Karunakaran, U. D. Lanke, S. G. Urquhart, M. Obst, A. P. Hitchcock, Nuclear Instruments and Methods in Physics Research 582, 96-99 (2007).
- (42) S. G. Minasian, E. R. Batista, C. H. Booth, D. L. Clark, J. M. Keith, S. A. Kozimor, W. W. Lukens, R. L. Martin, D. K. Shuh, S. C. E Stieber, T. Tylisczcak, X. D. Wen, Journal of the American Chemical Society 139 18052-18064 (2017).
- (43) A. B. Altman, C. D. Pemmaraju, S. Alayoglu, J. Arnold, E. D. Bauer, C. H. Booth, Z. Fisk, J. I. Pacold, D. Prendergast, D. K. Shuh, T. Tyliszczak, J. Wang, S. G. Minasian, Physical Review B 97 045110 (2018).
- (44) Macy Stavinoha, Joya A. Cooley, Stefan G. Minasian, Tyrel M. McQueen, Susan M. Kauzlarich, C.-L. Huang, E. Morosan, arXiv:1804.02076 (2018).
- (45) I. L. Spain, F. Steglich, U. Rauchschwalbe, H. D. Hochheimer, Physica B 449, 139-140 (1986).
- (46) A. Bianconi, A. Marcelli, H. Dexpert, R. Karnatak, A. Kotani, T. Jo, J. Petiau, Physical Review B 35, 806-812 (1987).
- (47) G. Kaindl, G. Schmiester, E. V. Sampathkumaran, P. Wachter, Physical Review B 38, 10174(R) (1988).
- (48) T. K. Sham, R. A. Gordon, S. M. Heald, Physical Review B 72, 035113 (2005).
- (49) M. D. Walter, C. H. Booth, W. W. Lukens, R. A. Andersen, Organometallics 28, 698-707 (2009).
- (50) M. W. Löble, J. M. Keith, A. B. Altman, S. C. E. Stieber, E. R. Batista, K. S. Boland, S. D. Conradson, D. L. Clark, J. Lezama Pacheco, S. A. Kozimor, R. L. Martin, S. G. Minasian, A. C. Olson, B. L. Scott, D. K. Shuh, T. Tyliszczak, M. P. Wilkerson, R. A. Zehnder, Journal of the American Chemical Society 137, 2506-2523 (2015).
- (51) J. A. Bogart, A. J. Lewis, M. A. Boreen, H. B. Lee, S. A. Medling, P. J. Carroll, C. H. Booth, E. J. Schelter, Inorganic Chemistry 54, 2830-2837 (2015).
- (52) S. K. Cary, M. G. Ferrier, R. E. Baumbach, M. A. Silver, J. Lezama Pacheco, S. A. Kozimor, H. S. La Pierre, B. W. Stein, A. A. Arico, D. L. Gray, T. E. Albrecht-Schmitt, Inorganic Chemistry 55, 4373-4380 (2016).
- (53) A. N. Kravtsova, A. A. Guda, J. Goettlicher, A. V. Soldatov, V. K. Taroev, A. A. Kashaev, L. F. Suvorova, V. L.. Tauson, Journal of Physics: Conference Series 712, 012096 (2016).
- (54) M. R. Antonio, R. J. Ellis, S. L. Estes, M. K. Bera, Physical Chemistry Chemical Physics 19, 21304-21316 (2017).
- (55) L. M. Toscani, A. F. Craievich, M. C.A. Fantini, D. G. Lamas, S. A. Larrondo, The Journal of Physical Chemistry C 120, 24165-24175 (2016)
- (56) H. Dexpert, R. C. Karnatak, J. M. Esteva, J. P. Connerade, M. Gasgnier, P. E. Caro and L. Albert, Physical Review B 36, 1750-1753 (1987).
- (57) A. Kotani, K. O. Kvashnina, S. M. Butorin and P. Glatzel, Journal of Electron Spectroscopy and Related Phenomena 184, 210-215 (2011).
- (58) A. Kotani, K. O. Kvashnina, S. M. Butorin and P. Glatzel, The European Physical Journal B 85, 257 (2012).
- (59) Z. Hu, G. Kaindl, H. Ogasawara, A. Kotani and I. Felner, Chemical Physics Letters 325, 241-250 (2000).
- (60) G. Kaindl, G. Kalkowski, W. D. Brewer, B. Perscheid and F. Holtzberg, Journal of applied Physics 55, 1910-1915 (1984).
- (61) B. T. Thole, G. Vanderlaan, J. C. Fuggle, G. A. Sawatzky, R. C. Karnatak and J. M. Esteva, Physical Review B 32, 5107-5118 (1985).
- (62) A. Kotani and H. Ogasawara, Journal of Electron Spectroscopy and Related Phenomena 60, 257-299 (1992).
- (63) T. A. Pham, A. B. Altman, S. C. E. Stieber, C. H. Booth, S. A. Kozimor, W. W. Lukens, D. T. Olive, T. Tyliszczak, J. Wang, S. G. Minasian and K. N. Raymond, Inorganic Chemistry 55, 9989-10002 (2016).
- (64) Z. W. Hu, G. Kaindl and B. G. Muller, Journal of Alloys and Compounds 246, 177-185 (1997).
- (65) F. Grandjean, G. D. Waddill, T. R. Cummins, D. P. Moore, G. J. Long and K. H. J. Buschow, Solid State Communications 108, 593-597 (1998).
- (66) C. L. Dong, K. Asokan, C. L. Chen, C. L. Chang, W. F. Pong, N. H. Kumar and S. K. Malik, Physica B: Condensed Matter 325, 235-239 (2003).
- (67) A. Kotani, Modern Physics Letters B 27, 1330012 (2013).
- (68) H. R. Krishna-murthy, K. G. Wilson, and J. W. Wilkins, Physical Review Letters 35, 110 (1975).
- (69) G. Knebel, C. Eggert, D. Engelmann, R. Viana, A. Krimmel, M. Dressel, and A. Loidl, Physical Review B 53, 11586 (1996).
- (70) T. Shang, Y. H. Chen, W.B. Jiang, Y. Chen, L. Jiao, J.L. Zhang, Z.F. Weng, X. Lu, H.Q. Yuan, Journal of Physics: Condensed Matter 26, 045601 (2014).