How nonuniform contact profiles of T cell receptors modulate thymic selection outcomes
Abstract
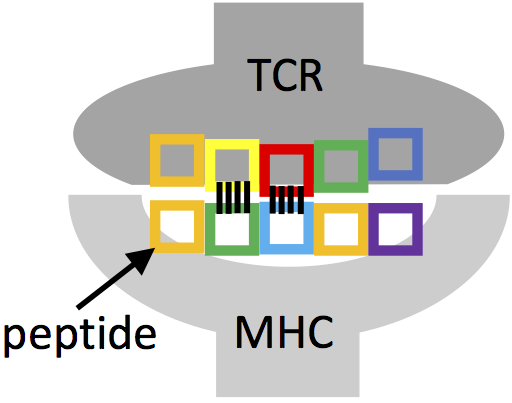
T cell receptors (TCRs) bind foreign or self-peptides attached to major histocompatibility complex (MHC) molecules, and the strength of this interaction determines T cell activation. Optimizing the ability of T cells to recognize a diversity of foreign peptides yet be tolerant of self-peptides is crucial for the adaptive immune system to properly function. This is achieved by selection of T cells in the thymus, where immature T cells expressing unique, stochastically generated TCRs interact with a large number of self-peptide-MHC; if a TCR does not bind strongly enough to any self-peptide-MHC, or too strongly with at least one self-peptide-MHC, the T cell dies. Past theoretical work cast thymic selection as an extreme value problem, and characterized the statistical enrichment or depletion of amino acids in the post-selection TCR repertoire, showing how T cells are selected to be able to specifically recognize peptides derived from diverse pathogens, yet have limited self-reactivity. Here, we investigate how the degree of enrichment is modified by nonuniform contacts that a TCR makes with peptide-MHC. Specifically, we were motivated by recent experiments showing that amino acids at certain positions of a TCR sequence have large effects on thymic selection outcomes, and crystal structure data that reveal a nonuniform contact profile between a TCR and its peptide-MHC ligand. Using a representative TCR contact profile as an illustration, we show via simulations that the degree of enrichment now varies by position according to the contact profile, and, importantly, it depends on the implementation of nonuniform contacts during thymic selection. We explain these nontrivial results analytically. Our study has implications for understanding the selection forces that shape the functionality of the post-selection TCR repertoire.
I Introduction
T cell receptors (TCRs) bind peptides loaded onto major histocompatibility complex (MHC) molecules (abbreviated as peptide-MHC) on the surface of antigen presenting cells (APCs), and the strength of this interaction determines T cell activation Alam et al. (1996); Krogsgaard and Davis (2005). Such peptides are derived from either the host itself (self-antigens), or, potentially, pathogens infecting the host (foreign antigens); thus, optimizing the ability of T cells to recognize diverse foreign antigens with high specificity, yet be self-tolerant, is essential for the proper functioning of the adaptive immune system. Immature T cells (or thymocytes) express a distinct TCR on their surface assembled through a stochastic process of gene rearrangement, generating a highly diverse repertoire Murugan et al. (2012) that is acted upon by selection in the thymus. There, thymocytes are screened against a large number of self-peptide-MHC; those that do not productively bind to self-peptide-MHC die (this is called positive selection), and those that bind too strongly are also eliminated (this is called negative selection). T cells that survive thymic selection are exported to the body’s periphery where they participate in the adaptive immune response. In this way, thymic selection shapes the post-selection TCR repertoire to potentially recognize diverse foreign antigens, yet limit self-reactivity Huseby et al. (2005). While detailed statistics of the post-selection repertoire are now available Elhanati et al. (2014); Sethna et al. (2017); Stadinski et al. (2016), how thymic selection achieves this outcome is less well-understood.
 |
 |
 |
 |
Mathematical models have shed light on various aspects of thymic selection (for a review, see Ref. Yates (2014)); in particular, models that represented TCR–peptide-MHC interactions as pairwise interactions between digit strings Detours et al. (1999); Detours and Perelson (1999) were useful for studying how TCR cross-reactivity can result. In Refs. Košmrlj et al. (2008, 2009), some of the authors considered a more explicit representation of inter-amino acid interaction strengths Miyazawa and Jernigan (1996), and characterized the statistical enrichment or depletion of amino acids in the post-selection TCR repertoire, computationally Košmrlj et al. (2008) and analytically Košmrlj et al. (2009), as a function of parameters such as the number of self-peptide-MHC encountered during selection. These studies provided insight into how T cells are selected to be specific for unknown foreign peptides and yet are self-tolerant.
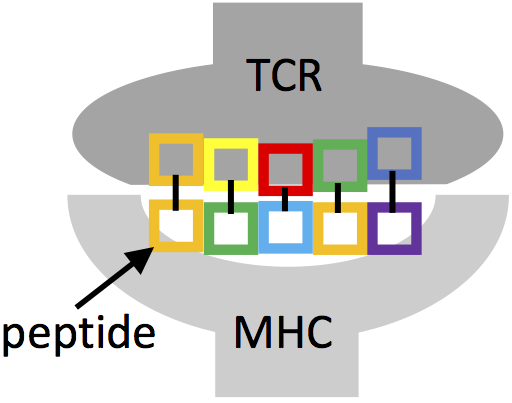
In the past few years, more detailed information about thymic selection outcomes have emerged. Advances in high-throughput sequencing have allowed researchers to quantify the statistics of post-selection TCR sequences in detail, revealing positional differences in the enrichment of amino acids Elhanati et al. (2014); Sethna et al. (2017). Furthermore, recent experiments found that pre-selection thymocytes that were activated by self-peptide-MHC (and hence would fail negative selection) were enriched in hydrophobic amino acids at positions 6 and 7 of the TCR-chain complementarity-determining region (CDR3), while thymocytes passing both positive and negative selection were enriched in amino acids with moderate hydrophobicity at these positions Stadinski et al. (2016). These results agree with theoretical predictions made in previous work Košmrlj et al. (2008, 2009), but additionally find varying levels of enrichment at different CDR3 positions. Furthermore, a large number of crystal structures of TCR–peptide-MHC complexes have been analyzed, that reveal a nonuniform contact interface between a TCR and peptide-MHC (quantified, for example, by atom-atom contact profiles — see Fig. 1), and show that positions 6 and 7 of the CDR3 sequence make the strongest contacts on average. Taken together, these findings show that certain TCR positions are more important than others for influencing thymic selection outcomes, and that this information can be captured by nonuniform contact profiles such as those in Fig. 1.
While Refs. Košmrlj et al. (2008, 2009) modeled thymic selection outcomes depending on properties of inter-amino acid interactions, they did not account for nonuniform contacts that a TCR makes with peptide-MHC. In this paper, we develop a formalism to do so, and investigate how this affects thymic selection outcomes. In particular, we consider two possible mechanisms by which nonuniform contacts are mediated during thymic selection, one of which we term deterministic, and the other stochastic. We perform numerical simulations and analytical computations to characterize the degree of enrichment of amino acids in the post-selection TCR repertoire, and show that positions making stronger contacts end up with greater degrees of enrichment. While this may appear an expected outcome, the degree of enrichment depends nontrivially on the entire contact profile, as well as the positive and negative selection thresholds. In addition, we find that the interpretation of nonuniform contacts remarkably affects the degree, and even sign, of enrichment. Our study suggests a mechanistic origin for positional differences in post-selection TCR amino acid enrichment that has been observed in statistical analyses Elhanati et al. (2014); Sethna et al. (2017) and experiments Stadinski et al. (2016), and has implications for understanding how the functionality of the post-selection repertoire emerges.
The paper is organized as follows: in Section II, we develop a mathematical model of thymic selection that incorporates nonuniform contact profiles. In Section III, we consider two possible interpretations of nonuniform contacts, and study their effects on thymic selection outcomes. The stark differences between levels of enrichment from the two interpretations are explained analytically. In Section IV, we discuss further work and conclude.
II Model description
Immature T cells (or thymocytes) undergo positive and negative selection in the thymus before maturation. Each thymocyte expresses a distinct TCR on its surface, generated stochastically through V(D)J gene recombination and insertions and deletions of nucleotides (whose probabilities have been inferred from high-throughput sequencing data Murugan et al. (2012)), creating a diverse pre-selection repertoire. In the thymic cortex, thymocytes are presented with self-peptide-MHC by thymic antigen presenting cells (APCs). Thymocytes that do not bind strongly enough to any self-peptide-MHC die of insufficient survival signals; this is called positive selection. Thymocytes that survive positive selection migrate to the thymic medulla, where they are further screened against self-peptide-MHC, and those that bind too strongly with at least one self-peptide-MHC receive apoptotic signals and are eliminated; this is called negative selection.
We cast this process in a mathematical model as follows: following Ref. Košmrlj et al. (2008), TCR sequences, , of length are generated by sampling amino acids , , independently from a distribution , that is taken to be the amino acid distribution of the human proteome B. L. Aken et al. (2017). While this is highly simplified compared to how the actual pre-selection repertoire is generated Murugan et al. (2012), it does not affect our later results, which concern the action of thymic selection on this distribution. Unlike Ref. Košmrlj et al. (2008), here a TCR has the capacity to make nonuniform contacts, which we capture by specifying . We describe values and interpretations of in the next section.
During thymic selection, a TCR interacts with independent self-peptide sequences, , of length bound to MHC, that are also randomly generated according to . Because these are mostly linear peptides, they do not have an associated . Following Ref. Košmrlj et al. (2008), we model the binding strength between a TCR and self-peptide as pairwise interactions between TCR amino acid and self-peptide amino acid , for (see Fig. 2a). Thus, the overall binding energy, , is
| (1) |
where captures interactions between TCR and MHC, is an interaction potential that in principle captures biochemical and other properties of inter-amino acid interactions, and ) accounts for nonuniform contact at position . Following Ref. Košmrlj et al. (2008), we use the Miyazawa–Jernigan (MJ) matrix for Miyazawa and Jernigan (1996), whose structure largely arises from hydrophobic forces Stadinski et al. (2016); Li et al. (1997); hydrophobic amino acids are strongly interacting (more negative values), while hydrophilic amino acids are weakly interacting (less negative values). (Note that the results that follow do not qualitatively depend on the potential, but Ref. Stadinski et al. (2016) noted the importance of hydrophobicity for the strength of TCR–peptide-MHC interactions, implying that using the MJ matrix is reasonable.) Reference Košmrlj et al. (2008) implicitly assumed that all . Henceforth, we will specialize to one MHC type (i.e. a constant) because its diversity is much lower than that of self-peptides (a human for example expresses 6 different MHC class I molecules), and we are not going to focus on how TCR cross-reactivity to other MHC molecules can arise Detours et al. (1999); Detours and Perelson (1999).
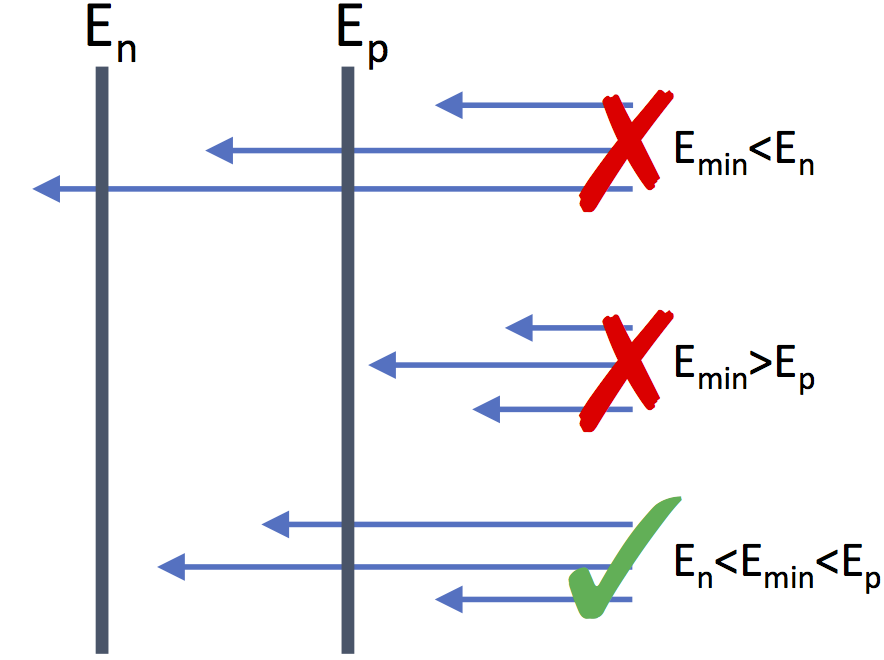
Positive and negative selection are carried out as follows: if the strongest (minimum) interaction energy between a TCR and independent self-peptide-MHC is weaker (greater) than a positive selection threshold , or if it is stronger (less) than a negative selection threshold , the thymocyte dies. These hard constraints are consistent with experiments that found relatively small differences in TCR–ligand affinity at the negative selection threshold Daniels et al. (2006) (although they found that the positive selection threshold is softer). Thymocytes that interact with self-peptide-MHC with strongest (minimum) binding energy within survive thymic selection and mature into naïve T cells (see Fig. 2b).
Parameter values:
The CDR3 loops of a TCR typically make the greatest contacts with peptide (as opposed to MHC) Garcia and Adams (2005). Here, the TCR amino acid string represents the CDR3 sequence, which is typically of length 10–18 Sethna et al. (2017). During thymic selection, a thymocyte typically interacts with self-peptide-MHC. Realistic values of the difference between positive and negative selection thresholds, and the T cell activation free energy with self-peptide alone (without MHC), are given by and , respectively Košmrlj et al. (2008, 2009).
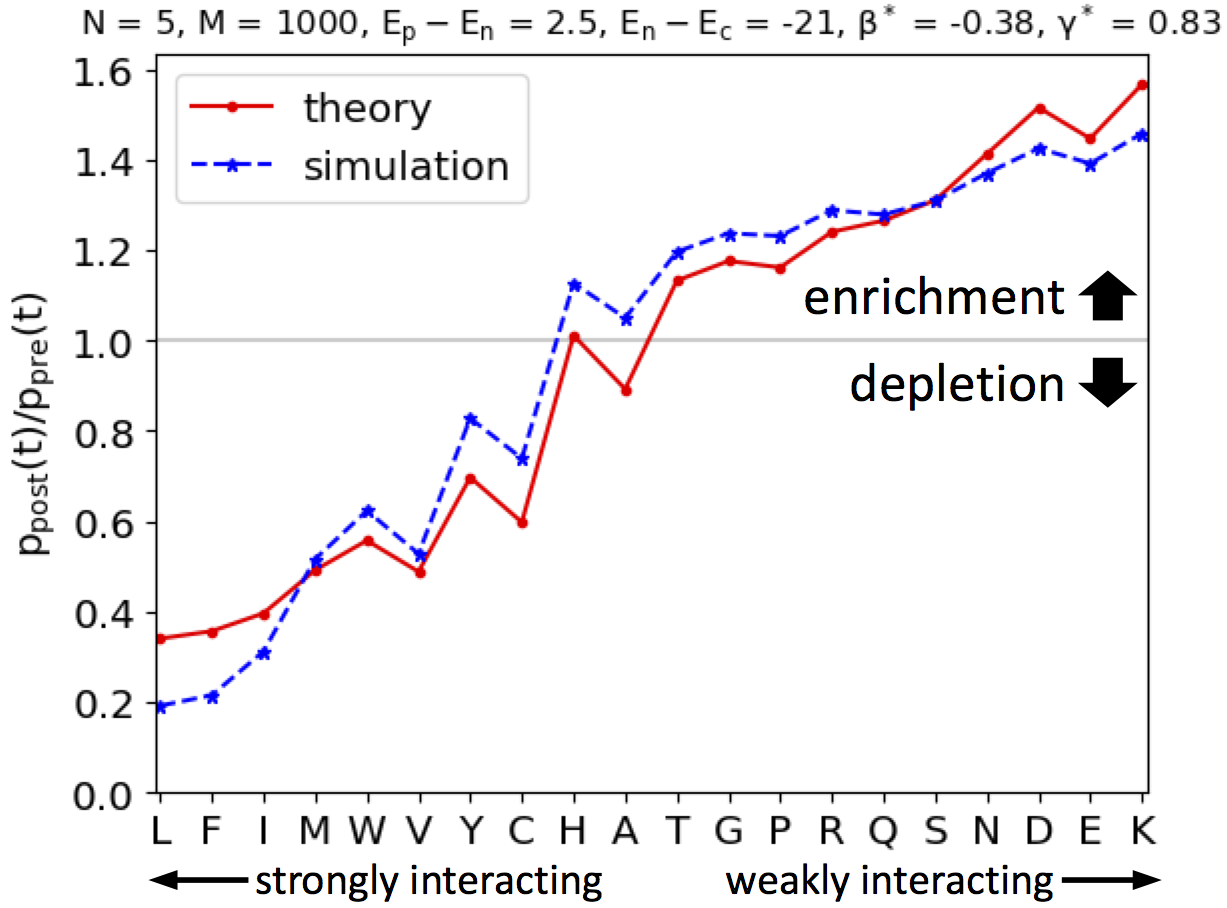
Model without nonuniform contacts:
References Košmrlj et al. (2008, 2009) considered a model with all , , , and and given above. Numerical simulations of this model resulted in a distribution of TCR sequences surviving selection that was statistically different from the pre-selection one, in that the former was enriched in weakly interacting amino acids and depleted in strongly interacting ones (see Fig. 2c). This result was consistent with later experiments Stadinski et al. (2016).
II.1 Theory of the post-selection TCR repertoire distribution
Reference Košmrlj et al. (2009) developed an analytical theory for the post-selection TCR repertoire distribution, valid in the limit of . Here, we extend this theory to include nonuniform contact profiles. A self-contained derivation is in the Appendix; we state below the essential results.
A TCR with sequence and contact profile experiences a distribution of binding energies during thymic selection, with mean
| (2) |
and variance
| (3) |
where there are no cross-correlation terms in Eq. (3) because sites are independent. In Ref. Košmrlj et al. (2009) (where all ), and are given by
| (4) |
and
| (5) |
where and are the first and second moments of interaction strength experienced by amino acid when interacting with self-peptide sequences, i.e.
| (6) |
In this paper, the forms of and depend on the interpretation of and will be specified in the next section.
For large and , the minimum binding energy experienced by a TCR during selection tends to the Gumbel distribution (see Appendix), whose peak is at
| (7) |
where , and whose variance is . In the limit of (keeping ), this distribution concentrates around its peak, which lies somewhere between and . In this limit, the post-selection TCR repertoire distribution becomes (see Appendix)
| (8) |
where ensures normalization,
| (9) |
and
| (10) |
The value of in Eq. (8) is chosen such that (from Eq. (7)) lies within . depends on explicitly, and on the full contact profile implicitly through . Also in this limit, becomes
| (11) |
In practice, for each value of , one iterates between Eqs. (9) and (10) until a self-consistent value of is obtained. Values of corresponding to and are found, and the one closer to zero is taken to be (or if they straddle 0). Intuitively, parametrizes the degree to which weakly or strongly interacting amino acids are enriched in the post-selection TCR repertoire; positive implies selecting for strongly interacting amino acids, and negative implies selecting for weakly interacting ones.
III Interpretations of nonuniform TCR contact profiles
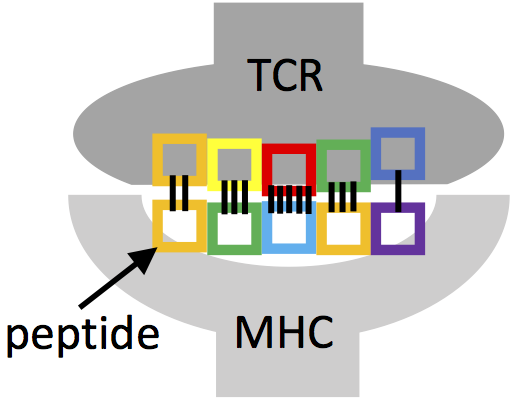
How is the picture of Fig. 2c modified when nonuniform contact profiles are taken into account? We were initially inspired by crystal structures of TCR–peptide-MHC complexes, that show a variation in the number of contacts made between TCR and peptide-MHC along the TCR sequence for every structure examined (see Fig. 1); this contact profile need not even have a single maximum. However, when many contact profiles were added together, it appeared that positions 6 and 7 of the CDR3 sequence made the greatest contacts with peptide-MHC on average (see Fig. 4a), which is consistent with experimental findings Stadinski et al. (2016) and suggests that nonuniform contact profiles are useful in capturing positional differences that influence thymic selection outcomes. Figure 4a was obtained by rescaling the total number of contacts measured from 53 TCR–peptide-MHC structures such that the maximum is 1. We will make use of this representative, “average” contact profile as in the following.
III.1 Deterministic screening interpretation
Motivated by crystal structure analyses, we first considered a model where every interaction between TCR amino acid and self-peptide amino acid was weakened by a factor , . This is represented by setting in Eq. (1). In principle, there is no reason to exclude values of (depending on how interactions are modified by structure), but here we only considered reduced interactions, for example due to screening by intervening water molecules.
We performed numerical simulations of our model using the deterministic interpretation of the contact profile of Fig. 4a, with TCRs of length and keeping the other parameter values the same as in Ref. Košmrlj et al. (2009) and Fig. 2c (i.e. , , and ). Statistics of TCR amino acids in the post-selection repertoire are shown in Figs. 4b–c (dotted lines). Enrichment curves for each site are plotted in a different color. Now, the degree of enrichment depends on position; sites corresponding to the largest (sites 6 and 7) experience the greatest degree of enrichment, while sites making no contact (sites 1–3, 14 and 15) have enrichment values close to 1. Furthermore, sites making contacts are now enriched in strongly interacting amino acids, which is opposite of Fig. 2c!
To understand this result, we repeated the previous theoretical analysis. The mean and variance of interaction energies for amino acid at position are now modified to
| (12) |
and
| (13) |
by replacing in Eqs. (4) and (5). Using these expressions in Eqs. (9)–(11), we found , which indeed implies enrichment of strongly interacting amino acids. Plots of Eq. (8) for each position (solid lines in Figs. 4b–c) also resemble enrichment curves obtained from simulations.
Upon reflection, this change is not surprising. The contact profile of Fig. 4a has an “effective length” of , implying that the mean binding energy experienced by a TCR during selection is roughly of that experienced in the model with and without nonuniform contacts which produced Fig. 2c (and indeed, we find for and without nonuniform contacts). Thus, it is plausible that here, TCR sequences need to be enriched in more strongly interacting amino acids in order to have their strongest binding energy during selection fall between and . Indeed, the analytical theory makes this intuition concrete.
Note that the analytical curves systematically under-predict the degree of enrichment, i.e. the value of obtained from theory was slightly too small. For finite , the extreme value distribution in fact has a finite width, and so one might underestimate by matching to . Indeed, when we include the next-order correction to , which is positive (see after Eq. (17) in the Appendix), the analytical curves match those from simulations much better (not shown).
However, these results contradict the experiments of Ref. Stadinski et al. (2016), as TCRs with strongly interacting amino acids at sites 6 and 7 should fail negative selection. This implies that some of our assumptions, for example that the interaction potential diminishes proportionally with the contact profile (i.e. ), are incorrect.


III.2 Stochastic binding interpretation
In fact, crystal structures are merely static pictures of TCR–peptide-MHC binding, whereas the events leading to T cell activation following encounters with peptide-MHC are much more dynamic Garcia and Adams (2005). Indeed, it is known that the CDR3 loop of TCRs is relatively flexible, with a range of conformations that can bind different ligands Baker et al. (2012). There also exist crystal structures of the same TCR bound to different peptide-MHC that show different parts of the TCR binding the different ligands Colf et al. (2007).
These facts motivate another interpretation of nonuniform contact profiles: for every encounter during thymic selection, TCR amino acid binds to self-peptide amino acid with probability , . This is represented by setting , where is a Bernoulli random variable with parameter . This stochastic binding interpretation gives the same average interaction energy as the deterministic one:
| (14) |
while its variance is instead
| (15) |
which has one factor of multiplying (as opposed to two in Eq. (13)).
We performed numerical simulations of this model, and obtained a post-selection repertoire shown in Figs. 4d–e (dotted lines). Again, the degree of enrichment is greater for sites making greater contacts. However, unlike the deterministic interpretation, here sites making contacts are enriched in weakly interacting amino acids. Using Eqs. (14) and (15), the analytical computations of Eqs. (9)–(11) also give . Thus, the argument that we made before was incomplete; even though the “effective length” here is approximately 3.2 as well because the mean interaction energies are equal (Eqs. (12) vs. (14)), their variances are different, and it is the variance that nontrivially modifies thymic selection outcomes! Because of the larger variance in this case, it is plausible that weakly interacting amino acids are sufficient for having the strongest of binding energies reach below . Again, the analytical theory makes this intuition concrete.
Another way to think of this is in terms of extreme values in lengths. During each interaction, a subset of positions of a TCR interact with self-peptide amino acids. In the negative selection-dominated regime, TCRs are more likely to be eliminated because of one interaction that is too strong, rather than all interactions being too weak. Using the analytical theory for and without nonuniform contacts gives , implying that no TCR that makes 7 or more contacts during selection should survive. Also, the analytical theory for and without nonuniform contacts gives , implying that TCRs making 6 contacts during selection have a high probability of failing negative selection too. Thus, the majority of TCRs that survive selection will have made their strongest interaction with 5 contacts, and indeed, the enrichment curves for sites 6–9 resemble that of Fig. 2c.
The predicted curves from Eq. (8) (solid lines in Figs. 4d–e) agree well with numerical results. Note that the theory predicts that site 7 is less enriched than site 6, even through (compare black and red solid curves in Fig. 4d)! That the degree of enrichment is not monotonically related to can be seen by differentiating w.r.t. , which reveals that according to this theory, there is an optimum that gives the greatest enrichment, which is different for each amino acid (because this depends on and ). (Repeating this calculation for the deterministic model however gives an optimal that is negative, implying that there is monotonicity for that case.) Numerical simulations however do not show this non-monotonicity, and so we believe this is a manifestation of finite and .
To summarize, we have shown how two possible interpretations of nonuniform TCR contacts modify thymic selection outcomes in different ways. We have also explained our results using an analytical theory valid in the limit of large and .
IV Discussion
In this paper, we presented a formalism to incorporate information about TCR structure, through its nonuniform contact profile, into a model of thymic selection. We showed how this leaves statistical signatures at different positions of post-selection TCR sequences. Importantly, we showed how these signatures depend on implementation of nonuniform contacts, as a deterministic screening of interactions, or as probabilities of stochastic binding events. In the actual thymus, these and other scenarios probably play a role, and it would be interesting to quantify their relative roles.
While we have added a further degree of realism to modeling TCR–peptide-MHC interactions, many features have been left out, such as:
-
•
We did not account for nonuniform contacts with MHC. This is important because a TCR binding more strongly with MHC might require weaker interactions with peptide in order to be activated; this has been studied previously to explain TCR cross-reactivity with foreign MHC molecules Detours et al. (1999); Detours and Perelson (1999). Mathematically, this may be included into the model by modulating by .
-
•
Stochastic binding events may be correlated between neighboring TCR positions. Mathematically, this introduces cross-correlation terms into the variance of interaction energies (Eq. (15)), and makes the Legendre transform and self-averaging within the theory more complicated (see Appendix).
-
•
The pre-selection TCR distribution resulting from V(D)J recombination is not factorizable into , which also introduces correlations into .
-
•
The same TCR amino acid may contact more than one peptide-MHC amino acid, and the same peptide-MHC amino acid may contact more than one TCR amino acid.
Nonuniform contact profiles are a step towards modeling the complicated, structure-dependent nature of TCR–peptide-MHC interactions. However, a more informed method should be developed to infer such a profile from crystal structures. For example, we made use of measurements of the number of peptide-MHC atoms a distance of 4Å away from TCR amino acids, but characteristic distances should depend on the kind of interaction (hydrogen bonding, van der Waals, etc.).
We limited computations in this paper to one contact profile to illustrate its effect on thymic selection outcomes. Separately, it would be interesting to characterize the statistics of contact profiles from crystal structures. This task however is limited by the relatively small number of crystal structures known, as opposed to the large quantities of high-throughput sequencing data available. We note that an additional step needs to be taken to connect the model in this paper to statistics of aligned TCR sequences that appear in, e.g., Refs. Elhanati et al. (2014); Sethna et al. (2017) (which do not focus on peptide contact residues but rather the entire aligned CDR3 region, and hence do not find enrichment at TCR positions corresponding to recent experiments Stadinski et al. (2016)): the model should be run separately for different contact profiles, and the enrichment curves should be averaged together according to the passing rates for the different contact profiles. Note that this is a possible mechanism for obtaining enrichment of an amino acid at one position in a sequence alignment, and depletion of the same amino acid at another, because these positions might feature in different contact profiles that have different . This also implies that the results from an average contact profile are, in general, different from running the model for separate contact profiles and averaging the results together, because the former does not account for different passing rates. Thus, it would be interesting to attempt the inverse problem of inferring differential contacts and binding tendencies at different positions of a TCR sequence from positional differences in the post-selection TCR repertoire, but this is complicated by the under-determinacy of the problem.
Inferring overall patterns determining a TCR’s specificity to peptide-MHC from knowledge of TCR–peptide-MHC crystal structures is challenging because there is no one canonical way by which a TCR interacts with peptide-MHC Garcia and Adams (2005); Ysern et al. (1998); Housset and Malissen (2003); the same TCR may bind different peptide-MHC in very different ways Colf et al. (2007). Predicting TCR sequences that recognize a given set of peptide-MHC by inferring “sequence motifs” of TCRs has been achieved very recently Dash et al. (2017); Glanville et al. (2017). We believe that analyzing thymic selection outcomes has implications for antigenic specificity, because surviving thymic selection involves interactions with a large number of self-peptide-MHC, and thus features relevant for thymic selection outcomes are also relevant for antigenic specificity. The features we have studied here have measurable effects on the post-selection repertoire, and thus they probably contribute to antigenic specificity as well, which perhaps gives a mechanistic basis for the sequence motifs discovered in the recent studies Dash et al. (2017); Glanville et al. (2017).
Recently, a paper that also modified the thymic selection model of Refs. Košmrlj et al. (2008, 2009) to include positional differences in TCR–peptide-MHC interactions appeared George et al. (2017). In essence, for a given TCR, they drew the values of in Eq. (1), , independently from a Gaussian distribution. Thus, they reduced thymic selection to an extreme value problem with a random energy model, in which “TCRs” and “amino acids” lose their meaning; this contradicts studies that find predictive features determining specificity that are based on TCR amino acid sequences Stadinski et al. (2016); Dash et al. (2017); Glanville et al. (2017). However, their model is simpler to analyze and may be a useful null model, and it would be interesting to compare it with the results from averaging many different contact profiles together. The authors also commented that the model of Refs. Košmrlj et al. (2008, 2009) fell short in that very few self-peptides (i.e. the most strongly interacting ones) perform the job of negative selection equally effectively as the full panel of self-peptides. While this is true (which follows directly from specifying an inter-amino acid interaction potential), it is not known how large this fraction is for the real thymic selection process. Experimentally, this could be tested by engineering the thymus to contain peptides consisting of only strongly interacting amino acids Huseby et al. (2005). Also, it is possible that these peptides are somehow found rarely or not at all in the thymus, because self-peptides are chopped-up versions of actual proteins. Large values of are likely still required to randomly generate such special peptides. We note that the model we study here moves away from the limitations they raised, as different TCRs with different contact profiles need not bind equally strongly with the same, strongly interacting peptide.
Acknowledgements.
This work was supported by the Ragon Institute of MGH, MIT and Harvard and an A*STAR Scholarship (to H.C.). M.K. acknowledges support from NSF through grant number DMR-1708280.References
- Alam et al. (1996) S. M. Alam, P. J. Travers, J. L. Wung, W. Nasholds, S. Redpath, S. C. Jameson, and N. R. J. Gascoigne, Nature 381, 616 (1996).
- Krogsgaard and Davis (2005) M. Krogsgaard and M. M. Davis, Nat. Immunol. 6, 239 (2005).
- Murugan et al. (2012) A. Murugan, T. Mora, A. M. Walczak, and C. G. Callan, Jr., Proc. Natl. Acad. Sci. U.S.A. 109, 16161 (2012).
- Huseby et al. (2005) E. S. Huseby, J. White, F. Crawford, T. Vass, D. Becker, C. Pinilla, P. Marrack, and J. W. Kappler, Cell 122, 247 (2005).
- Elhanati et al. (2014) Y. Elhanati, A. Murugan, C. G. Callan, Jr., T. Mora, and A. M. Walczak, Proc. Natl. Acad. Sci. U.S.A. 111, 9875 (2014).
- Sethna et al. (2017) Z. Sethna, Y. Elhanati, C. R. Dudgeon, C. G. Callan, Jr., A. J. Levine, T. Mora, and A. M. Walczak, Proc. Natl. Acad. Sci. U.S.A. 114, 2253 (2017).
- Stadinski et al. (2016) B. D. Stadinski, K. Shekhar, I. Gómez-Touriño, J. Jung, K. Sasaki, A. K. Sewell, M. Peakman, A. K. Chakraborty, and E. S. Huseby, Nat. Immunol. 17, 946 (2016).
- Yates (2014) A. J. Yates, Front. Immunol. 5, 13 (2014).
- Detours et al. (1999) V. Detours, R. Mehr, and A. S. Perelson, J. Theor. Biol. 200, 389 (1999).
- Detours and Perelson (1999) V. Detours and A. S. Perelson, Proc. Natl. Acad. Sci. U.S.A. 96, 5153 (1999).
- Košmrlj et al. (2008) A. Košmrlj, A. K. Jha, E. S. Huseby, M. Kardar, and A. K. Chakraborty, Proc. Natl. Acad. Sci. U.S.A. 105, 16671 (2008).
- Košmrlj et al. (2009) A. Košmrlj, A. K. Chakraborty, M. Kardar, and E. I. Shakhnovich, Phys. Rev. Lett. 103, 068103 (2009).
- Miyazawa and Jernigan (1996) S. Miyazawa and R. L. Jernigan, J. Mol. Biol. 256, 623 (1996).
- B. L. Aken et al. (2017) B. L. Aken et al., Nucleic Acids Res. 45, D635 (2017).
- Li et al. (1997) H. Li, C. Tang, and N. S. Wingreen, Phys. Rev. Lett. 79, 765 (1997).
- Daniels et al. (2006) M. A. Daniels, E. Teixeiro, J. Gill, B. Hausmann, D. Roubaty, K. Holmberg, G. Werlen, G. A. Holländer, N. R. J. Gascoigne, and E. Palmer, Nature 444, 724 (2006).
- Garcia and Adams (2005) K. C. Garcia and E. J. Adams, Cell 122, 333 (2005).
- Baker et al. (2012) B. M. Baker, D. R. Scott, S. J. Blevins, and W. F. Hawse, Immunol. Rev. 250, 10 (2012).
- Colf et al. (2007) L. A. Colf, A. J. Bankovich, N. A. Hanick, N. A. Bowerman, L. L. Jones, D. M. Kranz, and K. C. Garcia, Cell 129, 135 (2007).
- Ysern et al. (1998) X. Ysern, H. Li, and R. A. Mariuzza, Nat. Struct. Biol. 5, 412 (1998).
- Housset and Malissen (2003) D. Housset and B. Malissen, Trends Immunol. 24, 429 (2003).
- Dash et al. (2017) P. Dash, A. J. Fiore-Gartland, T. Hertz, G. C. Wang, S. Sharma, A. Souquette, J. C. Crawford, E. B. Clemens, T. H. O. Nguyen, K. Kedzierska, N. L. La Gruta, P. Bradley, and P. G. Thomas, Nature 547, 89 (2017).
- Glanville et al. (2017) J. Glanville, H. Huang, A. Nau, O. Hatton, L. E. Wagar, F. Rubelt, X. Ji, A. Han, S. M. Krams, C. Pettus, N. Haas, C. S. Lindestam Arlehamn, A. Sette, S. D. Boyd, T. J. Scriba, O. M. Martinez, and M. M. Davis, Nature 547, 94 (2017).
- George et al. (2017) J. T. George, D. A. Kessler, and H. Levine, Proc. Natl. Acad. Sci. U.S.A. 114, E7875 (2017).
- Kardar (1983) M. Kardar, Phys. Rev. Lett. 51, 523 (1983).
*
Appendix A Derivation of the post-selection TCR repertoire distribution for large ,
Here, we provide a self-contained derivation of a theory for the post-selection TCR repertoire distribution, extending Ref. Košmrlj et al. (2009) to capture a nonuniform contact profile. The probability that a TCR with sequence and contact profile survives selection, , is equal to the probability that the minimum of binding energies it encountered lies within . Now, the binding energy between a TCR and self-peptide sequence bound to MHC will be Gaussian distributed for large , by the Central Limit Theorem (because Eq. (1) contains a sum of independent, but not identically distributed, ), with mean and variance given by Eqs. (2) and (3), respectively. And if is Gaussian distributed, then the limiting distribution of as will be the Gumbel distribution, which has cumulative distribution function
| (16) |
where
| (17) |
with (depending only on ), and
| (18) |
The peak of this distribution is , and its variance is . In the main text of this paper, we used the leading-order value of , (see after Eq. (7)).
Using Bayes’ rule, the posterior distribution of TCR sequences surviving selection, , is given by
| (19) |
While this is exact within the Gaussian approximation, it is not immediately obvious how to make progress quantifying the enrichment of post-selection TCR amino acids by direct marginalization, i.e. .
Reference Košmrlj et al. (2009) made progress in the limit of (keeping ), when the extreme value distribution concentrates around its peak, , which lies somewhere between and . Now, we ask: what is the probability distribution that minimizes the relative entropy (or Kullback–Liebler divergence) to the pre-selection distribution , given the constraint that lies between and ? The answer is
| (20) |
where ensures normalization, and we have used Eq. (17). Here, is a Lagrange multiplier constraining the value of to lie between and . The optimal value of , , is the one as close to 0 as possible that satisfies this constraint. The mapping from hard constraints on the extreme value to a constraint on its mean is analogous to that from the microcanonical to the canonical ensemble in the thermodynamic limit Košmrlj et al. (2009).
The marginal distribution of amino acid at position of post-selection TCR sequences, , may be obtained from Eq. (20) by taking a sum over terms. However, in the limit, self-averages, i.e. ; thus, performing the double Legendre transform on w.r.t. (equivalently Hamiltonian minimization Kardar (1983)), and replacing by its self-averaged value , Eq. (20) factorizes into Eq. (8) of the main text, where (given by Eq. (9)) is the conjugate variable to . After the Legendre transforms w.r.t. , becomes Eq. (11). How is found in practice is described after Eq. (11) of the main text.