Semi-Analytic Galaxies - II. Revealing the role of environmental and mass quenching in galaxy formation
Abstract
We use the semi-analytic model of galaxy formation sag to study the relevance of mass and environmental quenching on satellite galaxies. We find that environmental processes dominate the star formation (SF) quenching of low-mass satellites (), whereas high-mass galaxies typically quench as centrals. High-mass galaxies that remain actively forming stars while being accreted are found to be mainly affected by mass quenching after their first infall. For a given stellar mass, our model predicts SF quenching to be less efficient in low-mass haloes both before and after infall, in contradiction with common interpretations of observational data. Our model supports a two-stage scenario to explain the SF quenching. Initially, the SF of satellites resembles that of centrals until the gas cooling rate is reduced to approximately half its value at infall. Then, the SF fades through secular processes that exhaust the cold gas reservoir. This reservoir is not replenished efficiently due to the action of either ram-pressure stripping (RPS) of the hot gas in low-mass satellites, or feedback from the active galactic nucleus (AGN) in high-mass satellites. The delay times for the onset of SF quenching are found to range from to for low-mass () and high-mass () satellites, respectively. SF fades in , largely independent of stellar mass. We find that the SF quenching of low-mass satellites supports the so-called delay-then-rapid quenching scenario. However, the SF history of passive satellites of any stellar mass is better described by a delay-then-fade quenching scenario.
keywords:
galaxies: clusters: general – galaxies: formation – galaxies: evolution – methods: numerical.1 Introduction
A great deal of work has been devoted in the last years to determine the role of mass and environmental quenching on the properties of central and satellite galaxies. Mass quenching111Although the term “secular quenching” describes more accurately the meaning of what we refer to as “mass quenching”, we adopt the latter following the convention in the literature. refers to any internal process determined by the galaxy stellar mass. These self-regulating processes, such as feedback from active galactic nuclei (AGN) (e.g. Fabian, 2012; Beckmann et al., 2017) and stellar feedback (e.g. Hopkins et al., 2014; Chan et al., 2018), can affect both central and satellite galaxies, and are thought to be responsible for the dependence of galaxy properties on stellar mass. Environmental quenching, on the other hand, corresponds to the decline of star formation (SF) activity of satellite galaxies due to their accretion into a massive dark matter halo. It involves environment-dependent physical processes, like ram pressure stripping (RPS, Gunn & Gott, 1972), tidal stripping (TS, Merritt, 1983), thermal evaporation (Cowie & Songaila, 1977), turbulent viscous stripping (Nulsen, 1982) and galaxy harassment (Moore et al., 1996).
The dependence of the efficiency of mass quenching on environment and of environmental quenching on stellar mass is somewhat controversial. Mass and environmental quenching have been reported to be independent of each other (e.g. Peng et al., 2010; Quadri et al., 2012; Muzzin et al., 2012; Lin et al., 2014; Gabor & Davé, 2015), while other studies conclude the opposite (e.g. Darvish et al., 2016; Kawinwanichakij et al., 2017). Darvish et al. (2016) find that environmental quenching is more efficient for more massive galaxies () at , whereas mass quenching gains relevance at and is more efficient in higher density environments. Kawinwanichakij et al. (2017) extend the analysis to lower mass galaxies demonstrating that the presence of nearly all quiescent low-mass galaxies () can be explained by environmental quenching. At fixed stellar mass, the star formation rate density (SFRD) declines with decreasing redshift more abruptly for galaxies in clusters than in the field (Guglielmo et al., 2015), highlighting the importance of environmental quenching, especially since (Nantais et al., 2017). On-going programmes like GOGREEN (Gemini Observations of Galaxies in Rich Early Environments) will contribute towards determining the role of environment in the evolution of low-mass galaxies (Balogh et al., 2017).
Galaxy interactions and mergers might explain the scenario in which environmental and mass quenching are not separable, i.e. in the regime of very dense environments and very massive galaxies (Darvish et al., 2016). Massive galaxies () have typically experienced around one major merger since (Xu et al., 2012). Likewise, ellipticals in groups achieve their spheroidal morphology through major mergers that take place at early epochs () when they inhabit the progenitor haloes of these systems, and their SF truncation occurs later when they fall into a galaxy group (Feldmann et al., 2011). Massive inflows of gas in major mergers of star-forming galaxies trigger starbursts and feed the central supermassive black holes (BHs) (Hopkins et al. 2008, e.g.; Khabiboulline et al. 2014, e.g.); while starbursts consume most of the nuclear gas, feedback from supernovae (SNe) and AGN expels the residual gas.
Galaxy formation models have also explored the relative importance of different quenching mechanisms using both hydrodynamical simulations (e.g. Bahé & McCarthy, 2015; Taylor et al., 2017; Davé et al., 2017) and semi-analytic models of galaxy formation (SAMs; e.g. De Lucia et al., 2012; Henriques et al., 2017; Stevens & Brown, 2017). Both approaches predict that quenching begins once the cooling of gas becomes inefficient (e.g. Schawinski et al., 2014; Peng et al., 2015). Thus, the cold gas disc is no longer replenished by cooling flows and is consumed within a few Gyr. This results in a decline of the star formation rate (SFR) until the galaxy becomes passive. Such scenario corresponds to the second stage in the so-called delay-then-rapid quenching scenario proposed by Wetzel et al. (2013, W13, hereafter), in which the onset of quenching since the first infall can take for low-mass galaxies () to for high-mass ones (). Once the SF quenching begins, this takes place in a short time-scale ().
A crucial aspect in determining the gas cooling efficiency and, thus, the quenching time-scales of satellite galaxies is the modelling of the hot gas removal in galaxies. The updated version of the semi-analytic model of galaxy formation sag (acronym for Semi-Analytic Galaxies) presented in Cora et al. (2018, hereafter Paper I) incorporates a gradual removal of hot gas of satellites by the action of RPS and TS. RPS can also affect the cold gas disc. This improved treatment of environmental effects combined with a modified modelling of SN feedback has been successful in reproducing several galaxy properties at both low and high redshifts. In particular, the predicted fractions of quenched galaxies as a function of stellar mass, halo mass and halo-centric distances are in good agreement with Wetzel et al. (2012). To achieve this result, a power-law slope of the redshift dependence of the reheated and ejected mass is used following that from the zoom FIRE (Feedback in Realistic Environments) hydrodynamical simulations (Muratov et al., 2015). In this variant of the model, referred to as sagβ1.3 in Paper I, the values of the rest of the free parameters obtained from the calibration process remain unchanged.
In this second paper of a series, we explore further the relevance of mass quenching and environmental quenching on currently passive satellite galaxies, and determine the time-scales involved in the quenching process.
This paper is organized as follows. Section 2 presents the galaxy formation model that combines a cosmological dark matter (DM) simulation with the sagβ1.3 model; we describe those aspect of our SAM that are relevant to this work, summarising the main conclusions of Paper I. In Section 3, we analyse the fraction of quenched galaxies at the time of first infall, and the relative role of environmental and mass quenching after their first infall. In Section 4, we discuss the quenching time of passive satellites that are star-forming at first infall. In Section 5, we propose a delay-then-fade quenching scenario, and identify the physical processes associated with its two phases. We present a summary of the main results and our conclusions in Section 6.
2 Galaxy formation model
The galaxy formation model combines our semi-analytic model of galaxy formation and evolution sag and the cosmological DM MultiDark simulation MDPL2, which is part of the CosmoSim database222https://www.cosmosim.org. The MDPL2 simulation follows the evolution of particles within a box of side-length , with a mass resolution per DM particle (Klypin et al., 2016). It is consistent with a flat CDM model characterised by Planck cosmological parameters: = 0.307, = 0.693, = 0.048, = 0.96 and = 100 km s-1 Mpc-1, where = 0.678 (Planck Collaboration et al., 2014). The simulation provides the DM haloes and their corresponding merger trees required by sag to generate the galaxy population and track the evolution of galaxy properties. DM haloes have been identified with the Rockstar halo finder (Behroozi et al., 2013a), and merger trees were constructed with ConsistentTrees (Behroozi et al., 2013b). DM haloes detected over the background density are referred to as main host haloes, whereas those lying within another DM haloes are subhaloes. sag assigns one galaxy to each new detected halo in the simulation. Thus, each system of haloes contains a central galaxy associated to the main host halo and satellite galaxies. Those galaxies that are assigned to DM haloes that are no longer identified by the halo finder after the merger of two haloes are called orphan satellites.
The model sag originates from the semi-analytic model presented in Springel et al. (2001) and was further modified as described in Cora (2006), Lagos et al. (2008), Tecce et al. (2010), Orsi et al. (2014), Muñoz Arancibia et al. (2015) and Gargiulo et al. (2015). sag includes the effects of radiative cooling of hot gas, star formation, feedback from SN explosions and AGN, and starbursts triggered by disc instabilities and/or galaxy mergers, and features a chemical enrichment model that tracks several chemical elements contributed by different sources (stellar winds and SNe Type Ia and II ) taking into account the lifetime of progenitors. This model has been improved by the implementation of a proper treatment of environmental effects on satellite galaxies. The strangulation scheme, in which the hot gas halo is removed instantly when the galaxy becomes a satellite, is replaced by gradual starvation produced by the combined action of RPS and TS. Therefore, gas cooling takes place in both central and satellite galaxies. The cold gas disc is also subject to RPS when it is not longer shielded by the hot gas halo; it can also suffer the effects of TS. Stellar mass loss as a result of TS is also taken into account. The advantage of our implementation with respect to previous SAMs (Gonzalez-Perez et al., 2014; Henriques et al., 2017; Stevens & Brown, 2017) resides in the integration of the orbits of orphan galaxies according to the potential well of the host halo, taking into account mass loss by TS and dynamical friction effects, and in the use of fitting formulae to estimate ram pressure (RP) as a function of halo mass, halo-centric distance and redshift (Vega-Martínez et al., in preparation). The combination of these two improvements provides values of RP consistent with the position and velocity of satellite galaxies. The latest version of sag also considers a modification in the SN feedback scheme that includes an explicit redshift dependence of the reheated and ejected mass, and in the rate of BH growth during gas cooling involved in the AGN feedback. A detailed description of the updated version of sag is presented in Paper I. We summarize here the implementations related to the new SN feedback scheme, the modification of AGN feedback and the treatment of environmental effects on the hot and cold gas phases of satellite galaxies.
2.1 SN feedback
SNe are associated to star-forming events and reheat part of the cold gas disc. As a result, the reheated gas is transferred to the hot phase. The reheated mass is given by
| (1) |
where is the number of SNe generated from the stellar population of mass formed, is the energy released by a single SN, and is the virial velocity of the host (sub)halo. The exponent takes the values and for virial velocities smaller and larger than , respectively. This additional modulation with virial velocity as well as the explicit redshift dependence are included following Hirschmann et al. (2016), based on the results from the zoom FIRE hydrodynamical simulations of Muratov et al. (2015). The SN feedback efficiency, , and the power-law slope of the redshift dependence, , are free parameters that control the amount of cold gas reheated by the energy generated by SNe as a function of time. The number of SNe, , depends on the initial mass function (IMF); we adopt the Chabrier IMF (Chabrier, 2003).
During the SN feedback process, some hot gas can also be ejected to an external reservoir. Based on the energy conservation argument presented by Guo et al. (2011), the ejected hot gas mass is given by
| (2) |
where is the energy injected by massive stars, estimated as the reheated mass but with the addition of the mean kinetic energy of SN ejecta per unit mass of stars formed, , i.e.
| (3) |
The wind velocity is given by (Muratov et al., 2015). The efficiency of ejection, , is another free parameter of the model. The ejected gas mass is assumed to be re-incorporated back onto the (sub)halo from which it was expelled and is modelled following Henriques et al. (2013). Thus, the reincorporated mass is given by
| (4) |
where the parameter is a free parameter that regulates the efficiency of the process.
2.2 AGN feedback
AGN feedback reduces gas cooling in large haloes, preventing them from forming stars at late times. This process is triggered by gas accretion events onto super-massive BHs. AGN feedback has been included in sag by Lagos et al. (2008) following Croton et al. (2006), but the modelling of the BH growth was subsequently modified (Ruiz et al. 2015, Paper I).
BHs grow via gas flows to the galactic core triggered by disc instabilities or galaxy mergers. BHs are assumed to merge instantaneously when a merger occurs. The resulting BH grows through cold gas accretion following
| (5) |
where and are the masses of the merging central and satellite galaxies, and and are their corresponding cold gas masses. The fraction of cold gas accreted onto the central super-massive BH, , is a free parameter of the model.
BHs can also grow during gas cooling processes taking place once a static hot gas halo has formed around the central galaxy. Following Henriques et al. (2015a), the BH growth rate is given by
| (6) |
where and are the hot gas and BH masses, respectively. The efficiency of cold gas accretion is given by the free parameter .
AGN feedback reduces the amount of gas that cools by
| (7) |
where the BH luminosity, , i.e. the mechanical heating generated by the BH accretion, is given by
| (8) |
where is the standard efficiency of energy production that occurs in the vicinity of the event horizon, and is the speed of light.
2.3 Gradual removal of the hot gas halo of satellite galaxies
The hot gas halo of satellite galaxies is gradually stripped by the action of RPS and/or TS. The gas beyond a satellite-centric radius will be removed by RPS if the pressure term satisfies the condition derived from the hydrodynamic simulations by McCarthy et al. (2008)
| (9) |
Here, is the density profile of the hot gas halo for an isothermal sphere, i.e., , where is the radius containing . This radius initially adopts the value of the subhalo virial radius, . In the case of orphan satellites, preserves the value corresponding to the last time the subhalo was identified. For the geometrical constant we adopt , which is an intermediate value within the range considered by McCarthy et al. (2008). The total mass of a satellite is
| (10) |
assuming that is large enough to contain all the stars and cold gas. We also assume that the DM is distributed in an isothermal sphere density profile. The hot gas stripping radius due to RP, can be obtained by solving numerically the combined equations (9) and (10) (see Appendix A in Paper I). This radius is compared with the tidal radius determined by TS, that is, , where the bounding radius for the DM, , is given by ; we are assuming that the hot gas distributes parallel to the DM. The smaller of and is the stripping radius . Thus, the value of is updated such that . All hot gas beyond that radius is stripped. The remaining gas is redistributed restoring an isothermal profile, but truncated at , as in Font et al. (2008) and Kimm et al. (2011).
2.4 Ram pressure and tidal stripping of cold gas disc
RPS of cold gas is modelled according to the simple criterion proposed by Gunn & Gott (1972), which was implemented in sag by Tecce et al. (2010). The cold gas of the galactic disc located at a galactocentric radius is stripped away when the RP exerted on the galaxy by the intragroup/intracluster medium exceeds the restoring force per unit area due to the gravity of the disc, that is
| (11) |
where , are the surface densities of the galactic disc (stars plus cold gas) and of the cold gas disc, respectively. The discs of stars and gas are modelled by an exponential surface density profile given by where is the central surface density and is the scale length of the disc. This scale length is estimated as (Mo et al., 1998), where is the spin parameter of the DM halo in which the galaxy resides. The stripping radius , beyond which all cold gas is removed, is derived from Eq. (11) and is given by
| (12) |
where and are the central surface densities of the stellar disc and of the cold gas disc, respectively. For simplicity, both disc components are considered to have the same scale length. We have checked that the precise distribution of the stellar content has a negligible impact on our results.
We assume that the hot gas halo of satellite galaxies shields the cold gas disc from the action of RPS. Thus, the ambient RP starts affecting the cold gas once the hot gas halo has been reduced to very low values by gas cooling and/or stripping processes (RPS, TS), that is, when its mass becomes less than percent the baryonic mass of the galaxy. This threshold has been chosen small enough to allow the role of the hot gas as a shield for a sufficiently long time, otherwise RPS on the cold disc gas becomes too effective.
The stripping radius due to TS, , is determined by the bounding radius of the DM halo, . At each snapshot of the simulation, is compared with the stripping radius determined by RPS, (equation (12)), in order to account for the effect of tides. The smaller of these two radii determines the stripping radius and all the gas beyond this radius is stripped away. The stripped gas is added either to the hot gas component of the central galaxy (which represents the intragroup/intracluster medium) or to the hot gas halo of satellite galaxies (an orphan galaxy could in turn orbit a satellite galaxy). If the hot gas phase is no longer present in the latter case, the stripped cold gas is transferred to the hot gas contained in the main halo.
After a stripping event produced by RPS and/or TS, the remaining disc gas is redistributed following an exponential surface density profile truncated at , with a new scale length defined as (assuming that percent of the cold gas disc is contained within ).
2.5 Galaxy properties from the SAGβ1.3 model
The free parameters of the sag model were tuned using the Particle Swarm Optimization Technique (PSO) by Ruiz et al. (2015) adopting a set of five observational constraints defined in Knebe et al. (2017). Namely, these are the stellar mass functions (SMF) at and (compilation data used by Henriques et al. 2015a), the star formation rate (SFR) distribution function for the redshift interval (Gruppioni et al., 2015), the fraction of mass in cold gas as a function of stellar mass (Boselli et al., 2014), and the relation between bulge mass and the mass of the central supermassive black hole, taken from McConnell & Ma (2013) and Kormendy & Ho (2013). During the calibration process, the power-law slope that characterises the redshift dependence included in the modified SN feedback scheme (eqs. 1 and 3) was considered a free parameter of the model. As discussed in Paper I, the fit to the SMF at results in , which is above the value obtained from the zoom FIRE hydrodynamical simulations of Muratov et al. (2015), . As a result, the predicted SFRD becomes too low with respect to observational data at high redshifts. A better agreement between model predictions and observational data is obtained by fixing while keeping the rest of the parameter values from the calibration process. This variant of the model is referred to as the sagβ1.3 model in Paper I. As a result of this choice for , the model predicts a higher number density of low-mass galaxies in the SMF at .
We classify galaxies as star-forming or passive according to their specific star formation rate density (sSFR). Passive galaxies are those with . This cut is obtained from the distribution of sSFR of our model galaxies (see fig. 9 in Paper I). The underpredicted SFRD at high redshifts from the calibrated model (characterised by ) results in fewer passive galaxies at (see fig. 10 in Paper I). This occurs due to the bulk of SF being shifted to lower redshifts, meaning that the galaxies lack sufficient time to quench their SF. Only the most massive galaxies (), within DM host haloes with masses , achieve quenched fractions similar to those presented by Wetzel et al. (2012). By using a milder redshift dependence of the reheated and ejected mass, as characterised by sagβ1.3, we achieve the expected behaviour of the fractions of quenched galaxies as a function of stellar mass, halo mass and the halo-centric distances (see figs. 11 and 12 in Paper I). The analysis of the galaxy catalogue generated by the sagβ1.3 model allows us to conclude that RPS plays a dominant role among the environmental processes considered in our model, being more effective for lower mass galaxies residing in more massive haloes and at lower redshifts (see figs. 13, 14 and 15 in Paper I), and adequately regulates the mass of the hot gas halo and the cold gas disc. While the gradual starvation of the hot gas reservoir is a key ingredient to determine the right SF history of satellite galaxies, the mild effect suffered by the cold gas disc improves the atomic gas content of galaxies when compared to observations (see fig. 16 in Paper I). In view of these results, the current work is based on the analysis of the properties of galaxies generated by the sagβ1.3 model.
3 Quenched fractions: dependence on time at first infall
Both mass and environmental quenching can affect the galaxy
after being accreted but their relative role depends
on both stellar mass and host halo mass
and cannot be estimated from the fraction of
quenched galaxies at .
We
explore this issue
by
making a deeper analysis of further information
provided by the sagβ1.3 model. This involves the
dependence
of quenched fractions
and stellar mass growth
on
the time of first infall,
defined as the moment in which the galaxy
becomes a satellite for the first time; there is strong
evidence that environmental effects
produce SF quenching
from
first infall (W13).
We denote the corresponding redshift as .
3.1 quenched fractions
Fig. 1 shows the fraction of quenched satellites at , , as a function of . Satellites are binned according to their present-day stellar mass as indicated in the legend. We consider those galaxies identified as satellites within main host haloes of mass , following the selection criterion adopted in Wetzel et al. (2012). For a given stellar mass range, increases for satellites with higher values of , as expected. Thus, galaxies that have been satellites for longer have had more time to experience environmental quenching. Values of are larger for larger stellar masses, at any . However, the dependence of on is more pronounced for less massive satellites. This trend becomes gradually milder for more massive galaxies. For a given stellar mass range, the average values of the quenched fractions are consistent with the results of the stellar and halo mass dependence of shown in fig. 11 of Paper I. The relations vs. are separated by a major gap between the two lowest and two highest stellar mass bins which is produced by the under-prediction of passive galaxies in the mass range , discussed in Paper I.
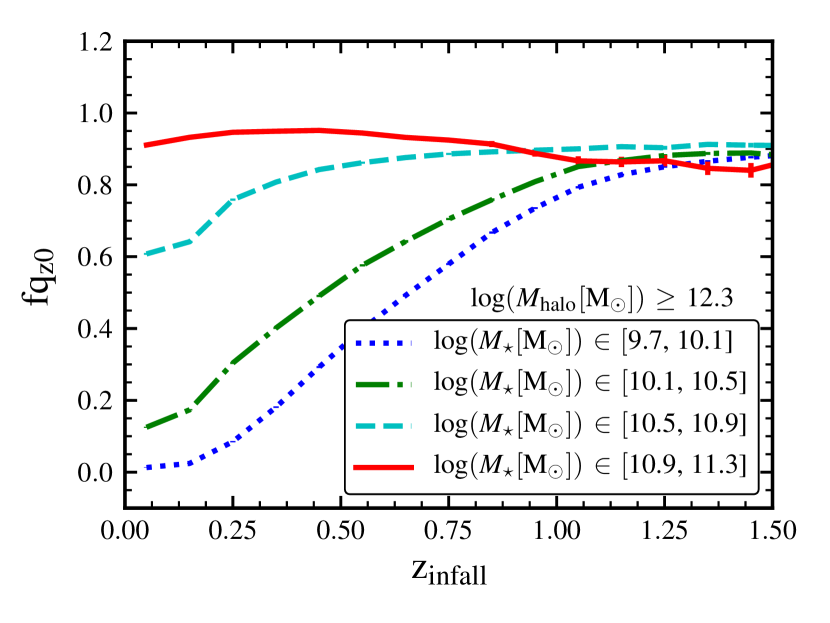
Low-mass satellites characterised by are mostly star-forming galaxies (). This is because SF quenching as a result of environmental effects is negligible for galaxies that have been recently accreted, and these galaxies are too small to suffer the consequences of mass quenching while they were centrals. However, more than percent of high-mass satellites accreted at the present epoch are passive. Massive galaxies have thus suffered mass quenching processes as centrals prior to infall (e.g. AGN feedback that reduces the gas cooling rates; starbursts triggered by both mergers and disk instabilities that exhaust the cold gas reservoir) as already found by van den Bosch et al. (2008). Hence, environmental processes can be considered as the dominant quenching mechanism in low-mass galaxies consistent with the conclusions of Wetzel et al. (2012).
The fraction of quenched galaxies at the present epoch reach similarly high values () for all galaxies regardless of their stellar mass when they have been satellites for more than (). The time elapsed is enough for the maximum possible effect of those processes affecting satellites to take place. Both the nature of these processes and their relative role (if there is more than one at play, e.g. environmental quenching and/or mass quenching) can vary for galaxies with different masses. Lin et al. (2014) investigate the relation between environmental quenching and mass quenching efficiencies with stellar mass for galaxies in a large optically selected sample of field and group galaxies obtained from the Pan-STARRS1 Medium-Deep Survey, which span a redshift range . For lower redshifts (), they find that SF in more massive galaxies () is mainly suppressed by mass quenching processes while environmental quenching gains relevance for lower mass galaxies. Mass quenching keeps the dominant role for massive galaxies in the higher redshifts probed (). This range overlaps with the one considered by Kawinwanichakij et al. (2017), who find similar results from the FourStar Galaxy Evolution (ZFOURGE) survey.
3.2 Quenched fractions at first infall
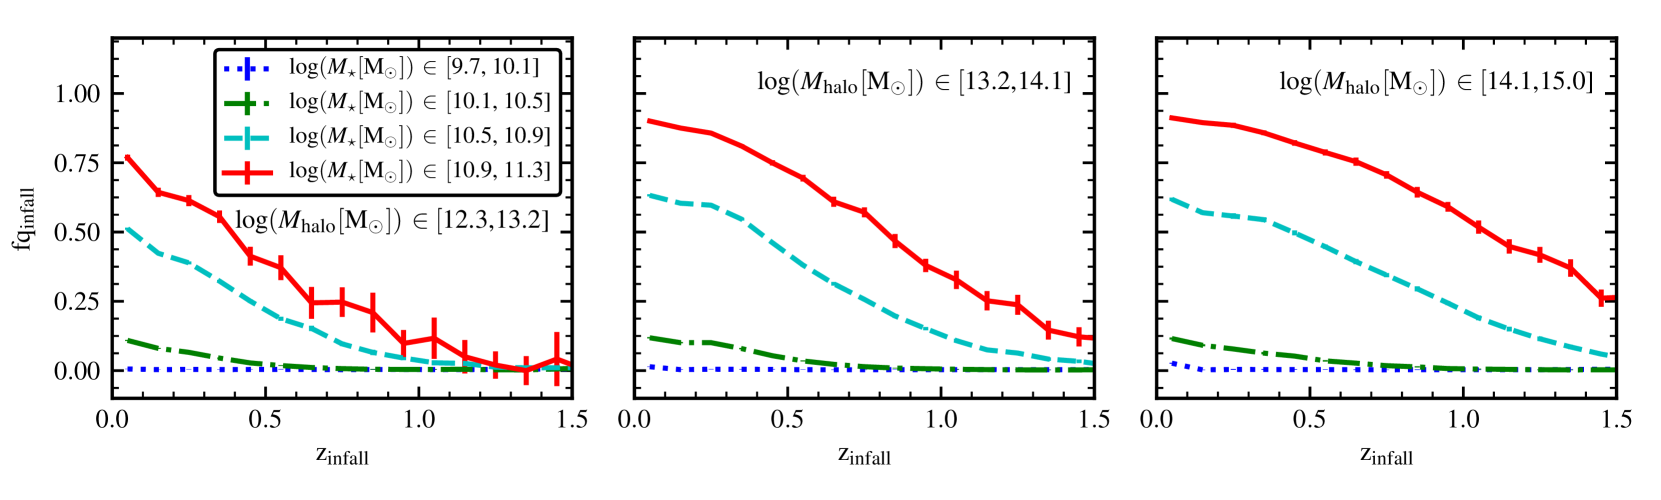
We study the fraction of satellite galaxies selected at that are quenched at the time of first infall, . This is estimated from the SFR and stellar mass at . The relation between and is presented in Fig. 2, grouping satellite galaxies according to their local stellar mass (different lines) and the mass of their main host haloes (different panels). Low-mass satellites have not suffered mass quenching before becoming satellites, since for any value of . This is consistent with the previous analysis of (Fig. 1). Intermediate mass satellites () accreted at also have , being almost all still star-forming by that time. The most massive satellites considered in this analysis () have for these early accretion times, with the larger fractions corresponding to those satellites residing within massive main host haloes (). As decreases, increases monotonically for galaxies in the two more massive stellar-mass bins, These galaxies experience mass quenching processes as centrals prior to infall, which becomes more efficient due to stellar mass growth.
Combining the results of the fractions and for a given stellar mass, we see that for almost all satellite galaxies that are star-forming at time of first infall are quenched by , regardless of . The fraction of low-mass satellites () that were star-forming at infall and quenched after infall is directly given by because galaxies in this mass range are all star-forming at infall () regardless of . If satellites are not discriminated according to then we find that for low-mass satellites residing within main host haloes of mass . Thus, we arise to conclusions similar to those obtained by W13 from the analysis of the results presented in their fig. 7. That is, half of the satellites with low stellar mass that were star-forming at the time of first infall have been quenched by the present, while essentially all massive satellites that were initially star-forming have been quenched.
The dependence of the fractions on for different stellar mass ranges only changes slightly for galaxies within haloes of mass , as can be seen from comparing the middle and right panels of Fig. 2. This lack of strong dependence of the quenched fractions on main host halo mass for high-mass haloes is consistent with the behaviour that emerged from the analysis of the radial dependence of the quenched fraction presented in Paper I (see fig. 12). The major difference appears for galaxies in the two highest stellar mass bins that have been accreted by smaller mass haloes, where decreases by , regardless of , with respect to those fractions typical of more massive haloes. This is the result of selecting galaxies by the same present-day stellar mass combined with the different stellar-mass growth rate experienced by galaxies of a given stellar mass that are located in different environments (Guglielmo et al., 2015); cluster galaxies form their stars sooner than those in the field, giving rise to a more pronounced slope of the decline of the cosmic SFR density with redshift in clusters. Thus, galaxies selected within a given stellar-mass range at that have been accreted by lower mass haloes have smaller stellar mass at a given time of infall (see fig. 12 in Behroozi et al., 2013c), which implies lower efficiency of mass quenching prior to infall with the consequent lower values of .
3.3 Implications of the fraction of currently passive satellites already quenched at
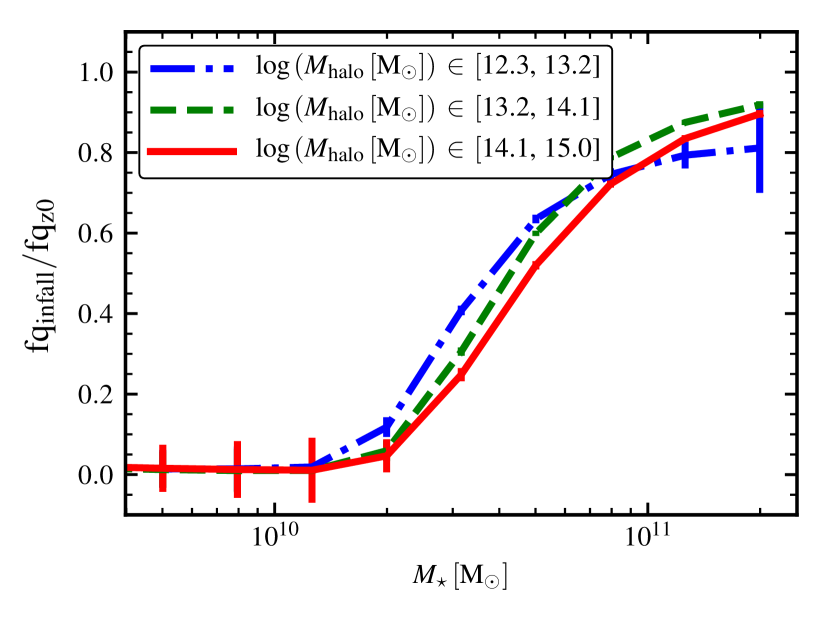
The fraction of currently quiescent satellites that are already quenched at first infall can be estimated by combining the information provided by the quenched fraction (, Fig. 1) and the quenched fraction at first infall (, Fig. 2). Thus, this fraction is calculated simply by the ratio between and . Fig. 3 shows the ratio as a function of stellar mass in bins of present-day main host halo mass. This ratio increases with stellar mass, meaning that more massive galaxies are more likely to be quenched as centrals through mass quenching processes, consistent with the conclusion inferred from Fig. 2. At fixed stellar mass (within the range ), this ratio is larger for satellites residing in lower mass haloes.
The dependence of the ratio on stellar mass and halo mass is shown in Fig. 3. Our model predictions are similar to W13 (see their fig. 10a), but the halo-mass dependence is less pronounced for sag model galaxies. Their results are obtained from the comparison of galaxy group/cluster catalogues from the Sloan Digital Sky Survey (SDSS) Data Release 7 with a galaxy catalogue constructed from a high-resolution cosmological simulation by applying the subhalo abundance matching (SHAM) technique (Conroy et al., 2006; Vale & Ostriker, 2006). From the trend with halo mass, W13 conclude that quenching prior to first infall is more important in galaxies accreted by lower mass host haloes, finding this fact reasonable considering that they fell in more recently. However, such a trend can be interpreted in a different way if we take into account that, for quenched satellites at a fixed present-day stellar mass and epoch, is lower in less massive haloes because of the lower stellar mass at the time of first infall. As a consequence of this, mass quenching is less effective prior to infall for galaxies accreted by less massive haloes, as we discuss in Section 3.2. The ratio becomes larger for galaxies residing in lower mass haloes because is also smaller for them (although not shown in Fig. 1). This is a result of the milder effect of RPS (found to be the dominant environmental process among those considered in sag) exerted by lower mass haloes (also see figs. 14 and 15 of Tecce et al., 2010).
Hence, from the analysis of model results, we can assert that only considering the fraction in the way presented in Fig. 3 is misleading: there are many variables playing an important role in the process of SF quenching. With the additional information provided by the fractions and , separately, we conclude that mass quenching prior to infall is less efficient for galaxies accreted by less massive haloes, and quenching after infall is also less efficient in smaller haloes.
3.4 Relative role of environmental and mass quenching after first infall
In order to disentangle the role of environmental and mass quenching after first infall for satellites with different present-day stellar mass, we compare their evolution to a control sample of central galaxies that never become satellites. We consider satellites residing in main host haloes with present-day mass . They are selected according to their stellar mass, keeping those that have been accreted at and were star-forming at that time. The control sample of star-forming central galaxies at is built with the requirements that they have the same stellar mass as satellites at infall and reside within main host haloes with masses in the range of subhalo masses that characterise the satellite galaxies at the moment of accretion. These stellar and subhalo mass bins are defined by tracking satellites back in time till and calculating the th and th percentiles of these mass distributions. This information is detailed in the legends of Figs. 4 and 5 that show the evolution of the sSFR and the BH luminosity (given by eq. 8), respectively, for both galaxy populations. Lines represent median values and the corresponding dashed areas depict the th and th percentiles. The upper panel corresponds to galaxy populations determined by satellites with present-day stellar mass within the two less massive ranges considered in Fig. 1 and Fig. 2, i.e. , while the bottom panel presents those determined by satellites with stellar mass within the two more massive ranges considered, i.e. .
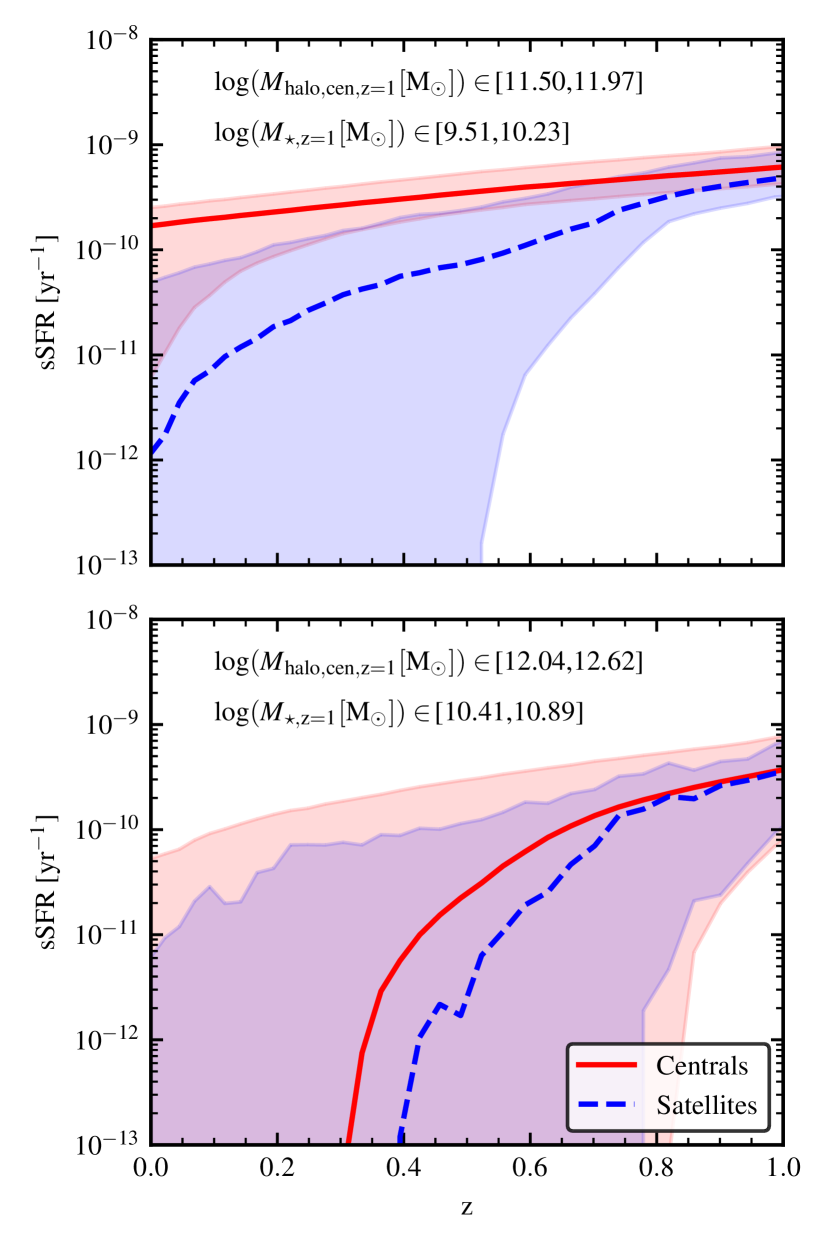
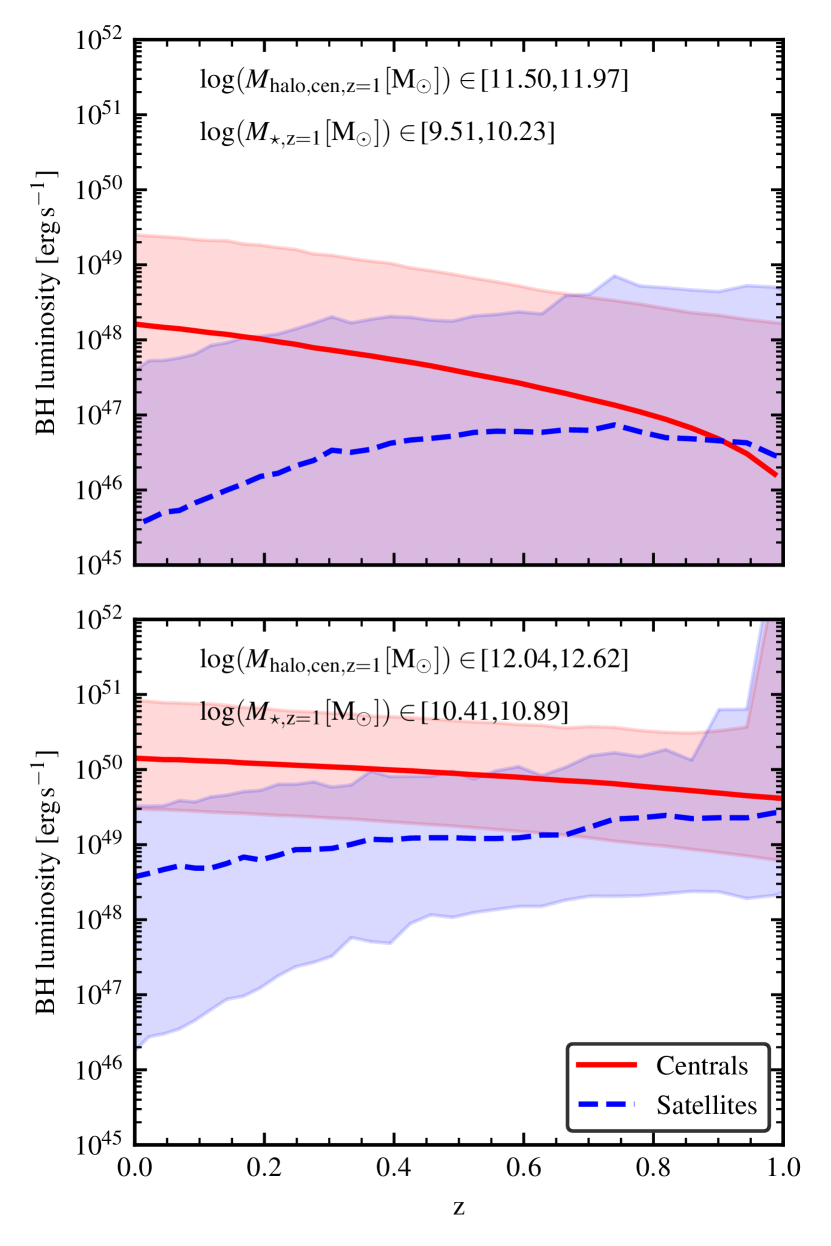
The sSFR evolution of low-mass satellites is clearly distinct from that of low-mass centrals (top panel of Fig. 4); the decline of the sSFR towards lower redshifts is more pronounced for the former than for the latter. This means that low-mass satellites become passive mainly because of the action of environmental processes, reinforcing the conclusion inferred from the analysis of Figs. 1 and 2. The effect of TS on the DM subhaloes of satellites and the larger effects of RPS suffered by low-mass satellites (see Fig. 14 in Paper I) contribute to reduce the mass of their hot gas halo with the consequent reduction of the BH luminosity (top panel of Fig. 5), which is directly related to the efficiency of AGN feedback. The hot halo mass of centrals keeps growing towards lower redshifts as a result of cosmological gas accretion during halo-mass growth. Thus, according to equation 6, the BH-growth rate through gas cooling also increases giving place to higher BH luminosity at lower redshifts. However, for low-mass centrals, these luminosities are not high enough to considerably reduce gas cooling ( at ). Consequently, this galaxy population remains mostly star-forming at the present, as indicated by the solid line and associated shaded area in the top panel of Fig. 4.
High-mass central galaxies are characterised by BH luminosities that are between (at ) and (at ) orders of magnitude larger than for low-mass ones (Fig. 5). Thus, AGN feedback becomes an efficient mass quenching process for more massive centrals, as evident from the abrupt decline of the sSFR shown in the bottom panel of Fig. 4. The stellar mass above which AGN feedback leads to SF quenching () and the halo mass in which they reside () are in agreement with the redshift-independent characteristic halo and stellar mass scales discussed by Henriques et al. (2018). The evolution of the sSFR and BH luminosity of high-mass central galaxies are also closely followed by high-mass satellites, although with a lower normalization. Here, environmental processes contribute to the decline of star formation. These results demonstrate that mass quenching keeps playing a major role in the decline of SF after high-mass galaxies become satellites.
4 Satellite quenching times
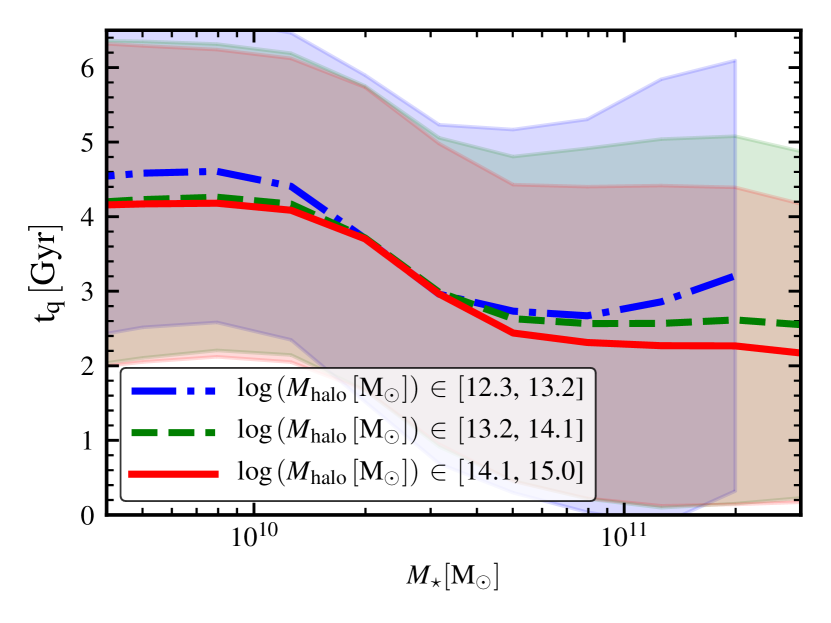
Now we study the quenching times of those passive satellites that are star-forming at time of first infall, i.e. those that quench as satellites by the contribution of both environmental and mass quenching. We estimate the quenching time, , considering the period of time elapsed since and the moment in which the galaxy becomes passive, identifying the snapshot in the simulation in which the galaxy sSFR falls below the threshold . This quenching time is defined in a similar way as in W13. We present the relation between and stellar mass for satellites in main host haloes of different present-day mass in Fig. 6. The trends found are quite similar to those shown by W13, with low-mass galaxies characterised by higher quenching times than more massive ones, and there being almost no secondary dependence on host halo mass. Mean values of predicted by our model are for and for . The scatter around these mean values is quite large, showing that low-mass galaxies can achieve quenching times as long as , consistent with W13.
The stellar mass dependence of the quenching time could be subject to bias if we consider the anticorrelation between the sSFR and stellar mass for galaxies in the star-forming main sequence. By defining a quenching time as the time it takes to drop below an absolute value of sSFR, high-mass satellites would take less time to become passive because they have less distance to cover in sSFR space. However, the main sequence of star-forming satellites at different redshifts in our model are rather flat (see fig. 7 in Paper I, thin dashed lines). Therefore, the stellar mass dependence of the quenching time that we find is a robust result. In order to confirm this, we have made the test of estimating the quenching time for galaxies defined as passive when they satisfy the condition , that is, dropping the threshold adopted to define a galaxy as passive. In this case, quenching times for low-mass satellites become longer by but, contrary to expectations, quenching times for high-mass galaxies remain unaffected by the lower threshold, making the stellar-mass dependence of the quenching time even more pronounced. This is explained by the evolution of the sSFR for low- and high-mass satellites shown in Fig. 4. Low-mass satellites quench their SF in a more gradual way than high-mass satellites. The latter are abruptly quenched reaching very low values of sSFR, so they are able to satisfy the more stringent condition imposed for being passive in the same short quenching time as required when the original threshold was applied.
Regarding the halo mass independence, W13 argue that it reflects the fact that is measured since time of first infall, which involves preprocessing in smaller haloes; the fraction of quiescent satellites that start quenching in another halo varies from to depending on current stellar mass and host halo mass (see also De Lucia et al. 2012). However, this lack of sensitivity of quenching times to main host halo mass is also found by Oman & Hudson (2016) even when they isolate environmental effects of the most recent host halo (within the range ) by measuring these time-scales since galaxies cross of the current host (according to their definition of time of infall), thus avoiding the time invested in pre-processing within other subhaloes. Oman & Hudson (2016) find that quenching occurs after a delay time since infall with quenching time-scales slightly shorter for higher mass galaxies. Although the stellar mass dependence is weaker than the one found by W13, time-scales obtained from these two works are of the same order of magnitude once corrections for different definitions of infalling time are taken into account (Oman & Hudson, 2016). The general good agreement of sagβ1.3 quenching times with values and trends found by W13 and Oman & Hudson (2016) is encouraging and supports other related predictions of our model.
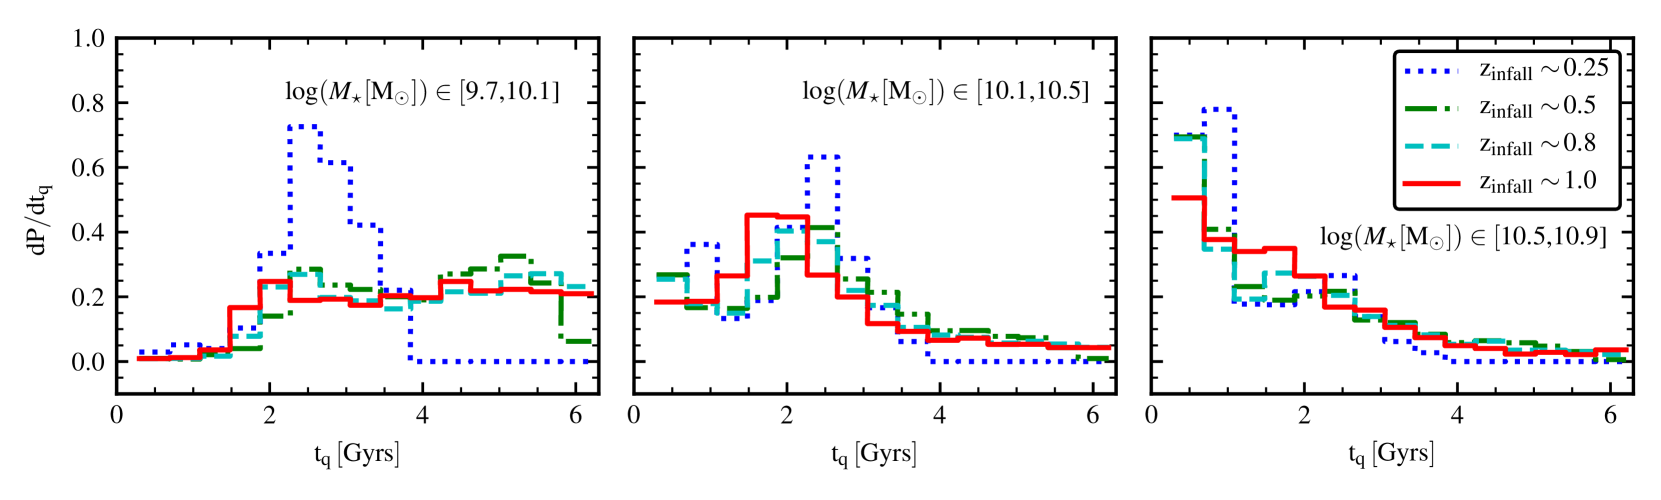
Fig. 7 shows the probability density functions 333Probability density function at the bin, normalized such that the integral over the range is equal to unity. of , for satellites in three of the stellar mass ranges analysed previously (different panels), whose redshifts of first infall are comprised within a range of around and (different line styles). Since there is no halo mass dependence of , all galaxies within main host haloes of present-day mass are considered. The most massive satellites are characterised by the lowest quenching times, with values of . Satellites of intermediate mass have a distribution of that peaks at . This is also the case for the lowest mass satellites that have been accreted more recently (). At first glance one could think that the latter result is biased by construction, since we are considering a set of galaxies that are star-forming at infall and have quenched at , so their time-scale for quenching is restricted. However, the fact that we do find satellites satisfying all these criteria means that there is an efficient mechanism acting at low redshifts that is able to quench SF of satellites. The quenching times of those low-mass satellites that have been accreted earlier cover a broad range from to , with a slight preference for the longer times.
The combination of the previous analysis with the information on the relative proportion of galaxies accreted at different times allows us to explain the anti-correlation of the average values of with stellar mass (Fig. 6). For a given stellar mass range, the mean values of are estimated considering satellites with all possible values of . The majority of passive satellites in the two highest stellar mass bins () have been accreted at low and intermediate redshifts (), whereas the bulk of the current lowest mass galaxies considered here have become satellites much earlier. Thus, early accreted low-mass galaxies characterised by long quenching times outnumber the recently accreted ones, which reach shorter quenching times. Consequently, the mean values of become higher for less massive satellites.
4.1 Discussion
Environmental effects such as RPS and TS depend strongly on the orbit of the satellite (see e.g. Vollmer et al., 2001). A galaxy on a more radial orbit, after passing through the denser regions of the halo centre, will experience a strong RP () earlier than a galaxy which is initially in a slowly decaying circular orbit; it will also experience alternating periods of strong and weak RP (), as its orbit within the halo takes it from the dense central region to the lower-density outskirts and back again. Another galaxy which is instead in a slowly decaying circular orbit will experience an ever increasing RP as it sinks towards denser regions (Brüggen & De Lucia, 2008; Tecce et al., 2010). In the case of TS, the mass loss also depends strongly on orbital circularity (e.g. Taylor & Babul, 2001, 2004; Zentner & Bullock, 2003; Gan et al., 2010), with most of the subhalo mass being lost during pericentric passages. The long quenching time-scales of low-mass satellites can be attributed to long dynamical friction time-scales that keep low-mass satellites in the outskirts of their main host haloes where RPS is less efficient. Effectively, from the analysis of cosmological simulations, Quilis et al. (2017) show that massive satellites () are found at short halo-centric distances at low redshifts (), whereas smaller systems are mainly located in the external regions. This dichotomy in the stellar mass dependence of the average radial position is less pronounced at higher redshifts, with all galaxies being quite evenly distributed throughout the groups/clusters. It is worth noticing that low-mass satellites accreted at can have any quenching time within the range Gyr (Fig. 7). This result indicates that, depending on their conditions at infall, many satellites are likely to have more eccentric orbits that bring them close to the halo centre characterised by higher values of RP and quench in short time-scales.
An important aspect to take into account on top of galaxy dynamics is the natural halo mass growth which is accompanied by an increase in the efficiency of RPS, giving place to faster quenching at lower redshifts. This might account for the short quenching times () of high-mass satellites and recently accreted low-mass ones, as well as for the long quenching times of those satellites accreted at earlier times.
4.2 Comparison with other works
The values and the stellar mass dependence of the quenching times obtained from our model are consistent with those estimated by W13. This trend with stellar mass is also roughly recovered by Hirschmann et al. (2014) who infer these time-scales from the requirement that their predicted quiescent fractions become consistent with observations, since the semi-analytic model they use (Guo et al., 2011) significantly overestimates the quiescent fraction of satellites and underestimate that of centrals for the stellar mass and densities considered.
From the analysis performed on SDSS and 3D-HST/CANDELS data, Fossati et al. (2017) estimate quenching time-scales of passive satellites selected according to the their position in the rest-frame UVJ color-color diagram. Their definition of quenching time is similar to the one adopted in our work, i.e. the time elapsed since first infall till the satellite becomes passive. These times were obtained from mock catalogues constructed from a semi-analytic model (Henriques et al., 2015b) that match the number density and redshift uncertainty of observed galaxies. For quenched satellites at residing in low-mass haloes (), they find quenching times of the order of . The quenching times are lower () for satellites of more massive haloes, which the authors attribute to very massive haloes included in the SDSS dataset that exert larger environmental effects. Besides, for a given halo mass bin, these times have almost no dependence on stellar mass (see their fig. 21). Our results, obtained for a population of quenched satellite galaxies, are not consistent with their findings at since the quenching times for our model galaxies show a much weaker dependence on halo mass, despite the fact that our halo-mass sample contains high mass clusters, and a clear trend with stellar mass. The different approaches used to derive quenching time-scales make the identification of the source of discrepancies difficult.
On the other hand, the values of obtained from our model and the stellar-mass and halo-mass trends they follow are consistent with the quenching times obtained for high redshift galaxies in the 3D-HST/CANDELS sample. For , Fossati et al. (2017) find values of the order of for low mass galaxies and for the most massive ones, with negligible dependence on halo mass within the considered range (). The latter values are larger than the quenching time-scales found for clusters galaxies with by Foltz et al. (2018), which are and at and , respectively; they classify galaxies as passive or star-forming according to dust-corrected rest-frame colours derived from spectral energy distribution fitting assuming the delay-then-rapid quenching scenario (W13) to constraint the quenching time-scales. A fair comparison with results from these works requires samples of model quenched satellites selected at high redshifts, which will be addressed in a near future.
5 The delay-then-fade quenching scenario
From the requirement of producing the correct sSFR distribution, W13 propose the delay-then-rapid quenching scenario, in which the times for the onset of SF quenching depend on the satellite mass () and, once started, the quenching takes place rapidly with SFR declining exponentially with an e-folding time for and for . In the delay phase of this two-stage model for satellite’s SFR evolution, the SFR of an accreted star-forming galaxy is assumed to diminish gradually after infall in a similar way to the SFR of a central galaxy of the same stellar mass as the satellite at infall. The quenching time-scales inferred by Oman & Hudson (2016) also involve a delay time until the onset of quenching after infall () and a short time-scale for the fading of SF (). The latter was estimated by considering the time required by their galaxies to reach the fraction of passive satellites observed within galaxy clusters.
From Fig. 4, we can see that the evolution of the sSFR of satellite galaxies in our model deviates from that of centrals some time after infall, and the decline of the sSFR of satellites becomes faster. This behaviour seems to be consistent with a two-stage model for the SFR evolution of satellites. However, it is not clear which physical processes are in action in each of the two phases of SF quenching. The first stage in which the SFR of satellites evolves similarly to that of centrals (‘delay phase’) seems to be associated with the period of time required by the hot gas cooling to become inefficient after infall (e.g. Schawinski et al., 2014). This transition experienced by the gas cooling efficiency might define the beginning of the second stage in which the SFR of satellites declines more abruptly than that of centrals (‘fading phase’) because the cold gas reservoir is no longer replenished by gas cooling from the hot halo. This phase might involve cold gas disc consumption through SF and/or removal through SN feedback and/or RPS, ending when the galaxy becomes passive.
In order to identify the physical mechanisms that play a relevant role in each of the two phases of the SFR decline, we analyse the mass content of the hot and cold gas reservoirs of passive satellites that are star-forming at infall considering different moments along their lifetime. Fig. 8 shows the mean values of the fraction of hot gas with respect to the total baryonic mass, , at infall (dashed-dotted line), at the moment of quenching, i.e, when their sSFR drops below the threshold adopted (; dashed line), and at (solid line), as a function of their stellar mass. At time of first infall, for any stellar mass; this fraction reflects the condition of central galaxies just prior to infall. When high-mass satellites become passive, this fraction remains quite high (). For low-mass satellites, this fraction becomes lower () but still consistent with the presence of a hot halo; the corresponding scatter indicates that most of low-mass passive satellites have more than percent of hot gas at the moment of SF quenching. We find that only and percent of satellites with stellar mass and , respectively, quench their star formation after the hot gas has been reduced to less than percent of the total baryonic mass. Most of them have experienced at least one event of RPS of the cold gas before becoming passive. These satellites are galaxies that have been accreted much earlier than the rest of the satellite population. The mean values of their redshift of first infall vary from to , depending on the stellar mass range considered, while the corresponding values for those galaxies that quench their SF before hot gas depletion are comprised within the range . Therefore, the quenching times of this particular set of satellites are longer () than those typical of the bulk of the satellite population (see Figs. 6 and 7).
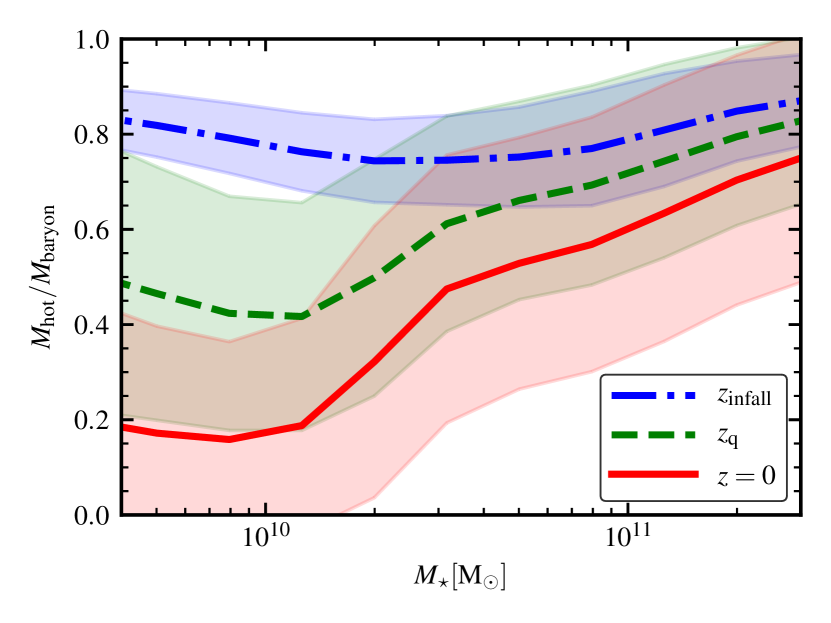
One important implication of the aforementioned results is that the complete removal of the hot gas halo is not a requirement neither for the onset of SF quenching (beginning of a faster decline of the SFR) nor for the SF quenching itself. Gas cooling, which is linked to the properties of the hot gas halo, namely, mass, metallicity and density profile (e.g. Springel et al., 2001), may become inefficient even when a substantial amount of hot gas is still available. The hot gas halo kept by galaxies after infall is mildly reduced by RPS for high-mass satellites (see fig. 14 in Paper I), but gas cooling is considerably suppressed by the action of AGN feedback (equation 7). This reduction of the gas cooling efficiency for more massive star-forming galaxies becomes evident in parsec-scale hydrodynamical simulations (Armillotta et al., 2016). This is consistent with the dominance of mass quenching over environmental quenching in the SFR decline of high-mass satellites (see Figs. 4 and 5). In low-mass satellites, gas cooling may become inefficient once the hot gas reservoir has been sufficiently reduced, although not necessarily depleted, by the stronger effect of RPS and gas cooling itself. Further reduction of the hot gas halo after SF quenching is the result of the action of RPS that contributes to determine the fractions of hot gas achieved at ( for and for , Fig.8). Clearly, this effect dominates over any possible replenishment with gas reheated by SN feedback. Note that satellites do not accrete hot gas cosmologically in our model, a common feature in SAMs (e.g. Henriques et al., 2015b; Stevens & Brown, 2017).
Fig. 8 shows that the bulk of the passive satellite population experiences SF quenching that is not associated to the action of RPS of the cold gas disc, which in our model takes place only when this component is not longer protected by the hot gas halo. This result is supported by qualitatively similar conclusions obtained from cosmological chemodynamical simulations (Kawata & Mulchaey, 2008) and the semi-analytic model dark sage (Stevens & Brown, 2017). This SAM also includes the effect of RPS on both the cold-gas disc and the hot-gas halo, with the former being shielded by the presence of the latter, although the corresponding implementations vary with respect to those in our model.
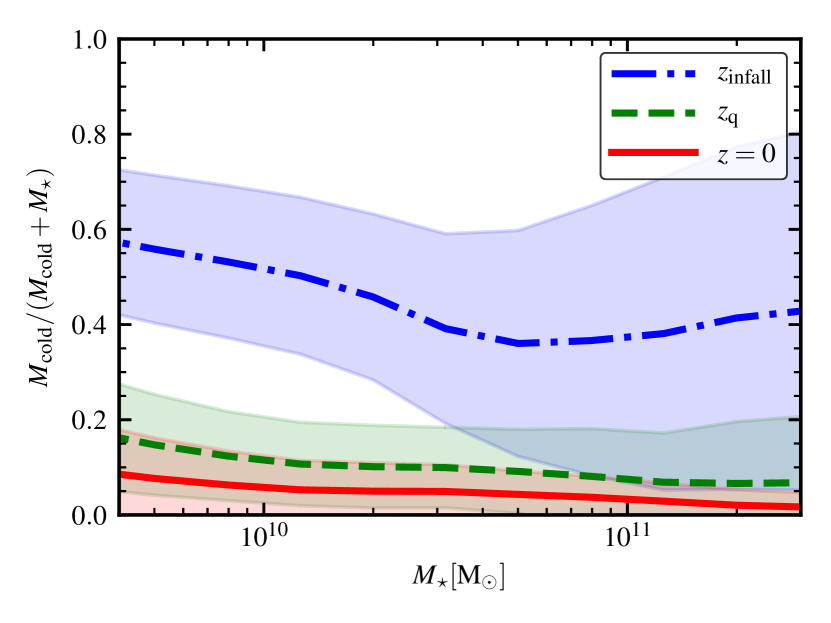
Fig. 9 shows the mean values of the fraction of cold gas with respect to the sum of cold gas and stellar mass, , for the same satellite population and stages as in Fig. 8. Mean values at time of first infall vary from for to for ; the 1- dispersion is larger for more massive satellites, which indicates that some high-mass galaxies are already gas-poor when they are accreted, with levels of SF that are likely close to the limit of quenching. This is a clear sign of the action of mass-quenching processes on high-mass galaxies prior to infall (see Fig. 2). This also explains the lower values of the quenching times, , of more massive satellites (see Figs. 6 and 7). All satellites, regardless of their stellar mass, have low cold gas fractions by the time they become passive (); their cold gas has been gradually consumed by star formation and/or removed through outflows produced by SN feedback. The fraction continues decreasing beyond the quenching time up to the present epoch by the remaining modest star formation taking place and/or the action of RPS on the cold gas disc if it is no longer shielded by the hot gas halo.
Since gas cooling efficiency plays a key role in the SFR decline, we estimate the rates of gas cooling at specific moments, following the analysis applied to the hot and cold gas fractions (see Figs. 8 and 9). Satellites of any stellar mass have, on average, gas cooling rates when becoming passive. This result means that there is not a sharp cut-off in the cold gas supply. Instead, the gas cooling rate becomes progressively lower departing from values within the range when star-forming galaxies are accreted. From the estimation of the evolution of median gas cooling rate for the same satellite population considered in Fig. 4, we can see (not shown here) a transition to a faster reduction of the gas cooling rate at , which is connected with the beginning of the fading phase where the SFR decline is faster. Thus, the results of our model indicate that the fading phase begins when the gas cooling rate has been reduced by percent with respect to its value at infall.
Our results support a two-stage quenching scenario for satellite galaxies, where the length of time of the delay and fading phases are comprised within the time , which characterises the whole quenching process. We estimate the length of time of the fading phase, , as the period of time elapsed since the gas cooling rate is reduced to half the value it has at infall until the satellite becomes passive. We find that for satellites of any stellar mass, with a very mild trend to be shorter for more massive galaxies. This result is representative of a large percentage of the satellite galaxies in our sample. The cooling-rate-based condition of transition from the delay phase to the fading one is satisfied by percent of satellites with stellar mass . This percentage decreases for satellites with both lower and higher stellar masses, and reaches values as low as and percent, respectively. Those satellites that do not fulfil this requirement are galaxies that already have very low cooling rates when they are accreted ().
For those satellites that go through both the delay and fading phase, we estimate the length of time of the delay phase, , from the difference between the mean values of (Fig. 6) and for each stellar mass range. The delay time varies from for low-mass satellites to for high-mass ones. Taking into account the scatter in the estimation of these times, we find that the values and stellar mass dependence of are in agreement with those obtained by W13. Mean values of are also consistent with the e-folding time over which the SFR fades, , estimated by W13, although our model does not predict statistical significant lower values for more massive satellites. We can conclude that the SF quenching of passive satellites can be described by a two-stage quenching scenario, characterised by a delay and a fading phase. The fading time is largely independent of stellar mass. It is shorter than the delay time for low-mass galaxies, whereas the opposite situation occurs for high-mass ones. Therefore, we consider that the term ‘delay-then-rapid’ proposed by W13 to dub the SF quenching scenario is not representative of the SF history of passive satellites with high stellar mass. Thus, we prefer to use the more inclusive term delay-then-fade to fairly describe all the possible situations.
5.1 Discussion
Based on the physical processes implemented in the sag model (gas cooling, star formation, SN and AGN feedback, RPS of the hot and cold gas phases), we have identified the relative impact of mass and environmental quenching on the SF history of passive satellites. We find that the SF quenching of satellites is well described by a delay-then-fade quenching scenario. The rate of gas cooling from the hot halo plays a decisive role in the beginning of the fading phase. It is mainly determined by an internal process (AGN feedback) in high-mass satellites, and by an environmental process (RPS of the hot gas halo) in low-mass ones. The cut-off of the cold gas replenishment by gas cooling, regardless of which physical process may actually be responsible for it, is named ‘strangulation’ (e.g. Peng et al., 2015). It is important to introduce a note of caution regarding the meaning attributed to this term in different works in the literature. The works that have introduced this concept (Larson et al., 1980; Balogh et al., 2000; Balogh & Morris, 2000) consider that strangulation also involves the stripping of the hot gas halo of satellite galaxies, a convention followed in subsequent works (e.g. Kawata & Mulchaey, 2008). The evidences that the hot gas removal takes place in a few Gyrs after accretion (Rasmussen et al., 2006; Vijayaraghavan & Ricker, 2015) justify the gradual starvation scenario implemented in sag (see Sec. 2). However, in previous versions of our model, as well as of other SAMs (Kauffmann et al., 1993; Weinmann et al., 2006; Croton et al., 2006), the modelling of the strangulation mechanism has been oversimplified by assuming that the hot gas halo is removed instantly when a galaxy becomes a satellite. Thus, in the context of SAMs, the term ‘strangulation’ implies this crude formulation of the process.
Peng et al. (2015) propose that strangulation is the primary mechanism for shutting down star formation. They find that the mass-dependent metallicity difference between quiescent and star-forming galaxies in SDSS can be very well reproduced by a close-box model that assumes that galaxies become passive after the cold gas supply is halted. However, the results from our model suggest that strangulation, in the general sense used by Peng et al. (2015), is a very strict condition to define the beginning of the SF fading because it is not necessary a complete suppression of gas cooling but only a more pronounced reduction of the cooling rates. Besides, even assuming strangulation, they obtain a typical time-scale for SF quenching of (largely independent of stellar mass), which is longer by than our predictions for . This disagreement points to the fact that a simple close-box model is not adequate to capture all the complex physical processes, both internal and environmental, that affect the star formation activity of a galaxy. Although this objective is better accomplished by sag, it is worth noticing that our model is not able to recover the observed metallicity difference between star forming and quiescent galaxies. We find an increasing trend of stellar metallicity with stellar mass in both cases, but not a significant difference between the metallicities of these two populations at a given stellar mass. This could be attributed to the fact that we discriminate galaxies in passive and star-forming according to their sSFR instead of using their colours, as in Peng et al. (2015). Therefore, many satellites classified as star-forming might be close to be quenched and their metallicities would be pretty similar to those of passive galaxies. This issue deserves a deeper analysis.
The results of our model are in line with the scenario of ‘overconsumption’ proposed by McGee et al. (2014), based on the analysis of satellite quenching times at a range of redshifts derived from observations. In this scenario, SF quenching of satellite galaxies is driven by secular outflows once cosmological accretion of gas is halted, and satellites become passive long before orbit-based gas stripping, such as RPS of the hot halo or of the cold gas disc, can have some impact on the quenching process. The predictions of sagβ1.3 agree partially with the later aspect. Although our model supports the fact that RPS of the cold gas plays a secondary role or even has negligible effect on the SF quenching, the RPS on the hot gas halo does play an important role since this process contributes to reduce the hot gas reservoir of low-mass satellites which drives the decline of the gas cooling rate.
In the context of their overconsumption model, McGee et al. (2014) find that a constant mass-loading of the wind can reproduce the evolution of the quenching time-scales of the delay phase as compiled from the literature (including the local value given by W13, which is of the same order of magnitude as the one inferred from sagβ1.3). Oman & Hudson (2016) show that this simple model is in conflict with the stellar mass dependence of the quenching time-scale. This conclusion is supported by our model, which is able to reproduce such a dependence based on a new feedback scheme that involves a redshift dependent mass-loading factor (see eq. 1), a feature that has demonstrated to be crucial in reproducing several observed galaxy properties (Paper I; Collacchioni et al. 2018).
6 Summary and conclusions
We have analysed a galaxy catalogue generated by applying the updated version of our semi-analytic model of galaxy formation sag, described in detail in Paper I, on the cosmological MultiDark MDPL2 simulation with the aim of contributing to our understanding of the relative role of environmental and mass quenching processes on satellite galaxies of different present-day stellar mass hosted by DM haloes of different mass. We also estimate the quenching time-scales involved. The latest improvements implemented in sag include a robust model of environmental effects through the action of RPS and TS coupled to the integration of the orbits of orphan satellites, and a higher efficiency of SN feedback allowed by an explicit redshift dependence of the reheated and ejected mass. In Paper I, we have demonstrated that a variant of the model referred to as sagβ1.3 allows us to achieve good agreement with observational results for several galaxy properties at both low and high redshifts. In particular, the agreement of the predictions of sagβ1.3 with the observed fraction of currently passive satellites as a function of stellar mass, halo mass and halo-centric distance makes this model suitable to carry out the present work.
We analyse subsamples of galaxies selected according to their stellar mass, main host halo mass and time of first infall. Our main conclusions can be summarised as follows:
-
•
From the analysis of the relative importance of mass quenching and environmental quenching for local quenched satellites of different stellar mass, we find to be the mass scale where mass quenching becomes important. This is also a characteristic mass scale for quenching in central galaxies (Henriques et al., 2018). Environmental processes, on the other hand, dominate the SF quenching of low-mass satellite galaxies (). This picture is consistent with the results of previous works (van den Bosch et al. 2008, Peng et al. 2010, W13, Lin et al. 2014, Kawinwanichakij et al. 2017, Cochrane & Best 2018). These conclusions are inferred from the following results:
-
–
Galaxies of any stellar mass that have been satellites for more than () are characterised by similarly high values of quenched fractions (). Such high quenched fractions suggest that the time elapsed since first infall is enough for the combined action of mass and environmental processes to fully quench satellite galaxies.
-
–
Low-mass satellites () have not suffered mass quenching while being centrals as evidenced by the null values of the corresponding quenched fraction at time of first infall (; Fig. 2). Their low mass prevents them from being quenched by self-regulating processes such as AGN feedback or disc instabilities. The same is true after infall, i.e. the quenched fractions at result solely from environmental processes. Values of are larger for galaxies that have been accreted earlier (higher ) because they have been satellites for longer periods of time, thus being affected by environmental quenching mechanisms for longer (Fig. 1).
-
–
High-mass satellites () are more likely to be quenched prior to infall. At a given redshift of first infall, the fractions of quenched satellites are higher for more massive galaxies (Fig. 2). At early accretion epochs (), percent of galaxies with local stellar mass accreted by high-mass haloes () are quenched. The fractions increase for lower values of , which may result from the combination of the stellar mass growth of a galaxy prior to infall and the time elapsed under the action of mass quenching processes while being central.
-
–
Mass quenching plays a major role in the decline of the SF for high-mass galaxies after infall. Within the same stellar and host halo mass range defined at a given time of first infall, satellites and centrals follow a similar evolution of the sSFR and BH luminosity, directly related with the efficiency of AGN feedback (Figs. 4 and 5). These quantities are slightly smaller for satellites as a consequence of the additional effect of RPS, which dominates among the environmental processes included in our model and exerts milder effects on more massive galaxies (Paper I).
-
–
-
•
For a given stellar mass, SF quenching mechanisms are less efficient in galaxies accreted by lower mass haloes both prior to and after their first infall. The stellar mass at infall is smaller for satellites of less massive haloes as a consequence of the different stellar-mass growth rates that characterise galaxies of the same stellar mass in different environments. Therefore, at a given time, galaxies accreted by lower mass haloes experience milder mass quenching prior to first infall (lower values of ) than a population with the same stellar mass infalling in more massive haloes (Fig. 2). Moreover, mass quenching after infall is also reduced, which combined with the milder environmental effects exerted by lower mass haloes produces lower values of . Both fractions and are reduced for less massive haloes at any stellar mass. However, is more strongly reduced, and thus the ratio , which gives the fraction of galaxies quenched at that are already quenched at first infall, takes larger values for galaxies residing in host haloes of lower mass (Fig. 3). The interpretation of this trend may lead to a conclusion opposite to the one drawn from our analysis, i.e. that quenching prior to infall is more important in less massive haloes, as the one discussed in W13.
-
•
The quenching times of passive satellites that were star-forming at first infall are anti-correlated with their present-day stellar mass (Fig. 6), consistent with results from W13: the average values of are for and for . These average values of are estimated including satellites with all possible values of . The anti-correlation with stellar mass arises because early accreted low-mass galaxies achieve quenching times as long as (Fig. 7), and these galaxies outnumber the recently accreted ones, characterised by shorter quenching times.
-
•
Overall, we can characterise the SF quenching process of passive satellites as consisting of two stages. During the first one, which is measured from the moment that a star-forming galaxy becomes a satellite, the gradual decline of the SFR resembles that of centrals of the same stellar mass as the satellites at infall. High levels of SF are sustained by high rates of gas cooling that only experience a mild reduction during this stage; their values at infall are . When the cooling rate reaches half its value at infall (, on average), there is a transition from a slow to a rapid decline of the gas cooling rate, as suggested by the evolution on the sSFR in Fig. 4, which denotes the end of the delay phase. This process takes place in a delay time that ranges from for low-mass satellites () to for high-mass ones (). In the second stage, the SFR declines faster until the satellite becomes passive (see the behaviour of the sSFR in Fig. 4). SF fades because the cold gas supply is reduced at a faster rate (reaching values as low as by the time the satellites are quenched) rather than being halted at the beginning of this fading phase as assumed in the strangulation quenching scenario (Peng et al., 2015). The cold gas disc is gradually consumed mainly through SF and/or removal through SN feedback. This process occurs in a fading time , regardless of stellar mass. Our model is only consistent with the delay-then-rapid quenching scenario proposed by W13 for low-mass satellites. Since the delay time is shorter for more massive satellites and the fading time is largely independent of stellar mass, we find that the SF history of all passive satellites is better described by a delay-then-fade quenching scenario.
-
•
Environmental processes have an important role during the delay for the onset of SF quenching for low-mass satellites. The gradual removal of the hot gas halo through RPS is directly influenced by the orbital evolution of galaxies and the mass growth of DM haloes. The relevance of this process diminishes for high-mass satellites which keep a large fraction of the hot gas reservoir by the time they become passive ( ). These fractions are smaller for low-mass galaxies (mean values of ; fractions can be as low as considering the scatter) but still consistent with the presence of a hot halo (Fig. 8). The larger reduction of the hot gas mass in less massive satellites yields to the decrease of their gas cooling rates. For high-mass satellites, this decrease occurs as a consequence of AGN feedback. RPS of the cold gas does not play any role in the fading of SF. It only acts on those satellites that have lost their protective hot gas halo, and contributes towards reducing even more the cold gas fraction after quenching (Fig. 9).
It is worth noting that either mass quenching or starbursts triggered by mergers could be responsible for the SF quenching of galaxies while being centrals. The relative importance of these processes will be examined in another work. Furthermore, we plan to extend the analysis presented here to high redshifts. The dependence of the quenching time-scales on redshift has been discussed recently in several observational studies (Balogh et al., 2016; Fossati et al., 2017; Foltz et al., 2018). Comparison with results provided by them will allow both to test our model and to help to our understanding of the SF quenching over cosmic time.
Acknowledgements
We thank the referee for the constructive report that improved the quality of the manuscript. The authors gratefully acknowledge the Gauss Centre for Supercomputing e.V. (www.gauss-centre.eu) and the Partnership for Advanced Supercomputing in Europe (PRACE, www.prace-ri.eu) for funding the MultiDark simulation project by providing computing time on the GCS Supercomputer SuperMUC at Leibniz Supercomputing Centre (LRZ, www.lrz.de). The MDPL2 simulation has been performed under grant pr87yi. This work was done in part using the Geryon computer at the Center for Astro-Engineering UC, part of the BASAL PFB-06, which received additional funding from QUIMAL 130008 and Fondequip AIC-57 for upgrades. SAC acknowledges funding from Consejo Nacional de Investigaciones Científicas y Técnicas (CONICET, PIP-0387), Agencia Nacional de Promoción Científica y Tecnológica (ANPCyT, PICT-2013-0317), and Universidad Nacional de La Plata (G11-124), Argentina. TH and CVM acknowledge CONICET, Argentina, for their supporting fellowships. AO acknowledges support from project AYA2015-66211-C2-2 of the Spanish Ministerio de Economía, Industria y Competitividad. This project has received funding from the European Union’s Horizon 2020 Research and Innovation Programme under the Marie Sklodowska-Curie grant agreement No 734374.
References
- Armillotta et al. (2016) Armillotta L., Fraternali F., Marinacci F., 2016, MNRAS, 462, 4157
- Bahé & McCarthy (2015) Bahé Y. M., McCarthy I. G., 2015, MNRAS, 447, 969
- Balogh & Morris (2000) Balogh M. L., Morris S. L., 2000, MNRAS, 318, 703
- Balogh et al. (2000) Balogh M. L., Navarro J. F., Morris S. L., 2000, ApJ, 540, 113
- Balogh et al. (2016) Balogh M. L., et al., 2016, MNRAS, 456, 4364
- Balogh et al. (2017) Balogh M. L., et al., 2017, MNRAS, 470, 4168
- Beckmann et al. (2017) Beckmann R. S., et al., 2017, MNRAS, 472, 949
- Behroozi et al. (2013a) Behroozi P. S., Wechsler R. H., Wu H.-Y., 2013a, ApJ, 762, 109
- Behroozi et al. (2013b) Behroozi P. S., Wechsler R. H., Wu H.-Y., Busha M. T., Klypin A. A., Primack J. R., 2013b, ApJ, 763, 18
- Behroozi et al. (2013c) Behroozi P. S., Wechsler R. H., Conroy C., 2013c, ApJ, 770, 57
- Boselli et al. (2014) Boselli A., Cortese L., Boquien M., Boissier S., Catinella B., Lagos C., Saintonge A., 2014, A&A, 564, A66
- Brüggen & De Lucia (2008) Brüggen M., De Lucia G., 2008, MNRAS, 383, 1336
- Cameron (2011) Cameron E., 2011, PASA, 28, 128
- Chabrier (2003) Chabrier G., 2003, PASP, 115, 763
- Chan et al. (2018) Chan T. K., Kereš D., Wetzel A., Hopkins P. F., Faucher-Giguère C.-A., El-Badry K., Garrison-Kimmel S., Boylan-Kolchin M., 2018, MNRAS, 478, 906
- Cochrane & Best (2018) Cochrane R. K., Best P. N., 2018, MNRAS, 480, 864
- Collacchioni et al. (2018) Collacchioni F., Cora S. A., Lagos C. D. P., Vega-Martínez C. A., 2018, MNRAS,
- Conroy et al. (2006) Conroy C., Wechsler R. H., Kravtsov A. V., 2006, ApJ, 647, 201
- Cora (2006) Cora S. A., 2006, MNRAS, 368, 1540
- Cora et al. (2018) Cora S. A., et al., 2018, preprint, (arXiv:1801.03883)
- Cowie & Songaila (1977) Cowie L. L., Songaila A., 1977, Nature, 266, 501
- Croton et al. (2006) Croton D. J., Springel V., White S. D. M., et al. 2006, MNRAS, 365, 11
- Darvish et al. (2016) Darvish B., Mobasher B., Sobral D., Rettura A., Scoville N., Faisst A., Capak P., 2016, ApJ, 825, 113
- Davé et al. (2017) Davé R., Rafieferantsoa M. H., Thompson R. J., 2017, MNRAS, 471, 1671
- De Lucia et al. (2012) De Lucia G., Weinmann S., Poggianti B. M., Aragón-Salamanca A., Zaritsky D., 2012, MNRAS, 423, 1277
- Fabian (2012) Fabian A. C., 2012, ARA&A, 50, 455
- Feldmann et al. (2011) Feldmann R., Carollo C. M., Mayer L., 2011, ApJ, 736, 88
- Foltz et al. (2018) Foltz R., et al., 2018, preprint, (arXiv:1803.03305)
- Font et al. (2008) Font A. S., Bower R. G., McCarthy I. G., et al. 2008, MNRAS, 389, 1619
- Fossati et al. (2017) Fossati M., et al., 2017, ApJ, 835, 153
- Gabor & Davé (2015) Gabor J. M., Davé R., 2015, MNRAS, 447, 374
- Gan et al. (2010) Gan J., Kang X., van den Bosch F. C., Hou J., 2010, MNRAS, 408, 2201
- Gargiulo et al. (2015) Gargiulo I. D., et al., 2015, MNRAS, 446, 3820
- Gonzalez-Perez et al. (2014) Gonzalez-Perez V., Lacey C. G., Baugh C. M., Lagos C. D. P., Helly J., Campbell D. J. R., Mitchell P. D., 2014, MNRAS, 439, 264
- Gruppioni et al. (2015) Gruppioni C., et al., 2015, MNRAS, 451, 3419
- Guglielmo et al. (2015) Guglielmo V., Poggianti B. M., Moretti A., Fritz J., Calvi R., Vulcani B., Fasano G., Paccagnella A., 2015, MNRAS, 450, 2749
- Gunn & Gott (1972) Gunn J. E., Gott J. R. I., 1972, ApJ, 176, 1
- Guo et al. (2011) Guo Q., White S., Boylan-Kolchin M., et al. 2011, MNRAS, 413, 101
- Henriques et al. (2013) Henriques B. M. B., White S. D. M., Thomas P. A., Angulo R. E., Guo Q., Lemson G., Springel V., 2013, MNRAS, 431, 3373
- Henriques et al. (2015a) Henriques B. M. B., White S. D. M., Thomas P. A., Angulo R., Guo Q., Lemson G., Springel V., Overzier R., 2015a, MNRAS, 451, 2663
- Henriques et al. (2015b) Henriques B. M. B., White S. D. M., Thomas P. A., Angulo R., Guo Q., Lemson G., Springel V., Overzier R., 2015b, MNRAS, 451, 2663
- Henriques et al. (2017) Henriques B. M. B., White S. D. M., Thomas P. A., Angulo R. E., Guo Q., Lemson G., Wang W., 2017, MNRAS, 469, 2626
- Henriques et al. (2018) Henriques B., White S., Lilly S., Bell E., Bluck A., Terrazas B., 2018, preprint, (arXiv:1809.01154)
- Hirschmann et al. (2014) Hirschmann M., De Lucia G., Wilman D., Weinmann S., Iovino A., Cucciati O., Zibetti S., Villalobos Á., 2014, MNRAS, 444, 2938
- Hirschmann et al. (2016) Hirschmann M., De Lucia G., Fontanot F., 2016, MNRAS, 461, 1760
- Hopkins et al. (2008) Hopkins P. F., Hernquist L., Cox T. J., Kereš D., 2008, ApJS, 175, 356
- Hopkins et al. (2014) Hopkins P. F., Kereš D., Oñorbe J., Faucher-Giguère C.-A., Quataert E., Murray N., Bullock J. S., 2014, MNRAS, 445, 581
- Kauffmann et al. (1993) Kauffmann G., White S. D. M., Guiderdoni B., 1993, MNRAS, 264, 201
- Kawata & Mulchaey (2008) Kawata D., Mulchaey J. S., 2008, ApJ, 672, L103
- Kawinwanichakij et al. (2017) Kawinwanichakij L., et al., 2017, ApJ, 847, 134
- Khabiboulline et al. (2014) Khabiboulline E. T., Steinhardt C. L., Silverman J. D., Ellison S. L., Mendel J. T., Patton D. R., 2014, ApJ, 795, 62
- Kimm et al. (2011) Kimm T., Yi S. K., Khochfar S., 2011, ApJ, 729, 11
- Klypin et al. (2016) Klypin A., Yepes G., Gottlöber S., Prada F., Heß S., 2016, MNRAS, 457, 4340
- Knebe et al. (2017) Knebe A., et al., 2017, preprint, (arXiv:1712.06420)
- Kormendy & Ho (2013) Kormendy J., Ho L. C., 2013, ARA&A, 51, 511
- Lagos et al. (2008) Lagos C. D. P., Cora S. A., Padilla N. D., 2008, MNRAS, 388, 587
- Larson et al. (1980) Larson R. B., Tinsley B. M., Caldwell C. N., 1980, ApJ, 237, 692
- Lin et al. (2014) Lin L., et al., 2014, ApJ, 782, 33
- McCarthy et al. (2008) McCarthy I. G., Frenk C. S., Font A. S., Lacey C. G., Bower R. G., Mitchell N. L., Balogh M. L., Theuns T., 2008, MNRAS, 383, 593
- McConnell & Ma (2013) McConnell N. J., Ma C.-P., 2013, ApJ, 764, 184
- McGee et al. (2014) McGee S. L., Bower R. G., Balogh M. L., 2014, MNRAS, 442, L105
- Merritt (1983) Merritt D., 1983, ApJ, 264, 24
- Mo et al. (1998) Mo H. J., Mao S., White S. D. M., 1998, MNRAS, 295, 319
- Moore et al. (1996) Moore B., Katz N., Lake G., Dressler A., Oemler A., 1996, Nature, 379, 613
- Muñoz Arancibia et al. (2015) Muñoz Arancibia A. M., Navarrete F. P., Padilla N. D., Cora S. A., Gawiser E., Kurczynski P., Ruiz A. N., 2015, MNRAS, 446, 2291
- Muratov et al. (2015) Muratov A. L., Kereš D., Faucher-Giguère C.-A., Hopkins P. F., Quataert E., Murray N., 2015, MNRAS, 454, 2691
- Muzzin et al. (2012) Muzzin A., et al., 2012, ApJ, 746, 188
- Nantais et al. (2017) Nantais J. B., et al., 2017, MNRAS, 465, L104
- Nulsen (1982) Nulsen P. E. J., 1982, MNRAS, 198, 1007
- Oman & Hudson (2016) Oman K. A., Hudson M. J., 2016, MNRAS, 463, 3083
- Orsi et al. (2014) Orsi Á., Padilla N., Groves B., Cora S., Tecce T., Gargiulo I., Ruiz A., 2014, MNRAS, 443, 799
- Peng et al. (2010) Peng Y.-j., et al., 2010, ApJ, 721, 193
- Peng et al. (2015) Peng Y., Maiolino R., Cochrane R., 2015, Nature, 521, 192
- Planck Collaboration et al. (2014) Planck Collaboration et al., 2014, A&A, 571, A16
- Quadri et al. (2012) Quadri R. F., Williams R. J., Franx M., Hildebrandt H., 2012, ApJ, 744, 88
- Quilis et al. (2017) Quilis V., Planelles S., Ricciardelli E., 2017, MNRAS, 469, 80
- Rasmussen et al. (2006) Rasmussen J., Ponman T. J., Mulchaey J. S., 2006, MNRAS, 370, 453
- Ruiz et al. (2015) Ruiz A. N., et al., 2015, ApJ, 801, 139
- Schawinski et al. (2014) Schawinski K., et al., 2014, MNRAS, 440, 889
- Springel et al. (2001) Springel V., White S. D. M., Tormen G., Kauffmann G., 2001, MNRAS, 328, 726
- Stevens & Brown (2017) Stevens A. R. H., Brown T., 2017, MNRAS, 471, 447
- Taylor & Babul (2001) Taylor J. E., Babul A., 2001, ApJ, 559, 716
- Taylor & Babul (2004) Taylor J. E., Babul A., 2004, MNRAS, 348, 811
- Taylor et al. (2017) Taylor P., Federrath C., Kobayashi C., 2017, MNRAS, 469, 4249
- Tecce et al. (2010) Tecce T. E., Cora S. A., Tissera P. B., Abadi M. G., Lagos C. D. P., 2010, MNRAS, 408, 2008
- Vale & Ostriker (2006) Vale A., Ostriker J. P., 2006, MNRAS, 371, 1173
- Vijayaraghavan & Ricker (2015) Vijayaraghavan R., Ricker P. M., 2015, MNRAS, 449, 2312
- Vollmer et al. (2001) Vollmer B., Cayatte V., Balkowski C., Duschl W. J., 2001, ApJ, 561, 708
- Weinmann et al. (2006) Weinmann S. M., van den Bosch F. C., Yang X., Mo H. J., Croton D. J., Moore B., 2006, MNRAS, 372, 1161
- Wetzel et al. (2012) Wetzel A. R., Tinker J. L., Conroy C., 2012, MNRAS, 424, 232
- Wetzel et al. (2013) Wetzel A. R., Tinker J. L., Conroy C., van den Bosch F. C., 2013, MNRAS, 432, 336
- Xu et al. (2012) Xu C. K., Zhao Y., Scoville N., Capak P., Drory N., Gao Y., 2012, ApJ, 747, 85
- Zentner & Bullock (2003) Zentner A. R., Bullock J. S., 2003, ApJ, 598, 49
- van den Bosch et al. (2008) van den Bosch F. C., Aquino D., Yang X., Mo H. J., Pasquali A., McIntosh D. H., Weinmann S. M., Kang X., 2008, MNRAS, 387, 79