Reverberation Mapping of High-, High-luminosity Quasars
Abstract
We present Reverberation Mapping results after monitoring a sample of 17 high-, high-luminosity quasars for more than 10 years using photometric and spectroscopic capabilities. Continuum and line emission flux variability is observed in all quasars. Using cross-correlation analysis we successfully determine lags between the variations in the continuum and broad emission lines for several sources. Here we present a highlight of our results and the determined radius–luminosity relations for Ly and CIV.
\helveticabold1 Keywords:
Quasars, Black Holes, Reverberation Mapping, Broad Line Region, AGN
2 Introduction
Reverberation Mapping (RM) has been an extremely successful technique used to study the innermost regions of Active Galactic Nuclei (AGN). The determination of lags between variations in the continuum emission coming from the accretion disk near the central Black Hole (BH), and the response from the emission lines produced in the Broad Line Region (BLR) have shown that the BLR is an extended, virialized and ionizion-stratified structure. Furthermore, the determination of the radius–luminosity relation between the BLR radius at which H is produced and the luminosity of the central source has open, through cross-calibration to other BLR lines, the possibility to measure BH masses in hundred of thousands of sources. The cross-calibration is, however, subject to many uncertainties due to the extrapolations necessary to apply the radius–luminosity relation to sources of very different luminosities to those actually probed with RM experiments, and to the use of emission lines produced by regions of the BLR that can be far from that producing H. This is the motivation to conduct RM campaigns in high-, high-luminosity quasars for those emission lines available in the observed optical domain.
3 Observational campaign and resulting light curves
Since 2005 we undertook a long observational campaign to monitor a sample of southern, high-redshift (, with one source at ), high-luminosity () quasars. 50 targets were originally selected from the SDSS (Schneider et al., 2005) and Calán-Tololo samples (Maza et al., 1996). We started with a purely R-band imaging (corresponding to rest frame wavelengths Å, depending on the exact redshift of the source) and two years later triggered the first spectroscopic observations of those quasars with the largest photometric variations. Over the years the campaign was narrowed down to a final sample of 17 quasars which have good quality R-band and emission line light curves.
Line fluxes were measured using spectral windows tailored to each line and each quasar. We avoided regions where the lines were contaminated by variable absorbing features, but did not attempt to correct for the contribution of other (weaker) emission lines, either narrow or broad. For further details see Lira et al. (2018, submitted).
Over the campaign we found that most quasars showed a substantial degree of variability in the continuum and line emission line fluxes, with typical normalized variability amplitudes (Rodríguez-Pascual et al., 1997) of %. Most quasars also showed the expected behavior, where the emission lines followed the trends seen in the continuum as traced by the R-band light curves. Many sources, unfortunately, did not shown enough structure in their light curves (which in the rest frame only map the continuum and line flux variations during years), to allow for statically significant lag determinations.
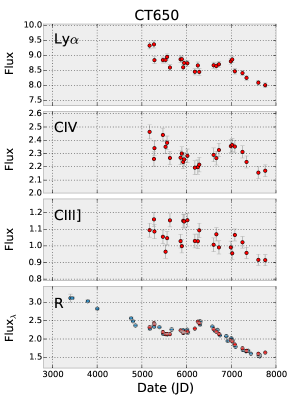
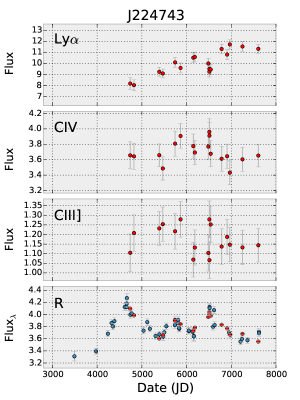
Two sources showed unexpected Ly light curves, where the line fluxes depart from the behavior shown by the continuum and the remaining emission lines. One example (J224743) is shown in Figure 1, where we also include a source that presents the expected line response to the continuum variations (CT650).
4 Time series analysis
Cross-correlation analysis was conducted using the ICCF and ZCCF methods (Gaskell and Sparke, 1986; Alexander, 1997). Errors were determined using Monte Carlo simulations were the light curve fluxes were randomized and bootstrapped to contain about 70% of the original data points (Peterson et al., 2004). We determined statistically significant lags with respect to that of the R-band continuum for 3 Ly, 5 CIV, 1 SiIV, 1 CIII], and 1 MgII emission line light curves.
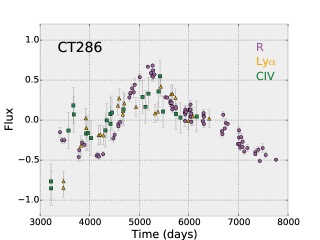
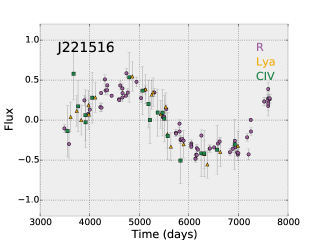
In Figure 2 we reproduce the light curves for two of our sources, CT286 and J221516. The emission line light curves have been shifted according to the calculated lags, while all curves have been taken to a mean of zero and a standard deviation of one. Figure 2 illustrates that emission line light curves can closely match the observed UV continuum, like in the case of J221516, or can show rather different trends, as seen in CT286, where the line light curves correspond to a heavily smoothed version of the continuum light curve.
Two reasons can be invoked to explain such differences: 1) the response of the BLR to continuum variations differs from object to object, and it can be nonlinear and show variations with time; 2) the observed UV continuum might not be a good representation of the ionizing continuum, which is actually responsible of driving the emission line changes.
The recent monitoring of NGC5548 by the STORM consortium displays several of these traits during the 170 days of monitoring (Goad et al., 2016). Emission line light curves follow closely that of the continuum during the first 1/3 of the campaign, to then disengage from it showing a decorrelated behavior for days, to finally going back to the original state. Besides, while some emission lines show a smoother light curve than that of the observed continuum during the last segment of the monitoring, SiIV stands out for showing larger amplitude in its peaks and troughs than that of the continuum.
5 Radius–luminosity relations
As well as providing extremely valuable information about the innerworks of the BLR (see next section), reverberation mapping has provided a huge scientific legacy with the determination of the so called radius–luminosity relations. This tight correlations between the distance at which one particular emission line is produced and the continuum luminosity of the central engine allows for the determination of BH masses by applying these calibrations to a virialized BLR (i.e., , where comes from the radius–luminosity relation and is measured from the width of the broad emission lines).
So far, RM of the H line for nearby () AGN has produced a solid radius–luminosity relation for this line (Wandel et al., 1999; Kaspi et al., 2000, 2005; Bentz et al., 2006, 2009, 2013). Cross–calibration of the correlation to other lines has been a significant enterprise which has allowed to determine BH masses of high- quasars whose Balmer lines are redshifted into the infrared realm. In particular, MgII has proven to be a safe line to be used as BH mass estimator (McLure and Dunlop, 2004; Trakhtenbrot and Netzer, 2012), while it has been extensively shown that CIV yields unreliable results (Baskin and Laor, 2005; Netzer et al., 2007; Shen et al., 2008; Shen and Liu, 2012; Mejía-Restrepo et al., 2016).
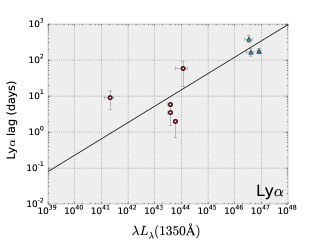
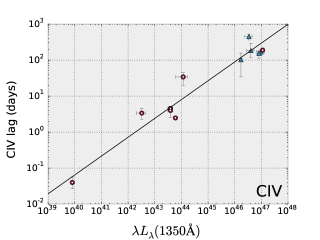
Our monitoring effort has provided a sizeable number of Ly and CIV lags at the high-luminosity end of the quasar distribution. This, together with other measurements found in the literature for lower luminosity AGN allows us now to determine radius–luminosity relations for these lines. These are presented in Figure 3, while the analytical expressions are as follows:
| (1) |
| (2) |
where is the measured lag and corresponds to the product as measured at 1345 Å from each spectra. As can be seen from Equation 1, the zero point and slope of the Ly radius–luminosity correlation are poorly constrained. The reason is clear after an inspection of Figure 3 which reveals that Seyfert type sources show a large dispersion around the best fitted correlation, in contrast with the situation for CIV. In fact, the new CIV radius–luminosity relation is very close to that reported by (Kaspi et al., 2007), who found a zero point of and a slope of . Notice that the Ly and CIV relations are consistent within the errors.
6 BLR stratification
One crucial result that emerged early during the reverberation campaigns of nearby AGN was that the BLR was compact, dense and stratified (Peterson, 1994), in contrast with previous photoionization results that attempted to explain all emission lines as produced by one set of physical parameters (or one single cloud). RM results made clear that different regions, with different properties, and located at different distances from the central engine, were producing the observed set of emission lines. To build a consistent picture of the BLR, therefore, it is important to determine where different lines are produced.
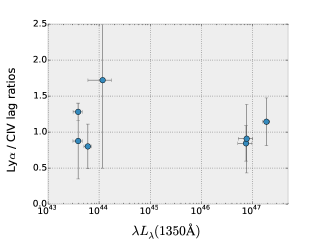
Our results allows to put constraints on the distance at which Ly and CIV are produced by obtaining for all source for which both lags have been measured. This is presented in Figure 4, where three sources at high-luminosities come from our lag determinations. Figure 4 clearly supports that and that this ratio is independent of luminosity.
7 Summary and conclusions
We have presented selected results from the RM campaign of 17 high-z, high-luminosity quasars, which lasted more than 10 years. For several sources lags between the continuum and BLR line emission were determined, allowing us to extend radius-luminosity relationships up to ergs/s. Continuum and line light curves for all sources can be found in Lira et al. (submitted).
Author Contributions
PL, IB, SK and HN comply with the requirements for authorship of this article.
Acknowledgments
PL greatly acknowledges the support of the Chilean National TAC (CNTAC) which during more than 10 years allocated telescope time to conduct our reverberation campaign and to the funding by Fondecyt along all these years, and in particular to Project #1161184.
References
- Alexander (1997) Alexander, T. (1997). Is AGN Variability Correlated with Other AGN Properties? ZDCF Analysis of Small Samples of Sparse Light Curves. In Astronomical Time Series, eds. D. Maoz, A. Sternberg, and E. M. Leibowitz. vol. 218 of Astrophysics and Space Science Library, 163. 10.1007/978-94-015-8941-3_14
- Baskin and Laor (2005) Baskin, A. and Laor, A. (2005). What controls the CIV line profile in active galactic nuclei? MNRAS 356, 1029–1044. 10.1111/j.1365-2966.2004.08525.x
- Bentz et al. (2013) Bentz, M. C., Denney, K. D., Grier, C. J., Barth, A. J., Peterson, B. M., Vestergaard, M., et al. (2013). The Low-luminosity End of the Radius-Luminosity Relationship for Active Galactic Nuclei. ApJ 767, 149. 10.1088/0004-637X/767/2/149
- Bentz et al. (2009) Bentz, M. C., Peterson, B. M., Netzer, H., Pogge, R. W., and Vestergaard, M. (2009). The Radius-Luminosity Relationship for Active Galactic Nuclei: The Effect of Host-Galaxy Starlight on Luminosity Measurements. II. The Full Sample of Reverberation-Mapped AGNs. ApJ 697, 160–181. 10.1088/0004-637X/697/1/160
- Bentz et al. (2006) Bentz, M. C., Peterson, B. M., Pogge, R. W., Vestergaard, M., and Onken, C. A. (2006). The Radius-Luminosity Relationship for Active Galactic Nuclei: The Effect of Host-Galaxy Starlight on Luminosity Measurements. ApJ 644, 133–142. 10.1086/503537
- De Rosa et al. (2015) De Rosa, G., Peterson, B. M., Ely, J., Kriss, G. A., Crenshaw, D. M., Horne, K., et al. (2015). Space Telescope and Optical Reverberation Mapping Project.I. Ultraviolet Observations of the Seyfert 1 Galaxy NGC 5548 with the Cosmic Origins Spectrograph on Hubble Space Telescope. ApJ 806, 128. 10.1088/0004-637X/806/1/128
- Gaskell and Sparke (1986) Gaskell, C. M. and Sparke, L. S. (1986). Line variations in quasars and Seyfert galaxies. ApJ 305, 175–186. 10.1086/164238
- Goad et al. (2016) Goad, M. R., Korista, K. T., De Rosa, G., Kriss, G. A., Edelson, R., Barth, A. J., et al. (2016). Space Telescope and Optical Reverberation Mapping Project. IV. Anomalous Behavior of the Broad Ultraviolet Emission Lines in NGC 5548. ApJ 824, 11. 10.3847/0004-637X/824/1/11
- Kaspi et al. (2007) Kaspi, S., Brandt, W. N., Maoz, D., Netzer, H., Schneider, D. P., and Shemmer, O. (2007). Reverberation Mapping of High-Luminosity Quasars: First Results. ApJ 659, 997–1007. 10.1086/512094
- Kaspi et al. (2005) Kaspi, S., Maoz, D., Netzer, H., Peterson, B. M., Vestergaard, M., and Jannuzi, B. T. (2005). The Relationship between Luminosity and Broad-Line Region Size in Active Galactic Nuclei. ApJ 629, 61–71. 10.1086/431275
- Kaspi et al. (2000) Kaspi, S., Smith, P. S., Netzer, H., Maoz, D., Jannuzi, B. T., and Giveon, U. (2000). Reverberation Measurements for 17 Quasars and the Size-Mass-Luminosity Relations in Active Galactic Nuclei. ApJ 533, 631–649. 10.1086/308704
- Maza et al. (1996) Maza, J., Wischnjewsky, M., and Antezana, R. (1996). Calán-Tololo survey. VIII. One hundred southern quasars. RMxAA 32
- McLure and Dunlop (2004) McLure, R. J. and Dunlop, J. S. (2004). The cosmological evolution of quasar black hole masses. MNRAS 352, 1390–1404. 10.1111/j.1365-2966.2004.08034.x
- Mejía-Restrepo et al. (2016) Mejía-Restrepo, J. E., Trakhtenbrot, B., Lira, P., Netzer, H., and Capellupo, D. M. (2016). Active galactic nuclei at z 1.5 - II. Black hole mass estimation by means of broad emission lines. MNRAS 460, 187–211. 10.1093/mnras/stw568
- Netzer et al. (2007) Netzer, H., Lira, P., Trakhtenbrot, B., Shemmer, O., and Cury, I. (2007). Black Hole Mass and Growth Rate at High Redshift. ApJ 671, 1256–1263. 10.1086/523035
- Peterson (1994) Peterson, B. M. (1994). Overview of Reverberation Mapping: Progress and Problems. In Reverberation Mapping of the Broad-Line Region in Active Galactic Nuclei, eds. P. M. Gondhalekar, K. Horne, and B. M. Peterson. vol. 69 of Astronomical Society of the Pacific Conference Series, 1
- Peterson et al. (2005) Peterson, B. M., Bentz, M. C., Desroches, L.-B., Filippenko, A. V., Ho, L. C., Kaspi, S., et al. (2005). Multiwavelength Monitoring of the Dwarf Seyfert 1 Galaxy NGC 4395. I. A Reverberation-based Measurement of the Black Hole Mass. ApJ 632, 799–808. 10.1086/444494
- Peterson et al. (2006) Peterson, B. M., Bentz, M. C., Desroches, L.-B., Filippenko, A. V., Ho, L. C., Kaspi, S., et al. (2006). Erratum: “Multiwavelength Monitoring of the Dwarf Seyfert 1 Galaxy NGC 4395. I. A Reverberation-based Measurement of the Black Hole Mass”. ApJ 641, 638–639. 10.1086/500409
- Peterson et al. (2004) Peterson, B. M., Ferrarese, L., Gilbert, K. M., Kaspi, S., Malkan, M. A., Maoz, D., et al. (2004). Central Masses and Broad-Line Region Sizes of Active Galactic Nuclei. II. A Homogeneous Analysis of a Large Reverberation-Mapping Database. ApJ 613, 682–699. 10.1086/423269
- Rodríguez-Pascual et al. (1997) Rodríguez-Pascual, P. M., Alloin, D., Clavel, J., Crenshaw, D. M., Horne, K., Kriss, G. A., et al. (1997). Steps toward Determination of the Size and Structure of the Broad-Line Region in Active Galactic Nuclei. IX. Ultraviolet Observations of Fairall 9. ApJs 110, 9–20. 10.1086/312996
- Schneider et al. (2005) Schneider, D. P., Hall, P. B., Richards, G. T., Vanden Berk, D. E., Anderson, S. F., Fan, X., et al. (2005). The Sloan Digital Sky Survey Quasar Catalog. III. Third Data Release. AJ 130, 367–380. 10.1086/431156
- Shen et al. (2008) Shen, Y., Greene, J. E., Strauss, M. A., Richards, G. T., and Schneider, D. P. (2008). Biases in Virial Black Hole Masses: An SDSS Perspective. ApJ 680, 169-190. 10.1086/587475
- Shen and Liu (2012) Shen, Y. and Liu, X. (2012). Comparing Single-epoch Virial Black Hole Mass Estimators for Luminous Quasars. ApJ 753, 125. 10.1088/0004-637X/753/2/125
- Trakhtenbrot and Netzer (2012) Trakhtenbrot, B. and Netzer, H. (2012). Black hole growth to z = 2 - I. Improved virial methods for measuring MBH and L/LEdd. MNRAS 427, 3081–3102. 10.1111/j.1365-2966.2012.22056.x
- Wandel et al. (1999) Wandel, A., Peterson, B. M., and Malkan, M. A. (1999). Central Masses and Broad-Line Region Sizes of Active Galactic Nuclei. I. Comparing the Photoionization and Reverberation Techniques. ApJ 526, 579–591. 10.1086/308017