Revisiting the Stellar Velocity Ellipsoid – Hubble type relation: observations versus simulations
Abstract
The stellar velocity ellipsoid (SVE) in galaxies can provide important information on the processes that participate in the dynamical heating of their disc components (e.g. giant molecular clouds, mergers, spiral density waves, bars). Earlier findings suggested a strong relation between the shape of the disc SVE and Hubble type, with later-type galaxies displaying more anisotropic ellipsoids and early-types being more isotropic. In this paper, we revisit the strength of this relation using an exhaustive compilation of observational results from the literature on this issue. We find no clear correlation between the shape of the disc SVE and morphological type, and show that galaxies with the same Hubble type display a wide range of vertical-to-radial velocity dispersion ratios. The points are distributed around a mean value and scatter of . With the aid of numerical simulations, we argue that different mechanisms might influence the shape of the SVE in the same manner and that the same process (e.g. mergers) does not have the same impact in all the galaxies. The complexity of the observational picture is confirmed by these simulations, which suggest that the vertical-to-radial axis ratio of the SVE is not a good indicator of the main source of disc heating. Our analysis of those simulations also indicates that the observed shape of the disc SVE may be affected by several processes simultaneously and that the signatures of some of them (e.g. mergers) fade over time.
keywords:
galaxies: kinematics and dynamics – galaxies: evolution – galaxies: spiral – galaxies: structure1 Introduction
Ever since its discovery in the Milky Way, the relation between stellar random motions and age has been a matter of intense study (e.g. Spitzer & Schwarzschild, 1953; Wielen, 1977; Carlberg et al., 1985; Holmberg et al., 2009). There are two main invoked scenarios, explaining why old stars display larger velocity dispersions than young stars. On the one hand, an increasing gas velocity dispersion with redshift has been observed in disc galaxies (Wisnioski et al., 2015). This suggests that old stars, born from this turbulent and dynamically hot gas, would have already high dispersions when they were young. Such cases were shown both in House et al. (2011) and Bird et al. (2013). Some galaxies, in the N-body hydrodynamical simulations sample from the former study, maintained the same dispersions until the end of the simulations. In galaxies with a highly turbulent interstellar medium (from mergers or internal processes), old stars were already dynamically hot at birth. The latter study analyses the Eris cosmological simulation (Guedes et al., 2011) and agrees with an "upside-down" evolution for the Milky Way disc. The oldest stars would have been formed in an early active merger phase and quickly scattered into kinematically hot orbits by these mergers (Bird et al., 2013).
On the other hand, in a disc heating scenario, stars were born in a very thin layer of gas with cold orbits and observed random velocities would have appeared more recently (e.g. Merrifield et al., 2001). This occurs in other galaxies of the simulations sample from House et al. (2011), where disc stars were born dynamically cold and acquired higher dispersions later, thanks to various disc heating mechanisms. A number of candidate sources for dynamical heating have been identified. These include encounters with giant molecular clouds (GMCs), perturbations from irregular and transient spiral structures or from stellar bars, dissolution of young stellar clusters, scattering by dark halo objects or globular clusters, and disturbances by satellite galaxies or mergers (e.g. Gerssen & Shapiro Griffin, 2012).
It is generally believed that the relative amplitudes of the random motions in different directions are a measure of the relative importance of the disc heating agents, and can provide a diagnostic for the possible sources (e.g. Merrifield et al., 2001). The ellipsoidal three-dimensional distribution of the stellar velocity dispersions was originally introduced by Schwarzschild (1907). The stellar velocity ellipsoid (SVE), in cylindrical coordinates formed by the vertical (), radial () and azimuthal () components of the stellar velocity dispersion, is thus the result of the combination of the predominant heating mechanisms. The ratios , and define its shape. In an axisymmetric disc with stellar orbits not too far from circular (the epicycle approximation, see Binney & Tremaine 1987), depends only on the circular velocity and no heating mechanisms. This is the main reason why several authors have used the measurements of the ratio to make predictions about the predominant heating processes in galactic discs (e.g. Gerssen & Shapiro Griffin, 2012). Vertical and radial dispersions similar to each other would reveal an isotropic heating, whereas anisotropic heating would be displayed by a significant difference between those velocity dispersion components.
The candidate agents for the dynamical heating of discs can be classified as:
-
1.
three-dimensional agents, responsible for increasing both vertical and radial (and azimuthal) dispersions, although not necessarily at the same rate. The most invoked examples in the literature are encounters with GMCs and galaxy mergers.
-
2.
radial (or planar) agents, involved only in radial (planar) heating, with no effect on the vertical component of the velocity dispersion. The most invoked candidate is the spiral structure typical of most disc galaxies, but bars can also have similar effects.
Spitzer & Schwarzschild (1953) showed that the star-cloud encounters, related to the large-scale fluctuations in the interstellar medium density, could be responsible for the increase of the velocity dispersion with advancing spectral type (and age) along the stellar main sequence. Moreover, clustered star formation may add kinematically hot components to pre-existing populations, thanks to the expulsion of the residual gas by the massive stars, thickening the disc (Kroupa, 2002). Recent N-body simulations by Aumer et al. (2016) confirm that GMCs are capable of heating cold discs vertically as well as horizontally. If their influence was significantly higher in the past than now, due to higher mass and/or number densities, they could explain the observations in the solar neighborhood (in combination with spiral heating). Hence, their heating efficiency would have declined over time due to a decline in the star-formation rate (SFR), but also because a GMC is individually more effective at heating when it represents a large fraction of the not-fully-grown disc mass. As a consequence, we probably need to invoke other heating agents to explain the level of SVE isotropy observed in the later stages of the discs, when they are already massive.
Several articles in the literature have already proposed mergers as responsible for enhancing relative to . Toth & Ostriker (1992) showed, with an analytical model, how the satellite infall helps to explain the observed scale height of the Milky Way disc. Sellwood et al. (1998), on the basis of N-body simulations, claimed that mergers with satellites couple closely to oscillations that can be excited in the vertical direction. So, direct vertical heating of disc stars by the gravitational perturbations would be negligible if compared to the one caused by dissipation of large-scale bending waves, excited by satellites’ decaying orbits in resonance with stellar orbits. On the other hand, Benson et al. (2004) developed an analytical model, ignoring the effect of resonances, which predicted a median thickening of the discs by satellite accretions, which deposit kinetic energy into disc stars. Velazquez & White (1999), also using N-body simulations, studied the amount and distribution of the heating caused by interactions with merging satellites. They found that the effect depends strictly on the masses of the disc, the bulge and the satellites relative to each other, and on the coupling of their orbits with each other (prograde or retrograde). In simulations by Kazantzidis et al. (2008, 2009), vertical, radial and azimuthal velocity dispersions increased at the same time during mergers with satellites, without affecting significantly the shape of the velocity ellipsoid. This is in agreement with this kind of interactions being proposed as three-dimensional heating agents.
Roškar et al. (2013) claimed that the change in the radial positions of stars would have an important effect on the final disc scale height. On the other hand, numerous other authors showed that the contribution of this so-called radial migration might be insignificant (e.g. Minchev et al., 2012a; Minchev et al., 2012b; Minchev et al., 2012c; Minchev et al., 2013; Bird et al., 2013; Vera-Ciro et al., 2014; Grand et al., 2016).
Regarding the dynamical heating in the disc plane, numerous numerical studies have pointed to spiral arms as the most efficient source. Disc stars usually receive, from the spiral density waves, kicks at a frequency which is close to their natural oscillation frequency in the radial direction (e.g. Merrifield et al., 2001; Minchev & Quillen, 2006). Therefore, radial random motions can be increased rapidly by this near-resonant process. At the same time, this does not happen in the vertical direction, so that will be made significantly greater than (Jenkins & Binney, 1990). Sellwood & Carlberg (1984) argued that the transient spiral patterns are self-regulating features, since they tend to stability rising secularly the radial velocity dispersion, until the Toomre parameter (Toomre, 1964) has risen to a value around 2. This would make the spiral patterns fainter in later times, unless any cooling process ensures that the disc does not completely stabilize and exhibits a recurrent spiral structure.
Concerning the effect of bars, Grand et al. (2016) claimed that they are important contributors to disc heating, after associating the bar buckling to a sudden increase in vertical kinetic energy. Saha et al. (2010) found an explanation for the vertical heating in the inner region of the disc (within a scale-length) in the instabilities caused by the bar growth. On the contrary, in the outer disc, the radial heating overtook the vertical heating in presence of bars evolved to saturation (in the sense that its amplitude cannot grow anymore). Saha et al. (2013) related the buckling instability with a drop in and warned about the difficulty of tracking stars subject to rapid changes during the buckling phase.
There are very limited observational works in the literature constraining the shape of the SVE in external galaxies since it is, still nowadays, an arduous task. One of the most successful studies is that of Gerssen & Shapiro Griffin (2012). They fitted the stellar velocity ellipsoids of 8 intermediately-inclined galaxies and studied their shapes as a function of the Hubble type. They found a strong trend with early-type galaxies having more isotropic SVE than later types, suggesting three-dimensional agents are the main contributors to the heating of their disc. On the contrary, in late-type discs, they proposed that their flatter ellipsoids were due to the action of radial agents, most likely the spiral density waves. This trend was in agreement with expectations from some previous studies (e.g. Jenkins & Binney, 1990), but not others (e.g. van der Kruit & de Grijs, 1999). Globally, there is no consensus in the literature about the shape of late-type ellipsoids, in the sense that different results have been found for different galaxies of the same morphological type. Even for our Galaxy, where the properties of individual stars can be measured directly, a wide range of values of the vertical-to-radial velocity dispersion ratio were observed in the solar neighborhood (e.g. Wielen, 1977; Dehnen & Binney, 1998; Casagrande et al., 2011; Aumer & Binney, 2009; Bond et al., 2010; Smith et al., 2012; Binney et al., 2014b; Büdenbender et al., 2015; Aumer et al., 2016). As suggested by Büdenbender et al. (2015), these results might be affected by the tilt of the SVE, implying a coupling between the vertical and the radial velocity dispersion that is not taken into account in most studies.
The aim of this paper is to revisit the SVE–Hubble type relation and try to reconcile the different results in the literature with the help of state-of-the-art simulations. We present, in § 2, observational results for a sample of 55 galaxies gathered from published observational analyses and we describe the methods used to study their ellipsoids. Section 3 revises the SVE–Hubble type relation from the observational datasets presented here. In § 4 we introduce the set of numerical simulations used in this work. Section 5 makes use of the numerical work to elaborate on the sources of disc heating and their effect on the shape of the SVE. We sum up our conclusions in § 6.
2 Observational Data
In this section, we describe the observed subsamples gathered from the literature. They are organized according to the methods used to calculate the shape of their SVE. Unfortunately, each subsample was analysed only with one method. So, we do not have the possibility of comparing the different techniques or verifying that they are consistent with each other. Nonetheless, we consider all the methods equally valid since they are all based on reasonable assumptions. We think that the general results of our study are robust to possible biases in individual methods.
2.1 The solar neighborhood ellipsoid
Numerous works have been carried out for the SVE of the Milky Way disc in the solar neighborhood, with many of them leading to slightly different results depending on the specific sample. The study from Dehnen & Binney (1998) involved stars in a wide range of populations, although representative only of the local solar neighborhood. They selected a kinematically unbiased sample of 11 865 stars from the Hipparcos Catalogue ESA 1997 (Perryman et al., 1997), which included also young stars. The Hipparcos astrometry mission did not provide radial velocities for this big sample. They determined the kinematics from the absolute parallaxes and proper motions provided by this catalogue and using the deprojection technique described in Dehnen & Binney (1998). The velocity dispersion tensor was calculated in nine different bins in the color, all with equal number of stars. Their result was confirmed and updated by Aumer & Binney (2009), who used the new reduction of Hipparcos data (van Leeuwen, 2007) and a 27 per cent larger sample, with more blue stars. They re-calculated the velocity dispersion ratios as function of color and found a very good agreement also with the results from radial velocities from the Geneva-Copenhagen Survey (Nordström et al., 2004), in the range of red stars.
Some authors have recently extended the study of the stellar velocity ellipsoid of the Milky Way disc to a larger volume of the solar neighborhood. Smith et al. (2012) made use of SDSS Stripe 82 proper motions (Bramich et al., 2008) of 7280 dwarf stars, which they divided into three ranges in metallicity. They fitted the radial and vertical velocity distributions using maximum likelihood methods for different distances from the mid-plane (up to 2 kpc). Other 16 276 stars from SDSS, this time G-dwarfs from SEGUE (Yanny et al., 2009), were used by Büdenbender et al. (2015). They constructed Jeans models to fit the orbital properties derived by Liu & van de Ven (2012). They studied the shape of the SVE in the meridional plane, between 0.5 and 3.0 kpc away from the Galactic plane, for different metallicities. Binney et al. (2014b) analysed the kinematics of 400 000 stars from the RAVE survey (Steinmetz et al., 2006), in a region within 2 kpc of the Sun. Probability density functions in distance modulus were determined by Binney et al. (2014a). Proper motions were drawn from the UCAC4 catalogue (Zacharias et al., 2013). Binney et al. (2014b) mapped for different distances from the Galaxy plane.
In this context, light-weighted SVE measurements in external galaxies might be dominated by the young and more metal-rich thin disc. Nevertheless, the light is still integrated over the line of sight so that the thick disc has probably an important contribution (Yoachim & Dalcanton (2006) estimated the thick disc contribution to be between 10% and 40% of the total luminosity of the galaxy, depending on its mass). Since we do not have any fair criterion to weight the different populations, we have decided to adopt, for the shape of the Milky Way disc ellipsoid, an average of the results of all the mentioned studies.
2.2 Velocity dispersions of edge-on galaxies: surface photometry
For edge-on galaxies, it is not possible to measure directly (with spectroscopy) the vertical component of the velocity dispersion. van der Kruit & de Grijs (1999) proposed a method for its indirect estimate from surface photometry. They showed how to calculate the radial and vertical stellar velocity dispersions, with simple equations, knowing the radial scale length and the scale height of the disc. The following assumptions were necessary: exponential disc surface brightness radial profile, self-gravitating stellar disc (which can be approximated by an isothermal sheet), constant mass-to-light ratio () and flat rotation curves. They applied their model to 40 edge-on late-type galaxies, most of them selected from the sample of de Grijs (1998), (e.g. inclination , angular blue diameters arcmin, non-interacting, and discarding S0 and Sa because the assumptions needed in this method were not valid, in particular the self-gravitating disc). The surface photometry and the structural parameters were already available, as well as HI observations which were used to estimate the gas-to-total disc mass.
They used the relations between the radial velocity dispersion, the radial scale length, the vertical dispersion and the scale height as explained in van der Kruit & de Grijs (1999). The radial component of the velocity dispersion tensor () was measured, at one photometric scale length in the band, using the empirical relations of Bottema (1993). The vertical component (), was computed (also at one scale length) assuming a Toomre parameter of 2 (Toomre, 1964). While they published the results by combining the individual measurements by morphological type, they kindly gave us access to values for 31 galaxies in the de Grijs (1998) sample.
2.3 decomposition from spectroscopic data
After the Milky Way, the first object with a measurement of the vertical-to-radial velocity dispersion ratio was the Sb galaxy NGC 488 (Gerssen et al., 1997). They presented a new way of extracting the three components of the velocity ellipsoid, from long-slit spectroscopic observations of the line-of-sight velocity dispersion () along the major and minor axes in intermediate-inclined discs. It used the epicycle approximation to relate with and the asymmetric drift equation to connect the circular velocity (described by a power-law) to the stellar rotation curve. Exponential radial profiles, with the same scale length, were assumed for both the radial and the vertical velocity dispersions. This implied that was assumed constant with radius in the disc-dominated region. The model had five free parameters which were fitted simultaneously to the major and the minor axes data. Since it was designed for the disc, it was applied only to the disc-dominated regions.
Later, Gerssen et al. (2000) used the same procedure to study the SVE of the Sab NGC 2985 (see also Noordermeer et al. 2008). The circular velocity, obtained from emission-line measurements in the gas disc, was included in the procedure. Shapiro et al. (2003) added four more galaxies and improved the previous results by Gerssen et al. (1997) and Gerssen et al. (2000) for NGC 488 and NGC 2985. Their study of the SVE along the Hubble sequence was completed with two later-type galaxies (NGC 2280 and NGC 3810) in Gerssen & Shapiro Griffin (2012). The same methodology was also applied by several authors to long-slit and integral-field observations (see e.g. Westfall et al., 2005; Westfall et al., 2011; Gentile et al., 2015).
2.4 Dynamical models: Schwarzschild, three integral and Jeans methods
Two-integral and three-integral models were used by Emsellem et al. (1999) to fit the photometry and kinematics of the S0 NGC 3115. Given that this galaxy has a double disc structure (e.g. Emsellem et al., 1999), for the outer Freeman type II disc they constructed a three-integral model and recovered the ratio in the meridional plane. In this paper, we use the mean value from 12 kpc, where the outer disc starts to dominate the surface brightness.
Cappellari et al. (2006) built dynamical models, based on the Schwarzschild (1979) numerical orbit-superposition method, for 24 elliptical and lenticular galaxies part of the SAURON sample (de Zeeuw et al., 2002). This subsample was selected because it had accurate distance determination, availability of HST photometry, and did not present strong evidence of bars. The global anisotropy in the meridional plane was determined in Cappellari et al. (2007), and parametrized with . From the set of 24 galaxies, we include 8 lenticular galaxies in this work. The values of were calculated within one effective (half-light) radius, including not only the disc but also the central region of the galaxies. Following Gerssen & Shapiro Griffin (2012), we decided to include those results in our compilation, as the SAURON measurements should be biased towards the equatorial plane and also disc regions (given the extent of the aperture used).
Tempel & Tenjes (2006) produced a model, based on Jeans equations, of the Sombrero galaxy (M 104, NGC 4594). They used the averaged major-axis kinematics from previous literature works (Kormendy & Illingworth, 1982; Carter & Jenkins, 1993; Hes & Peletier, 1993; van der Marel et al., 1994; Emsellem et al., 1996; Kormendy et al., 1996) and they determined the and radial profiles, as well as the orientation of the stellar velocity ellipsoid. In this paper, we adopt the mean value of in the disc-dominated range, between 2 and 10 kpc approximately. In a recent work, Kipper et al. (2016) studied the SVE of our neighbor galaxy M 31. It is a well known galaxy and its major axis kinematics had been measured several times (McElroy, 1983; Kormendy, 1988; van der Marel et al., 1994; Kormendy & Bender, 1999). The mass distribution was taken from Tamm et al. (2012), who used a three-component model with a stellar bulge, a stellar disc and a dark matter halo. Jeans equations were used by Kipper et al. (2016) with an approach similar to Tempel & Tenjes (2006). The ellipsoid axis ratios were plotted in two different radial profiles for the bulge and the disc. We consider the mean value of in the disc for the purpose of this paper.
3 The observed SVE - Hubble type relation
As mentioned in § 1 and § 2, several works in the literature (e.g. Dehnen & Binney, 1998; Merrifield et al., 2001; Gerssen & Shapiro Griffin, 2012; Aumer & Binney, 2009; Aumer et al., 2016) have suggested that the shape of the stellar velocity ellipsoid can be used to unveil different heating mechanisms. In addition, if the sources of disc heating were different for early and late-type galaxies, their SVE should have different shapes and show a trend along the Hubble sequence. We revisit these claims here by analysing all the observational results we could find in the literature on this issue. We present all these values of in Table 1.
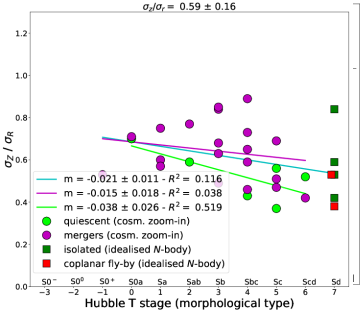
Figure 1 shows all the literature values as a function of morphological type. Data points have been divided and represented with different colors and symbols according to the method used, as described in § 2. The first thing to notice is that no clear correlation is found, opposed to the strong trend found by Gerssen & Shapiro Griffin (2012). A linear regression to all the points111Upper-limit values, as indicated in Table 1 and Figure 1, have not been taken into account. (weighting by their uncertainties) yields a slope of , with a coefficient of determination (, defined as the square of the correlation coefficient) of 0.15. This indicates a very poor correlation between the axis ratio of the SVE and the morphological type. Gerssen & Shapiro Griffin (2012) sample gives a slope of with an of 0.86.
The lack of a strong correlation is apparent in several individual datasets. The van der Kruit & de Grijs (1999) sample is the largest and does not show any trend for their 31 galaxies, mostly very late types. One could argue that the (photometry based) technique employed is the cause for such discrepancy. Nonetheless, it uses approximations similar or common to other methods (e.g. exponential disc and isothermal sheet). Furthermore, the kinematics of 15 galaxies (11 in common with van der Kruit & de Grijs 1999) was modeled, now using spectroscopy (Kregel et al., 2004), by Kregel & van der Kruit (2005). Their vertical-to-radial velocity dispersion ratios, plotted in Fig. 6(a) of Kregel et al. (2005), range between 0.5 and 0.9 for Hubble types between Sb and Scd222They could not provide us the individual values of the plotted points nor the Hubble types they corresponded to. For this reason we have not been able to include them in Table 1 and Figure 1.. Therefore, spectroscopic and photometric samples are compatible with each other and both point towards a picture where late types can have nearly isotropic SVE.
Westfall et al. (2005) and Gentile et al. (2015) data points were computed using the same methodology as Gerssen & Shapiro Griffin (2012), and yet they present very different values at a given morphological type. Two of these late-type galaxies display rather prolate ellipsoids (with ) suggesting that vertical agents must have been predominant. In their work, Gentile et al. (2015) excluded important recent mergers as responsible for this heating, due to the regular morphology and kinematics. While these prolate ellipsoids may seem odd, there are several examples in our compilation, all of them coming from different sources and methodologies (see Table 1). They might be related to a real phenomenon that we cannot explain yet, or be unreal and due to a general failure, common to the different methods, in reproducing the disc physics. Even Gerssen & Shapiro Griffin (2012) found a slightly vertically elongated ellipsoid for NGC2775, but considered the value of an upper limit. The two galaxies from Westfall et al. (2005) come from an unrefereed publication and hence they are indicated with different symbols (diamonds) in Fig. 1. We decided to include them because they were obtained using the same method as others and they are in agreement with others.
For the Milky Way we indicate in Table 2 the individual results for , from the different studies mentioned in § 2.1. They have been averaged over the different regions and ranges indicated in the third and the last columns of the Table, weighting with the number of stars in each bin or group when this was available. Errors have been estimated as the (weighted) standard deviations of the samples. Dehnen & Binney (1998) believed that their value for the local solar neighborhood was the result of the contributions of both spiral structure and scattering by molecular clouds to the disc heating. For reference, Aumer & Binney (2009) found from 0.33 for the bluest to 0.6 for the reddest stars in the Hipparcos catalogue. For the extended solar neighborhood, an increase in the kinematic isotropy for lower metallicities and larger distances from the Galactic plane was generally found. Binney et al. (2014b) gave 0.6 as approximation for of giant and cool dwarf stars in the sample. For hot dwarfs, we have adopted the value given for the plane ( 0.48) since the velocity dispersions increased slowly with distance from the plane.
The range of values in Table 2 shows the lack of universal agreement on the global value of in the solar neighborhood. Different SVE shapes can be found even in the same galaxy, depending on the analysed populations. Results are sensitive to differences in color, metallicity, distance from the mid-plane and type of stars. We averaged the different results in Table 2, weighting with the number of stars (in the second column of Table 2), to find the value indicated in Table 1 for the Milky Way. The uncertainty has been estimated as the weighted standard deviation of the ensemble of samples. This value is represented with a purple star in Fig. 1, where the purple shade shows the range of where the results in Table 2 lie.
Kipper et al. (2016) plotted the radial and vertical profiles of , separately for the bulge and for the disc of M 31, showing that the bulge has radial velocity dispersions far larger than the disc. They also determined the orientation and axial ratios of the velocity ellipsoids of the two structural components along a meridional plane of the galaxy. While the ellipsoid stays almost spherical throughout the bulge component, the disc ellipsoid is nearly isotropic only near the rotation axis, and flattens out towards the most external radii.
For completeness, we also show the SVE values for the early-type galaxies in the SAURON survey (Cappellari et al., 2007). They have nearly isotropic ellipsoids, which is expected as they are the average within one effective radius (), and thus include the bulge component. They should be considered as upper limits to the real of their discs.
The main conclusion one can draw from Fig. 1 is that the relation between the shape of the SVE (using the ratio) and Hubble type is much weaker than previously reported. The earliest-type disc galaxies do not have necessarily isotropic ellipsoids and the latest types show a wide range of values. Therefore there must be different factors affecting the shape of the SVE of galaxies of the same morphological type. At the same time, different Hubble types can have the same ellipsoid shape. It is thus logical to wonder whether they are affected by the same heating mechanism or if different mechanisms can lead to the same ratios. However, since the region of late-type galaxies (in Fig. 1) is completely dominated by the results from van der Kruit & de Grijs (1999), who used photometry, more results from spectroscopic observations would be necessary to confirm this picture.

4 Numerical simulations
We describe here the two sets of numerical simulations used in this work. We use them to extract information of the SVE shape for comparison with the observational data and to explore the impact of different mechanisms.
4.1 Disc galaxies from zoom-in cosmological simulations
We determine the SVE information from the stellar kinematics of 26 simulated Milky-Way-mass spiral galaxies by Martig et al. (2012), created with the purpose of studying galaxy evolution in a cosmological context. Martig et al. (2012) used a method that consisted in coupling cosmological with galactic scale simulations at much higher resolution. The technique is based on two steps: extracting the merger and gas accretion histories (and geometry) of dark matter halos in a large-scale -CDM cosmological simulation, and then re-simulating these histories at very high resolution, replacing each halo by a realistic galaxy.
The cosmological simulation was performed with the Adaptive Mesh Refinement code RAMSES (Teyssier, 2002). The simulation box had a comoving length of 20 Mpc and contained dark matter particles of M☉ each. The cosmological constants in the -CDM were set as follows: = 0.3, = 0.7, = 70 km s-1 Mpc-1 and = 0.9. The merger and diffuse accretion histories of a halo were extracted by tracking halos and diffuse particles (not gravitationally bound with any halo). The position, velocity and spin of each incoming satellite were recorded as well as the date of the interaction.
Each halo of the cosmological simulation (i.e. the main halo as well as all the interacting satellites) was then replaced with a realistic galaxy, made up of gas, stars and dark matter particles. The diffuse particles were replaced by a blob of gas and dark matter particles of lower mass and higher resolution. The total mass of the galaxy was divided in 20% of baryons and 80% of dark matter (the mass of dark matter being given by the cosmological simulation). The new simulation followed the evolution of the main galaxy from redshift = 5, included an area of 800 kpc, to = 0. The re-simulation was done by means of the Particle-Mesh code described in Bournaud & Combes (2002), with a spatial resolution of 150 pc, a time step of 1.5 Myr and a particle mass of M☉ for gas, M☉ for stars and M☉ for dark matter. A sticky-particle model was used for gas dynamics, and a Schmidt-Kennicutt law (Kennicutt, 1998) for star formation, while supernovae feedback was introduced in the form of kinetic energy. In each galaxy substituting the dark matter halo from cosmological simulation, particles were already distributed in the morphological components. The disc, made of gas and star particles, was modelled with a Toomre profile (Toomre, 1963), while the bulge, made of stars, as a Plummer sphere (Plummer, 1911). A Burkert profile (Burkert, 1995) was used for the dark matter halo.
Finally, the targeted galaxies were chosen to have a halo mass between and M☉ and to be relatively isolated. They were distributed all across the cosmological simulation box, but avoiding the densest regions. They had different evolution histories, but most of them underwent mergers at some stage of their life-time. They have a wide range of bulge-to-total () ratios and morphological types.
4.2 Idealised N-body simulations
In order to enrich our simulation sample with extremely late types and establish the influence of purely secular evolution processes in galaxies in total isolation, we also added to our study a small sample from idealised N-body simulations by Martinez-Valpuesta et al. (2006, 2017). They used the FTM-4.4 version of the N-body code from Heller & Shlosman (1994) and Heller (1995). The initial density distribution was derived from the disc-halo analytical model of Fall & Efstathiou (1980). The disc was created exponential, with an initial scale length of 1.36 kpc and a Toomre parameter fixed at 1.5. Regarding the velocity dispersion calculations, the initial was set from the Toomre parameter and the surface brightness profile. The initial ratio was fixed to 0.6, a value commonly adopted in the literature (e.g. van der Kruit & Freeman, 1984; Bershady et al., 2011), to define the initial .
We considered here a sample of six simulated galaxies. Four of them, identified by labels from I0 to I3, were allowed to evolve in isolation during the full simulation lifetime (14 Gyr). All of them are bulgeless and were made with a disc and a dark matter halo, each one with particles at the beginning of the simulation. They differ from each other in the mass and dark matter fraction. The total mass decreases from I0 to I3, in a range between M☉ (I3) and M☉ (I0). I0 contains 80% of dark matter of the total mass budget within a sphere of radius 5 kpc, while I1 contains 57%. The I2 and I3 simulations have 38% and 7% of dark matter fraction within 5 kpc, respectively.
These simulations were created with the purpose of studying the mechanisms triggering the formation of bars, both in isolation and induced by interactions. For this reason, the two simulations I0 and I1 were redone but now with a galaxy fly-by and then left in isolation for 5 Gyr. The interaction was modelled with the impulse approximation (see Martinez-Valpuesta et al., 2017). This means assuming that the energy exchanged during the interaction had been injected as kinetic energy to the host galaxy, whose reorganization within its potential happened after the fly-by had finished. The tidal approximation (Binney & Tremaine, 1987) was also used. The perturber galaxy was assumed to have the same mass and size of the host and to orbit hyperbolically in the disc plane of the host.
4.3 Adequacy of numerical simulations
The balance between the three-dimensional and the radial heating, the birth of new cooler young stars and how hot the older stars were born, determines the evolution of the stellar velocity ellipsoid shape. We have assessed these factors in our simulations, in order to assure ourselves that the results were adequately modelled. While other authors opted for only GMCs as vertical heating source (e.g. Aumer et al., 2016), in our zoom-in cosmological simulations we have instead a large variety of mergers, of different mass ratios and occurring in different planes and at different times.
As non-axisymmetric heating sources, bars in our idealised N-body simulations match very well to real galaxies. Although not made for this purpose, Martinez-Valpuesta & Gerhard (2011, 2013) and Gerhard & Martinez-Valpuesta (2012) showed how one of these simulated galaxies (here called I1) reproduces the Milky Way bar and the corresponding boxy-bulge vertical metallicity gradient. These simulations have been also compared to nearby galaxies, by different authors. Seidel et al. (2015, 2016) quantified the influence of bars on stellar kinematics and populations. Molaeinezhad et al. (2016, 2017) studied bulge properties and cylindrical rotation in barred galaxies. Font et al. (2017) analysed bar rotation and evolution. All of them found a good agreement between these simulations and observed galaxies. Kraljic et al. (2012) studied bar formation and evolution in our zoom-in cosmological simulations, as well as the bar fraction in spiral galaxies, performing an analysis whose results were totally compatible with properties of real bars (e.g. length and strength).
A study on the effect of bars on the disc SVE shape was carried out by Martinez-Valpuesta et al. (2006), based on a disc simulation similar to our idealised N-body simulations sample. In Fig. 6 of their paper, the disc is affected very locally by the early evolution of the bar. A first bar growth just after its formation flattens the SVE by increasing . Then isotropy is rapidly reached thanks to the buckling (what they call "first buckling"). In our study, we take into account only the disc-dominated region, in order to perform an analysis as similar as possible to observational works. Therefore, these early effects on the inner disc do not leave any signature on our final SVE. Nevertheless, according to Martinez-Valpuesta et al. (2006), the later bar evolution does affect the kinematics of the outer disc. The final result comes from a trade-off between a potential secondary buckling, heating vertically, and the bar secular growth, heating radially. In our full simulations sample, no considerable effect of the buckling has been detected in the disc SVE, while an increase in can be easily related to the secular growth of the bar.
Spiral arms, another non-axisymmetric feature affecting the SVE, have not been studied in our simulations yet. The measurement of their strength, or any other further analysis to quantify their impact on the disc heating, is beyond the scope of this paper. However, similar dynamical processes dominate the formation of both bar and spiral arms. For this reason we expect spiral arms to be as realistic as bars in both zoom-in cosmological and idealised N-body simulations. Disc kinematics in our simulations are comparable to observations of real galaxies (as shown in Fig. LABEL:fig:gal48 to LABEL:fig:gal146 for zoom-in cosmological simulations). This points towards a good modelling of the disc heating. Martig et al. (2014) compared the age-velocity relation (AVR) of some of their simulations with observations for the solar neighborhood, finding a very good match.
The birth of new stars can counteract the heating by other sources, and affect if their ellipsoid shape is considerably different from the pre-existing populations. If the star-forming gas has cooled down and no new process has heated it, recently born stars are expected to be dynamically cooler than the ones born in the past. We have checked that new stars are born with lower velocity dispersions in the three directions, in our zoom-in cosmological simulations (see § 5.3 for more details). In addition, Leaman et al. (2017) have recently compared (in Fig. 7 of their paper) the AVR in the Milky Way to one simulated galaxy from Martig et al. (2014). The latter not only matched the AVR in the solar neighborhood, but the velocity dispersion of its stars at birth, at different time steps, also matched the one of open clusters of different ages in the Milky Way disc.
However, very young stars in these simulations seem to be still too dynamically hot in their very first Myr of life, due mainly to the limited resolution and the gas density threshold for star formation, according to Martig et al. (2014). Some tests confirmed that an increase in resolution or in the star formation threshold does not affect the shape of the AVR. After the first 500 Myr, stars recover velocity dispersions similar to the Milky Way. In addition, a different balance between the vertical and radial velocity dispersions, in recently born stars with respect to the rest of the galaxy, would be necessary to change the global . For this reason, resolution and star formation recipe might not affect the shape of the SVE drastically. Very young stars are expected to have almost circular orbits and fulfil the epicycle approximation, with a typical azimuthal-to-radial velocity dispersion ratio around (Binney & Tremaine, 1987). This is true in these simulations and indicates that our modelling of the disc dynamics is reasonable.
In our idealised N-body simulations, we do not have either mergers nor star formation. The purpose of including these simulations was to reproduce the behaviour of simple discs that are left to evolve by themselves. The only agents capable of modifying the shape of the SVE are the ones related to secular evolution, giving reasonable values of similar to zoom-in cosmological simulations and observations.
5 Insights from numerical simulations
We now turn our attention to the predictions from the numerical simulations to get a better insight into the mechanisms underlying the SVE of spiral galaxies.
5.1 The simulated SVE - Hubble type relation
We present in Fig. 2 the vertical-to-radial velocity dispersion ratio as a function of the Hubble type for all the simulated galaxies. For zoom-in cosmological simulations, we assigned them a morphological type visually, by comparison with the observational sample classification. For all idealised N-body simulations, given that they are bulgeless galaxies, we approximated their Hubble type to Sd, i.e. the latest type.
The individual numerical values in Fig. 2 are shown in Tables 3 and 4. They are the medians computed within the disc-dominated region of the radial profiles, at the last time step of the simulations. The errors were computed as of the (radial) distribution. The disc radial range was defined as the one where the surface brightness profile could be fitted with an exponential. Thus, bulge and bar regions were excluded similarly to most observational results. The mean radial profiles for the individual dispersions were calculated by radially binning the star particles located at different azimuths. In this way, the effect of azimuthal variations was attenuated. However, we analysed these variations and verified that they were in general of the order of 5 - 10%, although larger in the outer disc of some galaxies with pronounced spiral structure.
Figure 2 shows that no major trend is found with Hubble type. In these simulations, we have the possibility of looking for correlations between events or processes undergone by the galaxy and the shape of the SVE. For this reason, we have color-coded quiescent and non-quiescent galaxies, for both types of simulations. In zoom-in cosmological simulations none of the galaxies has evolved in total isolation. The galaxies plotted with light green circles are relatively quiescent, in the sense that they have not had mergers larger than 1:20 in mass of the satellite versus host galaxy, after the first 5 Gyr of its lifetime (when we already had a stable disc).
No strong trend is seen globally for any given evolutionary path, although the light green circles suggest that quiescent galaxies SVE tend to be more isotropic for earlier types. A linear regression to these six points gives a slope of with an of 0.52, but more points would be needed to confirm this mild trend. Moreover, note that this relation is not observed in isolated galaxies in idealised N-body simulations (green squares). Like in observations, the lowest values of correspond to late-type spirals, which however show values in a wide axis ratio range. Quiescent and non-quiescent galaxies can have exactly the same ellipsoid shape. This is in agreement with the study by Martig et al. (2012) on the same set of zoom-in cosmological simulations. For disc-dominated galaxies, they found a correlation of the bulge-to-total light fraction not only with the merger history at , but also with the gas accretion at . More prominent bulges correspond to more active merger and/or gas accretion histories. Curiously, some of the bulges with the highest Sérsic indexes were formed in absence of strong merger activity but with an early intense gas accretion together with an early bar formation or other disc instabilities. This suggests that there are different possible pathways to form a bulge, as Bell et al. (2017) confirmed observationally. In their sample, small pseudobulges were consistent with a quiet merger history and pointed to other formation mechanisms like gas accretion, disc instabilities or secular evolution. Some massive classical bulges were compatible with a merger origin, but others needed to invoke alternative mechanisms. Therefore, no strong trend is expected between merger activity and morphological types, either.
While in observations, including early-type disc galaxies, the distribution of has a slightly higher mean value of 0.7 0.2, these simulations suggest that the vast majority of spiral galaxies have a vertical-to-radial axis ratio around 0.6 0.2. This would partly justify the common adoption of similar values in the literature (e.g. van der Kruit & Freeman, 1984; Kregel et al., 2005; Bershady et al., 2011; Martinsson et al., 2013). It is important to remember that idealised N-body simulations had this 0.6 as an initial condition, perhaps affecting somewhat the resulting ratios to be around this value, though with large scatter. On the contrary, no similar initial condition was set in zoom-in cosmological simulations. This simple result indicates that the vertical-to-radial axis ratio of the velocity ellipsoid appears to be a poor predictor of the dominant mechanism driving its shape. This finding is in agreement with the observational results presented in § 3, and highlights the complexity of interpreting the ratio.
Also in idealised N-body simulations, discs evolved in total isolation have ratios extending in a wide range of values. We have not found a direct correlation of the values with the dark matter fraction. A particular case is the isolated galaxy I0_no_bar (see Table 4) which, with an 80% of dark matter in the central 5 kpc, did not have the conditions to form any bar (Martinez-Valpuesta et al., 2017). The cool disc of this galaxy, with low absolute values of the individual velocity dispersion components, has one of the most isotropic SVE in the full simulations sample. Nonetheless, if this same disc undergoes a fly-by in the galaxy plane (with 1:1 mass ratio), this triggers the bar formation, causes a disturbance in the same plane which enhances , and flattens the ellipsoid (i.e. I0_inter in Table 4). The same happens to the galaxy I1, where jumps down after the same interaction (I1_inter).
5.2 Disentangling different processes from the SVE shape
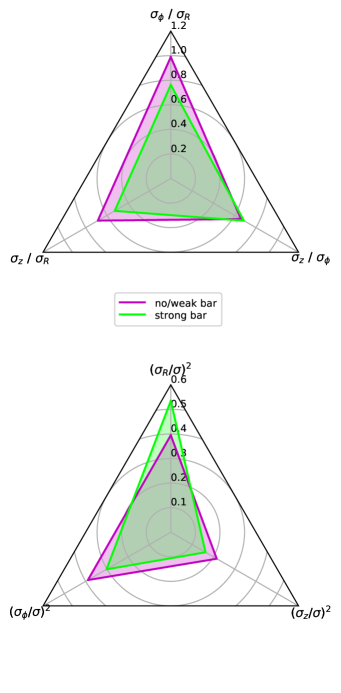
Here we study in more detail the impact of some disc heating agents on the final shape of the SVE. This is shown in Fig. 3 and 4, where the top panel shows the average axis ratios at the end stage of zoom-in cosmological simulations. The bottom panel presents the average of the square individual components, normalised by the square total dispersion defined as: = + + . In this way, it becomes clearer what is the most prominent axis of the SVE and helps us to remove any potential dependence on the galaxy mass. Our zoom-in cosmological simulations allow us to specifically study the effect of mergers and also the action of bars. The effect of spiral arms is more complex to isolate, but will be discussed to some extent in the next section.
We focus first on the effect of mergers on the shape of the SVE (Fig. 3). We divided the zoom-in cosmological simulations into three groups according to their evolution after the first 5 Gyr of life, a time when in general the disc appearance starts to be similar to the final one. The first group (in blue) is made of relatively quiescent galaxies, with no mergers with mass ratios larger than 1:20 (i.e. light green points in Fig. 2). The second group (in green) includes galaxies with “low-mass” mergers (i.e. 1:20 to 1:10 mass ratios). Finally, the third group is plotted in red and corresponds to the strongest mergers, with mass ratios larger than 1:10 (up to 1:3). The distributions of the second and third groups are not substantially different in Fig. 2, hence we plot them together in purple - only their average values are somewhat different from one another, as shown in Fig. 3.
We see in both panels that, on average, stellar velocity ellipsoids are more isotropic (i.e. axis ratios closer to 1 and individual components similar in amplitude to each other) when high-mass ratio mergers have taken place (red triangles). For in particular, high-mass mergers have a ratio 8% larger than low-mass mergers. For the same axis ratio, a substantial difference is observed between galaxies with mergers and more quiescent galaxies. For the latter, is 14% lower than for galaxies affected by 1:20-to-1:10-mass-ratio mergers.
The bottom panel shows that the (normalized) vertical component () is larger when high-mass-ratio encounters have occurred, and lower for more quiescent systems, where the radial component () is more prominent (perhaps highlighting the prevalence of spiral arms or bars). Low-mass mergers can increase the contribution of to the total dispersion, being an intermediate case with respect to the high-mass mergers and quiescent galaxies. However, the contribution of in these galaxies is similar to the quiescent group.
To complete our analysis, we assess the influence of bars in Fig. 4. Galaxies have been classified into two groups according to the bar-to-total light ratio, based on the photometric decomposition. Components with bar-to-total ratio above 10% are considered strong bars and weak or no bars for values below 6%. The figure suggests that bars (on average) are related to an enhancement of the radial component of the velocity dispersion. Consequently, galaxies with bars tend to have flatter ellipsoids (with and ratios smaller than in unbarred galaxies). The idealised N-body simulations sample, with the only unbarred galaxy with a remarkably higher , is also in agreement with this trend.
While simulations allow us to see somewhat more clearly the effects of distinct mechanisms on the shape of the SVE, this is more difficult to capture in observations as differences are often subtle. In addition, different agents could have acted simultaneously in real galaxies. The high scatter of the points even in groups with similar mergers history (presented in Fig. 2) emphasizes this issue. Also, fly-by encounters can be important in enhancing one or another component of the velocity dispersion, as we have seen in idealised N-body simulations. It is therefore likely that the particular dominance of one mechanism over others depends on the specific situations, which makes the shape of the SVE a not so obvious diagnostic to unveil the main mechanism influencing the dynamical heating of discs.

5.3 Time evolution of the SVE shape
Another interesting aspect to analyse in our simulations is the evolution of the shape of the SVE with time. This gives us information about how long a particular disc heating mechanism (e.g. mergers) influences the SVE shape. In Fig. LABEL:fig:gal48 to LABEL:fig:gal146 we plot the changes of the individual components and axis ratios of the SVE as a function of time, for five galaxies representative of the variety of cases. Of each group in Fig. 2, we show one of the most and one of the least isotropic SVEs. Finally, we added one more quiescent galaxy as an example of continuously changing . The shaded areas mark the 16% and 84% percentiles of the values calculated over the disc radial profiles. They are, at each specific time, the mean value in the radial profile and its 1 error bar. The radial profiles are the mean of all the star particles. Therefore these plots include, at a specific time, disc stars of all the previously born populations. In addition, we plot snapshots of the face-on and edge-on views of the simulated galaxies in order to determine the potential link between the shape of the SVE and galaxy morphology.
Mergers happen at different times in the life of different galaxies. In Fig. LABEL:fig:gal48 we show the evolution of an Sbc galaxy (galaxy_48). We see that the three dispersions, especially , after declining around the age of 6 Gyr, increased steeply when the galaxy suffered from a 1:8 and a 1:4 mergers between the age of 7 and 8.5 Gyr, indicated with vertical lines. Consequently, also increased to a value of 0.9. After the age of 9.2 Gyr, the disc globally cooled down for little more than one Gyr and then the dispersions stayed approximately constant. In spite of this cooling, the vertical-to-radial ratio ended in , much higher value than the initial ( 0.55 at 4.7 Gyr). This is not the case of galaxy_106, a barred Sc type, with a final of , much lower than the initial value ( 0.8 at 4.7 Gyr). Although this galaxy went through a long 1:5 merger from 6 to 7 Gyr, it ended up with a quite flattened ellipsoid, as shown in Fig. LABEL:fig:gal106. The disc cooled down until 8 Gyr, then dispersions stayed approximately constant.
Martig et al. (2014) studied the effect of mergers on the age-velocity relation (AVR) of a sample including galaxy_48 and galaxy_106. In Fig. 2 of their paper, both galaxies exhibit jumps in their AVR at the age corresponding to the end of the mergers. For galaxy_48 the jump is more pronounced and the gas took much longer to cool down and give birth to cooler young populations. This is probably due to the fact that the mergers happened later, when the disc had already cooled down and new populations had a lower , being more sensitive. A small thin disc was also appearing, but during the merger epoch it became even thicker than before (see snapshots). In contrast, in galaxy_106 the merger happened when the stellar disc was still thick and dynamically hot. In that time, internal as well as external perturbations had little effect so that the merger did not affect visibly the mean SVE shape. In addition, an almost imperceptible increase of the radial plus decrease of the vertical dispersions, was sufficient to make drop, between 9.5 and 11.5 Gyr, from 0.8 to 0.37 (Fig. LABEL:fig:gal106). The origin of this gentle process could reside in the spiral density waves of this very late-type galaxy or the bar evolution, since it took place just after the spiral arms and the bar appeared (see snapshots in Fig. LABEL:fig:gal106). This picture provides a potential explanation for the differences in the SVE evolution of the two galaxies.
We also show two examples of quiescence in Fig. LABEL:fig:gal128 and LABEL:fig:gal86, galaxy_128 being barred and galaxy_86 unbarred. The first one, an Sc, exhibits the flattest ellipsoid in the sample (at the final step of the simulation). After a disc cooling already finished at 7.3 Gyr, velocity dispersions remained approximately constant, if only with a slight increase of over time. This was likely related to the development of the bar, the spiral structure and the thin disc (see snapshots in Fig. LABEL:fig:gal128). It was in fact enough to transform the ellipsoid from initially quite isotropic to much flatter, as seen in the bottom panel of the figure. The ellipsoid of galaxy_86, one of the earliest types, on the contrary was quite isotropic from the start, and it barely changed during its quiescent path. Between its 6 and 8 Gyr of life, the disc cooled down at the same rate in the vertical and the radial direction, but it heated remarkably in the azimuthal direction. This means that stars rotation became more disordered instead of ordered (as we have seen, discs typically cool down in the three directions meanwhile they acquire their final appearance). The peculiar properties of this disc are probably related to its morphology: it is photometrically smaller and thicker than galaxy_128, with almost no spiral arms (see snapshots in Fig. LABEL:fig:gal86).
Finally, in Fig. LABEL:fig:gal146, we show a relatively quiescent disc, born with an isotropic ellipsoid which became oblate and then flattened. During the disc cooling around 8 Gyr, dropped faster than , making the vertical-to-radial ratio larger than one. The snapshots indicate that the morphology of the galaxy drastically changed at that moment in time, from a small galaxy with no clear evidence of a disc to a fully grown spiral galaxy. From that time on, the ratio has decreased steadily to a value of .
These examples lead us to some general deductions. First, all the discs seem to cool down before they acquire their final appearance (e.g. extended, fully formed and with spiral arms). The contribution of recently born stars can help us to understand the nature of this cooling. We have compared the kinematics of stars younger than 300 Myr to the composition of all populations. The former have a degree of cooling that depends on the specific galaxy and time, if no mechanism heats dynamically the gas. During the mergers, they reach the velocity dispersions of the global galaxy, but afterwards they recover the previous values very soon. Thus, a merger can delay the forthcoming cooling or make it more gentle, but cannot prevent it. Its signature can be erased by the appearance of new stars when enough time has passed.
The cooling observed in Fig. LABEL:fig:gal48 to LABEL:fig:gal146 was driven by the increasing contribution of new cooler stars. The latter were characterized by an earlier and faster drop (in around one Gyr) in the individual dispersions, during the formation of the thin disc. A delay was seen between the cooling of gas (new stars) and the cooling of the global galaxy stellar component. An increase in the radial dispersion, driven by secular evolution, was also clearer in newly born stars compared to stars of all ages, where it was smoothed. Despite this, the shape of the ellipsoid is not necessarily less isotropic for recently born populations. The shape comes from the balance between cooling or heating in the different directions, and therefore can be quite varied. For the two quiescent galaxies, galaxy_128 and galaxy_86, the same values of are measured for very young stars and for all populations. The remaining three galaxies analysed in this subsection have globally a more isotropic ellipsoid than recently born stars alone.
Secondly, the time in which we look at the ellipsoid is relevant. In some galaxies (e.g. galaxy_48, galaxy_106, galaxy_128 and galaxy_146) we would find an isotropic or anisotropic ellipsoid depending on when we look at it. Although at the final step of the simulations we do not have values of either larger than one or much smaller than 0.4, we do have them during the evolutionary path of some galaxies, in agreement with the observational results in those ranges. Third, changes in the SVE shape are not necessarily related to disc heating, understood as an increase in velocity dispersions. These changes can also be caused by a decrease in radial or vertical dispersions, or an increase in both direction but in different amounts. Lastly, the vertical-to-radial ratio is more or less sensitive to small changes of and (few km s-1), depending on their absolute values. Therefore in some very late types the slight increase in , contemporary to the appearance of the spiral structure, is sufficient to flatten the SVE but impossible to detect in observations and very sensitive to any other stronger process. For these reasons might not be the best indicator of a disc heating or cooling, and even less helpful to distinguish between individual heating agents.
6 Conclusions
We have gathered all the published studies analyzing the shape of the stellar velocity ellipsoid in galaxies. Aiming to extend the study done by Gerssen & Shapiro Griffin (2012), we have plotted the vertical-to-radial axis ratio as a function of Hubble type for 55 galaxies. No strong correlation has been found and the points are distributed with a large scatter around a mean value of .
In general, the other works included in this paper are not in agreement with Gerssen and Shapiro’s trend. This could be partially explained by the fact that their sample was carefully selected, as they explained (e.g. Shapiro et al., 2003), for having "optically regular-looking morphologies" and the typical appearance of their specific Hubble type. Our sample includes 55 galaxies of all kinds and suggests a much more complicated picture. Disc galaxies of early types can have more anisotropic ellipsoids than what their trend predicted, and late types can have ellipsoids covering all shapes. If it is true that different shapes correspond to different heating mechanisms, both early and late-type spirals can be affected by the same processes. At the same time, morphologically similar galaxies can be affected by different sources of disc heating.
We have used two different kinds of simulations to understand better this observational scenario, and they confirmed this picture. The SVE’s flattening does not show a clear trend along the Hubble type either in simulations. The average value is around 0.6 with a scatter of . Idealised N-body simulations confirm that late-type galaxies can have different kind of ellipsoids. Their shape does not show any direct relation with the distribution of the dark matter. A relation between bars and the enhancement of the radial velocity dispersion is shown in zoom-in cosmological simulations. According to idealised N-body simulations, a fly-by in the disc plane also enhances and flattens the SVE. Furthermore, 1:10 to 1:3 mergers in zoom-in cosmological simulations predict ellipsoids that are more isotropic on average, while quiescent mechanisms (perhaps bars and/or spiral arms) tend to enhance with respect to the other components.
The scatter of is high also among galaxies with strong recent mergers and similar morphology. Evolution with time suggests that this axis ratio depends on the time when mergers happened and also on which snapshot of the galaxy life we are looking at. For instance, if just after a merger we see an isotropic SVE, its shape could change after some time.
In summary, the disc heating (cooling) scenario is complex and observations of the stellar velocity ellipsoid alone are insufficient to unveil it, due to the following reasons:
-
•
can be sensitive to small variations in one velocity dispersion component or two, perhaps not so relevant in terms of heating (cooling).
-
•
An isotropic ellipsoid can be related not only to an increase of the velocity dispersion in the vertical direction (heating), but also to a decrease in the radial direction (cooling), as well as to a static situation (if the SVE was born already isotropic). Likewise, anisotropy can be caused by a "radial heating" as well as a "vertical cooling".
-
•
When it comes to the different heating processes, the SVE results from the combination of them (e.g. mergers and spiral arms).
-
•
A given heating process can produce a variety of velocity ellipsoid shapes, depending on the time and the conditions in which it occurs.
-
•
Conversely, the same velocity ellipsoid can be achieved via a multitude of heating mechanisms.
The main outcome of this work is that additional information, beyond the stellar velocity ellipsoid, may be required to disentangle the heating agents in kinematic observations of galaxy discs. A potential way forward is to measure the velocity anisotropy separately for different stellar populations, to distinguish different mechanisms which happened at different moments along the life of a galaxy.
Acknowledgements
We are grateful to Prof. Piet van der Kruit and Prof. Richard de Grijs for kindly providing the individual measurements presented in van der Kruit & de Grijs (1999). FP acknowledges Fundación La Caixa for the financial support received in the form of a Ph.D. contract. FP, JFB, GvdV and RL acknowledge support from grant AYA2016-77237-C3-1-P from the Spanish Ministry of Economy and Competitiveness (MINECO). JMA thanks support from MINECO through the grant AYA2013-43188-P. GvdV and RL were supported by Sonderforschungsbereich SFB 881 "The Milky Way System" (subproject A7 and A8) of the Deutsche Forschungsgemeinschaft (DFG). GvdV acknowledges funding from the European Research Council (ERC) under the European Union’s Horizon 2020 research and innovation programme under grant agreement No 724857 (Consolidator Grant ArcheoDyn). RL acknowledges funding from the Natural Sciences and Engineering Research Council of Canada PDF award.
References
- Aumer & Binney (2009) Aumer M., Binney J. J., 2009, MNRAS, 397, 1286
- Aumer et al. (2016) Aumer M., Binney J., Schönrich R., 2016, MNRAS, 462, 1697
- Bell et al. (2017) Bell E. F., Monachesi A., Harmsen B., de Jong R. S., Bailin J., Radburn-Smith D. J., D’Souza R., Holwerda B. W., 2017, ApJ, 837, L8
- Benson et al. (2004) Benson A. J., Lacey C. G., Frenk C. S., Baugh C. M., Cole S., 2004, MNRAS, 351, 1215
- Bershady et al. (2011) Bershady M. A., Martinsson T. P. K., Verheijen M. A. W., Westfall K. B., Andersen D. R., Swaters R. A., 2011, ApJ, 739, L47
- Binney & Tremaine (1987) Binney J., Tremaine S., 1987, Galactic Dynamics. Princeton series in astrophysics, Princeton University Press
- Binney et al. (2014a) Binney J., et al., 2014a, MNRAS, 437, 351
- Binney et al. (2014b) Binney J., et al., 2014b, MNRAS, 439, 1231
- Bird et al. (2013) Bird J. C., Kazantzidis S., Weinberg D. H., Guedes J., Callegari S., Mayer L., Madau P., 2013, ApJ, 773, 43
- Bond et al. (2010) Bond N. A., et al., 2010, ApJ, 716, 1
- Bottema (1993) Bottema R., 1993, A&A, 275, 16
- Bournaud & Combes (2002) Bournaud F., Combes F., 2002, A&A, 392, 83
- Bramich et al. (2008) Bramich D. M., et al., 2008, MNRAS, 386, 887
- Büdenbender et al. (2015) Büdenbender A., van de Ven G., Watkins L. L., 2015, MNRAS, 452, 956
- Burkert (1995) Burkert A., 1995, ApJ, 447, L25
- Cappellari et al. (2006) Cappellari M., et al., 2006, MNRAS, 366, 1126
- Cappellari et al. (2007) Cappellari M., et al., 2007, MNRAS, 379, 418
- Carlberg et al. (1985) Carlberg R. G., Dawson P. C., Hsu T., Vandenberg D. A., 1985, ApJ, 294, 674
- Carter & Jenkins (1993) Carter D., Jenkins C. R., 1993, MNRAS, 263, 1049
- Casagrande et al. (2011) Casagrande L., Schönrich R., Asplund M., Cassisi S., Ramírez I., Meléndez J., Bensby T., Feltzing S., 2011, A&A, 530, A138
- Dehnen & Binney (1998) Dehnen W., Binney J. J., 1998, MNRAS, 298, 387
- Emsellem et al. (1996) Emsellem E., Bacon R., Monnet G., Poulain P., 1996, A&A, 312, 777
- Emsellem et al. (1999) Emsellem E., Dejonghe H., Bacon R., 1999, MNRAS, 303, 495
- Fall & Efstathiou (1980) Fall S. M., Efstathiou G., 1980, MNRAS, 193, 189
- Font et al. (2017) Font J., et al., 2017, ApJ, 835, 279
- Gentile et al. (2015) Gentile G., et al., 2015, A&A, 576, A57
- Gerhard & Martinez-Valpuesta (2012) Gerhard O., Martinez-Valpuesta I., 2012, ApJ, 744, L8
- Gerssen & Shapiro Griffin (2012) Gerssen J., Shapiro Griffin K., 2012, MNRAS, 423, 2726
- Gerssen et al. (1997) Gerssen J., Kuijken K., Merrifield M. R., 1997, MNRAS, 288, 618
- Gerssen et al. (2000) Gerssen J., Kuijken K., Merrifield M. R., 2000, MNRAS, 317, 545
- Grand et al. (2016) Grand R. J. J., Springel V., Gómez F. A., Marinacci F., Pakmor R., Campbell D. J. R., Jenkins A., 2016, MNRAS, 459, 199
- Guedes et al. (2011) Guedes J., Callegari S., Madau P., Mayer L., 2011, ApJ, 742, 76
- Heller (1995) Heller C. H., 1995, ApJ, 455, 252
- Heller & Shlosman (1994) Heller C. H., Shlosman I., 1994, ApJ, 424, 84
- Hes & Peletier (1993) Hes R., Peletier R. F., 1993, A&A, 268, 539
- Holmberg et al. (2009) Holmberg J., Nordström B., Andersen J., 2009, A&A, 501, 941
- House et al. (2011) House E. L., et al., 2011, MNRAS, 415, 2652
- Jenkins & Binney (1990) Jenkins A., Binney J., 1990, MNRAS, 245, 305
- Kazantzidis et al. (2008) Kazantzidis S., Bullock J. S., Zentner A. R., Kravtsov A. V., Moustakas L. A., 2008, ApJ, 688, 254
- Kazantzidis et al. (2009) Kazantzidis S., Zentner A. R., Kravtsov A. V., Bullock J. S., Debattista V. P., 2009, ApJ, 700, 1896
- Kennicutt (1998) Kennicutt Jr. R. C., 1998, ApJ, 498, 541
- Kipper et al. (2016) Kipper R., Tenjes P., Tihhonova O., Tamm A., Tempel E., 2016, MNRAS, 460, 2720
- Kormendy (1988) Kormendy J., 1988, ApJ, 325, 128
- Kormendy & Bender (1999) Kormendy J., Bender R., 1999, ApJ, 522, 772
- Kormendy & Illingworth (1982) Kormendy J., Illingworth G., 1982, ApJ, 256, 460
- Kormendy et al. (1996) Kormendy J., et al., 1996, ApJ, 473, L91
- Kraljic et al. (2012) Kraljic K., Bournaud F., Martig M., 2012, ApJ, 757, 60
- Kregel & van der Kruit (2005) Kregel M., van der Kruit P. C., 2005, MNRAS, 358, 481
- Kregel et al. (2004) Kregel M., van der Kruit P. C., Freeman K. C., 2004, MNRAS, 351, 1247
- Kregel et al. (2005) Kregel M., van der Kruit P. C., Freeman K. C., 2005, MNRAS, 358, 503
- Kroupa (2002) Kroupa P., 2002, MNRAS, 330, 707
- Leaman et al. (2017) Leaman R., et al., 2017, MNRAS, 472, 1879
- Liu & van de Ven (2012) Liu C., van de Ven G., 2012, MNRAS, 425, 2144
- Martig et al. (2012) Martig M., Bournaud F., Croton D. J., Dekel A., Teyssier R., 2012, ApJ, 756, 26
- Martig et al. (2014) Martig M., Minchev I., Flynn C., 2014, MNRAS, 443, 2452
- Martinez-Valpuesta & Gerhard (2011) Martinez-Valpuesta I., Gerhard O., 2011, ApJ, 734, L20
- Martinez-Valpuesta & Gerhard (2013) Martinez-Valpuesta I., Gerhard O., 2013, ApJ, 766, L3
- Martinez-Valpuesta et al. (2006) Martinez-Valpuesta I., Shlosman I., Heller C., 2006, ApJ, 637, 214
- Martinez-Valpuesta et al. (2017) Martinez-Valpuesta I., Aguerri J. A. L., González-García A. C., Dalla Vecchia C., Stringer M., 2017, MNRAS, 464, 1502
- Martinsson et al. (2013) Martinsson T. P. K., Verheijen M. A. W., Westfall K. B., Bershady M. A., Schechtman-Rook A., Andersen D. R., Swaters R. A., 2013, A&A, 557, A130
- McElroy (1983) McElroy D. B., 1983, ApJ, 270, 485
- Merrifield et al. (2001) Merrifield M. R., Gerssen J., Kuijken K., 2001, in Funes J. G., Corsini E. M., eds, Astronomical Society of the Pacific Conference Series Vol. 230, Galaxy Disks and Disk Galaxies. pp 221–224 (arXiv:astro-ph/0008290)
- Minchev & Quillen (2006) Minchev I., Quillen A. C., 2006, MNRAS, 368, 623
- Minchev et al. (2012a) Minchev I., Famaey B., Quillen A. C., Dehnen W., 2012a, in European Physical Journal Web of Conferences. p. 07002 (arXiv:1111.0195), doi:10.1051/epjconf/20121907002
- Minchev et al. (2012b) Minchev I., Famaey B., Quillen A. C., Di Matteo P., Combes F., Vlajić M., Erwin P., Bland-Hawthorn J., 2012b, A&A, 548, A126
- Minchev et al. (2012c) Minchev I., Famaey B., Quillen A. C., Dehnen W., Martig M., Siebert A., 2012c, A&A, 548, A127
- Minchev et al. (2013) Minchev I., Chiappini C., Martig M., 2013, A&A, 558, A9
- Molaeinezhad et al. (2016) Molaeinezhad A., Falcón-Barroso J., Martínez-Valpuesta I., Khosroshahi H. G., Balcells M., Peletier R. F., 2016, MNRAS, 456, 692
- Molaeinezhad et al. (2017) Molaeinezhad A., Falcón-Barroso J., Martínez-Valpuesta I., Khosroshahi H. G., Vazdekis A., La Barbera F., Peletier R. F., Balcells M., 2017, MNRAS, 467, 353
- Noordermeer et al. (2008) Noordermeer E., Merrifield M. R., Aragón-Salamanca A., 2008, MNRAS, 388, 1381
- Nordström et al. (2004) Nordström B., et al., 2004, A&A, 418, 989
- Perryman et al. (1997) Perryman M. A. C., et al., 1997, A&A, 323, L49
- Plummer (1911) Plummer H. C., 1911, MNRAS, 71, 460
- Roškar et al. (2013) Roškar R., Debattista V. P., Loebman S. R., 2013, MNRAS, 433, 976
- Saha et al. (2010) Saha K., Tseng Y.-H., Taam R. E., 2010, ApJ, 721, 1878
- Saha et al. (2013) Saha K., Pfenniger D., Taam R. E., 2013, ApJ, 764, 123
- Schwarzschild (1907) Schwarzschild K., 1907, Göttingen Nachr., 614
- Schwarzschild (1979) Schwarzschild M., 1979, ApJ, 232, 236
- Seidel et al. (2015) Seidel M. K., Falcón-Barroso J., Martínez-Valpuesta I., Díaz-García S., Laurikainen E., Salo H., Knapen J. H., 2015, MNRAS, 451, 936
- Seidel et al. (2016) Seidel M. K., Falcón-Barroso J., Martínez-Valpuesta I., Sánchez-Blázquez P., Pérez I., Peletier R., Vazdekis A., 2016, MNRAS, 460, 3784
- Sellwood & Carlberg (1984) Sellwood J. A., Carlberg R. G., 1984, ApJ, 282, 61
- Sellwood et al. (1998) Sellwood J. A., Nelson R. W., Tremaine S., 1998, ApJ, 506, 590
- Shapiro et al. (2003) Shapiro K. L., Gerssen J., van der Marel R. P., 2003, AJ, 126, 2707
- Smith et al. (2012) Smith M. C., Whiteoak S. H., Evans N. W., 2012, ApJ, 746, 181
- Spitzer & Schwarzschild (1953) Spitzer Jr. L., Schwarzschild M., 1953, ApJ, 118, 106
- Steinmetz et al. (2006) Steinmetz M., et al., 2006, AJ, 132, 1645
- Tamm et al. (2012) Tamm A., Tempel E., Tenjes P., Tihhonova O., Tuvikene T., 2012, A&A, 546, A4
- Tempel & Tenjes (2006) Tempel E., Tenjes P., 2006, MNRAS, 371, 1269
- Teyssier (2002) Teyssier R., 2002, A&A, 385, 337
- Toomre (1963) Toomre A., 1963, ApJ, 138, 385
- Toomre (1964) Toomre A., 1964, ApJ, 139, 1217
- Toth & Ostriker (1992) Toth G., Ostriker J. P., 1992, ApJ, 389, 5
- Velazquez & White (1999) Velazquez H., White S. D. M., 1999, MNRAS, 304, 254
- Vera-Ciro et al. (2014) Vera-Ciro C., D’Onghia E., Navarro J., Abadi M., 2014, ApJ, 794, 173
- Westfall et al. (2005) Westfall K. B., Bershady M. A., Verheijen M. A. W., Andersen D. R., Swaters R. A., 2005, in de Jong R. S., ed., Islandic Universes: Structure and Evolution of Disc Galaxies. pp 157–160 (arXiv:astro-ph/0508552)
- Westfall et al. (2011) Westfall K. B., Bershady M. A., Verheijen M. A. W., Andersen D. R., Martinsson T. P. K., Swaters R. A., Schechtman-Rook A., 2011, ApJ, 742, 18
- Wielen (1977) Wielen R., 1977, A&A, 60, 263
- Wisnioski et al. (2015) Wisnioski E., et al., 2015, ApJ, 799, 209
- Yanny et al. (2009) Yanny B., et al., 2009, AJ, 137, 4377
- Yoachim & Dalcanton (2006) Yoachim P., Dalcanton J. J., 2006, AJ, 131, 226
- Zacharias et al. (2013) Zacharias N., Finch C. T., Girard T. M., Henden A., Bartlett J. L., Monet D. G., Zacharias M. I., 2013, AJ, 145, 44
- de Grijs (1998) de Grijs R., 1998, MNRAS, 299, 595
- de Zeeuw et al. (2002) de Zeeuw P. T., et al., 2002, MNRAS, 329, 513
- van Leeuwen (2007) van Leeuwen F., 2007, Hipparcos, the New Reduction of the Raw Data. Astrophysics and Space Science Library, Springer Netherlands
- van der Kruit & Freeman (1984) van der Kruit P. C., Freeman K. C., 1984, ApJ, 278, 81
- van der Kruit & de Grijs (1999) van der Kruit P. C., de Grijs R., 1999, A&A, 352, 129
- van der Marel et al. (1994) van der Marel R. P., Rix H. W., Carter D., Franx M., White S. D. M., de Zeeuw T., 1994, MNRAS, 268, 521
| Galaxy name | Hubble type | (1) | References | Method | radial range |
| Milky Way | Sbc (2) | (3) | (3) | solar nbhd | |
| ESO-LV 026-G06 | Sd | van der Kruit & de Grijs (1999) | photometry | at 1 scale length | |
| ESO-LV 033-G22 | Sd | van der Kruit & de Grijs (1999) | photometry | at 1 scale length | |
| ESO-LV 041-G09 | Scd | van der Kruit & de Grijs (1999) | photometry | at 1 scale length | |
| ESO-LV 141-G27 | Scd | van der Kruit & de Grijs (1999) | photometry | at 1 scale length | |
| ESO-LV 142-G24 | Sd | van der Kruit & de Grijs (1999) | photometry | at 1 scale length | |
| ESO-LV 157-G18 | Scd | van der Kruit & de Grijs (1999) | photometry | at 1 scale length | |
| ESO-LV 201-G22 | Sc | van der Kruit & de Grijs (1999) | photometry | at 1 scale length | |
| ESO-LV 202-G35 | Sb | van der Kruit & de Grijs (1999) | photometry | at 1 scale length | |
| ESO-LV 235-G53 | Sb | van der Kruit & de Grijs (1999) | photometry | at 1 scale length | |
| ESO-LV 240-G11 | Sc | van der Kruit & de Grijs (1999) | photometry | at 1 scale length | |
| ESO-LV 269-G15 | Scd | van der Kruit & de Grijs (1999) | photometry | at 1 scale length | |
| ESO-LV 286-G18 | Sbc | van der Kruit & de Grijs (1999) | photometry | at 1 scale length | |
| ESO-LV 288-G25 | Sbc | van der Kruit & de Grijs (1999) | photometry | at 1 scale length | |
| ESO-LV 322-G87 | Sb | van der Kruit & de Grijs (1999) | photometry | at 1 scale length | |
| ESO-LV 340-G08 | Scd | van der Kruit & de Grijs (1999) | photometry | at 1 scale length | |
| ESO-LV 340-G09 | Sd | van der Kruit & de Grijs (1999) | photometry | at 1 scale length | |
| ESO-LV 383-G05 | Sbc | van der Kruit & de Grijs (1999) | photometry | at 1 scale length | |
| ESO-LV 416-G25 | Sb | van der Kruit & de Grijs (1999) | photometry | at 1 scale length | |
| ESO-LV 435-G14 | Sc | van der Kruit & de Grijs (1999) | photometry | at 1 scale length | |
| ESO-LV 435-G25 | Sc | van der Kruit & de Grijs (1999) | photometry | at 1 scale length | |
| ESO-LV 435-G50 | Scd | van der Kruit & de Grijs (1999) | photometry | at 1 scale length | |
| ESO-LV 444-G21 | Scd | van der Kruit & de Grijs (1999) | photometry | at 1 scale length | |
| ESO-LV 446-G18 | Sb | van der Kruit & de Grijs (1999) | photometry | at 1 scale length | |
| ESO-LV 446-G44 | Scd | van der Kruit & de Grijs (1999) | photometry | at 1 scale length | |
| ESO-LV 460-G31 | Sc | van der Kruit & de Grijs (1999) | photometry | at 1 scale length | |
| ESO-LV 487-G02 | Sb | van der Kruit & de Grijs (1999) | photometry | at 1 scale length | |
| ESO-LV 505-G02 | Sd | van der Kruit & de Grijs (1999) | photometry | at 1 scale length | |
| ESO-LV 506-G02 | Sbc | van der Kruit & de Grijs (1999) | photometry | at 1 scale length | |
| ESO-LV 509-G19 | Sbc | van der Kruit & de Grijs (1999) | photometry | at 1 scale length | |
| ESO-LV 531-G22 | Sbc | van der Kruit & de Grijs (1999) | photometry | at 1 scale length | |
| ESO-LV 564-G27 | Scd | van der Kruit & de Grijs (1999) | photometry | at 1 scale length | |
| NGC488 | Sb | Shapiro et al. (2003) | long-slit, model | disc region | |
| NGC1068 | Sb | Shapiro et al. (2003) | long-slit, model | disc region | |
| NGC2460 | Sa | Shapiro et al. (2003) | long-slit, model | disc region | |
| NGC2775 | Sa-Sab | Shapiro et al. (2003) | long-slit, model | disc region | |
| NGC2985 | Sab | Shapiro et al. (2003) | long-slit, model | disc region | |
| NGC4030 | Sbc | Shapiro et al. (2003) | long-slit, model | disc region | |
| NGC2280 | Scd | Gerssen & Shapiro Griffin (2012) | long-slit, model | disc region | |
| NGC3810 | Sc | Gerssen & Shapiro Griffin (2012) | long-slit, model | disc region | |
| NGC3223 | Sb | Gentile et al. (2015) | long-slit, model | disc region | |
| NGC3949 | Sbc | Westfall et al. (2005) | IFS, model | disc region | |
| NGC3982 | Sb | Westfall et al. (2005) | IFS, model | disc region | |
| NGC0234 | Sc | Westfall et al. (2011) | IFS, model | disc region | |
| NGC524 | S0+ | Cappellari et al. (2007) | IFS, Schwarzschild models | within 1 | |
| NGC3156 | S0 | Cappellari et al. (2007) | IFS, Schwarzschild models | within 1 | |
| NGC3414 | S0 | Cappellari et al. (2007) | IFS, Schwarzschild models | within 1 | |
| NGC4150 | S00 | Cappellari et al. (2007) | IFS, Schwarzschild models | within 1 | |
| NGC4459 | S0+ | Cappellari et al. (2007) | IFS, Schwarzschild models | within 1 | |
| NGC4526 | S00 | Cappellari et al. (2007) | IFS, Schwarzschild models | within 1 | |
| NGC4550 | S00 | Cappellari et al. (2007) | IFS, Schwarzschild models | within 1 | |
| NGC7457 | S0- | Cappellari et al. (2007) | IFS, Schwarzschild models | within 1 | |
| NGC3115 | S0- (5) | Emsellem et al. (1999) | Three-integral models | outer disc | |
| M104 | Sa | Tempel & Tenjes (2006) | Jeans equations | disc | |
| M31 | Sb (5) | Kipper et al. (2016) | Jeans equations | disc |
| (1) | N∗ | Region | References | Comments |
|---|---|---|---|---|
| 11865 | local solar nbhd | Dehnen & Binney (1998) | from -0.238 to 0.719 | |
| 15113 | local solar nbhd | Aumer & Binney (2009) | from 0 to 0.8 | |
| 7280 | kpc | Smith et al. (2012) | dwarfs, [Fe/H]=[-1.5,0.5] | |
| 372 768 | kpc | Binney et al. (2014b) | red-clump and non-clump giants, hot and cool dwarfs | |
| 16 276 | kpc | Büdenbender et al. (2015) | G-dwarfs, [Fe/H]=[-0.89,-0.07] |
-
•
Notes. (1) Averages have been computed weighting with the number of stars (N∗), in the second column. Errors have been estimated as the weighted standard deviation of the different samples.
| Galaxy | Hubble | Stellar mass | Merger | Bar(2) | |
|---|---|---|---|---|---|
| name | type | ( M☉) | mass ratio(1) | ||
| galaxy_31 | Sbc | 1.2 | strong | ||
| galaxy_35 | S0+ | 1.4 | strong | ||
| galaxy_36 | Scd | 1.2 | strong | ||
| galaxy_37 | Scd | 1.2 | strong | ||
| galaxy_38 | Sc | 1.1 | strong | ||
| galaxy_44 | Sbc | 1.2 | strong | ||
| galaxy_47 | Sb | 8.6 | absent/weak | ||
| galaxy_48 | Sbc | 1.1 | absent/weak | ||
| galaxy_53 | S0a | 9.1 | strong | ||
| galaxy_56 | Sab | 1.1 | absent/weak | ||
| galaxy_57 | Sb | 1.2 | strong | ||
| galaxy_59 | Sc | 7.2 | strong | ||
| galaxy_60 | Sa | 4.5 | absent/weak | ||
| galaxy_62 | Sb | 6.7 | absent/weak | ||
| galaxy_72 | Sbc | 4.6 | absent/weak | ||
| galaxy_82 | Sc | 3.8 | strong | ||
| galaxy_83 | Sb | 4.2 | strong | ||
| galaxy_86 | S0a | 4.2 | absent/weak | ||
| galaxy_92 | Sbc | 4.4 | strong | ||
| galaxy_102 | Sa | 3.3 | absent/weak | ||
| galaxy_106 | Sc | 4.3 | strong | ||
| galaxy_125 | Sbc | 2.4 | strong | ||
| galaxy_126 | Sa | 3.3 | absent/weak | ||
| galaxy_128 | Sc | 2.7 | strong | ||
| galaxy_146 | Sab | 1.7 | absent/weak | ||
| galaxy_147 | Sb | 2.6 | strong |
-
•
Notes. (1) Estimated, for each galaxy, from its mass evolution plot from the age of 5 Gyr on. (2) Strong bars have a bar-to-total light ratio above 10%. Absent/weak bars are below 6%.
| Galaxy id | DM (%)1 | Bar | Interaction2 | |
|---|---|---|---|---|
| I0_no_bar | 80 | no | no | |
| I0_inter | 80 | yes | yes | |
| I1 | 57 | yes | no | |
| I1_inter | 57 | yes | yes | |
| I2 | 38 | yes | no | |
| I3 | 7 | yes | no |
-
•
Notes. (1) This is the dark matter fraction within a central sphere of 5 kpc of radius. (2) The interaction consists in a fly-by, coplanar with the galaxy disc.