The Dark Energy Survey Data Release 1
Abstract
We describe the first public data release of the Dark Energy Survey, DES DR1, consisting of reduced single-epoch images, coadded images, coadded source catalogs, and associated products and services assembled over the first three years of DES science operations. DES DR1 is based on optical/near-infrared imaging from 345 distinct nights (August 2013 to February 2016) by the Dark Energy Camera mounted on the 4-m Blanco telescope at Cerro Tololo Inter-American Observatory in Chile. We release data from the DES wide-area survey covering of the southern Galactic cap in five broad photometric bands, . DES DR1 has a median delivered point-spread function of , , , , and FWHM, a photometric precision of % in all bands, and an astrometric precision of . The median coadded catalog depth for a 1.95″diameter aperture at is , , , , and . DES DR1 includes nearly M distinct astronomical objects detected in coadd tiles of size produced from individual exposures. Benchmark galaxy and stellar samples contain and objects, respectively, following a basic object quality selection. These data are accessible through a range of interfaces, including query web clients, image cutout servers, jupyter notebooks, and an interactive coadd image visualization tool. DES DR1 constitutes the largest photometric data set to date at the achieved depth and photometric precision.
=300
1 Introduction
Advances in telescope construction, sensor technology, and data processing have allowed us to map the sky with increasing speed and precision, enabling discovery through statistical analysis of astronomical source populations, as well as the detection of rare and/or unexpected objects (Tyson, 2010). The Dark Energy Survey (DES) is one of several ground-based wide-area optical and near-IR imaging surveys including the Sloan Digital Sky Survey (SDSS, York et al., 2000), the Panoramic Survey Telescope and Rapid Response System 1 (Pan-STARRS1 or PS1, Kaiser et al., 2010), the Kilo Degree Survey (KiDS, de Jong et al., 2013), the Hyper Suprime-Cam Subaru Strategic Program (HSC-SSP; Aihara et al., 2017a), and the future Large Synoptic Survey Telescope (LSST; Ivezic et al., 2008).
The instrumental and observational strategies of DES are designed to improve our understanding of cosmic acceleration and the nature of dark energy using four complementary methods: weak gravitational lensing, galaxy cluster counts, the large-scale clustering of galaxies (including baryon acoustic oscillations), and the distances to Type Ia supernovae (DES Collaboration, 2005). To achieve these goals, DES conducts two distinct multi-band imaging surveys: a wide-area survey in the bands and a deep supernova survey observed in the bands with a 7-day cadence (Diehl et al., 2014; Kessler et al., 2015).
DES uses the Dark Energy Camera (DECam; Honscheid et al., 2008; Flaugher et al., 2015), a 570 Megapixel camera with a field-of-view installed at the prime focus of the Blanco 4-m telescope at the Cerro Tololo Inter-American Observatory (CTIO) in northern Chile. Survey observations comprise equivalent full nights per year (August through mid-February) including full and half nights. Each exposure is delivered from CTIO to the National Center for Supercomputing Applications (NCSA) at the University of Illinois at Urbana-Champaign for processing generally within minutes of being observed. At NCSA, the DES Data Management system (DESDM; Morganson et al., 2018; Sevilla et al., 2011; Mohr et al., 2012; Desai et al., 2012) generates a variety of scientific products including single-epoch and coadded images with associated source catalogs of suitable quality to perform precise cosmological measurements (e.g., DES Collaboration, 2017).
Raw DES exposures become publicly available one year after acquisition from the National Optical Astronomy Observatory (NOAO) Science Archive111http://archive.noao.edu/, and DES is scheduled to provide two major public releases of processed data. This first DES Data Release (DR1), described here, encompasses data products derived from wide-area survey observations taken in the first three years of science operations (Y1–Y3, from August 2013 to February 2016). A second major data release (DR2) is scheduled for after DES is completed. In addition to DR1 and DR2, the DES Collaboration prepares incremental internal releases with value-added products and detailed characterizations of survey performance that are designed to support cosmological analyses (e.g., Y1 Gold; Drlica-Wagner et al., 2018). A subset of these products associated with data collected during the DES Science Verification (SV) period (2012 November 1 through 2013 February 22) was released in January 2016.222https://des.ncsa.illinois.edu/releases/sva1 In September 2018, the value added products from a number of selected DES publications corresponding to Y1 data was released as well.333https://des.ncsa.illinois.edu/releases/y1a1 Additional releases of value-added data products are expected to support future scientific publications.
| Parameter | Band | Reference | ||||
|---|---|---|---|---|---|---|
| Number of Exposures in Coadd | 7626 | 7470 | 7470 | 7753 | 8531 | Section 2 |
| Single-epoch PSF FWHM () | 1.12 | 0.96 | 0.88 | 0.84 | 0.90 | Section 2.3 |
| Single-epoch Sky Brightness () | 22.01 | 21.15 | 19.89 | 18.72 | 17.96 | Section 2.3 |
| Single-epoch Effective Image NoiseaaSquare root of the calibrated image variance, including read noise. () | 25.25 | 24.94 | 24.31 | 23.58 | 22.28 | Section 2.3 |
| Sky Coverage (individual bands, deg2) | 5224 | 5231 | 5230 | 5234 | 5227 | Section 2.3 |
| Sky Coverage ( intersection, deg2) | 5186 | Section 2.3 | ||||
| Single-epoch Astrometric Repeatability (total distance, ) | 42 | 36 | 37 | 39 | 56 | Section 4.1 |
| Coadd Astrometric Precision (total distance, ) | 30 (internal); 151(vs. Gaia) | Section 4.1 | ||||
| Absolute Photometric Statistical UncertaintybbThe Hubble CalSpec standard star C26202 is used as an absolute reference for the AB system. (mmag) | 2.6 | 2.9 | 3.4 | 2.5 | 4.5 | Section 4.2 |
| Single-epoch Photometric Repeatability (mmag) | 7.3 | 6.1 | 5.9 | 7.3 | 7.8 | Section 4.2 |
| Coadd Photometric Precision (mmag) | 5 | 4 | 4 | 5 | 5 | Section 4.2 |
| Coadd Photometric Uniformity vs. Gaia (mmag) | 6.6 | Section 4.2 | ||||
| Single-epoch Magnitude Limit (PSF, ) | 23.57 | 23.34 | 22.78 | 22.10 | 20.69 | Section 2.2 |
| Coadd Magnitude Limit (MAG_APER_4, 1.95 diameter, ) | 24.33 | 24.08 | 23.44 | 22.69 | 21.44 | Section 4.4 |
| Coadd 95% Completeness Limit (mag) | 23.72 | 23.35 | 22.88 | 22.25 | Section 4.4 | |
| Coadd Spurious Object Rate | Section 4.4 | |||||
| Coadd Galaxy Selection (, ) | Efficiency ; Contamination | Section 4.5 | ||||
| Coadd Stellar Selection (, ) | Efficiency ; Contamination | Section 4.5 | ||||
In this work, we present the content, validation, and data access services for DES DR1. DR1 is comprised of coadded images and catalogs, as well as calibrated single-epoch images, from the processing of the first three years of DES wide-area survey observations. Access to DES DR1 data is provided via web interfaces and auxiliary tools, which is made possible through the partnership between NCSA,444National Center for Supercomputing Applications LIneA,555Laboratório Interinstitucional de e-Astronomia and NOAO666National Optical Astronomy Observatory, at the following URL: https://des.ncsa.illinois.edu/releases/dr1. In Section 2, we briefly describe the DECam instrument and the DES observation strategy for the wide-field survey (the dataset included in this release). Section 3 includes an overview of how the raw data were processed by DESDM at NCSA and served as the catalogs and images made available in this release. A basic quality evaluation of these products is presented in Section 4, followed by a description of products as they appear in the DR1 release (Section 5). Section 6 describes the various data access frameworks and tools made available for DR1. A summary of the release and information on expected future releases is given in Section 7. We direct the reader to Appendix A for definitions of terms and acronyms used throughout the text.
Except where noted, all magnitudes quoted in the text are in the AB system (Oke, 1974).
2 Data Acquisition
DR1 is composed of data taken on 345 distinct nights spread over the first three years of DES operations from 2013 August 15 to 2016 February 12.777DES was scheduled for 319 equivalent full nights, including half-nights, during this period (Diehl et al., 2016). In this section, we briefly describe the characteristics of the DECam instrument and the DES observation strategy to provide context for DR1. We point the reader to other DES publications for further details on the technical aspects summarized here (i.e., Diehl et al., 2016; Drlica-Wagner et al., 2018; Morganson et al., 2018).
2.1 DECam
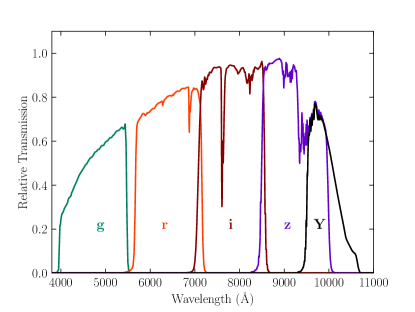
DECam is a wide-field-of-view () mosaic camera containing 62 science CCDs (Flaugher et al., 2015).888Two and a half DECam CCDs have failed over the course DES operation are only included in DR1 when operating properly (Diehl et al., 2014; Morganson et al., 2018; Flaugher et al., 2015). The corrector system and pixel size provide an average plate scale of 0263 per pixel. The DES wide-area survey observes five broadband filters, (Figure 1), and the standard bandpasses for these filters are included as part of DR1 (Section 5.4). The DES filters are very similar to their analogously named counterparts from other surveys.
Uniquely, the DES band has greater sensitivity at longer wavelengths than the SDSS band and overlaps with the DES band. Additional details, including construction, installation, and a description of DECam subsystems and interfaces are provided in Flaugher et al. (2015).
2.2 Survey operations
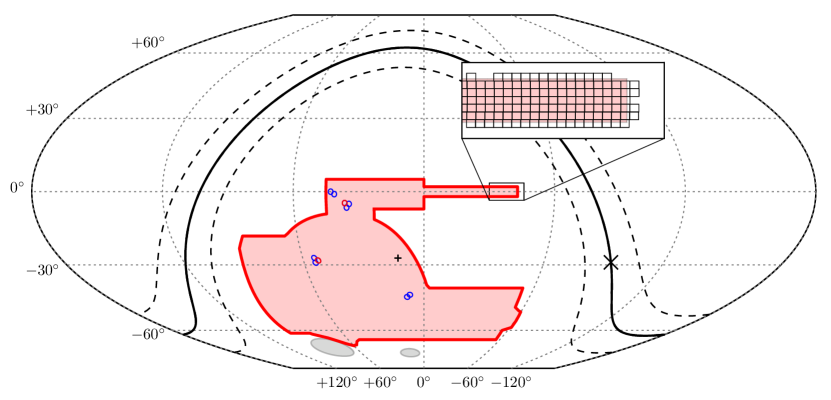
The target footprint of the DES wide-area and supernova surveys are shown in Figure 2. All RA, DEC coordinates in this paper refer to the J2000 epoch. The wide-area footprint shape was selected to obtain a large overlap with the South Pole Telescope survey (Carlstrom et al., 2011) and Stripe 82 from SDSS (Abazajian et al., 2009), and includes a connection region to enhance overall calibration. Given the cosmological goals of the survey, DES avoids the Galactic plane to minimize stellar foregrounds and extinction from interstellar dust.
The wide-field survey uses exposure times of 90 for and 45 for band, yielding a typical single-epoch PSF depth at of , , , and (Morganson et al., 2018). The completed survey is expected to be roughly one magnitude deeper, through the coaddition of 10 images in each of the bands for a cumulative exposure time of 900 in and 450 in .999Beginning in Y4, -band exposure times were increased to 90 to reduce overhead while maintaining the same cumulative exposure target.
Nightly observations are divided between the wide-field and supernova (SN) surveys based on current environmental conditions and the data quality assessments of previous observations. Realtime optimization of survey strategy is accomplished through the ObsTac software on the mountain (Neilsen & Annis, 2014). ObsTac selects exposures accounting for moon position, sky brightness, current seeing, airmass, hour angle, and other observational characteristics. DES exposures are offset by roughly half the focal plane radius on average in successive visits to the same field, or “hex”, such that objects are observed by different CCDs in each “tiling”. This observing strategy minimizes inhomogeneities from the DECam geometry and enhances the relative photometric calibration. Blanco is an equatorial mount telescope and there is no rotation between dithered and/or repeated exposures.
A single raw DECam exposure is in size (compressed), and DES collects science exposures per night, depending on the season, survey strategy, and on the SN fields schedule. These data are transferred to NOAO for archiving (Fitzpatrick, 2010; Honscheid et al., 2012) and to NCSA for further evaluation and processing by the DESDM system; a summary is provided in Section 3. These raw single-epoch images are made available by NOAO and are accessible as described in Section 6.
2.3 Survey progress through DR1
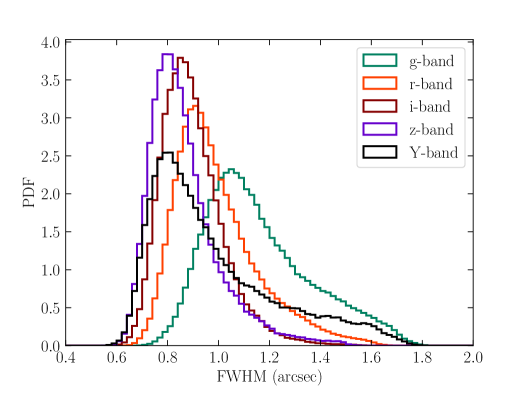
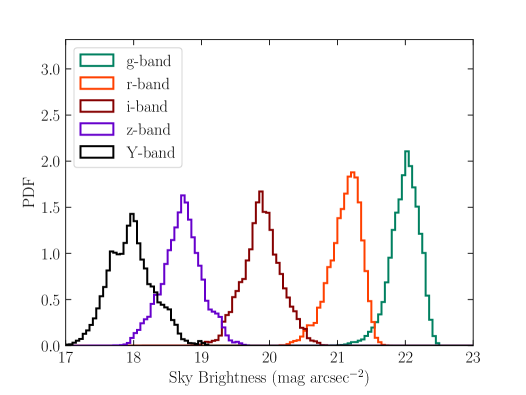
Between Y1 and Y3, 38850 wide-field exposures passed baseline survey quality thresholds based on effective exposure time and PSF FWHM (Morganson et al., 2018, section 4.7) and are included in coadd processing by DESDM (Morganson et al., 2018). The median airmass of DR1 survey-quality exposures was 1.22, with of exposures taken at airmass . Meanwhile, the median delivered seeing (FWHM) was , , , , and (Figure 3). Note that ObsTac prioritizes observations in the bands during periods of good seeing to advance the main science goals of DES (e.g., cosmological constraints from weak gravitational lensing). Figure 4 shows the distribution of sky brightness levels for single-epoch images; the median sky brightness is , , , , and . The resulting median single-epoch effective image noise level (square root of the calibrated image variance), including additional contributions from read noise and shot noise of the dome flat, is , , , , and .
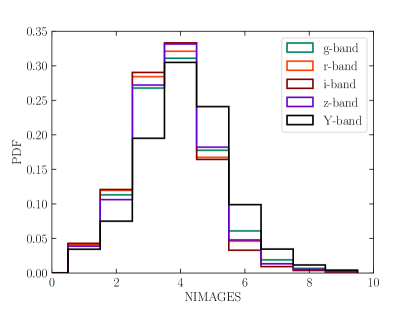
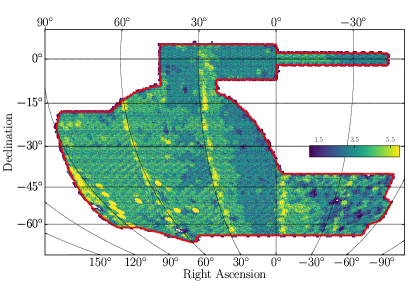
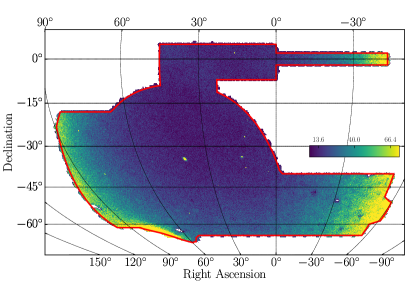
Each position in the DES DR1 footprint is typically covered by 3 to 5 overlapping DECam exposures in each of the bands (Figure 5). As an example, a map for the number of overlapping -band exposures across the footprint is shown in Figure 6.
The total sky coverage of DR1 was estimated using maps of the individual image coverage generated by mangle (Hamilton & Tegmark, 2004; Swanson et al., 2008) and converted to HEALPix (Górski et al., 2005) maps with spatial resolution comparable to the size of gaps between individual CCDs (nside = 4096, ; Drlica-Wagner et al., 2018). When requiring at least one exposure in a given band, the areal coverage of each individual band is , , , , and . When requiring at least one exposure in all of the bands, the DR1 footprint area is 5186 . These areal coverage numbers do not account for regions that are masked around bright stars or masked due to other imaging artifacts, which decrease the areal coverage by . Note also that we are not releasing mangle products for DR1. Instead, we are providing HEALPix indices for all the objects at different resolutions as well as a tabulated HEALPix map with nside = 32 for the footprint. See Section 6 for more details about these products.
3 Data Release Processing
We briefly describe the DESDM processing pipeline applied to the DES data to generate the DR1 data products.101010Note that the DESDM pipeline differs from the DECam community pipeline. DR1 is based on the DESDM Y3A2 internal release to the DES Collaboration, referring to the second annual release of data products obtained from the first three seasons of DES science operations and the Science Verification period. Where possible, our pipelines use the AstrOmatic 111111https://www.astromatic.net/ suite of tools to perform standard tasks (Bertin & Arnouts, 1996; Bertin et al., 2002; Bertin, 2006, 2010, 2011). A full description of the pipeline and the underlying image detrending algorithms can be found in Morganson et al. (2018) and Bernstein et al. (2017a).
3.1 Single-Epoch Processing
The DES single-epoch processing pipeline (known as “Final Cut”) removes instrumental signatures to produce reduced, science-ready images (Morganson et al., 2018). Final Cut performs: overscan removal, crosstalk correction, non-linearity correction, bias subtraction, gain correction, correction for the brighter-fatter effect (Gruen et al., 2015), bad-pixel masking, astrometric matching, flagging of saturated pixels and bleed trails, principal-components background subtraction, secondary flat-field correction, and the masking of cosmic rays and other imaging artifacts. The resulting images from this pipeline form the products that are released through the NOAO Science Archive121212http://archive.noao.edu/. Those images are provided in FITS-formatted files and contain extensions for the science data (SCI), an inverse-variance weight (WGT), and a mask of bad pixels (MSK). Note that the weight plane is not altered to account for flagged defects; this allows the user to customize the severity of the defects to be removed based on their own analysis needs. A summary of the flags available is provided in Table 9 of Morganson et al. (2018).
3.2 Multi-Epoch (Coadd) Processing
The multi-epoch pipeline produces coadded images and catalogs of astronomical objects (Morganson et al., 2018). The coadd processing is organized within a tiling scheme that subdivides the sky into square regions with on a side. Coadd images are pixels with a pixel scale is 0263. The choice of images that are tendered as inputs to this pipeline is based on the data quality assessment that occurred in the Final Cut pipeline and the Forward Global Calibration Method (FGCM) for photometric calibration (Burke et al. 2018). In addition, a ‘blacklist’ of images with severe scattered light, ghosts, or bright transient defects (e.g., comets, meteors, and airplanes) is used to exclude additional images from coadd processing. The coadded images are re-scaled such that the zeropoint is fixed to for all filters. This makes the conversion between flux and magnitude the same for all bands.
The multi-epoch pipeline begins by refining the astrometric solution for the image inputs. This step operates on catalog objects from all input images in all bands simultaneously to provide a consistent alignment between images. The relative astrometry within a tile has a typical RMS residual of 30 mas or better. During this process the absolute astrometry is tied to 2MASS (Skrutskie et al., 2006)131313The Gaia data releases were not yet available when the processing began..
The next step prepares the images for coaddition. First, the World Coordinate System (WCS; Greisen & Calabretta, 2002; Calabretta & Greisen, 2002) information for each image is updated to reflect the astrometric shifts solved in the previous step. Then a pair of weight planes are formed, that set the as-yet unaltered single-epoch weights to zero to remove defects tracked in the MSK plane. Both weight planes are formed so that we can separately track spatially persistent defects (e.g., saturated stars and bleed trails) and temporary defects (e.g., interpolated bad columns, cosmic-rays, satellite trails). The first weight plane contains all defects, while the second weight plane contains only the persistent defects. The AstrOmatic utility SWarp (Bertin et al., 2002) is then used to form the coadd image (SCI) and weight (WGT) planes; the former uses the first weight plane while the latter uses the second. A mask plane (MSK) is formed that carries a value of 0 for good pixels and 1 for pixels where no good data exist (due to lack of image coverage or persistent defects).
A subsequent execution of SWarp is then used to form a detection image that is a linear combination of the bands using the ‘CHI-MEAN’ weighting (Drlica-Wagner et al., 2018, Appendix B) and PSFEx is used to obtain a PSF model for each tile. Initial catalogs are constructed using SExtractor in dual image mode where the detection image is used to form the segmentation map of sources prior to extracting measurements from the individual coadd images. We caution that the PSF model is unable to fully account for discontinuities that occur at image boundaries. This limits the precision of the measurements of quantities such as MAG_PSF_ to no better than a few percent. In addition, morphological classifiers based on the coadd PSF model, such as CLASS_STAR_ and SPREAD_MODEL_, can have a degraded/varied performance.
To provide a solution that overcomes most of the limitations of the coadd catalog products, the single-epoch catalogs are matched to the coadd detection catalog and weighted averages of the single-epoch MAG_PSF_ and SPREAD_MODEL_ measurements are made from all unflagged detections of the same object for each band. We add the WAVG_ prefix to indicate these weighted-average quantities (Morganson et al., 2018).
These weighted-average measurements are included among the public data release products. Longer-term, the DES Collaboration is pursuing improved photometry through the use of multi-epoch, multi-band, and multi-object fitting that operates on the Final Cut single-epoch images (Drlica-Wagner et al., 2018). Those products are maturing but are beyond the scope of the current public data release. They should become available along with the results from the DES Y3 cosmology analyses.
4 Data Quality
In this section, we provide a general assessment of the DR1 data quality including astrometric and photometric precision, imaging depth in terms of measurement signal-to-noise and object detection completeness, morphological object classification accuracy, and the identification and removal of likely artifacts. A summary of data quality metrics is found in Table 1.
4.1 Astrometry
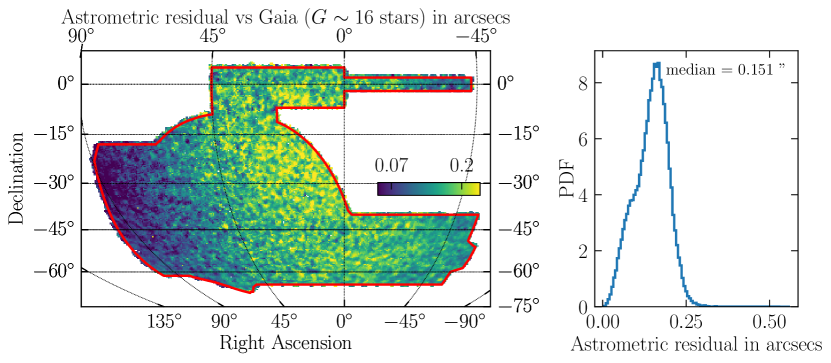
The DR1 astrometric solution is derived in two steps using SCAMP with 2MASS as the reference catalog (Morganson et al., 2018). At the single-epoch stage, we find internal astrometric uncertainties of , , , , and , as determined from the median of two-dimensional angular separations between repeated measurements of bright stars from individual exposures. Following the astrometric refinement step for image coaddition by SCAMP, the estimated internal astrometric precision for the coadd is RMS (median over coadd tiles, averaging all five bands). The absolute astrometric uncertainty of the coadd is evaluated with respect to Gaia DR1 (Gaia Collaboration et al., 2016). Figure 7 shows that the two-dimensional astrometric residuals are smallest in regions with larger stellar densities closer to the Galactic plane (for comparison, see Figure 14), and the median over the footprint is . Further details of astrometric calibration, including ongoing development using Gaia as a reference catalog, are provided in Bernstein et al. (2017b).
4.2 Photometry
The relative standard bandpass flux measurements for astronomical sources in DR1 have been calibrated using a forward modeling technique to account for both atmospheric and instrumental components of the total system throughput (FGCM; Burke et al., 2018). The parameters of the model were initially fit from observations taken in photometric conditions to establish a network of calibration stars that spans the full survey footprint. This network was subsequently used to refine the calibration of exposures taken in non-photometric conditions. Meanwhile, the absolute photometric calibration of DR1 is tied to the spectrophotometric Hubble CALSPEC standard star C26202 (Bohlin et al., 2014) located in the SN field C3.
Over one hundred repeated measurements of C26202 in a variety of conditions yielded a set of small shifts () to place the DES photometry on the AB system. These shifts have been pre-applied to the DR1 zeropoints. The statistical uncertainty on these shifts is estimated to be , , , , and . Additional sources of systematic uncertainty on the absolute photometric calibration could arise from uncertainty in the level of out-of-band light leakage and uncertainty in the synthetic photometry of C26202. We are currently undertaking observations and analysis of two additional HST CALSPEC standards to reduce the systematic uncertainty of the AB offsets.
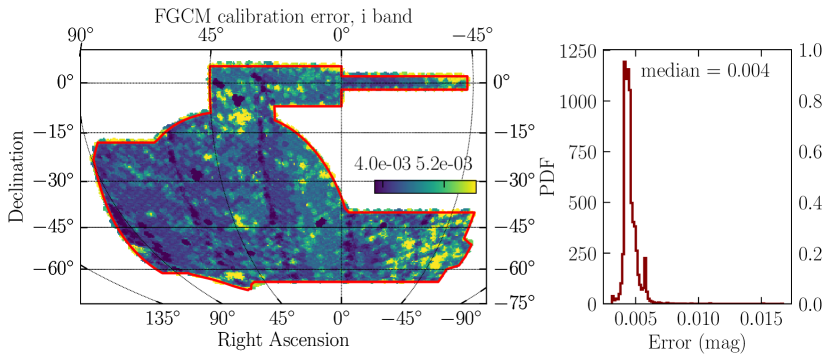
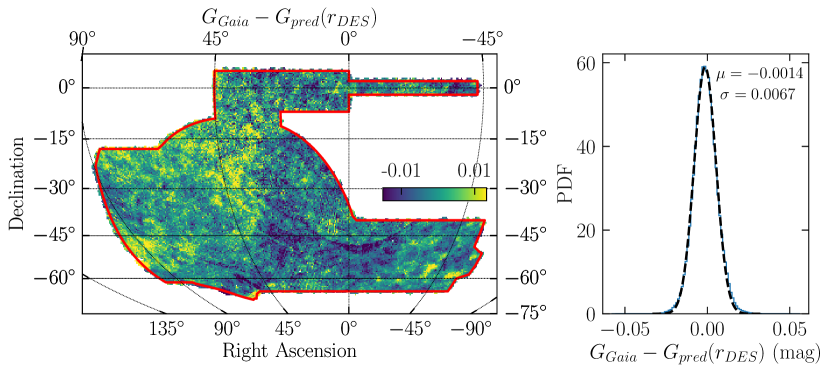
We reproduce below several of the key results from Burke et al. (2018) regarding the relative photometric calibration. The single-epoch photometric statistical precision (associated with random errors in the FGCM fit parameters) derived from repeated measurements of FGCM calibration stars is , , , , and . Under the assumption that successive tiled observations of the same fields yield largely independent model fit parameters (as would be expected from the widely spaced observations in DES), we estimate the statistical precision of coadd zeropoints by combining the fit results from overlapping exposures. The median coadd zeropoint statistical uncertainty is , , , , and . Figure 8 shows an example distribution for the -band. As a validation, we compare the photometric uniformity of DES DR1 to the space-based Gaia -band photometry (Figure 9). Variations in uniformity are found to be 6.6 , as estimated from a Gaussian fit to the offset distribution between and predicted from the DES band (Appendix B).
To account for extinction from interstellar dust, we include an additional column in the DR1 photometry tables for values from the reddening map of Schlegel et al. (1998) (SFD98) at the location of each catalog object. The values were obtained using a linear interpolation of the Zenithal Equal Area projected map distributed by SFD98. We computed fiducial interstellar extinction coefficients, , for each band so that the corrections to the FGCM calibrated source magnitudes are . Fiducial coefficients are derived using the Fitzpatrick (1999) reddening law with and the Schlafly & Finkbeiner (2011) calibration adjustment to the original SFD98 reddening map (). Note that the Schlafly & Finkbeiner (2011) calibration adjustment is included in our fiducial reddening coefficients; these coefficients are intended to be used directly with values from the original SFD98 reddening map. We integrate over the DR1 Standard Bandpasses (Section 5.4) considering a fixed source spectrum that is constant in spectral flux density per unit wavelength, (erg cm-2 s-1 Å-1), and adopted the low-extinction limit. The latter simplification is appropriate for DES, for which mag over of the footprint. The resulting multiplicative coefficient for each band is , , , and . The DES science team continues to explore systematic uncertainties associated with interstellar extinction modeling.
In general, the photometry columns included in the DR1 database tables are not dereddened by default. However, the DR1_MAIN_ table includes additional columns for the dereddened versions of MAG_AUTO_ and WAVG_MAG_PSF indicated by a _DERED suffix (Appendix E).
4.3 Flagged objects
For coadd objects, if any pixel is masked in all of the contributing exposures for a given band, the IMAFLAGS_ISO_ = 1 flag is set for that band. This flag is predominantly set for saturated objects and objects with missing data. We recommend a baseline quality criteria of IMAFLAGS_ISO_ = 0 (in the relevant bands) for most science applications since the majority of flagged objects have unreliable photometry. The DES DR1 catalog also includes other standard flags FLAGS provided by the SExtractor pipeline. A summary of SExtractor FLAGS bitmask values and warning descriptions is provided in Appendix D.
4.4 Depth
The effective depth of the DES DR1 wide-field coadd catalog is dependent on the photometric measurement of interest and can be quantified through various approaches. Here we derive simple depth estimates from the flux distribution of cataloged objects, the magnitude corresponding to a fixed signal-to-noise threshold (), an aperture estimate from the input imaging, and object detection completeness. In general, the type of source and surface brightness must also be considered when evaluating the survey depth.
The settings used for the source extraction and deblending steps of the DESDM pipeline allow for efficient detection of objects with in the composite detection image (Morganson et al., 2018). At the bright end, saturation effects start to become important at . For even brighter magnitudes, the fraction of saturated objects increases until objects are no longer cataloged due to pixel-level masking applied during processing. For each of the depth studies considered here, we selected a sample of high-quality DR1 coadd objects using and IMAFLAGS_ISO_[GRIZ] = 0. No star-galaxy selection has been applied to the sample of analyzed objects. Below we describe these different approaches to estimate the depth of DR1; results from each method are provided in Table 2.
| Method | Band | ||||
|---|---|---|---|---|---|
| Maximum in number counts (MAG_AUTO) | 24.32 | 23.89 | 23.41 | 22.09 | 21.40 |
| Measured with (MAG_AUTO) | 23.52 | 23.10 | 22.51 | 21.81 | 20.61 |
| Measured with (MAG_APER_4) | 24.33 | 24.08 | 23.44 | 22.69 | 21.44 |
| Imaging depth from mangle (MAG_APER_4) | 24.282 | 23.952 | 23.335 | 22.628 | 21.383 |
| Detection completeness of 95% (MAG_AUTO) | 23.72 | 23.35 | 22.88 | 22.25 | … |
4.4.1 Flux distribution
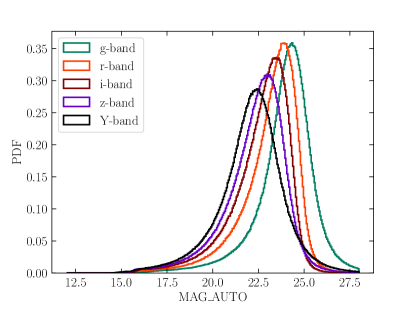
The distribution of astronomical sources is weighted towards low-flux sources. A crude estimate of the detection threshold is given by the mode of the number counts distribution of sources as a function of magnitude. Figure 10 shows the number counts of coadd objects as a function of MAG_AUTO_ in all five DES bands. The mode of the MAG_AUTO_ distribution is , , , , and . No restrictions were placed on source morphology (i.e., stars vs. galaxies) for this estimate.
4.4.2 Magnitude limit at fixed signal-to-noise
The magnitude limit corresponding to a fixed signal-to-noise for a given photometric measurement (e.g., MAG_AUTO_) can be empirically determined from the distribution of magnitude uncertainties as a function of magnitude (Rykoff et al., 2015). SExtractor provides an estimate of the photometric uncertainty through the MAGERR quantities, which are estimated from the fluctuations of the background around the sources. These are related to signal-to-noise, , via the differentiation of Pogson’s law (Pogson, 1856):
| (1) |
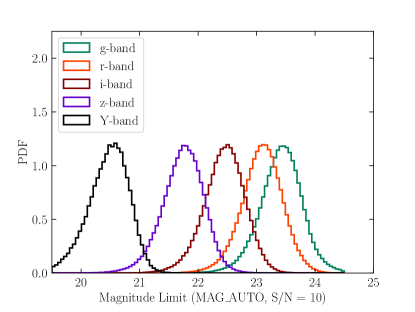
We summarize in Table 2 the characteristic thresholds for MAG_AUTO_ corresponding to in each of the bands. The left panel of Figure 11 shows the MAG_AUTO_ distribution for DES DR1 catalog objects with . The spread in these distributions comes from the dependence of on source properties (e.g., surface brightness) and survey non-uniformity.
4.4.3 Depth from image properties
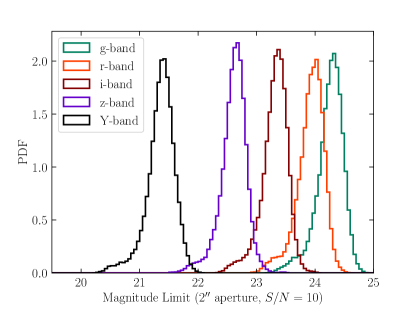
It is also possible to estimate the DES DR1 imaging depth using mangle (Hamilton & Tegmark, 2004; Swanson et al., 2008), that generates a vectorized map of the survey coverage accounting for the focal plane geometry and imaging artifacts (i.e., bright star masks, bleed trails, satellite trails) (Drlica-Wagner et al., 2018; Morganson et al., 2018). The mangle processing produces a coadd weight map from a weighted sum of the single-epoch input images. This weight was converted to a limiting magnitude for a diameter aperture, corresponding approximately to the MAG_APER_4 quantity measured by SExtractor (for details, see Drlica-Wagner et al., 2018). The median limiting magnitude across the DES footprint is , , , , (right panel of Figure 11).
4.4.4 Object detection completeness
Another measure of effective imaging depth is the object detection completeness relative to deeper imaging data. We evaluated the detection completeness of DES DR1 through a comparison to public CFHTLenS data (Erben et al., 2013) using an overlap region centered on consisting of 9 CFHTLenS fields in the W1 patch.141414CFHTLenS object catalogs and image masks available at http://www.cfhtlens.org/astronomers/data-store The CFHTLens magnitude limit for a aperture is , , , and . To ensure full coverage in both surveys, we restricted the analysis to regions with CFHTLenS image mask value and DES coverage fraction in the intersection of the bands (see Drlica-Wagner et al., 2018). The effective area of overlap in both surveys including masking is 6.0 deg2.
Object matching is performed using a radius and we require a robust flux measurement in the respective DES band () that is roughly consistent with that of CFHTLenS (within ) for an object to count as “detected” in DES DR1.
The DES DR1 detection efficiency is defined as the fraction of CFHTLenS objects in a given flux interval that has a matched DES object passing the baseline quality cuts listed above, and is expressed in the DES photometric system using converted flux measurement from CFHTLenS. The resulting detection efficiency curves are plotted in Figure 12. DES DR1 detection efficiencies are only plotted for the magnitude range brighter than the typical limiting magnitude of CFHTLenS. The 95% completeness magnitude threshold obtained from this test is , , , and (Table 1). CFHTLenS does not include comparable -band coverage.
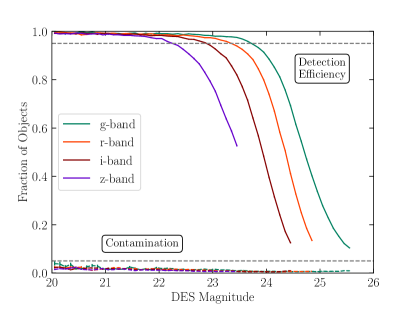
Using the same baseline quality selection criteria of and IMAFLAGS_ISO_[GRIZ] = 0, we find that in each of bands, of DES objects with MAG_AUTO_ greater than 20 and less than the typical limiting magnitude of CFHTLenS lack a matched counterpart in CFHTLenS (Figure 12). This suggests that contamination from spurious objects in DES DR1 is also . We expect that some fraction of unmatched DES objects are astrophysical transients or moving objects. Indeed, the spatial distribution of coadd objects with only one single-epoch detection across the bands is concentrated along the ecliptic.
4.5 Morphological object classification
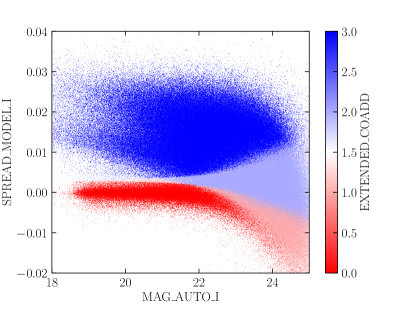
A basic selection on object size relative to the PSF can be used to separate samples of spatially extended galaxies from point-like stars and quasars. Accurate object classification becomes challenging for ground-based imaging surveys at faint magnitudes, and accordingly, optimal use of morphological, color, and temporal information is an active area of research (e.g., Fadely et al., 2012; Małek et al., 2013; Kim et al., 2015; Bertin et al., 2015; Kim & Brunner, 2017). Several object classification schemes have been applied to DES data for a variety of science cases (e.g., Soumagnac et al., 2015; Chang et al., 2015; Reed et al., 2015; Drlica-Wagner et al., 2018; Sevilla-Noarbe et al., 2018). The most common classification scheme makes use of the SExtractor SPREAD_MODEL_, that compares the fit of a local PSF model to a slightly extended exponential disk model (Desai et al., 2012). Below we show an example using SPREAD_MODEL_ for object classification in a way that is suitable for both stellar and extragalactic science.
We define a new variable EXTENDED_COADD as the independent sum of several Boolean conditions:
| (2) | ||||
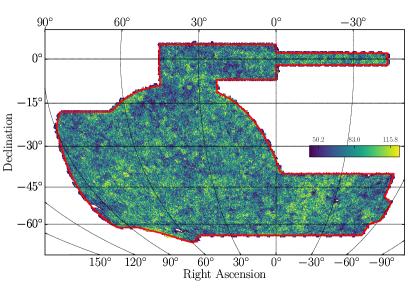
Note that EXTENDED_COADD is defined by a sequence of boolean conditions that, when true, add a unit to the classifier. This classifier results in a value of 0 (high-confidence stars), 1 (likely stars), 2 (mostly galaxies), and 3 (high-confidence galaxies). Appendix C demonstrates how this classifier can be used in a SQL query statement. Figure 14 shows density maps for stars and galaxies selected using EXTENDED_COADD equals to and respectively.
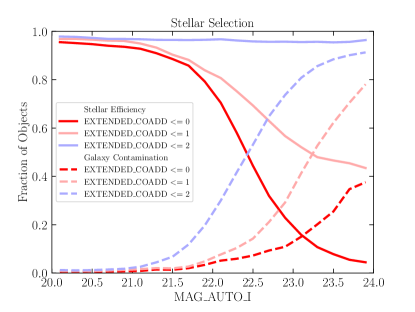
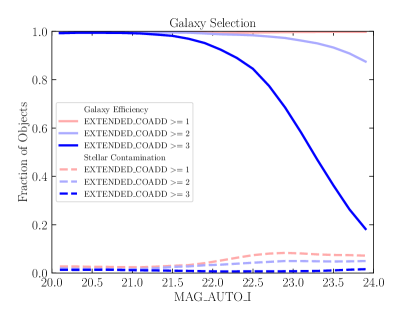
We evaluate the performance of the example classifier above using three regions in the main body of the DES footprint that overlap fields from HSC-SSP DR1 (Aihara et al., 2017b) with typical seeing in the -band : SXDS (Ultra Deep layer), DEEP2_3 (Deep layer), and portions of VVDS (Wide layer). The areal overlap between these HSC-SSP data sets and DES is deg2. The HSC-SSP data are of sufficient depth and image quality that a distinct stellar locus is clearly visible in the HSC concentration parameter to an -band magnitude of . We choose empirically an interval of EXTENDED_COADD values to select stellar or galactic samples with a balance of classification efficiency and purity appropriate for different science cases (Figure 13). For instance, one can define galaxy () and stellar samples () having and objects, respectively, following the standard object quality selection.
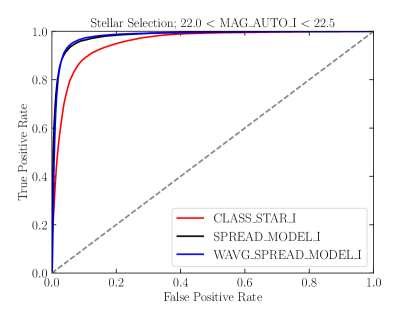
We recommend using quantities based on SExtractor SPREAD_MODEL_ for morphological classification in DR1. Although the SExtractor quantity CLASS_STAR_ has been commonly used in the past, we find that SPREAD_MODEL_-based classifiers consistently outperform CLASS_STAR_, as exemplified by the receiver operating characteristic (ROC) curve shown in Figure 15 and summarized in Table 3. The ROC curves are generated by performing a simple scan of threshold values for each of SExtractor quantities, and using the HSC-SSP classifications described above as a reference. Classifiers based on the weighted averaged SPREAD_MODEL_ from single epoch detections, WAVG_SPREAD_MODEL_, are expected to be more robust for objects that are bright enough to be detected in single-epoch imaging (see Section 4.6). It is expected that classifiers using alternative bands and/or combinations of object measurements will be more appropriate for specific science cases.
| Quantity | WAVG_SPREAD_MODEL_ | SPREAD_MODEL_ | CLASS_STAR_ |
|---|---|---|---|
| 0.994 | 0.991 | 0.979 | |
| 0.981 | 0.981 | 0.954 | |
| 0.917 | 0.948 | 0.881 |
4.6 Known issues
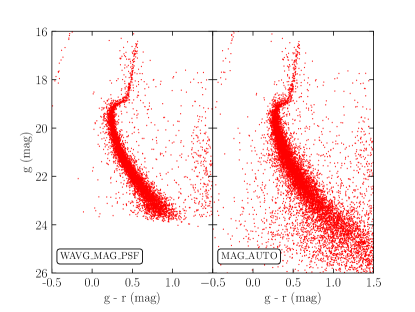
The PSF model has limited flexibility to accommodate discontinuities in the effective PSF that can occur in coadded images at boundaries in coverage between individual exposures. In these regions, the local PSF model can fail to accurately fit the point-like sources, and accordingly, both the coadd morphological classifications (i.e., SPREAD_MODEL_, CLASS_STAR) and coadd PSF photometry are suspect. The photometry of extended sources is impacted to a lesser degree. Using the -band as an example, we identified such coadd PSF failures by searching for regions with anomalous coadd SPREAD_MODEL_I distributions and estimate that of the footprint is substantially affected. Generally, more robust treatment (especially for point-like sources) is possible with weighted-average quantities, at the cost of some loss of object detection completeness for the faintest sources (Figure 16). Due to the known issues in coadd PSF photometry, DES DR1 does not include the coadd MAG_PSF quantities. For studies of point-like sources, we recommend the use of WAVG_MAG_PSF (bright sources) or MAG_AUTO (faint sources).
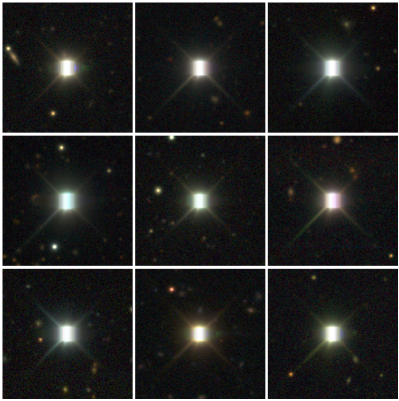
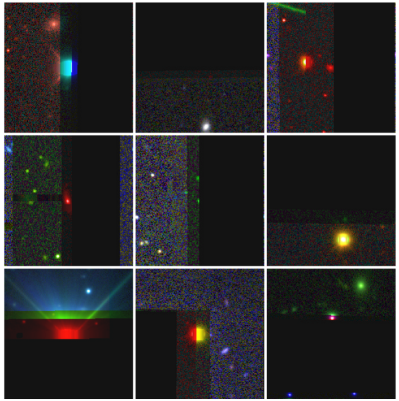
Among all the objects detected and cataloged, have been flagged by IMAFLAGS_ISO in at least one of the bands, and have artifacts in all 5 bands. As described in Section 4.3 it is recommended to use as a first filter of clean objects. Most of the objects with are saturated stars (Figure 17). A smaller fraction of flagged objects are missing imaging data in one or more of the bands, as shown in Figure 18, and usually have , that is set for objects that did not converge during the photometry measurement.
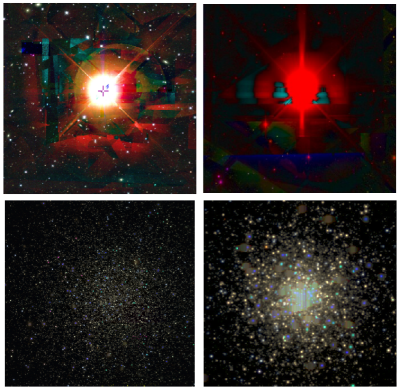
Scattered light from very bright stars can impact the photometry of nearby objects. Table 4 lists the coordinates and magnitudes of bright stars in the DES footprint. These stars generally cause ragged holes in the imaging coverage of DES DR1 due to image-level blacklisting of scattered light artifacts (Figure 19). Scattered light from these stars extends beyond image- and catalog-level masking, and can be observed at in the number counts of objects with extreme colors, i.e. or (Drlica-Wagner et al., 2018). Additional care must be taken for analyses close to bright stars.
The DESDM processing pipeline is designed for extra-galactic science at high-Galactic latitudes. As such, it is not optimized to detect or measure sources in extremely crowded regions. Failures in source deblending are most noticeable in the cores of Galactic globular clusters, where source confusion and saturation reduce the catalog completeness appreciably. Table 5 lists 5 classical globular clusters within the DES DR1 footprint with integrated -band magnitude brighter than 10 (Harris, 1996, 2010 edition). The bottom panels of Figure 19 show two of these clusters, NGC 288 and NGC 1904, where saturation and source confusion can greatly impact source detection and photometric measurements. In addition, nearby bright galaxies (such as NGC 253, NGC 247, NGC 55, and IC 1613) are sometimes deblended into numerous individual objects, and some nearby edge-on spiral galaxies are partially masked.
| Star | RA | DEC | Apparent Magnitude |
|---|---|---|---|
| (deg) | (deg) | (V mag) | |
| Col (Phact) | 84.9121 | -34.0741 | 2.65 |
| Phe (Ankaa) | 6.5708 | -42.3061 | 2.38 |
| Eri (Achernar) | 24.4288 | -57.2367 | 0.46 |
| Hya (Alphard) | 29.6925 | -61.5697 | 2.00 |
| Eri (Zaurak) | 59.5075 | -13.5086 | 2.91 |
| Dor | 69.1900 | -62.0775 | 5.40 |
| Car (Canopus) | 95.9879 | -52.6958 | -0.74 |
| Pav (Peacock) | 306.4121 | -56.7350 | 1.94 |
| Gru (Alnair) | 332.0583 | -46.9611 | 1.74 |
| Gru (Tiaki) | 340.6671 | -46.8847 | 2.15 |
| Globular Cluster | RA | DEC | Apparent Magnitude |
|---|---|---|---|
| (deg) | (deg) | (mag) | |
| NGC 288 | 13.2 | -26.58 | 8.1 |
| NGC 1261 | 48.075 | -55.13 | 8.4 |
| NGC 1851 | 78.525 | -40.05 | 7.3 |
| NGC 1904 | 81.045 | -24.523 | 8.0 |
| NGC 7089 | 323.375 | -0.8167 | 6.5 |
The tabulated “DES DR1 Standard Bandpasses” (Figure 1, Section 5.4) included in this release were not the ones used to calculate the zeropoints applied to the calibrated images and coadd source catalogs presented in DR1, but instead correspond to an earlier version of the system throughput referred to as the “Y3A1 Standard Bandpasses”. The latter system, that was the one available at the time of data processing, differs from the DES DR1 Standard Bandpasses in the treatment of the out-of-band system response. The DES DR1 Standard Bandpasses correct for a small inaccurate representation of -band throughput in the Y3A1 Standard Bandpasses, which due to an incorrect input calibration run, considered an unrealistically large light leakage relative to the in-band response () at wavelengths and . For coadd objects, the impact of setting the out-of-band response to zero in the DES DR1 Standard Bandpasses would lead to a photometry difference of (RMS) in the bands, which is below the level of statistical uncertainty in the coadd zeropoints (Section 4.2).
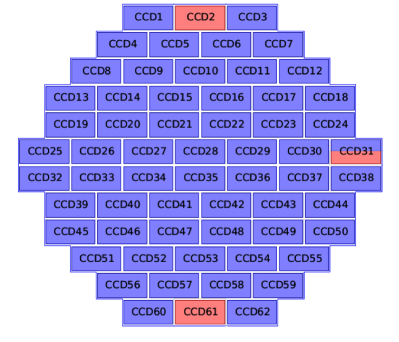
59.5 of the 62 science CCDs in the DECam focal plane have been fully operational during the DR1 data collection period. CCD 61, which failed in 2012, was not processed for the DR1 dataset. Similarly, CCD 2 was not processed between November 2013 and December 2016 (overlapping with observations included in this release), during which time it was not functional. Amplifier A of CCD 31 has an unpredictable, time-variable gain and is not included in this release. Amplifier B of CCD 31 functions normally and has been included. The rest of the science CCDs are performing within specifications and are usable for science. See Figure 20 for a layout of the DECam focal plane mosaic with the positions of affected CCDs marked.
5 Release products
Here we detail the individual products included in DES DR1. The primary components of DES DR1 are derived from the union of 10,338 coadd tiles covering the DES footprint. The tile distribution for a portion of the SDSS Stripe 82 region is shown in the inset of Figure 2. To view all tiles and a HEALPix map (nside = 32) of 1753 pixels covering the entire DR1, visit https://des.ncsa.illinois.edu/easyweb/footprint.
5.1 Images
DES DR1 images can be grouped into two categories:
-
a)
Calibrated Single Exposures: 38,850 exposures with photometric calibration, corresponding to 4,124,753 individual CCD images. The number of exposures per band are , , , and . Each raw exposure is in size (compressed). These images can be accessed through NOAO Data Lab.151515http://datalab.noao.edu/
-
b)
Coadd Images: As a result of the Multi-Epoch Pipeline described in Section 3 a total of 10,338 tiles of 10k 10k pixels spanning on a side at a resolution of 0.263 /pixel (see inset of Figure 2) were produced in each of the five bands. These images along with the combined detection image used are publicly available with a total of 62,028 images constituting of data.
5.2 Catalogs
The coadd source extraction process detected and cataloged 399,263,026 distinct objects. Morphological object information includes object centroids, shape parameters, HEALPix indices, and processing flags. Several different photometric measurements and associated uncertainties are provided, including AUTO, PETRO, WAVG_PSF, and assorted aperture magnitudes (Table 6). These measurements are distributed in three database tables: DR1_MAIN_, DR1_MAGNITUDE_, and DR1_FLUX_ served from an Oracle database at NCSA. The DR1_MAIN_ table contains all object information that is not a photometric measurement or uncertainty, augmented by MAG_AUTO_ and WAVG_MAG_PSF (and associated uncertainties), and interstellar extinction corrected versions. The other two tables contain auxiliary magnitude and flux measurements (with associated uncertainties) in addition to extra information that is present in all three tables, such as coordinates, flags, and HEALPix indices. We note that these tables contain two sets of coordinates for the objects, namely, (RA,DEC) and (ALPHAWIN_J2000,DELTAWIN_J2000) that are computed in the same manner; the difference between them is that RA and DEC are truncated to six decimals in order to provide a search indexing and table partitioning on these columns, while ALPHAWIN_J2000 and DELTAWIN_J2000 are double precision quantities to be use when precise measurements are needed. All spatial-based queries should use RA and DEC in their condition statements. Additionally, the table DR1_TILE_INFO_ contains information about the processed tiles, such as sky location, geometry, number of objects, and file paths to access the associated images and object catalogs. For a complete description of these tables, we refer the reader to Appendix E.
| Column Name | Diameter | Diameter |
|---|---|---|
| (pixels) | () | |
| MAG_APER_1 | 1.85 | 0.49 |
| MAG_APER_2 | 3.70 | 0.97 |
| MAG_APER_3 | 5.55 | 1.46 |
| MAG_APER_4 | 7.41 | 1.95 |
| MAG_APER_5 | 11.11 | 2.92 |
| MAG_APER_6 | 14.81 | 3.90 |
| MAG_APER_7 | 18.52 | 4.87 |
| MAG_APER_8 | 22.22 | 5.84 |
| MAG_APER_9 | 25.93 | 6.82 |
| MAG_APER_10 | 29.63 | 7.79 |
| MAG_APER_11 | 44.44 | 11.69 |
| MAG_APER_12 | 66.67 | 17.53 |
5.3 Files
In order to provide a convenient way to download all the catalog data at once, and noting that the tile is the basic processing unit for the survey, we have created FITS file versions of the catalog tables grouped by coadd tile. This amounts to 31,014 total files (for the DR1_MAIN_, DR1_MAGNITUDE_, and DR1_FLUX_ tables) with almost 2.5 of catalog data. Both the catalog and corresponding image file paths can be obtained from the DR1_TILE_INFO_ table (see Appendix C for an example) and can be accessed through the interfaces described in Section 6.
5.4 DES DR1 Standard Bandpasses
DES DR1 includes an updated characterization of the Blanco/DECam total system response (instrument and atmosphere) for the bands (Figure 1).161616http://www.ctio.noao.edu/noao/content/DECam-filter-information The DES DR1 Standard Bandpasses are defined as the average CCD response across the focal plane as measured with the DECal system (Marshall et al., 2013), together with a standard atmospheric transmission computed with the MODTRAN IV code (Berk et al., 1999) using parameters typical of the environmental conditions encountered during DES observations (for details, see Burke et al., 2017). For example, the airmass adopted for the standard atmosphere, 1.2, is well matched to the median airmass of exposures entering the coadd, 1.22. The system response is defined in steps of 5 Å from 3800 Å to 11000 Å. Out-of-band light leakage has been directly measured with DECal to be relative to the in-band response, and vendor measurements of witness samples suggest that the out-of-band leakage is typically at the to level. While detailed characterization of the out-of-band response is ongoing, the throughput of the DES DR1 Standard Bandpasses are defined as zero for out-of-band wavelengths (caveats are mentioned in Section 4.6).
5.5 Software
All software used in the DESDM pipelines described in Section 3 and in Morganson et al. (2018) can be accessed from the release page itself171717https://des.ncsa.illinois.edu/releases/dr1/dr1-docs/processing or from the DES Github Organization.181818https://github.com/DarkEnergySurvey Together with access to the software used to generate these products and the configuration described in Morganson et al. (2018), we provide the main ingredients to reprocess the data in a manner similar to that done by DES.
6 Data Access
Access to the DES DR1 data is provided through a collaborative partnership between NCSA,191919http://www.ncsa.illinois.edu/ LIneA,202020http://www.linea.gov.br/ and NOAO.212121https://www.noao.edu/ From these institutions, a rich and complementary set of tools and interfaces were developed to access and interact with DES data in different ways that cover a broad set of use cases that enable scientific discovery. In this section we describe the main tools provided to access DES DR1.222222https://des.ncsa.illinois.edu/releases/dr1/dr1-access
6.1 NCSA DESaccess
NCSA provides the primary set of basic web applications to access DES DR1 data. Developed at NCSA, DESaccess (https://des.ncsa.illinois.edu/easyweb) provides the user with a interface to submit asynchronized jobs to perform SQL queries against an Oracle DB that contains the DES DR1 catalogs, and to generate cutouts from a given list of positions from the coadd-images. It also contains information regarding the catalogs, an interactive footprint finder to locate positions and tiles, and means to access images and catalogs in a tile-based format. The main services can be summarized as follows:
-
•
SQL web client: We provide a SQL web client that allows the user to submit asynchronous query jobs against the Oracle 12 database that contains the DES DR1 tables. The submitted jobs enter into a queue and results can be retrieved at later times in either csv, FITS (Wells et al., 1981) or HDF5 (The HDF Group, 1997-NNNN) file format, supporting compression in some of the cases. Big jobs are divided into chunks of 1.5GB to facilitate file transfer. This interface also provides means to check syntax and to evaluate synchronous jobs for a quick view. Results files are served from a HTTP server that allows file transfer to remote machines. The query used and the results persist for a limited period of time under a “My-Jobs” tab. The query interface is powered using easyaccess (Carrasco Kind et al., 2018),232323https://github.com/mgckind/easyaccess an enhanced SQL command line interpreter designed for astronomical surveys and developed for DES.
-
•
Cutout server: The cutout server allows the user to generate cutouts up to 12′ on a side centered on a given set of positions. The returned files include cutouts in all bands, a cutout in the detection image, a color TIFF image created with STIFF (Bertin, 2012) by combining the bands, and a PNG image. The typical sizes for these files are 85 MB for the FITS images, 9 MB for the color TIF, and 16 MB for the PNG version, for the case of a cutout. These cutout jobs also go into a queue and results files can be retrieved later and served remotely. The header of the cutouts is a copy from the original header from the images with extra keys indicating the center of the cutout RA_CUTOUT and DEC_CUTOUT. Results are preserved for a limited period and can also be retrieved under a “My-Jobs” tab within the web service. No stitching is performed for objects near the edge of the tile. This feature might be added in the future.
-
•
Footprint: A light-weight interactive tool that displays the DES footprint and its tiles. This tool can be used to search for a position in the sky and return the corresponding tile information including name, corner coordinates, and list of files for download. It also allows searches by TILENAME (the tile name identifier) when the name is available. This service also provides access to all the processed tiles, including associated images and catalogs, directly from the file server.
DESaccess code242424https://github.com/mgckind/desaccess as well as the release page252525https://github.com/mgckind/des_ncsa are open sourced. The frontend was developed using web components, HTML, JS and Polymer262626https://www.polymer-project.org/ that allows the re-use of already existing elements. The backend was mainly developed using the Python Tornado web-framework.272727http://www.tornadoweb.org/en/stable/ The submission jobs are handled by Celery,282828http://www.celeryproject.org/ which is a distributed queue manager written in Python. All of these applications are containerized using Docker292929https://www.docker.com/ and all the node resourcing and scheduling, as well as all the deployment, is managed by Kubernetes,303030https://kubernetes.io/ that allows to run, manage, and scale containerized applications in a robust and efficient manner.
6.2 LIneA Science Server
The images and catalogs generated by DESDM for DR1 can also be accessed by an interface developed by the Laboratorio Interinstitucional de e-Astronomia (LIneA) that supports the participation of Brazilian scientists in DES. It has been designed to offer ways to examine both images and catalogs, compare these with the results of other surveys, and examine the results of queries to the database. The interface consists of the following three services:
-
•
Sky/Image viewer: The Sky/Image viewer combination integrates third-party tools to allow the user to visualize the entire sky map produced by DES (Aladin Light313131http://aladin.u-strasbg.fr/AladinLite/ developed by CDS323232http://cds.u-strasbg.fr/) in the form of a HIPs color-coded image, as well as each individual tile using VisiOmatic (Bertin et al., 2015). The native functions, such as zoom, have been augmented with: 1) an image layer that allows the display of other surveys; 2) a position locator; 3) the possibility of sharing a display with other users; 4) a map viewer that allows the display of HEALpix maps generated during the processing of the data (e.g., a map of the number of images available at each point in the sky); 5) different grids and polylines including the original coadd tiles and the border of the DES footprint; 6) access to the image of a specific tile, which can be examined using VisiOmatic.
The image viewer can be used to examine the tile as a whole and to inspect a specific position on the sky in more detail using the native functions of the tool that include snapshot, profile overlays, contrast settings, color mix, zoom, full screen mode, and catalog overlay. The interface also allows side-by-side comparison of the same sky region using different settings. Other useful functions are the ability to switch on/off markers, recenter the display to provide a visualization of the entire tile, crop part of the image, and download the fits images and catalog associated with the tile being displayed.
Finally, one can also overlay object catalogs, which are classified into three categories: 1) targets - list of positions or objects either uploaded or created using the Target viewer and User Query services described below; 2) object catalog - the DES DR1 object catalog produced by DESDM; 3) external catalogs - a sample of catalogs available in Vizier. To facilitate the comparison between catalogs, the user can change the symbol, color, and size of each catalog it selects to display.
-
•
Target Viewer: This service enables the user to examine a list of uploaded positions of objects selected using the User Query service described below. The first page provides a summary of the available target lists, the ability to upload/delete lists, and the ability to mark favorite lists. Adding a list can be done by pasting a list of (RA, Dec) coordinates. Once a list is selected, the image surrounding an object/position can be visualized by selecting an entry in the list and the corresponding position. The user can then select the columns to be shown, sort according to a given attribute, and comment, rank and reject an entry. One can also apply a filter and the filtered list can be downloaded (as csv or FITS file) or saved for future use.
-
•
User Query: This service provides access to the database table storing the DES DR1 data from which SQL queries can be written, validated, and executed. The resulting table is displayed under “My Tables” where it can be renamed, a few lines of its content listed, and deleted. Objects selected can be immediately viewed in the Target Viewer after the columns of the resulting table are properly associated with those recognized by the tool.
Given the suite of functionalities available in each tool, tutorials in the form of videos have been prepared to help introduce first-time users to the services. Information about the current limitations is available in the help associated with each tool.
6.3 NOAO Data Lab
The NOAO Data Lab (Fitzpatrick et al., 2016) is one of the access portals for DES DR1. The goal of the Data Lab is to enable efficient exploration and analysis of large datasets, including catalogs, with a particular focus on surveys using DECam and the NOAO Mosaic cameras. Among its features are a database for catalog data, accessible both from a Table Access Protocol (TAP333333http://ivoa.net/documents/TAP) service and from direct PostgreSQL queries, web-based, command-line and programmatic catalog and image query interfaces (both custom and via standard VO protocols), remote storage space for personal database and files, a JupyterHub-based notebook analysis environment, and a Simple Image Access (SIA) service. The Data Lab hosts the DES DR1 catalog tables using a PostgreSQL v9.6 database on the backend. The data are identical to those hosted by the DES Collaboration through the NCSA portal, but with a few additions; first, the Data Lab database contains tables with crossmatches to other large catalogs (AllWISE, GALEX, HSC, and Simbad) and a table of neighboring objects within a 30 arcsecond radius for all objects in DES. Second, the main table contains a few extra columns, such as Ecliptic and Galactic coordinates, an HTM343434http://www.skyserver.org/htm (Hierarchical Triangular Mesh) index, two supplementary HEALPix indices in RING (nside = 256) and NESTED (nside = 4096) schemes, and precomputed colors. Finally, the data are clustered and indexed using the Q3C scheme (Koposov & Bartunov, 2006), allowing Q3C functions to perform fast spatial queries on the tables.
6.3.1 Data Lab Services
-
•
Both anonymous and authenticated access to DES DR1 through Data Lab services. Anonymous users of the Data Lab can query the DES DR1 database and use the web-based tools. By creating and logging into an account through datalab.noao.edu, authenticated users get access to a dedicated Jupyter notebook server with permanently stored notebooks and 1 TB of storage space for personal database tables and files.
-
•
Access to DES DR1 through TAP. The Data Lab exposes the DES DR1 catalog through a TAP service, which may be accessed through a web query form and schema browser. Alternately, users may query DES DR1 through TOPCAT (Taylor, 2005) by pointing to the URL of the Data Lab TAP service (http://datalab.noao.edu/tap) from within the application.
-
•
Python and command-line query clients. The Data Lab client package (https://github.com/noao-datalab/datalab-client) contains the multipurpose datalab command-line interface and the queryClient Python module. Both interfaces allow synchronous queries from a personal computer, for which control is suspended until a result is returned, using either ADQL (the native TAP interface query language) or the Postgres SQL syntax. The user may also run asynchronous ADQL queries, for which the query operation is given a job ID and run in the background, through the TAP service. The queryClient module is preinstalled on the Data Lab Jupyter notebook server.
-
•
An image cutout service. The Data Lab SIA service provides access to cutouts of the DES DR1 images. For a given position on the sky, the SIA service returns a table of metadata of all images that fall within the specified radius. The metadata includes select header information for each image, along with a URL to retrieve a cutout of a specified size.
-
•
A JupyterHub notebook server and compute environment. This server provides access to common Python libraries as well as all Data Lab Python modules, including the authClient authorization module, the queryClient query module, the storeClient virtual storage module, other interface modules and multiple examples. The Jupyter notebook server provides a convenient way to run code close to the data.
More information on using these services is available on the Data Lab web page: http://datalab.noao.edu.
7 Summary and Future Releases
DES has provided a deep view of the south Galactic cap with precise photometry that will ultimately reach th magnitude in the band over deg2. We have described here an overview of the survey, the data acquisition and processing pipelines and gave more details on the release products, the data validation, the known issues and the data access services for the first major public release (DR1).
This release is composed of the reduced images and wide-field coadd source catalogs from the first three years of full science operations, consisting in almost 39,000 single exposure images, close to 62,000 coadd images (including all bands and detection images) covering 10,338 tiles over the DES footprint, resulting in nearly 400M distinct cataloged objects. Benchmark galaxy and stellar samples contain and objects, respectively, following a basic object quality selection.
The primary attributes of DES DR1 are summarized in Table 1, and the data products can be accessed from several complementary platforms hosted at NCSA, NOAO, and LIneA, available at https://des.ncsa.illinois.edu/releases/dr1. The overall high quality and homogeneity of the release will provide a rich legacy for the international astrophysics community (e.g., Dark Energy Survey Collaboration et al., 2016).
DES finishes its scheduled observations in early 2019 and we expect the next major public DES data release (DR2) will be based on the products available after the survey is completed.
Appendix A DES Terminology
-
•
Image: a single raw output file corresponding to 1 of the 62 science CCDs in the DECam focal plane.
-
•
Hex: a hexagonal field on the sky nominally covered by the 62 science CCDs of a single DECam pointing.
-
•
Exposure: a collection of 62 science CCD images corresponding to a single pointing of DECam.
-
•
Tiling: a collection of DECam pointings that covers the DES footprint with minimal gaps and overlaps in a single filter.
-
•
Tile: a sky area unit used by DESDM to parcel the DES footprint and organize the coadd outputs. Each tile is 07306 on a side.
-
•
Single-epoch: relates to the collection and analysis of individual exposures for a single band prior to coaddition.
-
•
Coadd: the process of combining the data from multiple exposures over an area in order to increase depth.
-
•
Y3A2 Release: second annual internal release by DESDM to the DES Collaboration of data products obtained from the first three seasons of DES science operations and the Science Verification period. DR1 is based on Y3A2.
Appendix B Photometric Transformations
We provide empirical photometric transformations between DES and other surveys that were used for the validation of DR1 data products.
B.1 Gaia
A sample of stars taken from the deep supernova fields with at least 25 observations in each of the , , and bands were matched to Gaia stars with . The Gaia -band magnitudes predicted from from DES photometry are
| (B1) |
valid for stars with .
B.2 CFHTLenS
As described in Section 4.4, we transformed photometry from the CFHTLenS survey to the DES system to report the detection efficiency of CFHTLenS objects as a function of magnitude in the DES system. The corresponding transformation equations, which were empirically derived from matched stars with high measured signal-to-noise are:
| (B2) | |||
Appendix C Example queries
We provide several example SQL queries to the DR1 Oracle database tables. Note that these queries can be easily modified to ADQL language used by the TAP service at NOAO Data Labs.
-
1.
Sample of objects: This query returns a sample of 0.0001% of objects from DR1.
SELECT ra, dec, mag_auto_g FROM dr1_main SAMPLE(0.0001);Also, one can select the first rows of a table with a command like
SELECT ra, dec, mag_auto_g FROM dr1_main WHERE ROWNUM <= 10; -
2.
Select stars from the M2 globular cluster: This query uses the EXTENDED_COADD example morphological classifier to separate point-like stars from spatially extended galaxies (see Section 4.5). An interstellar reddening correction has been pre-applied to the columns marked with the _DERED suffix (see Section 4.2). This query was used to generate Figure 16.
SELECTcoadd_object_id,ra, dec, ebv_sfd98,mag_auto_g_dered,mag_auto_r_dered,wavg_mag_psf_g_dered,wavg_mag_psf_r_deredFROMdr1_mainWHEREra BETWEEN 323.36 - 0.125 AND 323.36 + 0.125AND dec BETWEEN -0.82 - 0.125 AND -0.82 + 0.125AND ( (CASE WHEN spread_model_i + 3. * spreaderr_model_i > 0.005 THEN 1 ELSE 0 END) +(CASE WHEN spread_model_i + 1. * spreaderr_model_i > 0.003 THEN 1 ELSE 0 END) +(CASE WHEN spread_model_i - 1. * spreaderr_model_i > 0.003 THEN 1 ELSE 0 END) ) <= 1AND spread_model_i BETWEEN -0.05 AND 0.05AND imaflags_iso_g = 0AND imaflags_iso_r = 0AND flags_g < 4AND flags_r < 4; -
3.
Create galaxy density map: Create a HEALPix (NEST schema, celestial coordinates) galaxy density map at resolution nside = 1024 ( 3.4′)
SELECThpix_1024, COUNT(mag_auto_i), AVG(mag_auto_i)FROMdr1_mainWHERE( (CASE WHEN spread_model_i + 3. * spreaderr_model_i > 0.005 THEN 1 ELSE 0 END) +(CASE WHEN spread_model_i + 1. * spreaderr_model_i > 0.003 THEN 1 ELSE 0 END) +(CASE WHEN spread_model_i - 1. * spreaderr_model_i > 0.003 THEN 1 ELSE 0 END) ) = 3AND spread_model_i BETWEEN -0.05 AND 0.05AND imaflags_iso_i = 0AND flags_i < 4AND mag_auto_i < 23GROUP BYhpix_1024; -
4.
Return urls for the complete coadd object catalogs and coadd images within a small patch of sky:
SELECTtilename,fits_dr1_main,fits_image_g, fits_image_r, fits_image_i, fits_image_z, fits_image_yFROMdr1_tile_infoWHEREra_cent BETWEEN 30. AND 32.AND dec_cent BETWEEN -6. AND -4.;
Appendix D SExtractor Flags
Table D.1 summarizes the standard warning flags provided by SExtractor, encoded in the FLAGS bitmask column for each band.
| Bit | Description |
|---|---|
| 1 | The object has neighbours, bright and close enough to significantly bias the |
| MAG AUTO photometry, or bad pixels (more than 10% of the integrated area affected) | |
| 2 | The object was originally blended with another one |
| 4 | At least one pixel of the object is saturated (or very close to) |
| 8 | The object is truncated (too close to an image boundary) |
| 16 | Object’s aperture data are incomplete or corrupted |
| 32 | Object’s isophotal data are incomplete or corrupted |
| 64 | A memory overflow occurred during deblending |
| 128 | A memory overflow occurred during extraction |
Appendix E Released Tables
The DR1 catalog data is mostly comprised of four tables. DR1_MAIN_ includes all the main quantities extracted from the coadd pipeline and important information about the objects. That table also includes MAG_AUTO_ and WAVG_MAG_PSF, as well as the corresponding dereddened magnitudes. DR1_FLUX_ and DR1_MAGNITUDE_ contain 15 different measurements of the fluxes and magnitudes for each object. Additionally, these three tables share some commonly used columns to facilitate queries (by avoiding the need to join multiple tables). The fourth table, DR1_TILE_INFO_ contains information relevant to the processed tiles, from the tile geometry to the urls of associated files.
| Column Name | Description | Number of columns |
|---|---|---|
| COADD_OBJECT_ID | Unique identifier for the coadded objects | 1 |
| TILENAME | Identifier of each one of the tiles on which the survey is gridded | 1 |
| RA | Right ascension, with quantized precision for indexing (ALPHAWIN_J2000 has full precision | 1 |
| but not indexed) [degrees] | ||
| ALPHAWIN_J2000 | Right ascension for the object, J2000 in ICRS system (full precision but not indexed) [degrees] | 1 |
| DEC | Declination, with quantized precision for indexing (DELTAWIN_J2000 has full precision but not indexed) [degrees] | 1 |
| DELTAWIN_J2000 | Declination for the object, J2000 in ICRS system (full precision but not | 1 |
| indexed) [degrees] | ||
| GALACTIC_L | Galactic Longitude [degrees] | 1 |
| GALACTIC_B | Galactic Latitude [degrees] | 1 |
| XWIN_IMAGE | X-centroid from windowed measurements on coadded image [pixel] | 1 |
| YWIN_IMAGE | Y-centroid from windowed measurements on coadded image [pixel] | 1 |
| XWIN_IMAGE_G,R,I,Z,Y | X-centroid from windowed measurements on coadded band image [pixel] | 5 |
| YWIN_IMAGE_G,R,I,Z,Y | Y-centroid from windowed measurements on coadded band images [pixel] | 5 |
| X2WIN_IMAGE_G,R,I,Z,Y | Second moment in x-direction, from converged windowed measurements [pixel2] | 5 |
| ERRX2WIN_IMAGE_G,R,I,Z,Y | Uncertainty in second moment of x-distribution centroid, from converged windowed measurements [pixel2] | 5 |
| Y2WIN_IMAGE_G,R,I,Z,Y | Second moment in y-direction, from converged windowed measurements [pixel2] | 5 |
| ERRY2WIN_IMAGE_G,R,I,Z,Y | Uncertainty in second moment of y-distribution centroid, from converged windowed measurements [pixel2] | 5 |
| XYWIN_IMAGE_G,R,I,Z,Y | Second moment in xy-direction, from converged windowed measurements [pixel2] | 5 |
| ERRXYWIN_IMAGE_G,R,I,Z,Y | Uncertainty in second moment of xy-distribution, from converged windowed measurements [pixel2] | 5 |
| HPIX_32,64,1024,4096,16384 | Healpix identifier for its nside grid size, in a NESTED schema | 5 |
| NEPOCHS_G,R,I,Z,Y | Number of epochs the source is detected in single epoch images | 5 |
| NITER_MODEL_G,R,I,Z,Y | Number of iterations in model fitting photometric measurements | 5 |
| ISOAREA_IMAGE_G,R,I,Z,Y | Isophotal area of the coadded source [pixel2] | 5 |
| A_IMAGE | Major axis size based on an isophotal model [pixel] | 1 |
| ERRA_IMAGE | Uncertainty in major axis size, from isophotal model [pixel] | 1 |
| AWIN_IMAGE_G,R,I,Z,Y | Major axis size, from 2nd order windowed moment measurements [pixels] | 5 |
| ERRAWIN_IMAGE_G,R,I,Z,Y | Uncertainty in major axis size, from converged windowed measurement, assuming uncorrelated noise [pixel] | 5 |
| B_IMAGE | Minor axis size based on an isophotal model [pixel] | 1 |
| ERRB_IMAGE | Uncertainty in minor axis size, from isophotal model [pixel] | 1 |
| BWIN_IMAGE_G,R,I,Z,Y | Minor axis size, from 2nd order windowed moment measurements [pixels] | 5 |
| ERRBWIN_IMAGE_G,R,I,Z,Y | Uncertainty in minor axis size, from converged windowed measurement, assuming uncorrelated noise [pixel] | 5 |
| THETA_J2000 | Position angle of source in J2000 coordinates, from non-windowed measurement [degrees] | 1 |
| ERRTHETA_IMAGE | Uncertainty in source position, from isophotal model [degrees] | 1 |
| THETAWIN_IMAGE_G,R,I,Z,Y | Position angle of source, for converged windowed measurement grow from x to y [degrees] | 5 |
| ERRTHETAWIN_IMAGE_G,R,I,Z,Y | Uncertainty in source position angle, from converged windowed measurement [degrees] | 5 |
| FWHM_IMAGE_G,R,I,Z,Y | FWHM measured from the isophotal area, from elliptical growth-curve, modeled in 2 dimensions [pixel] | 5 |
| FLUX_RADIUS_G,R,I,Z,Y | Half-light radius for the object, from elliptical growth-curve, modeled in 2 dimensions [pixel] | 5 |
| KRON_RADIUS | Kron radius measured from detection image [pixel] | 1 |
| KRON_RADIUS_G,R,I,Z,Y | Kron radius measured from coadded image [pixel] | 5 |
| CLASS_STAR_G,R,I,Z,Y | Simple morphological extended source classifier. Values between 0 (galaxies) and 1 (stars). | 5 |
| SPREAD_MODEL exhibits better performance for morphological classification. | ||
| SPREAD_MODEL_G,R,I,Z,Y | Morphology based classifier based on comparison between a PSF versus exponential-PSF model. | 5 |
| Values closer to 0 correspond to stars, larger values correspond to galaxies | ||
| SPREADERR_MODEL_G,R,I,Z,Y | Uncertainty in morphology based classifier based on comparison between PSF versus exponential-PSF model. | 5 |
| WAVG_SPREAD_MODEL_G,R,I,Z,Y | SPREAD MODEL using the weighted averaged values from single epoch detections | 5 |
| WAVG_SPREADERR_MODEL_G,R,I,Z,Y | Uncertainty in SPREAD MODEL using the weighted averaged values from single epoch detections | 5 |
| FLUX_AUTO_G,R,I,Z,Y | Aperture-flux measurement, elliptical model based on the Kron radius [ADU] | 5 |
| FLUXERR_AUTO_G,R,I,Z,Y | Uncertainty in aperture-flux measurement, elliptical model based on the Kron radius [ADU] | 5 |
| WAVG_FLUX_PSF_G,R,I,Z,Y | Weighted average flux measurement of PSF fit single epoch detections [ADU] | 5 |
| WAVG_FLUXERR_PSF_G,R,I,Z,Y | Uncertainty of weighted averaged flux measurement of PSF fit single epoch detections [ADU] | 5 |
| MAG_AUTO_G,R,I,Z,Y | Magnitude estimation, for an elliptical model based on the Kron radius [mag] | 5 |
| MAGERR_AUTO_G,R,I,Z,Y | Uncertainty in magnitude estimation, for an elliptical model based on the Kron radius [mag] | 5 |
| MAG_AUTO_G,R,I,Z,Y_DERED | Dereddened magnitude estimation (using SFD98), for an elliptical model based on the Kron radius [mag] | 5 |
| WAVG_MAG_PSF_G,R,I,Z,Y | Weighted average magnitude, of PSF fit single epoch detections [mag] | 5 |
| WAVG_MAGERR_PSF_G,R,I,Z,Y | Uncertainty of weighted averaged magnitude, of PSF fit single epoch detections [mag] | 5 |
| WAVG_MAG_PSF_G,R,I,Z,Y_DERED | Dereddened weighted average magnitude (using SFD98) from PSF fit single epoch detections [mag] | 5 |
| EBV_SFD98 | E(B-V) reddening coefficient from Schlegel, Finkbeiner & Davis, 1998 [mag] | 1 |
| BACKGROUND_G,R,I,Z,Y | Background level, by CCD-amplifier [mag] | 5 |
| FLAGS_G,R,I,Z,Y | Additive flag describing cautionary advice about source extraction process. Use less than 4 for well behaved objects | 5 |
| IMAFLAGS_ISO_G,R,I,Z,Y | Flag identifying sources with missing/flagged pixels, considering all single epoch images | 5 |
| Column Name | Description | Number of columns |
|---|---|---|
| COADD_OBJECT_ID | Unique identifier for the coadded objects | 1 |
| TILENAME | Identifier of each one of the tiles on which the survey is gridded | 1 |
| RA | Right ascension, with quantized precision for indexing (ALPHAWIN_J2000 has full precision but not indexed) [degrees] | 1 |
| ALPHAWIN_J2000 | Right ascension for the object, J2000 in ICRS system (full precision but not indexed) [degrees] | 1 |
| DEC | Declination, with quantized precision for indexing (DELTAWIN_J2000 has full precision but not indexed) [degrees] | 1 |
| DELTAWIN_J2000 | Declination for the object, J2000 in ICRS system (full precision but not indexed) [degrees] | 1 |
| XWIN_IMAGE | X-centroid of source (from coadd detection image) [pixel] | 1 |
| YWIN_IMAGE | Y-centroid of source (from coadd detection image) [pixel] | 1 |
| HPIX_32,64,1024,4096,16384 | Healpix identifier for its nside grid size, in a NESTED schema | 5 |
| FLUX_AUTO_G,R,I,Z,Y | Flux measurement, for an elliptical model based on the Kron radius [ADU] | 5 |
| FLUXERR_AUTO_G,R,I,Z,Y | Uncertainty in flux measurement, for an elliptical model based on the Kron radius [ADU] | 5 |
| FLUX_APER_1-12_G,R,I,Z,Y | Flux measurement for circular apertures [ADU] | 60 |
| FLUXERR_APER_1-12_G,R,I,Z,Y | Uncertainty in flux measurement for circular apertures [ADU] | 60 |
| FLUX_PETRO_G,R,I,Z,Y | Flux for a Petrosian radius [ADU] | 5 |
| FLUXERR_PETRO_G,R,I,Z,Y | Uncertainty in flux for a Petrosian radius [ADU] | 5 |
| WAVG_FLUX_PSF_G,R,I,Z,Y | Weighted averaged flux, of PSF fit single epoch detections [ADU] | 5 |
| WAVG_FLUXERR_PSF_G,R,I,Z,Y | Uncertainty of weighted averaged flux, of PSF fit single epoch detections [ADU] | 5 |
| PETRO_RADIUS_G,R,I,Z,Y | Petrosian radius [pixel] | 5 |
| EBV_SFD98 | E(B-V) reddening coefficient from Schlegel, Finkbeiner & Davis, 1998 [mag] | 1 |
| FLAGS_G,R,I,Z,Y | Additive flag describing cautionary advice about source extraction process. Use less than 4 for well behaved objects | 5 |
| IMAFLAGS_ISO_G,R,I,Z,Y | Flag identifying sources with missing/flagged pixels, considering all single epoch images | 5 |
| Column Name | Description | Number of columns |
|---|---|---|
| COADD_OBJECT_ID | Unique identifier for the coadded objects | 1 |
| TILENAME | Identifier of each one of the tiles on which the survey is gridded | 1 |
| RA | Right ascension, with quantized precision for indexing (ALPHAWIN_J2000 has full precision but not indexed) [degrees] | 1 |
| ALPHAWIN_J2000 | Right ascension for the object, J2000 in ICRS system (full precision but not indexed) [degrees] | 1 |
| DEC | Declination, with quantized precision for indexing (DELTAWIN_J2000 has full precision but not indexed) [degrees] | 1 |
| DELTAWIN_J2000 | Declination for the object, J2000 in ICRS system (full precision but not indexed) [degrees] | 1 |
| XWIN_IMAGE | X-centroid from windowed measurements on coadded image [pixel] | 1 |
| YWIN_IMAGE | Y-centroid from windowed measurements on coadded image [pixel] | 1 |
| HPIX_32,64,1024,4096,16384 | Healpix identifier for its nside grid size, in a NESTED schema | 5 |
| MAG_AUTO_G,R,I,Z,Y | Magnitude estimation, for an elliptical model based on the Kron radius [mag] | 5 |
| MAGERR_AUTO_G,R,I,Z,Y | Uncertainty in magnitude estimation, for an elliptical model based on the Kron radius [mag] | 5 |
| MAG_APER_1-12_G,R,I,Z,Y | Magnitude estimation for circular apertures [mag] | 60 |
| MAGERR_APER_1-12_G,R,I,Z,Y | Uncertainty in magnitude estimation for circular apertures [mag] | 60 |
| MAG_PETRO_G,R,I,Z,Y | Magnitude for a Petrosian radius [mag] | 5 |
| MAGERR_PETRO_G,R,I,Z,Y | Uncertainty in magnitude for a Petrosian radius [mag] | 5 |
| WAVG_MAG_PSF_G,R,I,Z,Y | Weighted average magnitude, of PSF fit single epoch detections [mag] | 5 |
| WAVG_MAGERR_PSF_G,R,I,Z,Y | Uncertainty of weighted averaged magnitude, of PSF fit single epoch detections [mag] | 5 |
| PETRO_RADIUS_G,R,I,Z,Y | Petrosian radius [pixel] | 5 |
| EBV_SFD98 | E(B-V) reddening coefficient from Schlegel, Finkbeiner & Davis, 1998 [mag] | 1 |
| FLAGS_G,R,I,Z,Y | Additive flag describing cautionary advice about source extraction process. Use less than 4 for well behaved objects | 5 |
| IMAFLAGS_ISO_G,R,I,Z,Y | Flag identifying sources with missing/flagged pixels, considering all single epoch images | 5 |
| Column Name | Description | Number of columns |
|---|---|---|
| TILENAME | Tilename identifier | 1 |
| RA_CENT | Central Right Ascension for tile [degrees] | 1 |
| DEC_CENT | Central Declination for tile [degrees] | 1 |
| COUNT | Number of objects per tile | 1 |
| RAC1 | Right Ascension at Corner 1 of tile [degrees] | 1 |
| RAC2 | Right Ascension at Corner 2 of tile [degrees] | 1 |
| RAC3 | Right Ascension at Corner 3 of tile [degrees] | 1 |
| RAC4 | Right Ascension at Corner 4 of tile [degrees] | 1 |
| RACMAX | Maximum Right Ascension covered in tile [degrees] | 1 |
| RACMIN | Minimum Right Ascension covered in tile [degrees] | 1 |
| RA_SIZE | Extent of Right Ascension for tile [degrees] | 1 |
| URAMAX | Maximum Unique Right Ascension of objects measured from tile [degrees] | 1 |
| URAMIN | Minimum Unique Right Ascension of objects measured from tile [degrees] | 1 |
| DECC1 | Declination at Corner 1 of tile [degrees] | 1 |
| DECC2 | Declination at Corner 2 of tile [degrees] | 1 |
| DECC3 | Declination at Corner 3 of tile [degrees] | 1 |
| DECC4 | Declination at Corner 4 of tile [degrees] | 1 |
| DECCMAX | Maximum Declination covered in tile [degrees] | 1 |
| DECCMIN | Minimum Declination covered in tile [degrees] | 1 |
| DEC_SIZE | Extent of Declination for tile, in average is 0.7304 deg [degrees] | 1 |
| UDECMAX | Maximum Unique Declination of objects measured from tile [degrees] | 1 |
| UDECMIN | Minimum Unique Declination of objects measured from tile [degrees] | 1 |
| CTYPE1 | WCS projection used for axis 1. Value: RA—TAN | 1 |
| CTYPE2 | WCS projection used for axis 2. Value: DEC–TAN | 1 |
| NAXIS1 | WCS definition for number of pixels for axis 1 | 1 |
| NAXIS2 | WCS definition for number of pixels for axis 2 | 1 |
| CRPIX1 | WCS definition of central pixel for axis 1. Value: 5000.5 | 1 |
| CRPIX2 | WCS definition of central pixel for axis 2. Value: 5000.5 | 1 |
| CRVAL1 | WCS definition of central pixel value for axis 1 | 1 |
| CRVAL2 | WCS definition of central pixel value for axis 2 | 1 |
| CD1_1 | WCS definition for pixel orientation. Value: -0.0000730556 | 1 |
| CD1_2 | WCS definition for pixel orientation. Value: 0 | 1 |
| CD2_1 | WCS definition for pixel orientation. Value: 0 | 1 |
| CD2_2 | WCS definition for pixel orientation. Value: 0.0000730556 | 1 |
| CROSSRA0 | Flag tile bounday crosses RA=0/24h boundary. Values: Y or N | 1 |
| PIXELSCALE | WCS definition of pixel scale. Values: 0.263 arcsec/pixel [arcsec/pixel] | 1 |
| TIFF_COLOR_IMAGE | Filename of the TIFF image for the tile, being tilename_r{reqnum}p{attnum}_irg.tiff | 1 |
| FITS_DR1_FLUX | Filename of the served FITS being tilename_dr1_flux.fits.fz | 1 |
| FITS_DR1_MAGNITUDE | Filename of the served FITS being tilename_dr1_magnitude.fits.fz | 1 |
| FITS_DR1_MAIN | Filename of the served FITS being tilename_dr1_main.fits.fz | 1 |
| FITS_IMAGE_DET | Filename of the served FITS being tilename_r{reqnum}p{attnum}_det.fits.fz | 1 |
| FITS_IMAGE_G,R,I,Z,Y | Filename of the served FITS, per band, being tilename_r{reqnum}p{attnum}_band.fits.fz | 5 |
References
- Abazajian et al. (2009) Abazajian, K. N., Adelman-McCarthy, J. K., Agüeros, M. A., et al. 2009, ApJS, 182, 543
- Aihara et al. (2017a) Aihara, H., Arimoto, N., Armstrong, R., et al. 2017a, Publications of the Astronomical Society of Japan, psx066. +http://dx.doi.org/10.1093/pasj/psx066
- Aihara et al. (2017b) Aihara, H., Armstrong, R., Bickerton, S., et al. 2017b, Publications of the Astronomical Society of Japan, psx081. +http://dx.doi.org/10.1093/pasj/psx081
- Astropy Collaboration et al. (2013) Astropy Collaboration, Robitaille, T. P., Tollerud, E. J., et al. 2013, A&A, 558, A33
- Berk et al. (1999) Berk, A., Anderson, G. P., Bernstein, L. S., et al. 1999, in Proc. SPIE, Vol. 3756, Optical Spectroscopic Techniques and Instrumentation for Atmospheric and Space Research III, ed. A. M. Larar, 348–353
- Bernstein et al. (2017a) Bernstein, G. M., Abbott, T. M. C., Desai, S., et al. 2017a, PASP, 129, 114502
- Bernstein et al. (2017b) Bernstein, G. M., Armstrong, R., Plazas, A. A., et al. 2017b, PASP, 129, 074503
- Bertin (2006) Bertin, E. 2006, in Astronomical Society of the Pacific Conference Series, Vol. 351, Astronomical Data Analysis Software and Systems XV, ed. C. Gabriel, C. Arviset, D. Ponz, & S. Enrique, 112
- Bertin (2010) Bertin, E. 2010, SWarp: Resampling and Co-adding FITS Images Together, Astrophysics Source Code Library, , , ascl:1010.068
- Bertin (2011) Bertin, E. 2011, in Astronomical Society of the Pacific Conference Series, Vol. 442, Astronomical Data Analysis Software and Systems XX, ed. I. N. Evans, A. Accomazzi, D. J. Mink, & A. H. Rots, 435
- Bertin (2012) Bertin, E. 2012, in Astronomical Society of the Pacific Conference Series, Vol. 461, Astronomical Data Analysis Software and Systems XXI, ed. P. Ballester, D. Egret, & N. P. F. Lorente, 263
- Bertin & Arnouts (1996) Bertin, E., & Arnouts, S. 1996, A&AS, 117, 393
- Bertin et al. (2002) Bertin, E., Mellier, Y., Radovich, M., et al. 2002, in Astronomical Society of the Pacific Conference Series, Vol. 281, Astronomical Data Analysis Software and Systems XI, ed. D. A. Bohlender, D. Durand, & T. H. Handley, 228
- Bertin et al. (2015) Bertin, E., Pillay, R., & Marmo, C. 2015, Astronomy and Computing, 10, 43
- Bohlin et al. (2014) Bohlin, R. C., Gordon, K. D., & Tremblay, P.-E. 2014, PASP, 126, 711
- Burke et al. (2017) Burke, D., Rykoff, E. S., Allam, S., et al. 2017, ArXiv e-prints, arXiv:1706.01542
- Burke et al. (2018) Burke, D. L., Rykoff, E. S., Allam, S., et al. 2018, AJ, 155, 41
- Calabretta & Greisen (2002) Calabretta, M. R., & Greisen, E. W. 2002, A&A, 395, 1077
- Carlstrom et al. (2011) Carlstrom, J. E., Ade, P. A. R., Aird, K. A., et al. 2011, PASP, 123, 568
- Carrasco Kind et al. (2018) Carrasco Kind, M., Drlica-Wagner, A., Koziol, A. M. G., & Petravick, D. 2018, ArXiv e-prints, arXiv:1810.02721
- Chang et al. (2015) Chang, C., Busha, M. T., Wechsler, R. H., et al. 2015, ApJ, 801, 73
- Dark Energy Survey Collaboration et al. (2016) Dark Energy Survey Collaboration, Abbott, T., Abdalla, F. B., et al. 2016, MNRAS, 460, 1270
- de Jong et al. (2013) de Jong, J. T. A., Verdoes Kleijn, G. A., Kuijken, K. H., & Valentijn, E. A. 2013, Experimental Astronomy, 35, 25
- DES Collaboration (2005) DES Collaboration. 2005, ArXiv Astrophysics e-prints, astro-ph/0510346
- DES Collaboration (2017) —. 2017, ArXiv e-prints, arXiv:1708.01530
- Desai et al. (2012) Desai, S., Armstrong, R., Mohr, J. J., et al. 2012, ApJ, 757, 83
- Diehl et al. (2014) Diehl, H. T., et al. 2014, Proc. SPIE, 9149, 91490V
- Diehl et al. (2016) Diehl, H. T., Neilsen, E., Gruendl, R., et al. 2016, in Proc. SPIE, Vol. 9910, Observatory Operations: Strategies, Processes, and Systems VI, 99101D
- Drlica-Wagner et al. (2018) Drlica-Wagner, A., Sevilla-Noarbe, I., Rykoff, E. S., et al. 2018, The Astrophysical Journal Supplement Series, 235, 33
- Erben et al. (2013) Erben, T., Hildebrandt, H., Miller, L., et al. 2013, MNRAS, 433, 2545
- Fadely et al. (2012) Fadely, R., Hogg, D. W., & Willman, B. 2012, ApJ, 760, 15
- Fitzpatrick (1999) Fitzpatrick, E. L. 1999, PASP, 111, 63
- Fitzpatrick (2010) Fitzpatrick, M. 2010, in Astronomical Society of the Pacific Conference Series, Vol. 434, Astronomical Data Analysis Software and Systems XIX, ed. Y. Mizumoto, K.-I. Morita, & M. Ohishi, 260
- Fitzpatrick et al. (2016) Fitzpatrick, M. J., Graham, M. J., Mighell, K. J., et al. 2016, in Proc. SPIE, Vol. 9913, Software and Cyberinfrastructure for Astronomy IV, 99130L
- Flaugher et al. (2015) Flaugher, B., Diehl, H. T., Honscheid, K., et al. 2015, AJ, 150, 150
- Gaia Collaboration et al. (2016) Gaia Collaboration, Brown, A. G. A., Vallenari, A., et al. 2016, A&A, 595, A2
- Górski et al. (2005) Górski, K. M., Hivon, E., Banday, A. J., et al. 2005, ApJ, 622, 759
- Greisen & Calabretta (2002) Greisen, E. W., & Calabretta, M. R. 2002, A&A, 395, 1061
- Gruen et al. (2015) Gruen, D., Bernstein, G. M., Jarvis, M., et al. 2015, Journal of Instrumentation, 10, C05032
- Hamilton & Tegmark (2004) Hamilton, A. J. S., & Tegmark, M. 2004, MNRAS, 349, 115
- Harris (1996) Harris, W. E. 1996, AJ, 112, 1487
- Honscheid et al. (2008) Honscheid, K., DePoy, D. L., & for the DES Collaboration. 2008, ArXiv e-prints, arXiv:0810.3600
- Honscheid et al. (2012) Honscheid, K., Elliott, A., Annis, J., et al. 2012, in Proc. SPIE, Vol. 8451, Software and Cyberinfrastructure for Astronomy II, 845112
- Hunter (2007) Hunter, J. D. 2007, Computing In Science & Engineering, 9, 90
- Ivezic et al. (2008) Ivezic, Z., Tyson, J. A., Abel, B., et al. 2008, ArXiv e-prints, arXiv:0805.2366
- Jones et al. (2001) Jones, E., Oliphant, T., Peterson, P., et al. 2001, SciPy: Open source scientific tools for Python, , . http://www.scipy.org/
- Jordi et al. (2010) Jordi, C., Gebran, M., Carrasco, J. M., et al. 2010, A&A, 523, A48
- Kaiser et al. (2010) Kaiser, N., Burgett, W., Chambers, K., et al. 2010, in Proc. SPIE, Vol. 7733, Ground-based and Airborne Telescopes III, 77330E
- Kessler et al. (2015) Kessler, R., Marriner, J., Childress, M., et al. 2015, AJ, 150, 172
- Kim & Brunner (2017) Kim, E. J., & Brunner, R. J. 2017, MNRAS, 464, 4463
- Kim et al. (2015) Kim, E. J., Brunner, R. J., & Carrasco Kind, M. 2015, MNRAS, 453, 507
- Koposov & Bartunov (2006) Koposov, S., & Bartunov, O. 2006, in Astronomical Society of the Pacific Conference Series, Vol. 351, Astronomical Data Analysis Software and Systems XV, ed. C. Gabriel, C. Arviset, D. Ponz, & S. Enrique, 735
- Małek et al. (2013) Małek, K., Solarz, A., Pollo, A., et al. 2013, A&A, 557, A16
- Marshall et al. (2013) Marshall, J. L., Rheault, J.-P., DePoy, D. L., et al. 2013, ArXiv e-prints, arXiv:1302.5720
- Mohr et al. (2012) Mohr, J. J., Armstrong, R., Bertin, E., et al. 2012, in Proc. SPIE, Vol. 8451, Software and Cyberinfrastructure for Astronomy II, 84510D
- Morganson et al. (2018) Morganson, E., Gruendl, R. A., Menanteau, F., et al. 2018, Publications of the Astronomical Society of the Pacific, 130, 074501
- Neilsen & Annis (2014) Neilsen, E., & Annis, J. 2014, in Astronomical Society of the Pacific Conference Series, Vol. 485, Astronomical Data Analysis Software and Systems XXIII, ed. N. Manset & P. Forshay, 77
- Oke (1974) Oke, J. B. 1974, The Astrophysical Journal Supplement Series, 27, 21
- Pogson (1856) Pogson, N. 1856, MNRAS, 17, 12
- Reed et al. (2015) Reed, S. L., McMahon, R. G., Banerji, M., et al. 2015, MNRAS, 454, 3952
- Rykoff et al. (2015) Rykoff, E. S., Rozo, E., & Keisler, R. 2015, ArXiv e-prints, arXiv:1509.00870
- Schlafly & Finkbeiner (2011) Schlafly, E. F., & Finkbeiner, D. P. 2011, ApJ, 737, 103
- Schlegel et al. (1998) Schlegel, D. J., Finkbeiner, D. P., & Davis, M. 1998, ApJ, 500, 525
- Sevilla et al. (2011) Sevilla, I., Armstrong, R., Bertin, E., et al. 2011, ArXiv e-prints, arXiv:1109.6741
- Sevilla-Noarbe et al. (2018) Sevilla-Noarbe, I., Hoyle, B., Marchã, M. J., et al. 2018, ArXiv e-prints, arXiv:1805.02427
- Sheldon (2014) Sheldon, E. S. 2014, MNRAS, 444, L25
- Skrutskie et al. (2006) Skrutskie, M. F., Cutri, R. M., Stiening, R., et al. 2006, AJ, 131, 1163
- Soumagnac et al. (2015) Soumagnac, M. T., Abdalla, F. B., Lahav, O., et al. 2015, MNRAS, 450, 666
- Swanson et al. (2008) Swanson, M. E. C., Tegmark, M., Hamilton, A. J. S., & Hill, J. C. 2008, MNRAS, 387, 1391
- Taylor (2005) Taylor, M. B. 2005, in Astronomical Society of the Pacific Conference Series, Vol. 347, Astronomical Data Analysis Software and Systems XIV, ed. P. Shopbell, M. Britton, & R. Ebert, 29
- The HDF Group (1997-NNNN) The HDF Group. 1997-NNNN, Hierarchical Data Format, version 5, , , http://www.hdfgroup.org/HDF5/
- Tyson (2010) Tyson, J. A. 2010, in Proc. SPIE, Vol. 7733, Ground-based and Airborne Telescopes III, 773303
- Van Der Walt et al. (2011) Van Der Walt, S., Colbert, S. C., & Varoquaux, G. 2011, Computing in Science & Engineering, 13, 22
- Wells et al. (1981) Wells, D. C., Greisen, E. W., & Harten, R. H. 1981, A&AS, 44, 363
- York et al. (2000) York, D. G., Adelman, J., Anderson, Jr., J. E., et al. 2000, AJ, 120, 1579