Compton-thick AGN in the NuSTAR era
Abstract
We present the 2–100 keV spectral analysis of 30 candidate Compton thick (CT-) active galactic nuclei (AGN) selected in the Swift-BAT 100-month survey. The average redshift of these objects is 0.03 and they all lie within 500 Mpc. We used the MyTorus (Murphy & Yaqoob, 2009) model to perform X-ray spectral fitting both without and with the contribution of the NuSTAR data in the 3–50 keV energy range. When the NuSTAR data are added to the fit, 14 out of 30 of these objects (47% of the whole sample) have intrinsic absorption N cm-2 at the 3 confidence level, i.e., they are re-classified from Compton thick to Compton thin. Consequently, we infer an overall observed fraction of CT-AGN with respect to the whole AGN population lower than the one reported in previous works, and as low as 4%. We find evidence that this over-estimation of NH is likely due to the low quality of a subsample of spectra, either in the 2-10 keV band or in the Swift-BAT one.
Subject headings:
galaxies: active — galaxies: nuclei — X-rays: galaxies1. Introduction
According to the different models of Cosmic X-ray Background (CXB), the diffuse X-ray emission observed in the 1 to 200–300 keV band, is mainly caused by accreting supermassive black holes (SMBH), the so-called active Galactic Nuclei (AGN; e.g., Alexander et al., 2003; Gilli et al., 2007; Treister et al., 2009). Particularly, at the peak of the CXB (30 keV, Ajello et al., 2008) a significant fraction of emission (10–25%) is expected to be produced by a numerous population of heavily obscured, Compton thick (CT-) AGN (e.g., Risaliti et al., 1999), having intrinsic column density N cm-2. Nonetheless, in the nearby Universe (0.1) the observed fraction of CT-AGN with respect to the total population appears to be lower than the one expected on the basis of the majority of CXB model predictions (20–30%; see, e.g., Ueda et al., 2014, and references therein), being between 5 and 10% (Comastri, 2004; Della Ceca et al., 2008; Vasudevan et al., 2013; Ricci et al., 2015), although observational biases against detecting CT-AGN can at least partially explain this discrepancy (see, e.g., Burlon et al., 2011).
Entering the Compton thick regime, the fraction of emission directly produced by the AGN at energies keV significantly decreases (Burlon et al., 2011; Ricci et al., 2015), while at lower energies only the emission scattered, rather than absorbed, by the obscuring material is detectable (see, e.g., Matt et al., 1999; Yaqoob et al., 2010; Koss et al., 2016). As a consequence, the detection and characterization of the CT-AGN population in the nearby Universe is possible only using instruments that can map the 10 keV band with deep observations. The wide-field (12090 deg2) Burst Alert Telescope (BAT; Barthelmy et al., 2005), one of the instruments mounted on the Swift satellite (Gehrels et al., 2004), partially fulfills these requirements. Swift-BAT is an all-sky instrument which continuously scans and images the whole sky in the 15-150 keV band. Combining good sensitivity and all-sky coverage, Swift-BAT is a strategical instrument to create a census of the hard X-ray, low luminosity AGN in the nearby Universe. Several works based on BAT–selected objects and on the joint analysis of the BAT spectra with the spectra collected with different 0.3–10 keV instruments such as XMM-Newton, Chandra, Swift-XRT and Suzaku, have in fact been able to discover several tens of new candidate CT-AGN (see, e.g., Burlon et al., 2011; Vasudevan et al., 2013; Ricci et al., 2015; Marchesi et al., 2017a, b).
Obscuration in AGN is commonly explained with the presence of a so-called “dusty torus”, i.e., gas and dust distributed around the SMBH and in proximity to the accretion disk. The actual shape and composition of this material is however an open topic, although several works suggest that a clumpy distribution of optically thick clouds may be preferred to a more homogeneous structure (e.g., Jaffe et al., 2004; Elitzur & Shlosman, 2006; Risaliti et al., 2007; Hönig & Beckert, 2007; Nenkova et al., 2008; Burtscher et al., 2013). In the last years, several tori models, based on Monte Carlo simulations, have been developed to properly treat the complex X-ray spectra of Compton thick AGN (e.g., Ikeda et al., 2009; Murphy & Yaqoob, 2009; Yaqoob et al., 2010; Brightman & Nandra, 2011; Yaqoob, 2012; Liu & Li, 2014; Furui et al., 2016). Each of these models is based on different assumptions on the obscuring material geometry and chemical composition, while all the models assume a homogeneous distribution of obscuring material. Moreover, both Ikeda et al. (2009) and Brightman & Nandra (2011) allow to measure the torus half-opening angle, which is directly related to the torus covering factor, . It has been shown that the CT-AGN population may have a wide variety of covering factors, since there are both objects for which the obscuring material has been measured to be spherically distributed around the SMBH (=1) as well as sources with a geometrically thin () torus (see, e.g., Brightman et al., 2015). A proper use of these different models, however, requires excellent spectral statistics in the 2–50 keV band, which can be provided neither by one of the several 0.3–10 keV facilities nor by BAT.
The launch of the Nuclear Spectroscopic Telescope Array (hereafter NuSTAR, Harrison et al., 2013), the first telescope with focusing optics at 10 keV, represented a major breakthrough in the actual characterization of obscured AGN, providing an improvement on sensitivity of about two orders of magnitude with respect to previous facilities at these energies. Consequently, several works have already been published on heavily obscured AGN as seen by NuSTAR (e.g., Baloković et al., 2014; Puccetti et al., 2014; Annuar et al., 2015; Bauer et al., 2015; Brightman et al., 2015; Koss et al., 2015; Rivers et al., 2015; Masini et al., 2016; Puccetti et al., 2016). Nonetheless, the majority of these works focused on single or few sources, and the largest sample of heavily obscured AGN analyzed with NuSTAR contains only 11 objects (Masini et al., 2016), which are radio-selected megamasers, i.e., sources well known to host a large fraction of CT-AGN (Greenhill et al., 2008). Therefore, a systematic analysis of the role of NuSTAR in the characterization of heavily obscured AGN is so far absent in the literature, or limited to small samples of objects. To fill this gap, in this work we present the analysis of the 30 candidate CT-AGN in the BAT 100-month catalog for which an archival NuSTAR observation exists. Notably, for 17 out of 30 sources this is the first time the NuSTAR data analysis is published.
This work is organized as follows: in Section 2 we present the sample of 30 candidate CT-AGN with available NuSTAR observations and we describe the data reduction and spectral extraction process for both NuSTAR and the 0.3–10 keV observations. In Section 3 we describe the model used to perform the spectral fitting. In Section 4 we present the main results of the analysis, with a particular focus on peculiar sources, while in Section 5 we highlight the fundamental role played by NuSTAR in characterizing CT-AGN, analyzing the differences in the spectral fit results obtained with and without the addition of the NuSTAR data. In Section 6 we test the Spectral Curvature method (Koss et al., 2016) developed to select candidate CT-AGN. Finally, we report our conclusions in Section 7. All reported errors are at a 90% confidence level, if not otherwise stated. The errors have been obtained with the XSPEC error command.
2. Sample selection and data reduction
In this work, we take advantage of the most recent catalog developed using the BAT survey data, i.e., the Palermo BAT 100-month catalog111http://bat.ifc.inaf.it/100m_bat_catalog/100m_bat_catalog_v0.0.htm, which reaches a flux limit 3.3 10-12 erg s-1 cm-2 in the 15-150 keV band. The public data used in this work have been downloaded from the HEASARC public archive and processed using the BAT_IMAGER code (Segreto et al., 2010). With BAT_IMAGER it is possible to analyze data obtained using coded mask instruments: the software screens and combines all the available observations and performs the source detection process. In our analysis we use background subtracted, exposure-averaged spectra; the spectral redistribution matrix we use is the official BAT one222http://heasarc.gsfc.nasa.gov/docs/heasarc/caldb/data/swift/
bat/index.html.
The Palermo Swift-BAT 100-month catalog contains 911 AGN. Based on previous results from the literature and an independent spectral analysis lead by our group (Kadan et al. 2017 in prep.), 50 of these objects are candidate CT-AGN, i.e., their best-fit intrinsic absorption value is cm-2. Out of these 50 sources, 30 have archival NuSTAR data available as of December 1, 2017. These 30 objects are reported in Table 1, where the information on the work that first classified the object as Compton thick is also provided.
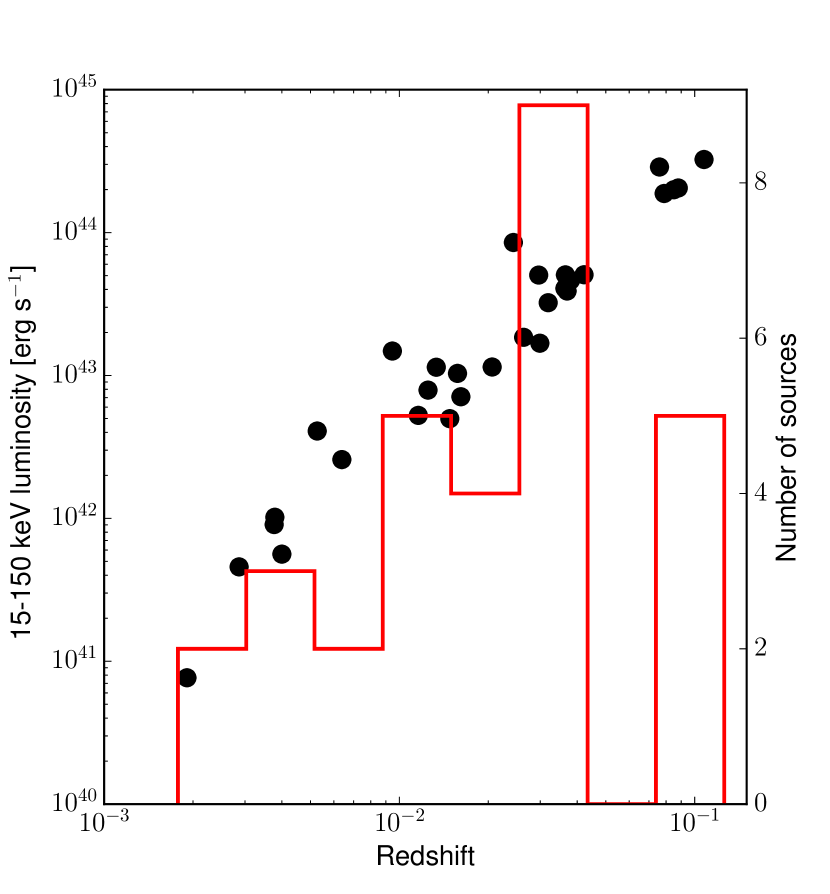
In Figure 1 we show the distribution of the 30 objects in the 15–150 keV luminosity versus redshift () plane. As can be seen, since we apply a Swift-BAT selection and the Palermo BAT 100-month catalog samples the bright, nearby AGN population, we are studying the low- CT-AGN population. More in detail, the average redshift of our sample is =0.03 (corresponding to an average luminosity distance =135 Mpc) and the farthest object has redshift =0.108 (dL=500 Mpc). 15 (50% of the sample) and 25 (83%) of the sources are located at distances 100 Mpc and 200 Mpc, respectively. The luminosity distances are computed assuming a cosmology with H0 = 69.6 km s-1 Mpc-1, = 0.29, and = 0.71.
The data retrieved for both NuSTAR Focal Plane Modules (FPMA and FPMB; Harrison et al., 2013) were processed using the NuSTAR Data Analysis Software (NUSTARDAS) v1.5.1. The event data files were calibrated running the nupipeline task using the response file from the Calibration Database (CALDB) v. 20100101. With the nuproducts script we generated both the source and background spectra, and the ancillary and response matrix files. For both focal planes, we used a circular source extraction region with a 30′′ diameter centered on the target source; for the background we used the same extraction region positioned far from any source contamination in the same frame. The NuSTAR spectra have then been grouped with at least 15 counts per bin.
| 4PBC name | Source name | R.A. | Decl | Type | Telescope | ObsID | Date | Exposure | Rate | Ref. | |
|---|---|---|---|---|---|---|---|---|---|---|---|
| deg | deg | ks | cts s-1 | ||||||||
| (1) | (2) | (3) | (4) | (5) | (6) | (7) | (8) | (9) | (10) | (11) | (12) |
| J0111.5–3804 | NGC 424 | 17.86511 | –38.08347 | 1.9 | 0.0118 | XMM-Newton | 550950101 | 2008–12–07 | 309.3 | 0.023 | (a) |
| … | … | … | … | … | … | NuSTAR | 60061007002 | 2013–01–26 | 31.0 | 0.035 | (b)* |
| J0122.5+5004 | MCG+08-03-018 | 20.64346 | 50.05500 | 2 | 0.0204 | Swift-XRT | 38011, 80019 | 2008–11–19 | 5.1 | 0.011 | (c)* |
| … | … | … | … | … | … | NuSTAR | 60061010002 | 2014–01–27 | 63.3 | 0.031 | – |
| J0242.6+0000 | NGC 1068 | 40.66963 | –0.01328 | 2 | 0.0038 | XMM-Newton | 740060401 | 2014–08–19 | 138.4 | 0.046 | (a) |
| … | … | … | … | … | … | NuSTAR | 60002030002 | 2012–12–18 | 115.7 | 0.107 | (d)* |
| J0303.8–0106 | NGC 1194 | 45.954621 | –1.10374 | 1.9 | 0.0136 | XMM-Newton | 307000701 | 2006–02–19 | 43.6 | 0.019 | (e) |
| … | … | … | … | … | … | NuSTAR | 60061035002 | 2015–02–28 | 63.0 | 0.043 | (f)* |
| J0308.1–2256 | NGC 1229 | 47.04494 | –22.96080 | 2 | 0.0363 | Swift-XRT | 41743, 80534 | 2010–10–19 | 15.5 | 0.002 | (c)* |
| … | … | … | … | … | … | NuSTAR | 60061325002 | 2013–07–05 | 49.8 | 0.024 | – |
| J0350.5–5019 | ESO 201-IG 004 | 57.59567 | –50.30261 | 2 | 0.0359 | XMM-Newton | 501210401 | 2007–07–15 | 40.8 | 0.012 | (c)* |
| … | … | … | … | … | … | NuSTAR | 60061331002 | 2014–08–09 | 46.3 | 0.015 | – |
| J0356.2–6251 | 2MASXJ03561995–6251391 | 59.08321 | -62.86076 | 1.9 | 0.1076 | Swift-XRT | 37304, 81865 | 2008-08-05 | 12.7 | 0.003 | (c)* |
| … | … | … | … | … | … | NuSTAR | 60201034002 | 2016–05–06 | 53.1 | 0.035 | – |
| J0453.3+0403 | CGCG 420-15 | 73.35729 | 4.06158 | 2 | 0.0294 | XMM-Newton | 307000401 | 2005–08–30 | 29.8 | 0.025 | (g)* |
| … | … | … | … | … | … | NuSTAR | 60061053004 | 2014–08–13 | 36.6 | 0.062 | – |
| J0605.5–8638 | ESO 005-G 004 | 91.42346 | –86.63186 | 2 | 0.0062 | Swift-XRT | 35254, 80367 | 2005–12–14 | 24.1 | 0.003 | (h) |
| … | … | … | … | … | … | NuSTAR | 60061063002 | 2015–11–10 | 49.4 | 0.018 | – |
| J0714.0+3518 | MCG+06-16-028 | 108.51608 | 35.27928 | 1.9 | 0.0157 | Swift-XRT | 40931, 80381 | 2010–05–12 | 5.0 | 0.003 | (c)* |
| … | … | … | … | … | … | NuSTAR | 60061072002 | 2013–12–03 | 47.1 | 0.024 | (i) |
| J0924.0–3141 | 2MASXJ09235371–3141305 | 140.97388 | –31.69186 | 2 | 0.0424 | Swift-XRT | 33661, 80674, 91688 | 2013–04–07 | 12.3 | 0.005 | (c)* |
| … | … | … | … | … | … | NuSTAR | 60061339002 | 2014–04–19 | 42.5 | 0.048 | – |
| J1001.9+5540 | NGC 3079 | 150.49085 | 55.67979 | 1.9 | 0.0037 | XMM-Newton | 110930201 | 2001–04–13 | 36.8 | 0.010 | (j) |
| … | … | … | … | … | … | NuSTAR | 60061072002 | 2013–11–12 | 43.0 | 0.034 | (k)* |
| J1048.3–2509 | NGC 3393 | 162.09775 | –25.16206 | 2 | 0.0125 | XMM-Newton | 140950601 | 2003–07–05 | 36.0 | 0.007 | (l) |
| … | … | … | … | … | … | NuSTAR | 60061205002 | 2013–01–28 | 31.4 | 0.033 | (m)* |
| J1052.6+1036 | 2MASXJ10523297+1036205 | 163.13745 | 10.60558 | 1 | 0.0878 | XMM-Newton | 693430401 | 2012–11–21 | 75.1 | 0.051 | (n) |
| … | … | … | … | … | … | NuSTAR | 60160414002 | 2017–01–30 | 81.3 | 0.065 | – |
| J1149.1–0416 | RBS 1037 | 177.32783 | –4.28083 | 1 | 0.0845 | Swift-XRT | 38057, 80061 | 2010–11–08 | 21.1 | 0.032 | (n) |
| … | … | … | … | … | … | NuSTAR | 60061215002 | 2017–02–02 | 81.3 | 0.049 | – |
| J1206.3+5243 | NGC 4102 | 181.59580 | 52.71108 | 2 | 0.0028 | XMM-Newton | 601780701 | 2009–10–30 | 26.5 | 0.013 | (o) |
| … | … | … | … | … | … | NuSTAR | 60061215002 | 2015–11–19 | 41.2 | 0.059 | – |
| J1207.5+3352 | B2 1204+34 | 181.88711 | 33.87778 | 2 | 0.0791 | Swift-XRT | 37315, 80691 | 2008–02–17 | 21.7 | 0.022 | (n) |
| … | … | … | … | … | … | NuSTAR | 60160472002 | 2014–12–16 | 43.8 | 0.076 | – |
| J1305.4–4928 | NGC 4945 | 196.36449 | –49.46821 | 2 | 0.0019 | XMM-Newton | 204870101 | 2004–01–11 | 27.3 | 0.097 | (p) |
| … | … | … | … | … | … | NuSTAR | 60061356002 | 2013–06–15 | 109.1 | 0.274 | (q)* |
| J1321.0+0859 | NGC 5100 | 200.24417 | 8.98194 | AGN | 0.0319 | Swift-XRT | 38063, 81140 | 2009–11–23 | 16.1 | 0.012 | (n) |
| … | … | … | … | … | … | NuSTAR | 60160536002 | 2016–01–09 | 42.1 | 0.068 | – |
| J1416.9–4641 | IGR J14175-4641 | 214.26526 | –46.69478 | 2 | 0.0766 | Swift-XRT | 36108, 81864 | 2006-12-26 | 6.4 | 0.003 | (c)* |
| … | … | … | … | … | … | NuSTAR | 60201033002 | 2016–05–25 | 43.0 | 0.025 | – |
| J1432.7–4409 | NGC 5643 | 218.16977 | –44.17441 | 2 | 0.0040 | XMM-Newton | 0601420101 | 2009–07–25 | 120.8 | 0.010 | (r) |
| … | … | … | … | … | … | NuSTAR | 60160536002 | 2014–05–24 | 44.9 | 0.022 | (s)* |
| J1440.7+5330 | Mrk 477 | 220.15874 | 53.50441 | 1 | 0.0377 | XMM-Newton | 651100301 | 2010-07-21 | 32.1 | 0.037 | (t) |
| … | … | … | … | … | … | NuSTAR | 60061255002 | 2014–05–15 | 36.1 | 0.065 | – |
| J1442.4–1714 | NGC 5728 | 220.59957 | –17.25308 | 2 | 0.0094 | Chandra | 4077 | 2003–06–27 | 18.7 | 0.020 | (u) |
| … | … | … | … | … | … | NuSTAR | 60061256002 | 2013–01–02 | 48.7 | 0.100 | – |
| J1445.6+2702 | CGCG 164–019 | 221.40351 | 27.03478 | 1.9 | 0.0299 | Swift-XRT | 37385, 49742, 80536 | 2010–11–26 | 18.0 | 0.004 | (c)* |
| … | … | … | … | … | … | NuSTAR | 60061255002 | 2013–09–13 | 48.5 | 0.014 | (i) |
| J1643.3+7038 | NGC 6232 | 250.83433 | 70.63253 | 2 | 0.0148 | Swift-XRT | 45377, 80537 | 2011-05-01 | 19.7 | 0.003 | (c)* |
| … | … | … | … | … | … | NuSTAR | 60061328002 | 2013–08–17 | 36.2 | 0.006 | (i) |
| J1653.0+0223 | NGC 6240 | 253.24530 | 2.40093 | 1.9 | 0.0245 | XMM-Newton | 101640101 | 2000–09–22 | 49.5 | 0.049 | (v) |
| … | … | … | … | … | … | NuSTAR | 60002040002 | 2014–03–30 | 61.7 | 0.092 | (w)* |
| J2102.5–2809 | ESO 464-G016 | 315.59901 | –28.17486 | 2 | 0.0364 | Swift-XRT | 41113, 41906 | 2011–06–23 | 9.5 | 0.003 | (c)* |
| … | … | … | … | … | … | NuSTAR | 60101013002 | 2016–04–13 | 44.2 | 0.022 | – |
| J2148.3–3456 | NGC 7130 | 327.08133 | –34.95124 | 1.9 | 0.0162 | Chandra | 2188 | 2001–10–23 | 38.6 | 0.006 | (x) |
| … | … | … | … | … | … | NuSTAR | 60261006002 | 2016–12–15 | 84.1 | 0.010 | – |
| J2207.0+1013 | NGC 7212 | 331.75542 | 10.23111 | 2 | 0.0266 | XMM-Newton | 200430201 | 2004–05–20 | 36.7 | 0.018 | (y) |
| … | … | … | … | … | … | NuSTAR | 60061310002 | 2013–09–01 | 49.1 | 0.019 | (i) |
| J2318.3–4222 | NGC 7582 | 349.59792 | –42.37056 | 2 | 0.0053 | Swift-XRT | 32534, 91915 | 2012–09–01 | 6.5 | 0.021 | (z) |
| … | … | … | … | … | … | NuSTAR | 60061318002 | 2012–08–31 | 32.9 | 0.015 | (a2)* |
2.1. 0.3–10 keV data selection
To each Swift-BAT 100-month candidate CT-AGN we associate a 0.3–10 keV archival observation, selected using the following criteria:
-
1.
When available, we use a XMM-Newton observation; if no XMM-Newton observation is available, we use a Chandra one. Finally, we use Swift-XRT observations when neither XMM-Newton nor Chandra data are available.
-
2.
When multiple XMM-Newton or Chandra observations are available, we choose the longest one. For Swift-XRT, instead, we combine all the available observations (see Section 2.4).
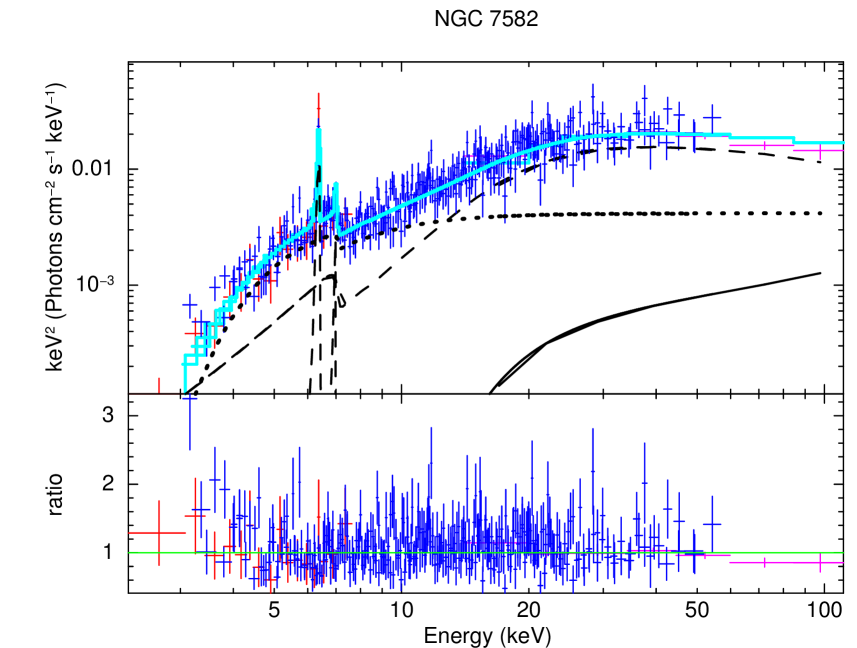
The only source for which we do not follow these rules is NGC 7582. This object is well known for its complex, highly variable spectrum (see, e.g., Piconcelli et al., 2007; Bianchi et al., 2009; Rivers et al., 2015); therefore, we select a NGC 7582 Swift-XRT observation taken simultaneously to the NuSTAR one, instead of a longer XMM-Newton one.
Following these criteria, 14 sources have an XMM-Newton counterpart, 2 have a Chandra counterpart and 14 have a Swift-XRT counterpart. A summary of these observations is reported in Table 1. All the XMM-Newton and Chandra observations were made targeting specifically the sources in our sample, which are therefore imaged on axis. Most of the sources targeted by Swift-XRT, instead, have been observed slightly off-axis: in 31 (41, 49) out of 54 Swift-XRT observations used in this work, the source analyzed in this work lies within 3 (4, 5)′ from the observation center. One source, 2MASXJ03561995–6251391, has been only observed serendipitously while targeting another object (SWIFT J0357.5–6255), at a distance of 9′ from the pointing position.
2.2. XMM-Newton data reduction
We reduced the XMM-Newton data using the SAS v16.0.0333http://xmm.esa.int/sas packages and adopting standard procedures. The source spectra were extracted from a 15′′ circular region, while the background spectra were obtained from a circle having radius 45′′ located near the source and not contaminated by nearby objects. Each spectrum has been binned with at least 15 counts per bin.
2.3. Chandra data reduction
The Chandra data have been reduced using the CIAO (Fruscione et al., 2006) 4.7 software and the Chandra Calibration Data Base (caldb) 4.6.9, adopting standard procedures; no source shows significant pile-up, as measured by the CIAO pileup_map tool. We used the CIAO specextract tool to extract both the source and the background spectra. Source spectra have been extracted in circular regions of 4′′, while background spectra have been extracted from annuli having inner radius =10′′ and outer radius =25′′: regions inside the background area have been visually inspected to avoid contamination from nearby sources. Finally, point-source aperture correction has been taken into account when extracting the spectra. Each spectrum has been binned with at least 15 counts per bin.
2.4. Swift-XRT
All the sources in our sample have been observed multiple times by Swift-XRT: given the Swift-XRT smaller effective area with respect to XMM-Newton and Chandra, to maximize the spectral statistics we combined all the observations to produce a single spectrum. To do so, we used the Swift-XRT data products generator available online (http://www.swift.ac.uk/user_objects/; see also Evans et al., 2009). Sources with Swift-XRT 0.3–10 keV data generally have lower count rates than those with XMM-Newton or Chandra data (see Table 1): consequently, we binned the Swift-XRT spectra with 10 counts per bin when possible, and with 7 counts per bin for those sources with less than 50 net counts (namely NGC 1229, 2MASX J03561995–6251391, MCG+06-16-028, IGR J14175-4641 and ESO 464–G016).
3. Spectral fitting procedure
We fitted our spectra using the XSPEC software (Arnaud, 1996), taking into account the Galactic absorption measured by Kalberla et al. (2005). We used Anders & Grevesse (1989) cosmic abundances, fixed to the solar value, and the Verner et al. (1996) photoelectric absorption cross-section. In heavily obscured AGN the emission produced by the accreting SMBH is completely suppressed in the 0.5–2 keV band (see, e.g., Gilli et al., 2007; Treister et al., 2009), where the emission is instead dominated by processes such as star-formation and/or diffuse gas emission (see, e.g., Koss et al., 2015). This is particularly true in XMM-Newton and Swift-XRT data, since the PSFs of these instruments are not sharp enough (5-15′′ on axis) to avoid contamination from non-nuclear regions. Modeling this soft emission may be difficult, particularly in low-statistics spectra, such as all spectra from Swift-XRT in our sample, and affect the final measurement of the AGN photon index. For these reasons, we choose to fit our data in the 2–150 keV regime.
The X-ray spectral characterization of heavily obscured AGN presents a level of complexity that cannot be easily treated by simple XSPEC absorption models (e.g., zwabs, ztbabs, zpcfabs) without potentially introducing biases (see, e.g., Murphy & Yaqoob, 2009). Consequently several models, based on Monte Carlo simulations, have been developed to analyze these complex spectra in a more self-consistent way. In this work we fit our spectra using the MyTorus (Murphy & Yaqoob, 2009) model.
MyTorus includes three distinct and separable components. The first one is a multiplicative component containing photoelectric absorption and Compton scattering attenuation (with associated equivalent neutral hydrogen column density denoted by ), and it is applied to the main continuum (usually a power law): notably, in heavily obscured AGN, i.e., sources with 51023 cm-2, basically no flux from the AGN continuum is detected below 3–4 keV (see Figure 5.1 in MyTorus manual444http://mytorus.com/mytorus-manual-v0p0.pdf). This supports our choice to fit the spectra only above 2 keV.
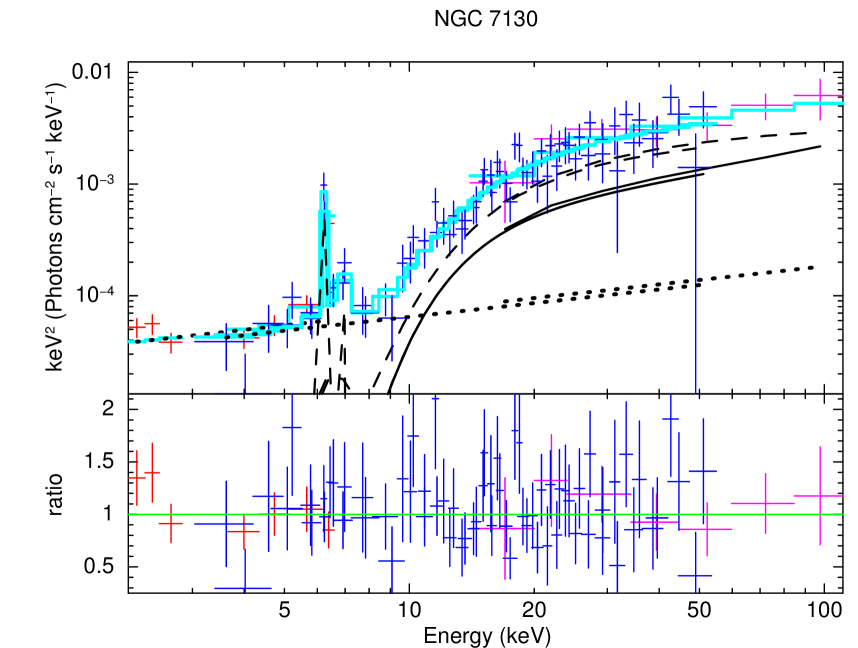
The second MyTorus component is the scattered continuum, also known as the “reflected component”, i.e., those photons that reach the observer after interacting with the material surrounding the SMBH. The relative normalization between the reflected component and the main one is hereby denoted as AS. Finally, the third component models the neutral Fe fluorescent emission lines: while these are not the only elements responsible for the presence of emission lines in AGN X-ray spectra, they nonetheless are those that produce the most prominent lines. Particularly, MyTorus models the Fe K lines, both the K at 6.4 keV and the K at 7.06 keV. In our analysis, we always started fitting the data assuming the relative normalization of the Fe K lines, AL=AS. However, we find that in four objects (namely NGC 424, NGC 1068, NGC 4945 and NGC 7130) the fit significantly improves when AL is allowed to vary with respect to AS, although the physical interpretation of this is unclear. In our model, both AS and AL are computed within XSPEC adding a multiplicative constant component before the reflected continuum and the fluorescent lines components.
Since in MyTorus the iron emission lines are produced self-consistently, one cannot use the XSPEC eqwidth task to compute the iron K equivalent width (EW; see, e.g., Yaqoob et al., 2015). Therefore, to compute EW we first measure the monochromatic continuum flux, without the emission line contribution, at EKα=6.4 keV rest-frame (i.e., the iron K centroid); then we measure the flux of the emission line component alone in the 6.08–6.72 keV rest-frame energy range, i.e., between 0.95 EKα and 1.05 EKα. We choose this energy range to avoid contaminations from the iron K line at 7 keV. The rest-frame EW is then computed multiplying by (1+) the ratio between the line flux and the monochromatic continuum flux. Finally, the uncertainty on EW is derived estimating the uncertainty on AL and then recomputing the line flux using as new AL value the lower and upper boundaries of this parameter.
In MyTorus, the obscuring material surrounding the SMBH is assumed to have a toroidal, azimuthally simmetric shape. The torus has a fixed half-opening angle =60, i.e., a covering factor =cos()=0.5. While the torus half-opening angle is fixed, the angle between the observer and the torus axis is free to vary in the range =[0–90]. In this work, we follow the approach detailed in Yaqoob et al. (2015, i.e., decoupled mode with column densities tied): we first fix =90 for the main continuum, then we fit each spectrum twice, once assuming a reflection component viewing angle =90, the other with =0. Sources best-fitted with =90 correspond to a scenario where the dense obscuring torus is observed “edge-on” and the obscuring material lies between the AGN and the observer. In sources best-fitted with =0, instead, the reflection component comes from the back-side of a patchy, rather than uniform obscuring torus.
While in principle a more complex decoupled configuration of these three components can be used, with column densities untied, in the so-called “MyTorus decoupled” configuration (Yaqoob, 2012), which can be used to mimic different obscuring material geometries, we do not make use of this configuration in our analysis. In fact, in this work we are particularly interested in studying how the additional NuSTAR data affects the measurements of the main spectral parameters (particularly and ). To do so, we choose to use a relatively simple model, such as the simple decoupled MyTorus one, in order to reduce parameters degeneracies and have a more consistent comparison between the results obtained without and with the NuSTAR data.
We also added to the model a second power law, with photon index =, where is the photon index of the primary power law. This second power law models the fraction of emission (usually 1% of the main component) which is scattered, rather than absorbed, by the gas surrounding the SMBH. The fractional contribution of the scattered component is calculated using the normalizations of the two power laws: in XSPEC, we measure the intensity of the scattered component using a constant to multiply the second power law component. We assume this second power law to be unabsorbed.
To take into account cross-calibration offsets between the 2-10 keV and the NuSTAR data, as well as variability between different observations, we introduce in the model a constant : the constant is fixed to 1 in the 2–10 keV and Swift-BAT datasets and is free to vary in the NuSTAR ones. Therefore, 1 indicates a scenario where the NuSTAR flux is higher than the 2–10 keV one. For the majority of the sources, the best-fit model is consistent with a lack of variability, C1, within the uncertainties. We discuss in Section 4.1 those sources for which we instead measure significant flux variability between the 2-10 keV and the NuSTAR observations.
3.1. Complex spectra modelling
A few objects in our sample are not properly fitted by the basic model described above and require a more complex modelling. We report here the additional components introduced in the fit, as well as the sources for which these components are required.
-
1.
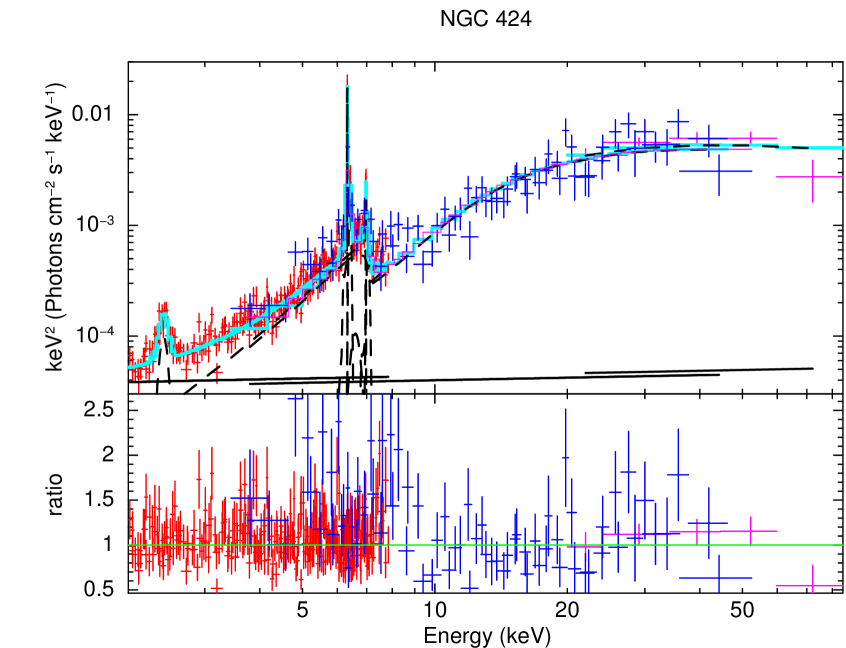
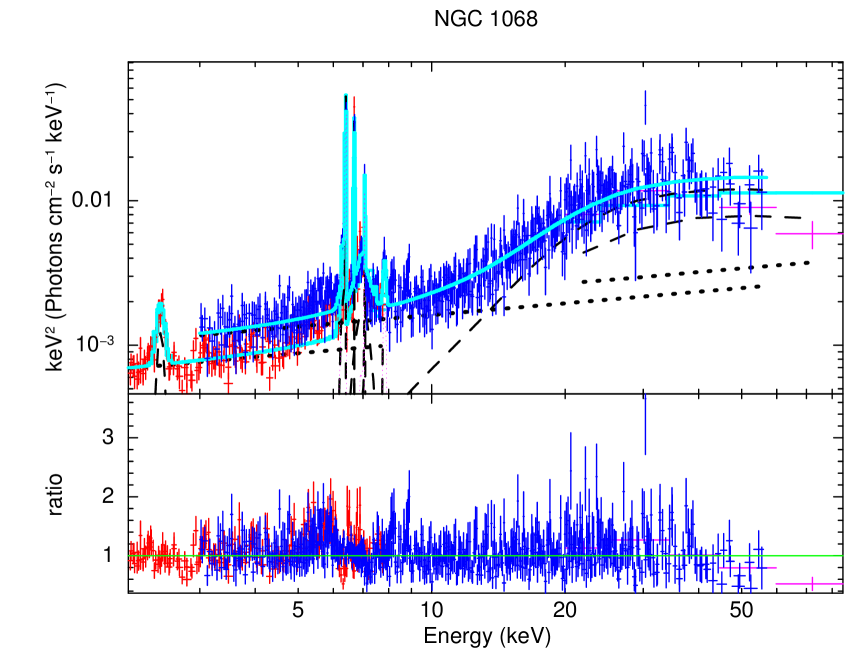
Spectra with deep (100 ks) XMM-Newton observations required additional emission lines in the model. Particularly, following the work of Bauer et al. (2015) on NGC 1068, we add to the spectrum of this source three broad Gaussian lines, one to model a complex Si XIII and XIV feature at 2.38 keV, the others to model the Fe He-like and H-like features at 6.69 keV and 7 keV, respectively. Similar features are also present in the spectra of NGC 424 and NGC 4945 (see also Puccetti et al., 2014).
-
2.
The soft X-ray spectrum of NGC 7130 is dominated by the emission produced by star-forming processes (Levenson et al., 2005). While we fit the Chandra data only in the 2–10 keV, where the AGN emission is dominant, the presence of significant residuals in the 2–3 keV band require us to add a thermal, phenomenological component to the model. The best-fit temperature is =0.32.
-
3.
Recent studies of the complex and highly variable source NGC 7582 showed that the NuSTAR spectrum of this object is likely obscured by a patchy torus with high covering factor (80–90%; Rivers et al., 2015). In this characterization, the fractional second power law is obscured by a Compton thin medium (31023 cm-2) and its strength is higher (20% of the main component) than the one usually observed in CT-AGN (5%). Consequently, in our fit to NGC 7582 we assume that the second power-law is absorbed: we find an intrinsic absorption value (3.10.7)1023 cm-2, in excellent agreement with the one reported by Rivers et al. (2015).
-
4.
NGC 424 is a widely studied reflection-dominated CT-AGN, with possibly only a fractional contribution to the observed emission coming from the main power law (see, e.g., Collinge & Brandt, 2000; Iwasawa et al., 2001; Matt et al., 2003; Baloković et al., 2014). Consequently, for this source we allowed the reflected component normalization to be A1; we also let AL free to vary independently from AS.
4. Fitting results
In Table 2 we report the best-fit values of the main spectral parameters (, , iron K EW) obtained first by fitting only the 2–10 keV and the Swift-BAT data, then adding to the fit also the NuSTAR data. In Table 3 we report the other best-fit parameters: the 2–10 keV to NuSTAR cross-normalization constant, ; the main power law component normalization, norm1; the reflection and and iron lines relative normalizations, AS and AL; the fraction of scattered emission, . The parameters reported in this second table are those obtained from the joint 2–10 keV–NuSTAR–Swift-BAT fit.
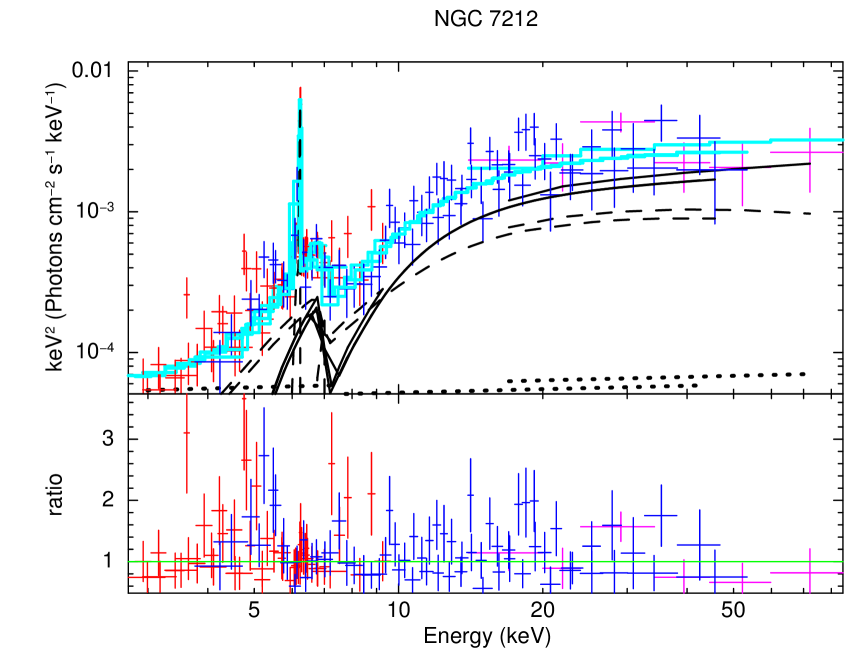
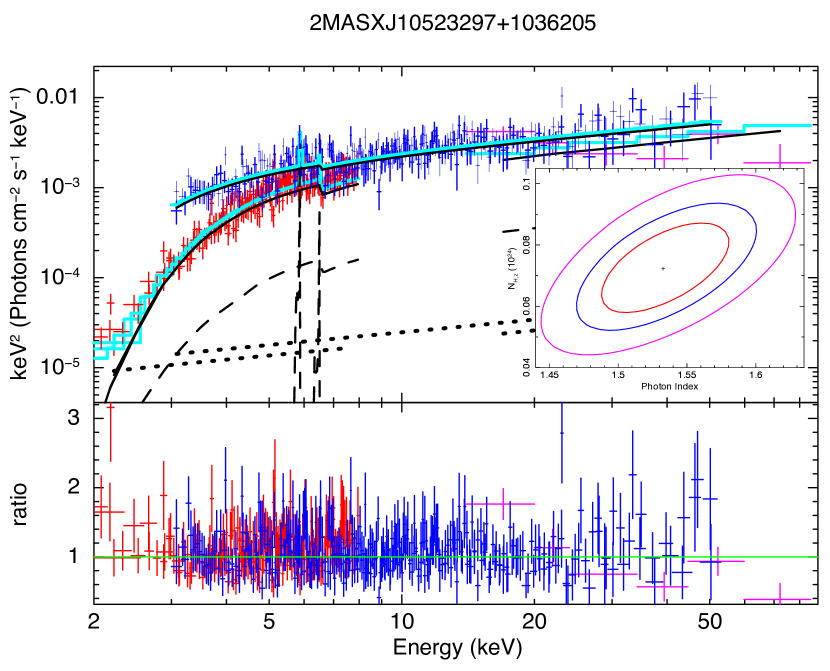
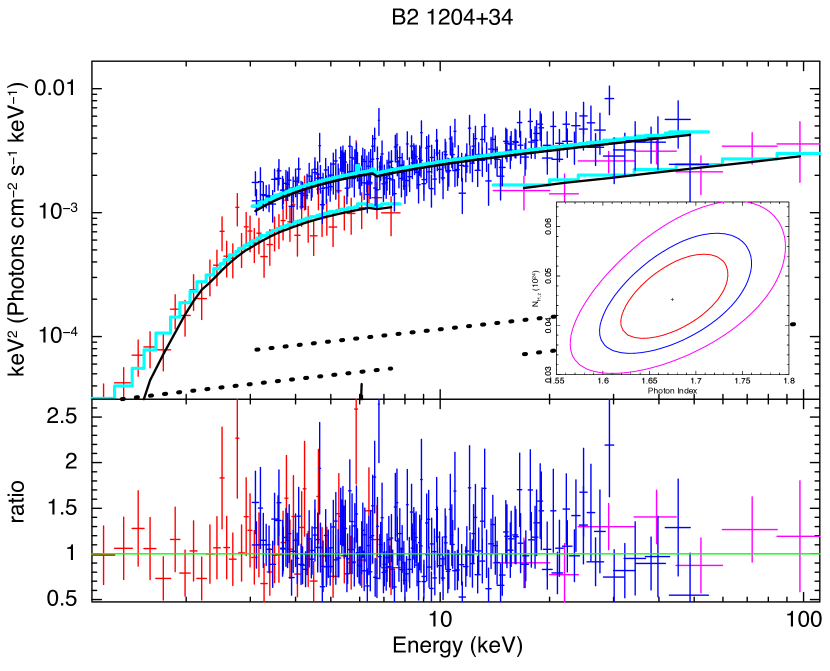
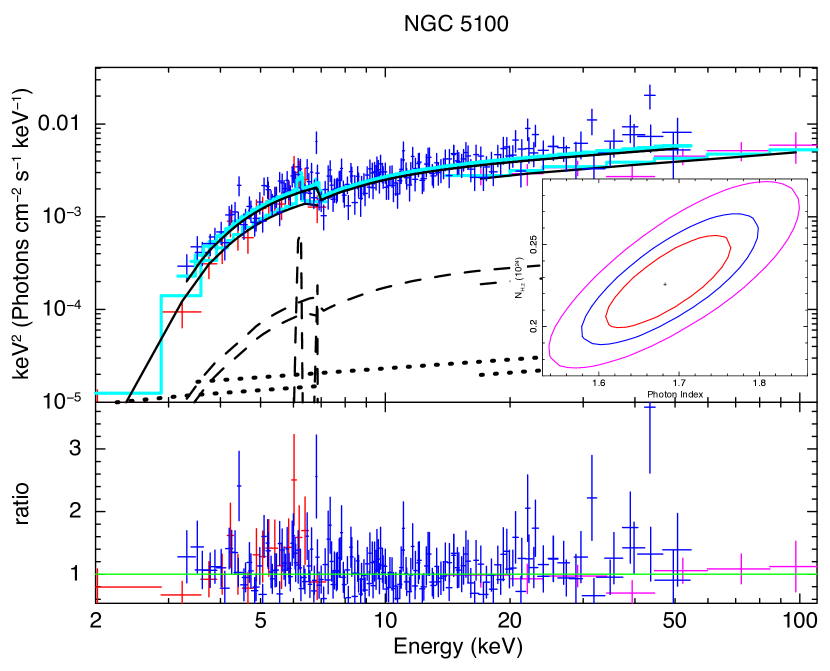
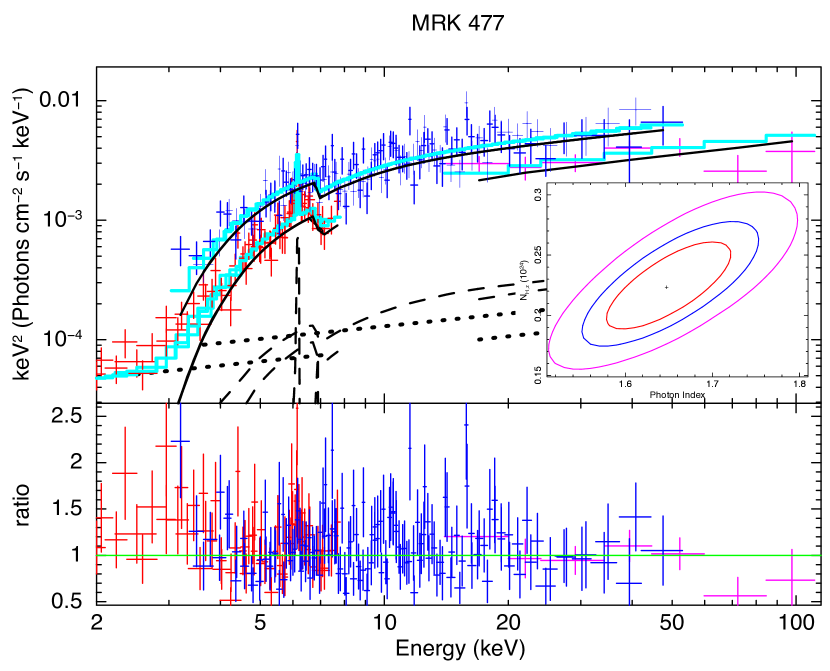
Preliminarily, we point out that in the rest of this work we will refer to a subsample of 26 out of 30 sources. Based on our analysis, the remaining four objects (namely 2MASX J10523297+1036205, B2 1204+34, NGC 5100 and Mrk 477) have best-fit parameters that are not consistent with a CT-AGN origin, both including and excluding the NuSTAR data from the fit. Since the main purpose of this paper is to study a population of bona-fide CT-AGN, we exclude these objects from the following analysis: however, we will present their spectra in Appendix B, where we also investigate the discrepancy between our results and those of previous works.
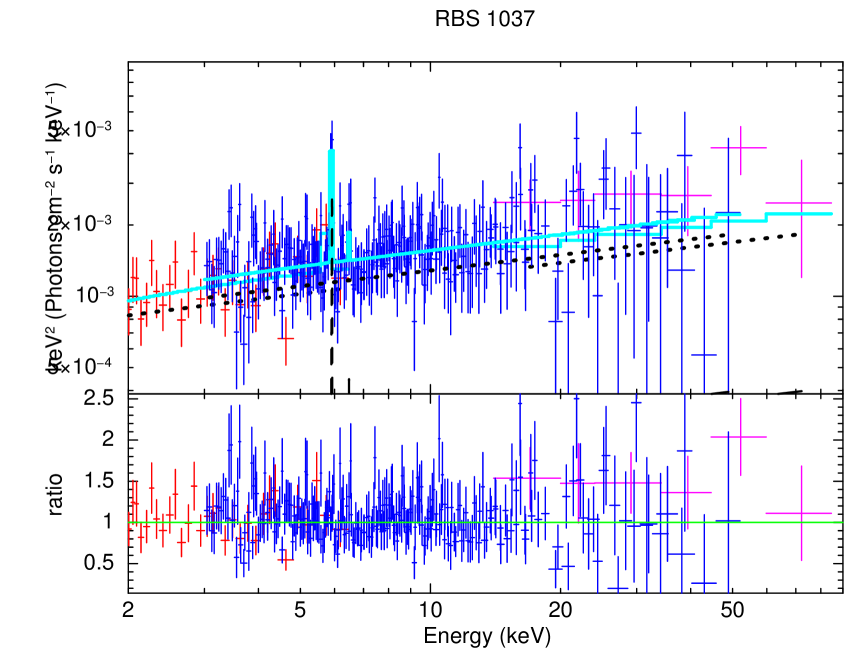
Another object, RBS 1037, presents two possible solutions with similar statistics when the NuSTAR data are not included in the analysis: () a slightly favoured CT-AGN scenario, with =1.351024 cm-2 and reduced , =/dof=89.1/79=1.13; () an unobscured AGN scenario, with 1022 cm-2 and /dof=92.4/79=1.17. Notably, the CT-AGN result is in good agreement with the one reported in Vasudevan et al. (2013, =1.701024 cm-2). However, when the NuSTAR data are added to the fit the unobscured AGN solution becomes the statistically favoured one, with =/dof=315.6/311=1.01. The CT-AGN solution cannot be ruled out, since fixing the intrinsic absorption value to =1.351024 cm-2 leads to an only marginally worse =/dof=322.7/312=1.03. However, this solution is not stable, since computing the uncertainty on using XSPEC always causes the best-fit value to move from the CT local minimum to the unobscured AGN best-fit value. Furthermore, the iron K line equivalent width (EW=0.17 keV) is relatively small, while in CT-AGN these lines are expected to have larger EW values, EW1–2 keV (e.g., Matt et al., 1996). Finally, it is worth noticing that this source is optically classified as a Seyfert 1 galaxy, and at the present day no evidence of Compton thick Seyfert 1 galaxy has been reported (see, e.g., Ricci et al., 2015). Taking into account all these factors, we believe that the unobscured scenario for RBS 1037 is more likely than a CT one.
4.1. Source variability
While the majority of the objects are well fitted using the MyTorus model combined with the additional components described in the previous section, a minority of sources presented more complex spectra, that required additional components to obtain a reliable fit. We report here these sources, and the components added to the fit.
-
1.
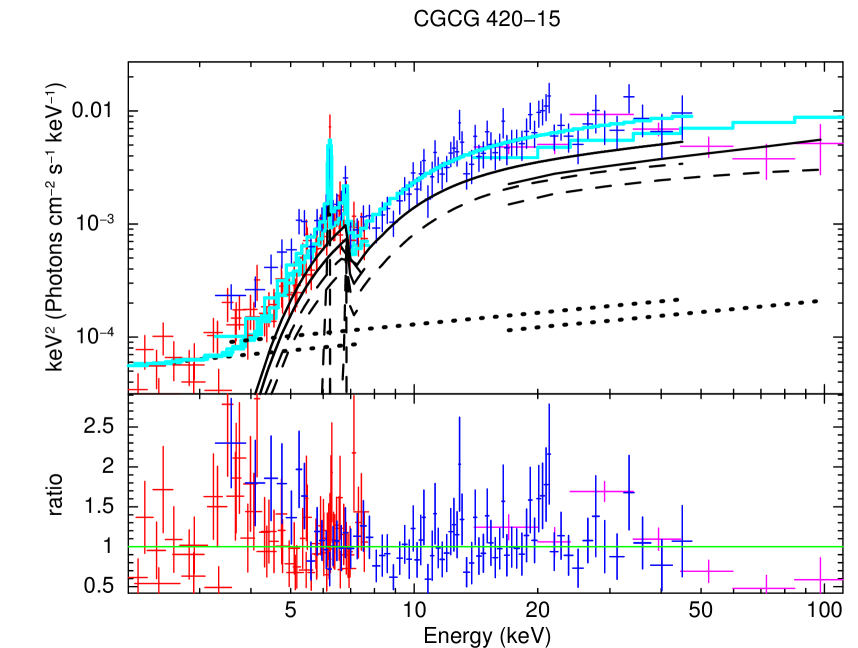
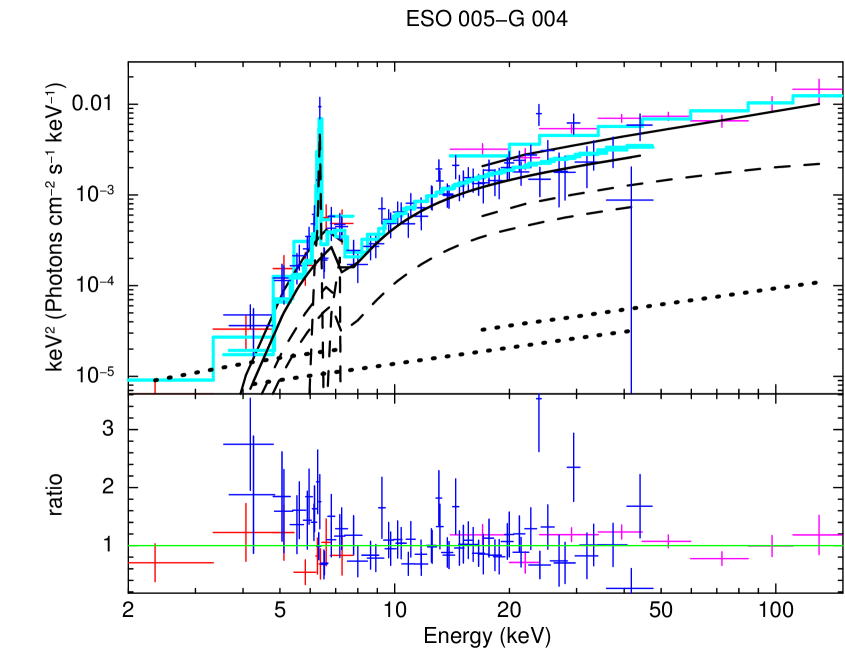
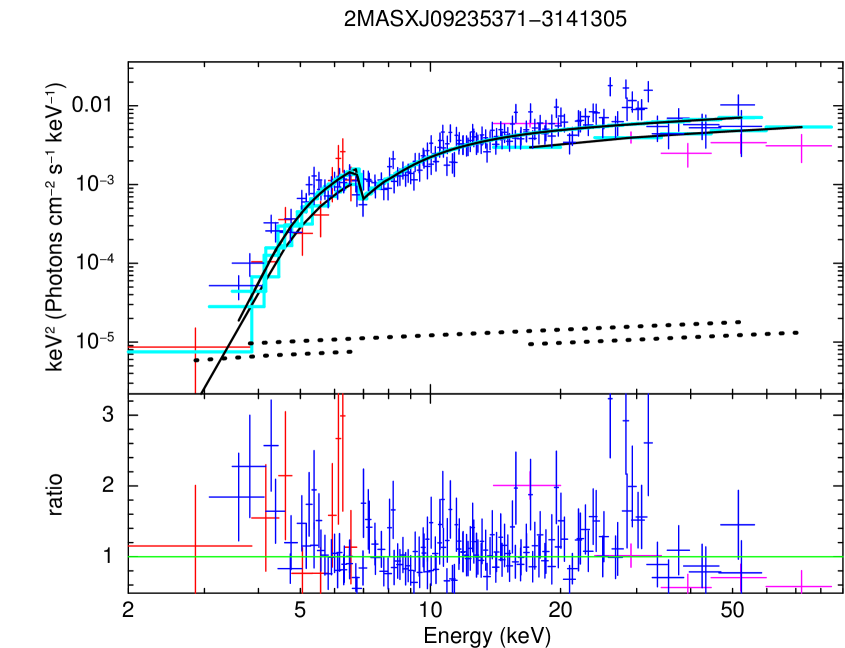
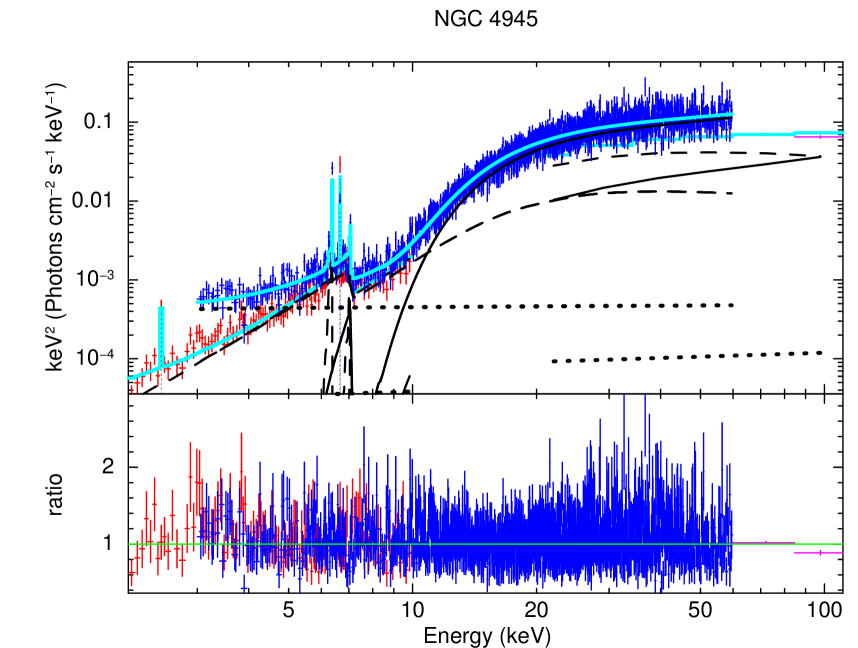
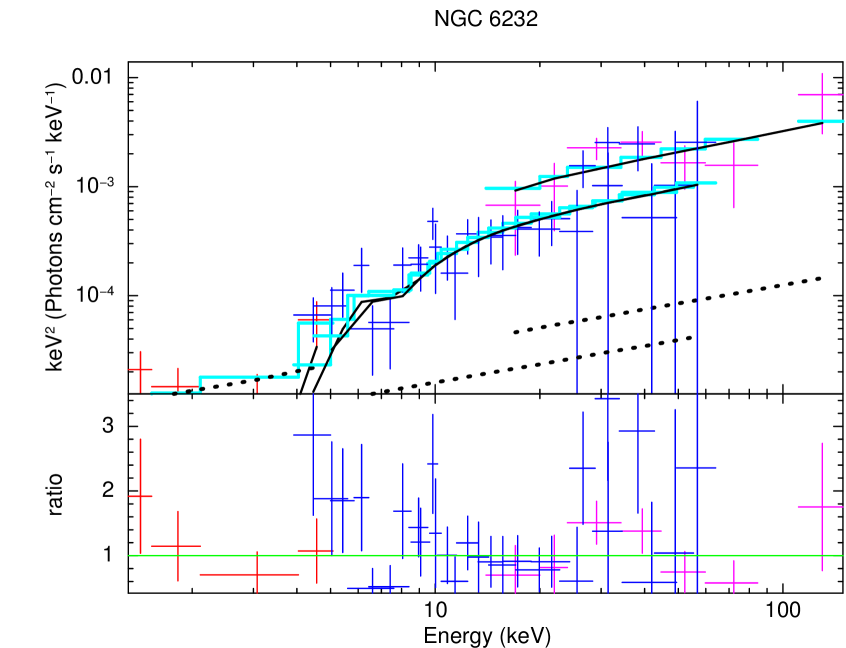
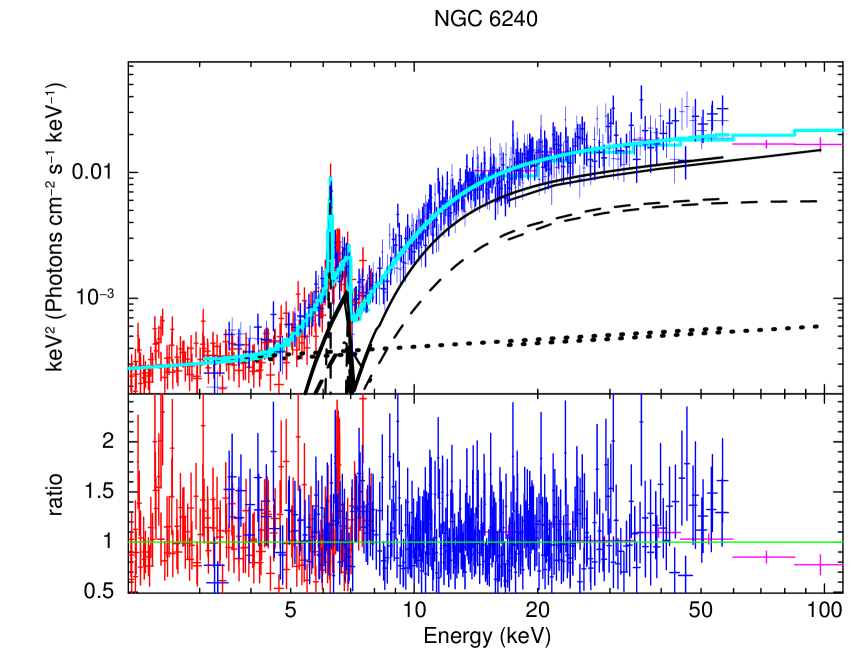
We find significant flux variability (i.e., 1 at the 3 level) in nine sources. In five of these objects, the NuSTAR flux is higher than the 2–10 keV one: these sources are NGC 1068 (=1.51), CGCG 420–15 (=1.34), 2MASXJ09235371–3141305 (=1.46), NGC 3393 (=1.60) and NGC 4945 (=16.14). The 2–10 keV flux is instead higher than the NuSTAR one in the following four objects: ESO 201-IG 004 (=0.62), ESO 005-G 004 (=0.51) IGR J14175–4641 (=0.63) and NGC 6232 (=0.46). For three of these objects, a comparison between 2–10 keV and NuSTAR data already exists in the literature: NGC 3393 has been studied by Koss et al. (2015) using both XMM-Newton and Chandra data in the 2–10 keV band: they found =1.70, in excellent agreement with our best-fit result, =1.60. Similarly, NGC 4945 is known to be highly variable above 10 keV (see, e.g., Yaqoob, 2012; Puccetti et al., 2014, and references therein), the normalization of the main continuum varying by a factor 6–8 in less than a month (Puccetti et al., 2014). NGC 1068, instead, was found to lack any significant variability on a timespan of 15 yrs (Bauer et al., 2015), a result in agreement with the fully reflection dominated nature of this source (N1025 cm-2). However, Bauer et al. (2015) show that fitting the complex NGC 1068 spectrum with a single reflector component, like the one we are using in our analysis, leads to statistically inaccurate modeling. The best-fit model they propose contains instead a multi-component reflector, which more accurately describes the NuSTAR excess that we model with a phenomenologically effective, but physically inaccurate cross-normalization constant.
-
2.
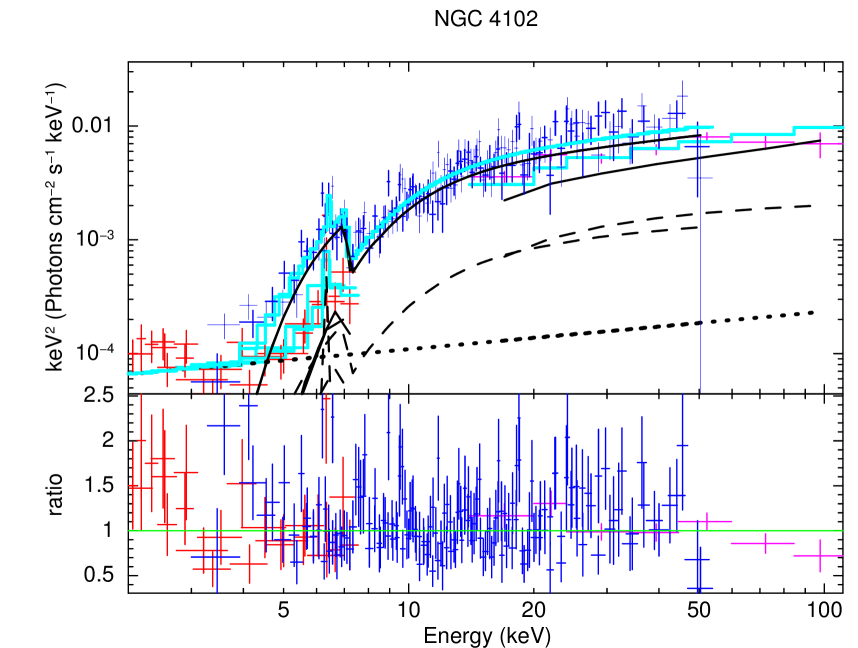
In a few sources we find a significant improvement in the fit when leaving free to change between the 2–10 keV dataset(s) and the NuSTAR ones. A first case is that of NGC 4102, where the XMM-Newton observation was taken six years before the NuSTAR one (October 2009 versus November 2015, see Table 1). For this source, the best-fit requires two different intrinsic absorption values, =1.441023 cm-2 and =7.781023 cm-2, therefore suggesting a possible “changing look” behavior for this source. Interestingly, the additional NuSTAR data allow us to properly measure the photon index (=1.67), which had a significantly steeper best fit value (=1.96) when the XMM-Newton and Swift-BAT data only were taken into account. Consequently, the best-fit value significantly decreases with the addition of the NuSTAR data to the fit (it was =1.911024 cm-2). Two out of four objects for which our 2–10 keV+BAT analysis does not lead to a CT-AGN result (2MASX J10523297+1036205, Mrk 477), in disagreement with previous works, are also best fitted with two different values: we describe them in Appendix B.
-
3.
In NGC 4945 the photon indexes are =1.83 and =1.97. NGC 4945 is a particularly complex source, and evidence of variability in the photon index, both between different observations and within the same NuSTAR observation, has been reported in Puccetti et al. (2014). Notably, their measurements of both and are in excellent agreement with ours, although the 2–10 keV data used in their work come from Chandra and Suzaku, while we used XMM-Newton data.
| Without NuSTAR | With NuSTAR | |||||||||
| Source | EW | /DOF | EW | /DOF | ||||||
| 1020 cm-2 | ° | 1022 cm-2 | keV | 1022 cm-2 | keV | |||||
| NGC 424 | 1.6 | 0 | 319.2 | 2.00 | 0.40 | 329.3/265 | 244.2 | 1.92 | 0.39 | 446.9/336 |
| MCG +08–03–018 | 13.6 | 90 | 99.7 | 2.38 | 1.75 | 9.9/21 | 47.9 | 1.84 | 0.34 | 176.9/151 |
| NGC 1068 | 0.9 | 0 | 1000.0 | 2.33 | 0.45 | 282.0/187 | 1000.0 | 1.73 | 1.25 | 1056.2/740 |
| NGC 1194 | 6.0 | 90 | 101.3 | 1.79 | 0.60 | 90.8/65 | 81.1 | 1.50 | 0.78 | 307.5/243 |
| NGC 1229 | 1.7 | 90 | 820.6 | 1.96 | – | 6.5/8 | 43.0 | 1.4f | 0.25 | 98.6/96 |
| ESO 201-IG 004 | 1.2 | 90 | 115.6 | 2.03 | 0.40 | 47.5/30 | 71.3 | 1.51 | 0.47 | 108.7/83 |
| 2MASXJ03561995–6251391 | 3.1 | 90 | 177.4 | 2.29 | 1.13 | 7.4/9 | 83.9 | 1.98 | 0.37 | 134.5/137 |
| CGCG 420–15 | 6.6 | 90 | 123.9 | 2.19 | 0.83 | 94.5/70 | 71.5 | 1.66 | 0.41 | 268.6/218 |
| ESO 005–G 004 | 10.2 | 90 | 101.9 | 1.58 | 1.32 | 17.6/12 | 106.9 | 1.54 | 1.89 | 77.4/72 |
| MCG +06–16–028 | 5.6 | 90 | 199.6 | 2.06 | – | 9.0/7 | 104.7 | 1.56 | 0.37 | 82.3/86 |
| 2MASXJ09235371–3141305 | 13.3 | 90 | 160.4 | 2.60 | 1.93 | 17.6/11 | 67.3 | 1.76 | 0.09 | 194.6/144 |
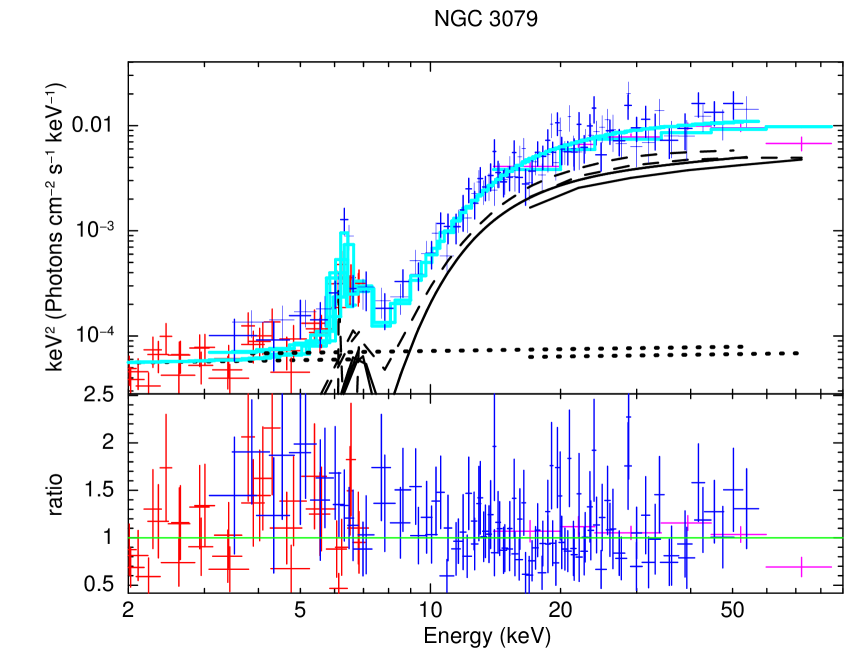
| NGC 3079 | 0.9 | 90 | 253.9 | 2.13 | 0.94 | 93.0/76 | 246.7 | 1.94 | 0.77 | 206.9/182 |
| NGC 3393 | 6.2 | 90 | 194.5 | 1.87 | 3.08 | 26.4/21 | 189.7 | 1.78 | 1.75 | 66.7/92 |
| RBS 1037 | 2.2 | 90 | 135.0 | 1.73 | – | 89.1/79 | 1.0 | 1.75 | 0.17 | 315.6/311 |
| NGC 4102 | 1.7 | 90 | 190.9 | 1.96 | 0.46 | 32.3/29 | 77.8 | 1.67 | 0.25 | 217.5/190 |
| NGC 4945 | 15.7 | 0 | 497.8 | 1.76 | 0.48 | 117.5/113 | 377.0 | 1.97 | 0.42 | 1508.8/1496 |
| IGR J14175-4641 | 8.2 | 90 | 138.4 | 2.01 | 4.09 | 5.8/7 | 80.1 | 1.79 | 0.65 | 84.3/79 |
| NGC 5643 | 8.0 | 0 | 193.7 | 2.04 | 1.41 | 57.1/66 | 159.4 | 1.58 | 1.41 | 154.0/137 |
| NGC 5728 | 7.4 | 90 | 149.2 | 1.94 | – | 18.8/22 | 142.3 | 1.88 | 0.57 | 362.4/329 |
| CGCG 164–019 | 2.5 | 0 | 111.3 | 1.66 | 1.16 | 8.4/11 | 119.5 | 1.78 | 0.41 | 59.9/57 |
| NGC 6232 | 5.7 | 90 | 405.4 | 2.19 | – | 10.7/13 | 59.3 | 1.44 | 0.44 | 35.9/34 |
| NGC 6240 | 4.9 | 90 | 149.0 | 1.95 | 0.31 | 203.5/153 | 135.5 | 1.80 | 0.34 | 533.8/495 |
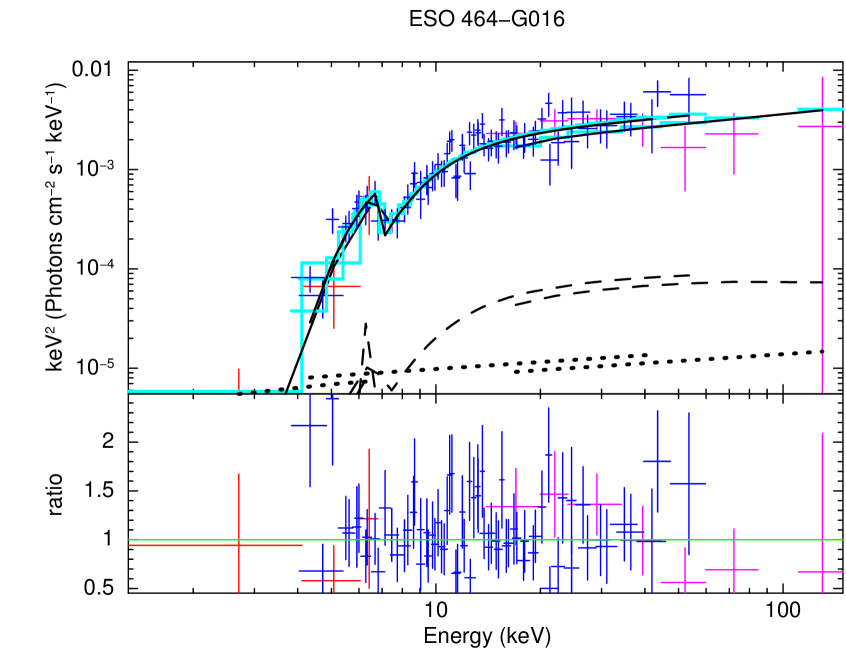
| ESO 464–G016 | 7.3 | 90 | 162.4 | 2.29 | 5.13 | 5.6/7 | 84.8 | 1.88 | 0.58 | 67.9/76 |
| NGC 7130 | 1.9 | 90 | 154.2 | 1.72 | 1.09 | 14.5/18 | 221.8 | 1.50 | 2.30 | 61.3/83 |
| NGC 7212 | 5.0 | 0 | 132.5 | 1.93 | 0.81 | 54.7/54 | 126.9 | 1.92 | 0.72 | 129.0/120 |
| NGC 7582 | 1.3 | 0 | 353.8 | 2.14 | 0.61 | 18.9/21 | 525.6 | 2.00 | 0.27 | 340.7/320 |
| Source | norm1 | AS | AL | f2-10 | L2-10 | f15-55 | L15-55 | ||
|---|---|---|---|---|---|---|---|---|---|
| NGC 424R | 0.91 | 0.37 | 282.28 | 101.95 | – | –12.03 | – | –11.05 | – |
| MCG +08–03–018 | 0.93 | 20.15 | 1.00f | =AS | 3.7 | –11.89 | 42.69 | –11.26 | 42.98 |
| NGC 1068 | 1.50 | 51.87 | 1.00f | 4.02 | 11.1 | –11.42 | 41.80 | –10.64 | 41.92 |
| NGC 1194 | 0.98 | 16.63 | 1.00f | =AS | 2.0 | –11.97 | 42.57 | –10.88 | 43.05 |
| NGC 1229 | 1.21 | 3.31 | 2.07 | =AS | 2.3 | –12.23 | 42.77 | –11.22 | 43.33 |
| ESO 201-IG 004 | 0.62 | 5.75 | 3.25 | =AS | 4.9 | –12.18 | 42.96 | –11.05 | 43.47 |
| 2MASXJ03561995–6251391 | 1.24 | 34.30 | 0.67 | =AS | 0.4 | –12.13 | 44.48 | –11.11 | 44.73 |
| CGCG 420–15 | 1.34 | 18.07 | 2.70 | =AS | 2.4 | –11.90 | 43.15 | –10.82 | 43.65 |
| ESO 005–G 004 | 0.51 | 23.91 | 1.00f | =AS | 1.1 | –12.11 | 41.64 | –11.26 | 42.62 |
| MCG +06–16–028 | 1.08 | 12.11 | 1.43 | =AS | 2.5 | –12.31 | 42.37 | –11.08 | 42.93 |
| 2MASXJ09235371–3141305 | 1.46 | 30.27 | 0.44 | =AS | 0.2 | –12.01 | 43.53 | –10.92 | 44.65 |
| NGC 3079 | 1.17 | 184.84 | 1.00f | =AS | 0.3 | –12.49 | 42.18 | –10.77 | 42.43 |
| NGC 3393 | 1.60 | 57.13 | 1.00f | =AS | 0.5 | –12.03 | 42.84 | –11.05 | 43.05 |
| RBS 1037 | 1.08 | 7.18 | – | – | – | –11.50 | 43.66 | –11.39 | 43.74 |
| NGC 4102 | 0.99 | 39.72 | 0.58 | =AS | 1.3 | –12.30 | 41.45 | –10.80 | 41.80 |
| NGC 4945 | 16.14 | 783.02 | 0.019 | 0.009 | 0.3 | –11.77 | 42.33 | –9.88 | 43.36 |
| IGR J14175-4641 | 0.63 | 35.86 | 0.55 | =AS | 0.5 | –12.01 | 44.17 | –11.24 | 44.82 |
| NGC 5643 | 0.93 | 16.10 | 3.72 | =AS | 1.0f | –12.15 | 41.19 | –11.28 | 41.82 |
| NGC 5728 | 1.00 | 185.02 | 1.82 | =AS | 0.2 | –11.80 | 42.98 | –10.44 | 43.45 |
| CGCG 164–019 | 0.82 | 18.36 | 0.56 | =AS | 3.8 | –12.27 | 43.17 | –11.45 | 43.18 |
| NGC 6232 | 0.46 | 3.51 | – | – | 2.7 | –12.51 | 42.01 | –11.83 | 42,53 |
| NGC 6240 | 1.07 | 139.50 | 1.00 | =AS | 1.8 | –11.70 | 43.81 | –10.50 | 43.94 |
| ESO 464–G016 | 1.20 | 20.79 | 1.14 | =AS | 0.9 | –12.36 | 43.27 | –11.23 | 43.80 |
| NGC 7130 | 0.95 | 8.35 | 1.10 | 5.23 | 2.4 | –12.66 | 42.51 | –11.31 | 42.83 |
| NGC 7212 | 0.86 | 35.26 | 0.91 | =AS | 1.4 | –12.18 | 43.21 | –11.31 | 43.24 |
| NGC 7582 | 0.99 | 308.67 | 1.00f | =AS | 13.6 | –11.30 | 42.06 | –10.44 | 42.57 |
5. The role of NuSTAR in the characterization of CT-AGN
As already mentioned in the introduction, the excellent effective area of NuSTAR in the 5–30 keV range represents a fundamental tool to study heavily obscured AGN, and provides more accurate results than those obtained through the joint fit of Swift-BAT and 2–10 keV data only. To quantitatively validate this assumption, in this section we compare the best-fit results obtained without and with the addition of the NuSTAR data.
First of all, the significantly improved statistics allows us to better constrain the spectral parameters. For example, the mean uncertainty on the intrinsic absorption is reduced by a factor 3, being 50% without the NuSTAR data, and becoming 17% when the NuSTAR data are added to the fit. Similarly, the average uncertainty on decreases by 30% when the NuSTAR data are included to the fit, from 11% to 7%. In these computations, we do not take into account those sources whose either best-fit or value is pegged to a MyTorus boundary value. In particular, while computing the average value we do not include NGC 1068, whose intrinsic absorption best-fit value is pegged at the MyTorus upper boundary for this parameter, =1025 cm-2, RBS 1037, which we find being an unobscured AGN (1022 cm-2; see Section 4), and NGC 4102, which is best-fitted by a model where is different from . Similarly, we exclude three sources from the average computation: 2MASXJ09235371-3141305, whose value is pegged at MyTorus upper boundary, =2.6, NGC 1229, whose value is pegged at MyTorus lower boundary, =1.4, and NGC 4945, which is best-fitted by a model where is different from .
The importance of NuSTAR is even more evident when measuring the intensity of the iron K line at 6.4 keV: since all the sources in our sample are at low redshift (=0.11), the line energy is observed at E5.75 keV, where the effective area of all 2–10 keV instruments significantly declines. Consequently, without NuSTAR, it is possible to constrain the line equivalent width (EW) only for 14 out of 26 objects, with average uncertainty 62%. For those same sources, the addition of the NuSTAR information significantly reduces the average uncertainty, down to 41%. Furthermore, with the additional NuSTAR data it is possible to measure EW at a 90% confidence level for another eight objects which only had an upper limit: we therefore have a significant EW measurement for 22 out of 26 objects, with average uncertainty 51%.
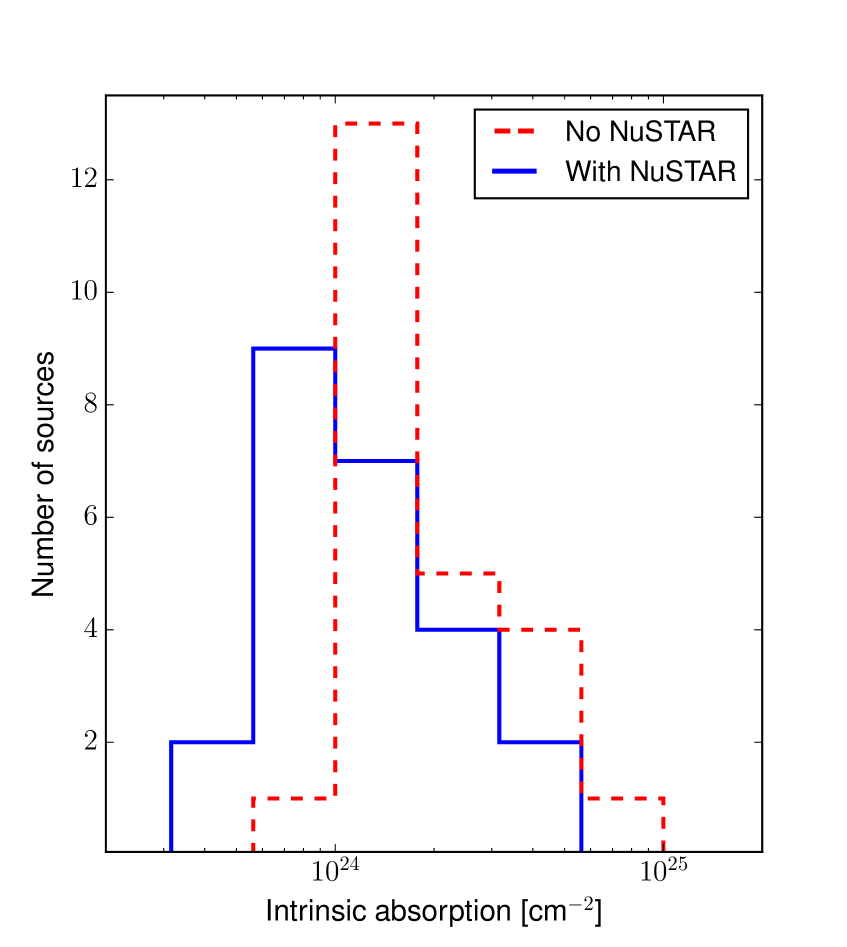
In several cases, the addition of NuSTAR data allowed us to refine the measurements of the spectral parameters not only reducing the uncertainties on the measurements, but also finding significantly different values. Particularly, nine candidate CT-AGN on the basis of the 2–10 keV and BAT information have 1024 cm-2 at a 3 confidence level when the NuSTAR data are added to the fit. As already discussed in Section 4, one of these objects, RBS 1037, is actually an unobscured AGN. Furthermore, another three sources have best-fit intrinsic absorption 1024 cm-2, but with the 3 confidence upper limit being 1024 cm-2. Finally, four objects have best-fit 1024 cm-2, but 3 confidence lower limit 1024 cm-2. We show the distribution of measured without (red dashed line) and with (blue solid line) the contribution of NuSTAR in Figure 2.
Consequently, taking into account also the four sources which are not confirmed as Compton thick on the basis of the 2–10 keV+BAT data only (see Appendix B), only 14 out of 30 sources (47%) are confirmed as bona-fide CT-AGN in our analysis. Such an outcome significantly affects the overall observed fraction of CT-AGN in the nearby Universe: for example, based on our results the observed CT-AGN fraction in the 70-month Swift-BAT catalog, which was reported to be 7.6% in Ricci et al. (2015), decreases to 6.0% (i.e., from 55 to 44555Five candidate CT-AGN reported in our sample, namely the four objects with 1024 cm-2 both without and with the addition of the NuSTAR data (see Section 4 and Appendix A) and RBS 1037, are not presented as CT in Ricci et al. (2015) work. CT-AGN out of 728 sources). We also point out that this is in fact a very conservative upper limit, since it is computed under the assumption that all the 30 remaining candidate CT-AGN with no NuSTAR data available reported in Ricci et al. (2015) sample are indeed CT-AGN, an assumption that we deem unlikely based on the results of this work. If we instead assume for these 30 objects an outcome similar to the one found in our analysis, i.e., that only 50% of the candidate CT-AGN are actual CT-AGN, the CT-AGN fraction would drop to 4%, in agreement with the observed fraction measured by Burlon et al. (2011) in a sample of 199 Swift-BAT-selected AGN (=4.6%). It is worth noticing however that Burlon et al. (2011) showed that even hard X-ray instruments such Swift-BAT are biased against detecting heavily obscured sources. Once this bias is taken into account, the intrinsic CT-AGN fraction they derived is =20%.
5.1. A systematic shift in the and measurements
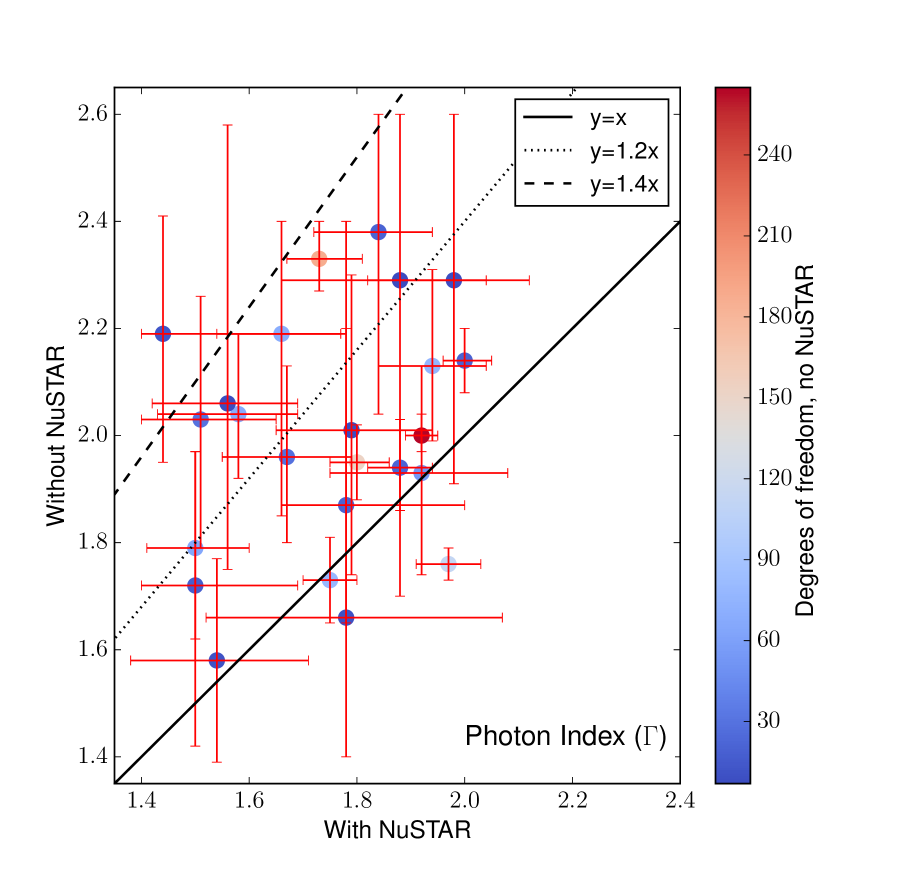
As already pointed out in the previous section, analyzing the average properties of our sample we find evidence of a systematic offset in the measurements of and computed without the NuSTAR data with respect with those computed adding NuSTAR information to the fit. More specifically, we find that 23 out of 25 objects with significant measurement have a harder photon index when the NuSTAR data are taken into account (i.e., ), the average decrease in being )/13%. It is worth noticing that the average photon index value of the sources fitted with the additional NuSTAR data is =1.74, a value in excellent agreement with the typical photon index values measured in large samples of unobscured and obscured AGN in the 0.5–10 keV band (see, e.g., Marchesi et al., 2016).
In a similar way, for 20 out of 25 sources we measure a decrease in when NuSTAR is added to the fit, the systematic reduction being on average by )/max(, )32%.
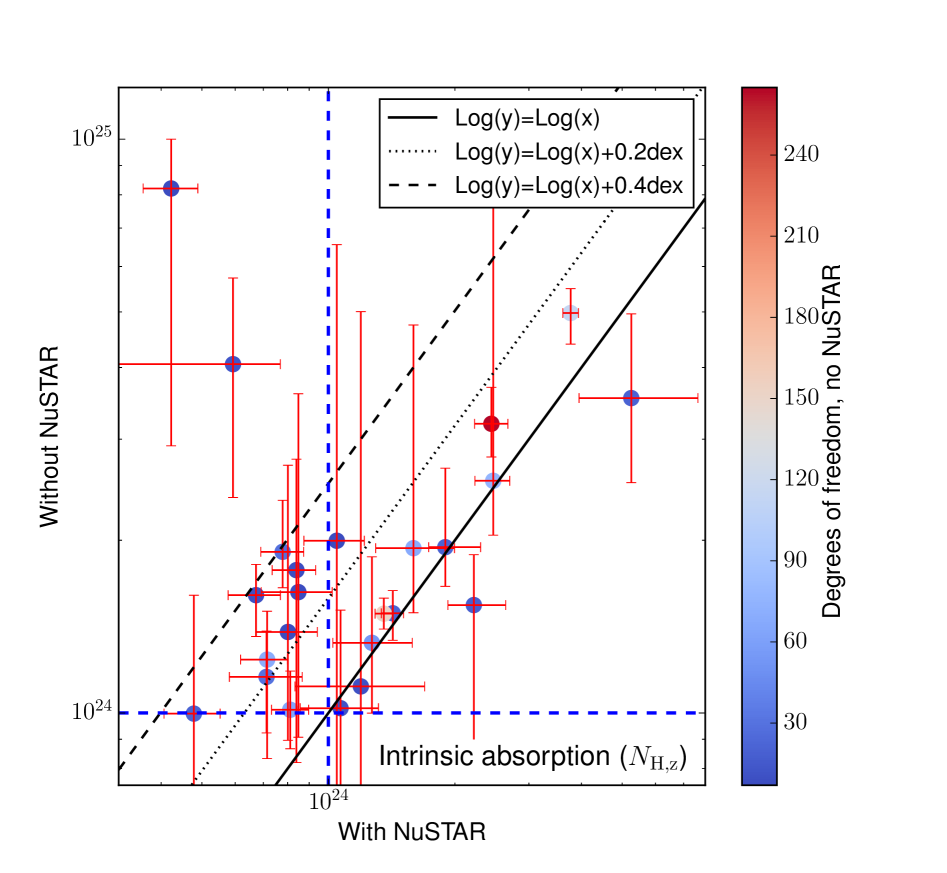
We report a summary of the average and values in Table 4, while in Figure 3 we show the distribution of as a function of (left) and the distribution of as a function of (right). As can be seen, the majority of the sources lie significantly above the 1–1 relation.
While a - degeneracy may be expected in low-quality X-ray data, a similar systematic offset has never been reported so far and represents an important result for future analyses of heavily obscured objects. Therefore, it is interesting to understand what is the origin of this behaviour. First, we study if the technical limitations of the instruments used in this analysis can explain the observed offset.
In a few objects, the photon index best-fit value is strongly driven by the Swift-BAT data, since the 2–10 keV contribution is less significant. Particularly, three sources (MCG +08–03–018, 2MASXJ03561995-6251391 and 2MASXJ09235371-3141305), all of which with less than 21 degrees of freedom in their best-fit without NuSTAR, have photon index computed without NuSTAR, 2.1 and CT values. When NuSTAR data are taken into account, all objects are found to have and Compton thin obscuration. We point out that the Swift-BAT spectra are grouped in order to have only 8 data points, and in relatively faint sources the flux uncertainties in the first and last bins, where the the Swift-BAT effective area is smaller, can significantly affect the spectral fitting results.
Since the Swift-BAT data seem to be responsible for the offset only in a minority of objects, we checked for possible instrumental effects caused by low-quality 2–10 keV spectra. To do so, we used the MyTorus model to simulate 1000 15 ks Swift-XRT observations of a Compton thin AGN with =1.75 and =7.51023 cm-2; we assumed both AS and AL to be equal to 1. Such an observation leads to a detection of 30–50 cts in the 2–10 keV band. We then fitted each simulated spectrum together with a simulated BAT spectrum, and we computed the best-fit and . Interestingly, we find that the median photon index and intrinsic absorption of the simulated population are in good agreement with the input values, being =1.78 and =81023 cm-2. However, both distributions also have very large dispersion values (=0.34 and =8.51023 cm-2), and 34% of the simulated spectra are wrongly found to have a CT best-fit value. The median photon index of this “wrongly-CT” population is =2.05. Consequently, these simulations show that the use of 2–10 keV spectra with poor counts statistics can easily lead to an improper measurement of the basic X-ray spectral parameters, and, in a significant fraction of cases, to a wrong CT classification. We note that in the heavily obscured regime this effect is more likely to over-estimate the number of candidate CT-AGN rather than to wrongly classify as Compton thin actual CT sources, since actual CT-AGN would have even lower count-rates and would therefore be missed by typical (in terms of exposure) Swift-XRT observations.
A possible solution to this issue, in future works, can be fitting low-quality 2–10 keV spectra (particularly Swift-XRT ones, or those extracted from short Chandra observations) fixing the photon index to a typical AGN value and measuring only . In this work, we find that heavily obscured AGN have an average photon index 1.7–1.8, consistent with the typical photon index of the typical unobscured AGN. Consequently, a fit with photon index fixed to, e.g., =1.8 is likely to produce better measurements of than a fit where both parameters are free to vary and the photon index best-fit value is soft (2), even if this implies obtaining a higher reduced value for the fit.
We test this assumption on the seven sources in our sample having less than 25 degrees of freedom in the 2–10 keV spectrum and best-fit 2, namely MCG+08-03-018, 2MASXJ03561995–6251391, MCG+06–16–028, 2MASXJ09235371–3141305, IGR J14175–4641, NGC 6232 and ESO 464–G016; we do not include in this subsample NGC 7582, due to its spectral complexity (see Section 3.1). We find that this method is indeed effective, since the average value of the sample decreases by 42%; more importantly, for all sources but NGC 6232 the new value is in excellent agreement, with the one, the discrepancy between the two quantities always being smaller than 25%. Notably, for four objects (MCG+08-03-018, 2MASXJ03561995–6251391, MCG+06–16–028, 2MASXJ09235371–3141305) the agreement is even closer, with only a 5% discrepancy. As a comparison, for the sources in this subsample the average offset between and , when is left free to vary, is 55%. Finally, we point out that NGC 6232 is the source in our sample with the worst NuSTAR data and both and are therefore quite poorly constrained (see Table 2), therefore the larger discrepancy between and is not surprising.
While the above mentioned results confirm that low-quality spectra can explain the measured offset, a scenario where the sources underwent an intrinsic change in is much less supported by our data. In fact, only nine out of 26 objects in our sample show evidence of variability in either flux or (see Section 4.1), while in the remaining ones allowing to vary with respect to does not significantly improve the fit.
| Sample | ||||
|---|---|---|---|---|
| 1022 cm-2 | 1022 cm-2 | |||
| All | 2.00 | 1.74 | 222.4 | 147.4 |
| dof30 | 2.00 | 1.74 | 230.6 | 134.0 |
6. Testing the Spectral Curvature technique
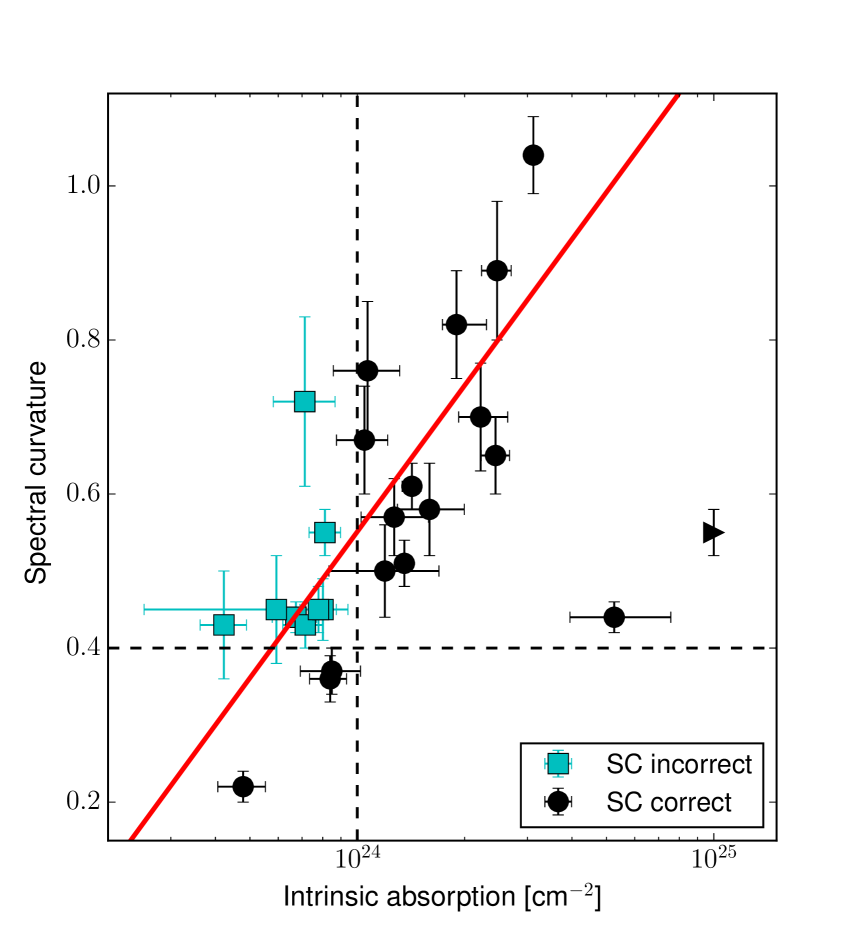
The Spectral Curvature (SC) technique has been recently developed by Koss et al. (2016) to identify candiate CT-AGN among sources having available Swift-BAT or NuSTAR data. The SC technique is based on sampling at different energy ranges the curvature observed above 10 keV in heavily obscured AGN spectra. Particularly, for sources with NuSTAR data, SC is parameterized as follows:
| (1) |
where , , and are the count rates measured with NuSTAR in the 8–14 keV, 14–20 keV, 20–30 keV and 8–30 keV bands, respectively. SC=0.4 is the CT-AGN selection threshold: in Koss et al. (2016) work, seven of the nine sources with 0.4 in their sample have 1024 cm-2, and the remaining two are significantly obscured (51023 cm-2).
In Figure 4 we plot the SC values as a function of for the 25 objects with 41023 cm-2 in our sample. As can be seen, there is a clear linear trend between SC and log(), sources with higher SC values being also the most obscured ones: the Spearman rank order correlation coefficient of the distribution is =0.72, and the p-value for such a value to be derived by an uncorrelated population is =8.310-5. Notably, the two most heavily obscured objects in our sample, NGC 1068 and NGC 7582, do not follow this trend: such a behaviour is not unexpected, since Koss et al. (2016) reported that the SC technique is biased against objects with 51024 cm-2, due to their significant reduction in count rates. Furthermore, in Figure 4 we do not show RBS 1037, since we found it to be an unobscured AGN (see Section 4): this is supported also by the SC technique, since the spectral curvature value of RBS 1037 is SC=0.130.01, i.e., the smallest SC value among the objects analyzed in this work.
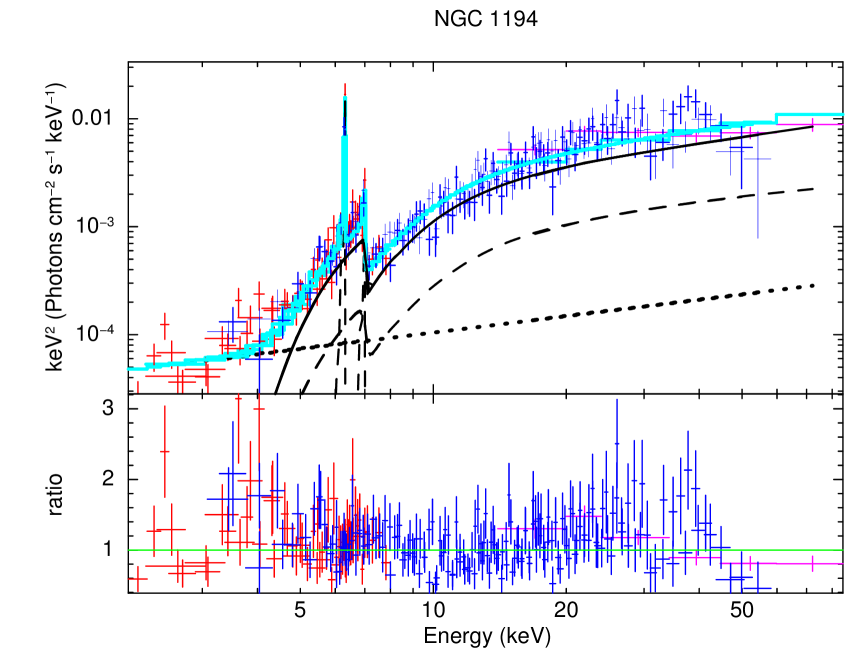
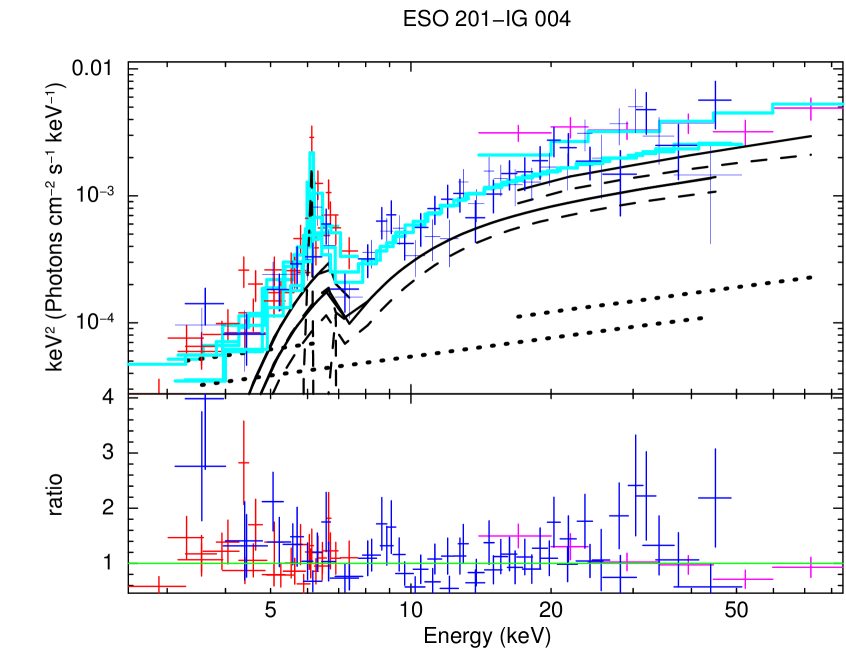
In Figure 4 we plot as cyan squares the eight objects having SC above the CT threshold proposed by Koss et al. (2016), SC=0.4, and best-fit intrinsic absorption value 1024 cm-2. These eight sources can be divided in two classes: () six objects have SC0.45 and their 3 lower limit is 0.4; these sources, having SC value close to the CT threshold one, all have 1024 cm-2 at a 3 confidence level. () The remaining two objects have SC0.55: both sources, i.e., NGC 1194 and ESO 201-IG 004, are consistent with being CT within a 3.5 uncertainty.
In conclusion, we confirm that the SC technique is a reliable method to select candidate heavily obscured AGN, and the SC=0.4 threshold allows one to select a population of heavily obscured objects without missing a significant fraction of actual CT sources.
7. Conclusions
In this work, we analyzed the combined 2–100 keV spectra of 30 candidate CT-AGN. These objects have been selected among those candidate CT sources in the 100-month BAT catalog having an archival NuSTAR observation. 2–10 keV data have been obtained using archival XMM-Newton (14 sources), Chandra (2 sources) and Swift-XRT (14 sources). For 17 out of 30 objects, this is the first time when the NuSTAR data are analyzed and discussed.
The additional NuSTAR data allows us to significantly improve the constraints on the main spectral parameters. The mean uncertainty on is reduced by a factor 3, from 50% to 17%. Similarly, the average uncertainty on decreases by 40%, from 11% to 7%. Finally, with NuSTAR we get an iron K EW measurement for 22 out of 26 objects, 8 of which only had an EW upper limit when the NuSTAR data was not added to the fit.
The main result of our analysis is the discovery that a significant fraction of candidate CT-AGN are actually Compton thin based on the fitting of the high-quality NuSTAR spectra. We find evidence of a systematic offset between the spectral parameters measured without and with the NuSTAR data, i.e., a trend to artificially over-estimating the intrinsic absorption and the steepness of the spectrum when only the 2–10 keV and the Swift-BAT data are included in the fit (see Figure 3). On average, the reduction in the photon index value is 13% and the one in the intrinsic absorption is 32%.
As a consequence, only 14 out of 30 sources (47%) are confirmed as bona-fide CT-AGN in our analysis. This result strongly indicates that the analysis of 2–10 keV+BAT spectra, while useful to detect new candidate heavily obscured sources, can lead to overestimating the CT-AGN fraction. For example, based on our results the observed CT-AGN fraction in the 70-month Swift-BAT catalog, which was reported to be 7.6% in Ricci et al. (2015), decreases to 6.0% and potentially even down to 4%, extrapolating the results of our work to the population of candidate CT-AGN with no public NuSTAR data available.
We tested different possible explanations to this systematic offset and we favour a scenario where low-quality data in the 2–10 keV band and/or from Swift-BAT can produce an artificial steepening in the intrinsic spectral shape of heavily obscured AGN. Such a steepening is then erroneously fitted by models with an excessively soft photon index (2) and an overestimated value. A possible workaround for this fitting issue is to fit low-quality 2–10 keV data fixing the photon index to a typical AGN value, =1.7–1.8, and measuring only . In our sample of seven low-quality objects this approach is found to be very effective, the discrepancy between and being reduced to less than 25% in six out of seven objects.
Finally, we tested the Spectral Curvature (SC) technique developed by Koss et al. (2016) to detect new candidate CT-AGN on the basis of their hard X-ray spectral shape. We confirm that the SC parameter directly correlates with , with Spearman rank order correlation coefficient =0.72, and that the SC=0.4 threshold is effective in selecting heavily obscured AGN.
Acknowledgements
This work made use of data supplied by the UK Swift Science Data Centre at the University of Leicester, as well as of the TOPCAT software (Taylor, 2005) for the analysis of data tables.
We thank the anonymous referee for the interesting discussion and for their comments, that significantly improved the paper. S.M. thanks Francesca Civano, Alberto Masini and Gianni Zamorani for the useful comments and suggestions. A.C., G.L. and C.V. acknowledge support from the ASI/INAF grant I/037/12/0 - 011/13.
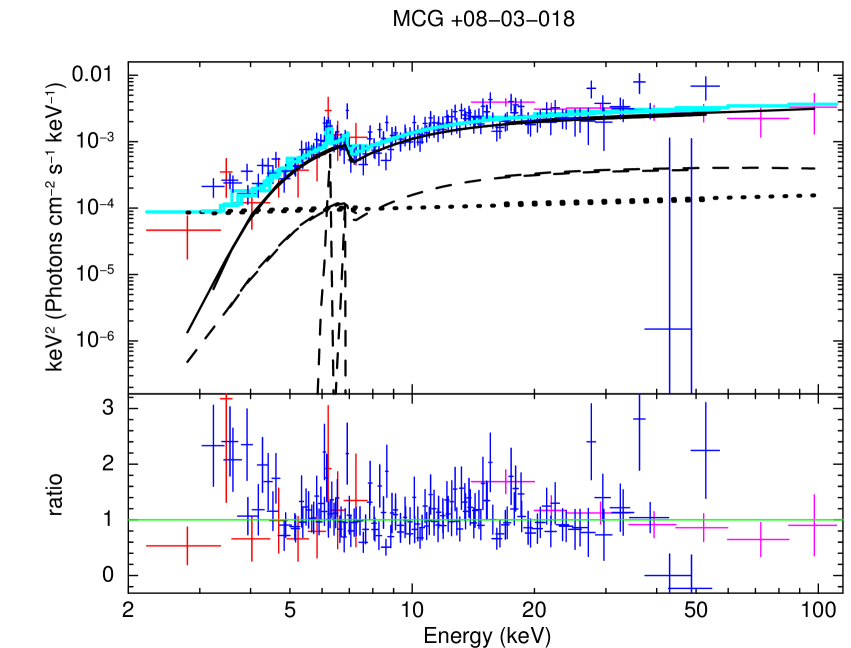
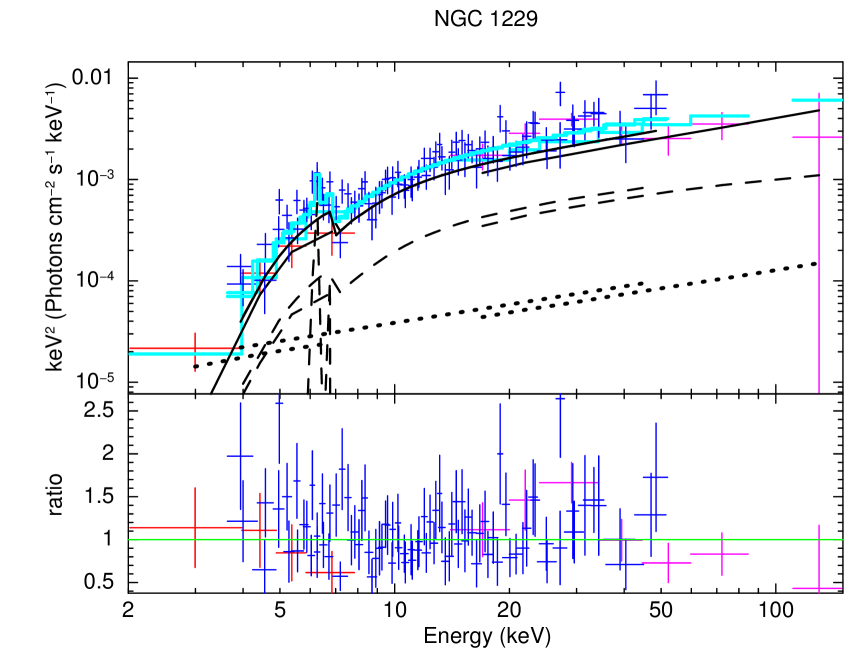
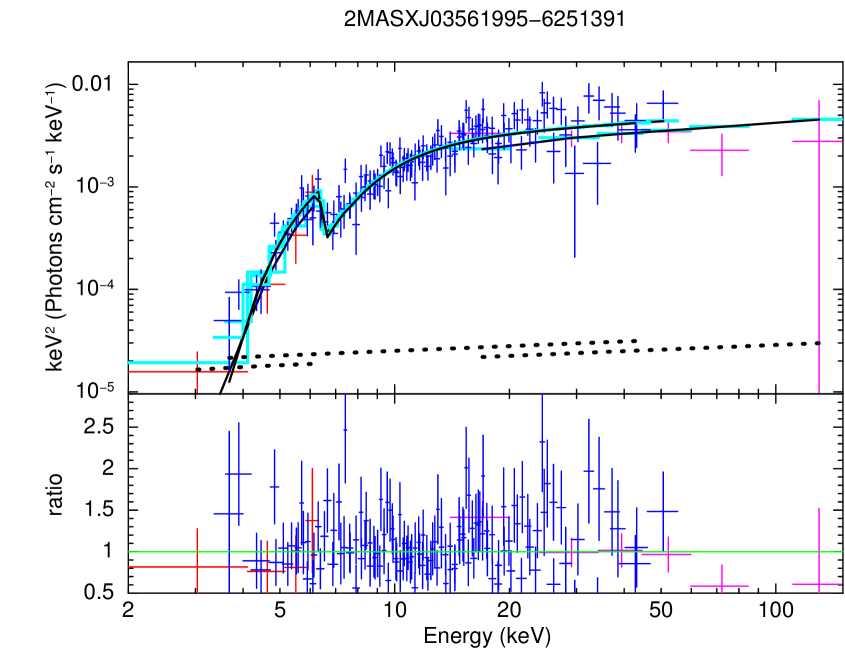
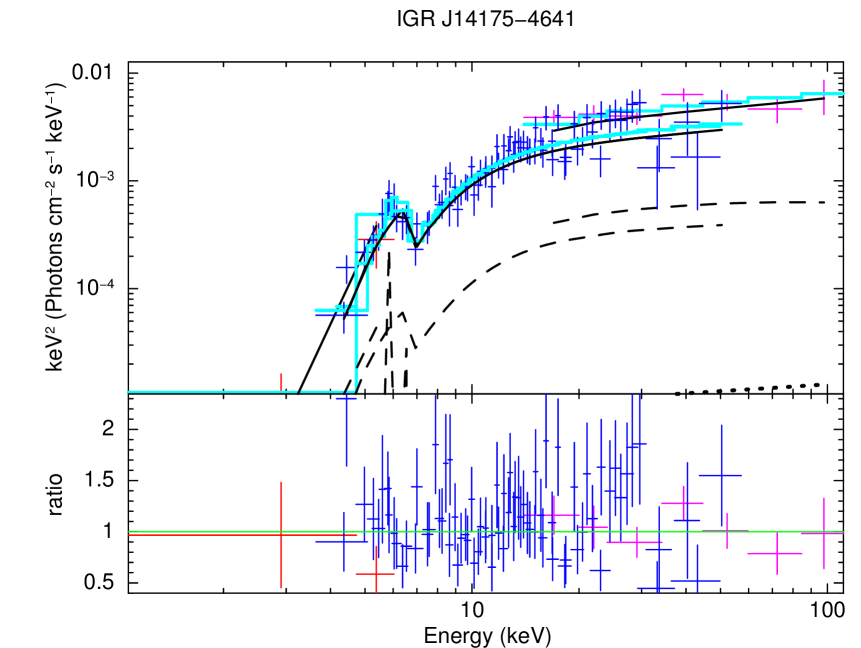
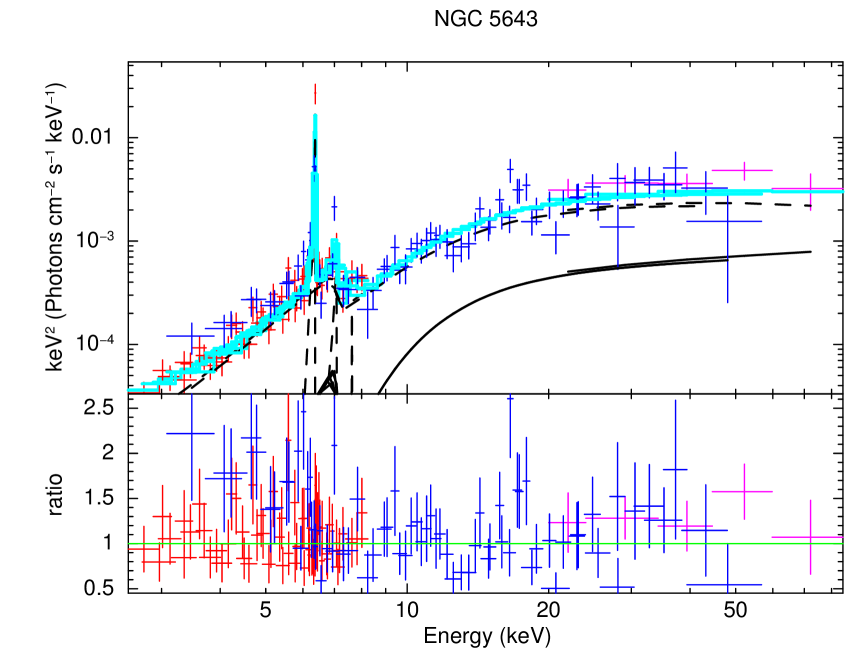
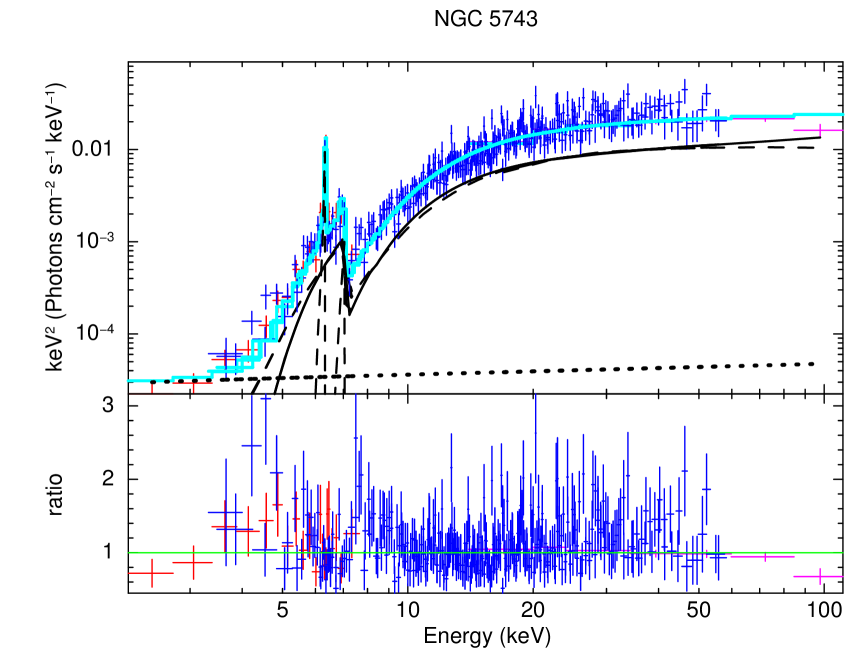
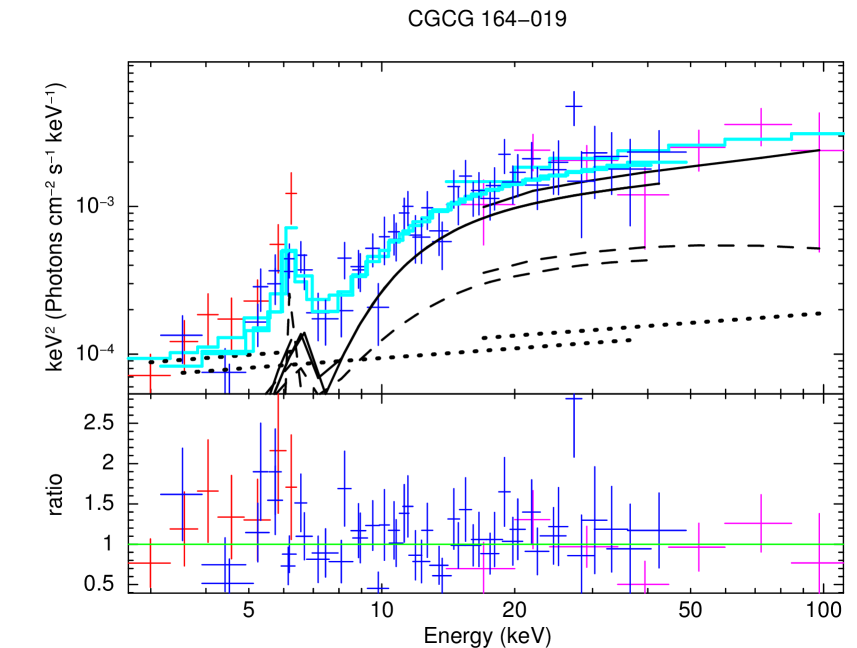
Appendix A A. Spectra of the 26 candidate CT-AGN studied in this work

Appendix B B. Sources classified as non-CT-AGN based on their 0.5–10 keV and Swift-BAT information only
The first part of the spectral analysis performed in this work makes use of the combined 2–10 keV and Swift-BAT spectra, without the NuSTAR data contribution. The results of the fit to these data, and specifically the measurements of key parameters such as the photon index and the intrinsic absorption , have then been compared with those obtained adding the NuSTAR information to the fit.
However, during this analysis we found that four out of 30 objects (namely 2MASXJ10523297+1036205, B2 1204+34, NGC 5100 and Mrk 477) have best-fit parameters that are not consistent with a CT-AGN origin at a 3 level; for all these objects, the non-CT identity of these sources has been confirmed adding the NuSTAR spectra to the fit. We present the spectra of these objects in Figure 10: in the inset, the confidence contours for and are also shown. In Table 5 we report the best-fit results, both without and with the NuSTAR spectra. For two out of four objects (namely, 2MASXJ10523297+1036205 and Mrk 477) we find that the fit significantly improves leaving free to vary from , therefore suggesting variability in the obscuring material surrounding the SMBH. Nonetheless, both values are well below the =1024 cm-2 threshold.
We point out that the CT origin of Mrk 477 was first reported in Bassani et al. (1999) and then again in Shu et al. (2007), based on these previous results. However, the Bassani et al. (1999) prediction is not derived from an actual X-ray spectral fitting result, which lead to a best-fit absorption value =91022 cm-2, with an unphysical photon index =0.2. Instead, they inferred the CT-AGN condition of the source from its location in the X-ray to optical flux versus iron K line EW diagram. Therefore, it is not fully unexpected that our analysis, which makes use of a better dataset, leads to a different result; moreover, Bassani et al. (1999) already point out that based on their diagnostics the CT status of Mrk 477 is one of the less secure in their sample.
The other three objects have been classified as CT by Vasudevan et al. (2013): for two of these objects (B2 1204+34, NGC 5100), they analyzed the same Swift-XRT observations we used in our analysis, while for 2MASXJ10523297+1036205 we used a longer XMM-Newton observation, with better statistics, which can contribute to the discrepancy between their measurements and ours. It is also worth mentioning that our spectral fitting has been performed using models specifically designed to treat obscured AGN spectra (see Section 4), while Vasudevan et al. (2013) used more general XSPEC models such as zpcfabs, a partial covering fraction absorption model.
Finally, we point out that 2MASXJ10523297+1036205 and Mrk 477 are optically classified Seyfert 1 galaxies: while a fraction of Seyfert 1 galaxies are expected to be obscured (see, e.g., Marchesi et al., 2016), the existence of CT Seyfert 1 galaxies is yet to be confirmed. For example, none of the 55 Swift-BAT-selected CT-AGN reported in Ricci et al. (2015) is classified as a Seyfert 1 source.
| Without NuSTAR | With NuSTAR | |||||||||
| Source | EW | /DOF | EW | /DOF | ||||||
| 1020 cm-2 | ° | 1022 cm-2 | keV | 1022 cm-2 | keV | |||||
| 2MASXJ10523297+1036205 | 2.3 | 90 | 18.2 | 1.56 | 0.24 | 237.0/205 | 5.2∗ | 1.51 | 0.11 | 536.0/513 |
| B2 1204+34 | 1.4 | 90 | 4.6 | 1.61 | 0.47 | 37.7/49 | 4.5 | 1.68 | 0.15 | 222.6/248 |
| NGC 5100 | 1.7 | 90 | 30.4 | 1.89 | 0.32 | 17.4/21 | 22.6 | 1.68 | 0.17 | 191.4/197 |
| Mrk 477 | 1.1 | 90 | 32.8 | 1.68 | 0.39 | 99.6/80 | 22.4∗ | 1.65 | 0.24 | 245.9/227 |
| Source | norm1 | AS (=AL) | f2-10 | L2-10 | f15-55 | L15-55 | |||
|---|---|---|---|---|---|---|---|---|---|
| 2MASXJ10523297+1036205 | 1.31 | 6.53 | 1.00f | 1.0 | 17.74 | –11.75 | 43.81 | –11.06 | 44.11 |
| B2 1204+34 | 1.81 | 6.64 | 1.00f | 4.4 | – | –11.65 | 43.61 | –11.10 | 43.82 |
| NGC 5100 | 1.38 | 13.33 | 1.00f | 0.6 | – | –11.70 | 43.10 | –11.00 | 43.55 |
| Mrk 477 | 1.54 | 11.08 | 1.00f | 3.4 | 31.70 | –11.82 | 43.21 | –10.96 | 43.45 |
References
- Ajello et al. (2008) Ajello, M., Greiner, J., Sato, G., et al. 2008, ApJ, 689, 666
- Alexander et al. (2003) Alexander, D. M., Bauer, F. E., Brandt, W. N., et al. 2003, AJ, 126, 539
- Anders & Grevesse (1989) Anders, E. & Grevesse, N. 1989, Geochim. Cosmochim. Acta, 53, 197
- Annuar et al. (2015) Annuar, A., Gandhi, P., Alexander, D. M., et al. 2015, ApJ, 815, 36
- Arnaud (1996) Arnaud, K. A. 1996, in Astronomical Society of the Pacific Conference Series, Vol. 101, Astronomical Data Analysis Software and Systems V, ed. G. H. Jacoby & J. Barnes, 17
- Baloković et al. (2014) Baloković, M., Comastri, A., Harrison, F. A., et al. 2014, ApJ, 794, 111
- Barthelmy et al. (2005) Barthelmy, S. D., Barbier, L. M., Cummings, J. R., et al. 2005, Space Sci. Rev., 120, 143
- Bassani et al. (1999) Bassani, L., Dadina, M., Maiolino, R., et al. 1999, ApJS, 121, 473
- Bauer et al. (2015) Bauer, F. E., Arévalo, P., Walton, D. J., et al. 2015, ApJ, 812, 116
- Bianchi et al. (2009) Bianchi, S., Piconcelli, E., Chiaberge, M., et al. 2009, ApJ, 695, 781
- Brightman et al. (2015) Brightman, M., Baloković, M., Stern, D., et al. 2015, ApJ, 805, 41
- Brightman & Nandra (2011) Brightman, M. & Nandra, K. 2011, MNRAS, 413, 1206
- Burlon et al. (2011) Burlon, D., Ajello, M., Greiner, J., et al. 2011, ApJ, 728, 58
- Burtscher et al. (2013) Burtscher, L., Meisenheimer, K., Tristram, K. R. W., et al. 2013, A&A, 558, A149
- Collinge & Brandt (2000) Collinge, M. J. & Brandt, W. N. 2000, MNRAS, 317, L35
- Comastri (2004) Comastri, A. 2004, in Astrophysics and Space Science Library, Vol. 308, Supermassive Black Holes in the Distant Universe, ed. A. J. Barger (Dordrecht: Kluwer), 245
- Della Ceca et al. (2008) Della Ceca, R., Caccianiga, A., Severgnini, P., et al. 2008, A&A, 487, 119
- Elitzur & Shlosman (2006) Elitzur, M. & Shlosman, I. 2006, ApJL, 648, L101
- Evans et al. (2009) Evans, P. A., Beardmore, A. P., Page, K. L., et al. 2009, MNRAS, 397, 1177
- Fruscione et al. (2006) Fruscione, A., McDowell, J. C., Allen, G. E., et al. 2006, in Proc. SPIE, Vol. 6270, Society of Photo-Optical Instrumentation Engineers (SPIE) Conference Series, 62701V
- Furui et al. (2016) Furui, S., Fukazawa, Y., Odaka, H., et al. 2016, ApJ, 818, 164
- Gehrels et al. (2004) Gehrels, N., Chincarini, G., Giommi, P., et al. 2004, ApJ, 611, 1005
- Gilli et al. (2007) Gilli, R., Comastri, A., & Hasinger, G. 2007, A&A, 463, 79
- González-Martín et al. (2011) González-Martín, O., Papadakis, I., Braito, V., et al. 2011, A&A, 527, A142
- Greenhill et al. (2008) Greenhill, L. J., Tilak, A., & Madejski, G. 2008, ApJL, 686, L13
- Guainazzi et al. (2000) Guainazzi, M., Matt, G., Brandt, W. N., et al. 2000, A&A, 356, 463
- Guainazzi et al. (2005) Guainazzi, M., Matt, G., & Perola, G. C. 2005, A&A, 444, 119
- Harrison et al. (2013) Harrison, F. A., Craig, W. W., Christensen, F. E., et al. 2013, ApJ, 770, 103
- Hönig & Beckert (2007) Hönig, S. F. & Beckert, T. 2007, MNRAS, 380, 1172
- Ikeda et al. (2009) Ikeda, S., Awaki, H., & Terashima, Y. 2009, ApJ, 692, 608
- Iwasawa et al. (2001) Iwasawa, K., Matt, G., Fabian, A. C., et al. 2001, MNRAS, 326, 119
- Iyomoto et al. (2001) Iyomoto, N., Fukazawa, Y., Nakai, N., & Ishihara, Y. 2001, ApJL, 561, L69
- Jaffe et al. (2004) Jaffe, W., Meisenheimer, K., Röttgering, H. J. A., et al. 2004, Nature, 429, 47
- Kalberla et al. (2005) Kalberla, P. M. W., Burton, W. B., Hartmann, D., et al. 2005, A&A, 440, 775
- Koss et al. (2017) Koss, M., Trakhtenbrot, B., Ricci, C., et al. 2017, ArXiv e-prints [\eprint[arXiv]1707.08123]
- Koss et al. (2016) Koss, M. J., Assef, R., Baloković, M., et al. 2016, ApJ, 825, 85
- Koss et al. (2015) Koss, M. J., Romero-Cañizales, C., Baronchelli, L., et al. 2015, ApJ, 807, 149
- Levenson et al. (2006) Levenson, N. A., Heckman, T. M., Krolik, J. H., Weaver, K. A., & Życki, P. T. 2006, ApJ, 648, 111
- Levenson et al. (2005) Levenson, N. A., Weaver, K. A., Heckman, T. M., Awaki, H., & Terashima, Y. 2005, ApJ, 618, 167
- Liu & Li (2014) Liu, Y. & Li, X. 2014, ApJ, 787, 52
- Marchesi et al. (2017a) Marchesi, S., Ajello, M., Comastri, A., et al. 2017a, ApJ, 836, 116
- Marchesi et al. (2016) Marchesi, S., Lanzuisi, G., Civano, F., et al. 2016, ApJ, 830, 100
- Marchesi et al. (2017b) Marchesi, S., Tremblay, L., Ajello, M., et al. 2017b, ApJ, 848, 53
- Markwardt et al. (2005) Markwardt, C. B., Tueller, J., Skinner, G. K., et al. 2005, ApJL, 633, L77
- Masini et al. (2016) Masini, A., Comastri, A., Baloković, M., et al. 2016, A&A, 589, A59
- Matt et al. (2003) Matt, G., Bianchi, S., Guainazzi, M., et al. 2003, A&A, 399, 519
- Matt et al. (2013) Matt, G., Bianchi, S., Marinucci, A., et al. 2013, A&A, 556, A91
- Matt et al. (1996) Matt, G., Brandt, W. N., & Fabian, A. C. 1996, MNRAS, 280, 823
- Matt et al. (2000) Matt, G., Fabian, A. C., Guainazzi, M., et al. 2000, MNRAS, 318, 173
- Matt et al. (1999) Matt, G., Pompilio, F., & La Franca, F. 1999, NA, 4, 191
- Murphy & Yaqoob (2009) Murphy, K. D. & Yaqoob, T. 2009, MNRAS, 397, 1549
- Nenkova et al. (2008) Nenkova, M., Sirocky, M. M., Ivezić, Ž., & Elitzur, M. 2008, ApJ, 685, 147
- Piconcelli et al. (2007) Piconcelli, E., Bianchi, S., Guainazzi, M., Fiore, F., & Chiaberge, M. 2007, A&A, 466, 855
- Puccetti et al. (2016) Puccetti, S., Comastri, A., Bauer, F. E., et al. 2016, A&A, 585, A157
- Puccetti et al. (2014) Puccetti, S., Comastri, A., Fiore, F., et al. 2014, ApJ, 793, 26
- Ricci et al. (2015) Ricci, C., Ueda, Y., Koss, M. J., et al. 2015, ApJL, 815, L13
- Risaliti et al. (2007) Risaliti, G., Elvis, M., Fabbiano, G., et al. 2007, ApJL, 659, L111
- Risaliti et al. (1999) Risaliti, G., Maiolino, R., & Salvati, M. 1999, ApJ, 522, 157
- Rivers et al. (2015) Rivers, E., Baloković, M., Arévalo, P., et al. 2015, ApJ, 815, 55
- Segreto et al. (2010) Segreto, A., Cusumano, G., Ferrigno, C., et al. 2010, A&A, 510, A47
- Severgnini et al. (2011) Severgnini, P., Caccianiga, A., Della Ceca, R., et al. 2011, A&A, 525, A38
- Shu et al. (2007) Shu, X. W., Wang, J. X., Jiang, P., Fan, L. L., & Wang, T. G. 2007, ApJ, 657, 167
- Taylor (2005) Taylor, M. B. 2005, in Astronomical Society of the Pacific Conference Series, Vol. 347, Astronomical Data Analysis Software and Systems XIV, ed. P. Shopbell, M. Britton, & R. Ebert, 29
- Treister et al. (2009) Treister, E., Urry, C. M., & Virani, S. 2009, ApJ, 696, 110
- Turner et al. (2000) Turner, T. J., Perola, G. C., Fiore, F., et al. 2000, ApJ, 531, 245
- Ueda et al. (2014) Ueda, Y., Akiyama, M., Hasinger, G., Miyaji, T., & Watson, M. G. 2014, ApJ, 786, 104
- Ueda et al. (2007) Ueda, Y., Eguchi, S., Terashima, Y., et al. 2007, ApJL, 664, L79
- Vasudevan et al. (2013) Vasudevan, R. V., Brandt, W. N., Mushotzky, R. F., et al. 2013, ApJ, 763, 111
- Verner et al. (1996) Verner, D. A., Ferland, G. J., Korista, K. T., & Yakovlev, D. G. 1996, ApJ, 465, 487
- Vignati et al. (1999) Vignati, P., Molendi, S., Matt, G., et al. 1999, A&A, 349, L57
- Yaqoob (2012) Yaqoob, T. 2012, MNRAS, 423, 3360
- Yaqoob et al. (2010) Yaqoob, T., Murphy, K. D., Miller, L., & Turner, T. J. 2010, MNRAS, 401, 411
- Yaqoob et al. (2015) Yaqoob, T., Tatum, M. M., Scholtes, A., Gottlieb, A., & Turner, T. J. 2015, MNRAS, 454, 973