Full-disc 13CO(1-0) mapping across nearby galaxies of the EMPIRE survey and the CO-to-H2 conversion factor
Abstract
Carbon monoxide (CO) provides crucial information about the molecular gas properties of galaxies. While 12CO has been targeted extensively, isotopologues such as 13CO have the advantage of being less optically thick and observations have recently become accessible across full galaxy discs. We present a comprehensive new dataset of 13CO(1-0) observations with the IRAM 30-m telescope of the full discs of 9 nearby spiral galaxies from the EMPIRE survey at a spatial resolution of 1.5 kpc. 13CO(1-0) is mapped out to and detected at high signal-to-noise throughout our maps. We analyse the 12CO(1-0)-to-13CO(1-0) ratio () as a function of galactocentric radius and other parameters such as the 12CO(2-1)-to-12CO(1-0) intensity ratio, the 70-to-160 m flux density ratio, the star-formation rate surface density, the star-formation efficiency, and the CO-to-H2 conversion factor. We find that varies by a factor of at most within and amongst galaxies, with a median value of and larger variations in the galaxy centres than in the discs. We argue that optical depth effects, most likely due to changes in the mixture of diffuse/dense gas, are favored explanations for the observed variations, while abundance changes may also be at play. We calculate a spatially-resolved 13CO(1-0)-to-H2 conversion factor and find an average value of cm-2 (K km s-1)-1 over our sample with a standard deviation of a factor of 2. We find that 13CO(1-0) does not appear to be a good predictor of the bulk molecular gas mass in normal galaxy discs due to the presence of a large diffuse phase, but it may be a better tracer of the mass than 12CO(1-0) in the galaxy centres where the fraction of dense gas is larger.
keywords:
galaxies: spiral – galaxies: star formation – ISM: molecules.1 Introduction
Since stars form out of the cold, dense regions of the interstellar medium (ISM) where conditions favor the presence of molecules, the low-level rotational transitions of 12CO are commonly used to study star-formation properties in galaxies (e.g., Solomon & Sage, 1988; Fukui & Kawamura, 2010; Kennicutt & Evans, 2012). CO has been extensively targeted because it is the most abundant molecule after molecular hydrogen (H2) and cold H2 cannot be observed directly in emission. CO starts to form at visual extinctions of 1-3 mag corresponding to column densities of cm-2 at solar metallicity, while hydrogen becomes mostly molecular for column densities greater than a few cm-2. Under normal metallicity and moderate radiation field conditions, most of the cold, dense ISM is not expected to be dark in CO, and CO and its rarer isotopologues are expected to trace well the H2 column density of clouds (Tielens & Hollenbach, 1985; van Dishoeck & Black, 1988; Sternberg et al., 2014).
Over the past decades, the 12CO(J=1-0) emission has been calibrated to provide a measure of the total mass of molecular hydrogen via the CO-to-H2 conversion factor or (e.g., Bolatto et al., 2013). In external galaxies, the main calibration techniques employed are based on the virial method, dust emission, optically thin molecular tracers, or radiative transfer of multiple molecules/transitions. These techniques often rely on making strong assumptions regarding, e.g., abundances, grain properties, filling factors, or the virialisation of molecular clouds. In addition, dependencies of the factor on physical conditions within clouds, such as density, temperature, turbulence or metallicity are expected (e.g., Wolfire et al., 2010; Shetty et al., 2011; Narayanan et al., 2011). As a consequence, the factor varies, as seen from galaxy to galaxy and across individual galaxies in observations (e.g., Arimoto et al., 1996; Downes & Solomon, 1998; Leroy et al., 2011; Papadopoulos et al., 2012; Sandstrom et al., 2013; Cormier et al., 2014; Kamenetzky et al., 2014). In normal, star-forming disc galaxies, the amplitude of those variations is up to an order of magnitude (Bolatto et al., 2013; Sandstrom et al., 2013).
In addition to environmental dependencies of a luminosity-mass conversion factor, the high abundance and densities of 12CO makes the transition optically thick in most molecular clouds, which complicates interpretation and can hamper accurate determination of cloud properties. Rarer isotopologues of the most abundant molecules containing carbon, such as 13CO, are on the one hand less abundant and hence more difficult to observe in galaxies. On the other hand, they have the advantage of being more optically thin, allowing us to access the full column density of the material they arise from. Beyond our Galaxy (see Heyer & Dame, 2015, for a review), 13CO has mainly been observed in the centres or in small, targeted regions of nearby galaxies or integrated over entire, bright galaxies (e.g., Encrenaz et al., 1979; Young & Sanders, 1986; Casoli et al., 1992; Aalto et al., 1995; Wilson et al., 1997; Paglione et al., 2001; Krips et al., 2010; Tan et al., 2011; Danielson et al., 2013; Alatalo et al., 2015; Vila-Vilaro et al., 2015; Sliwa et al., 2017a, b). With the “EMIR Multiline Probe of the ISM Regulating Galaxy Evolution” survey (EMPIRE; Bigiel et al. 2016), we have obtained complete and high signal-to-noise maps of 13CO as well as the main dense molecular gas tracers (HCN, HCO+, HNC) in the transition across the discs of nine nearby spiral galaxies with the IRAM 30-m telescope (Bigiel et al., 2016; Jiménez-Donaire et al., 2017b, c; Gallagher et al., 2017). We also obtained full maps of 12CO(1-0) emission for those nine galaxies in follow-up programs. These galaxies are drawn from the HERACLES 12CO(2-1) survey (Leroy et al., 2009). They are selected to have diverse structural properties (barred/unbarred, flocculent/grand-design spiral arms) and to reside in different environments (field/Virgo Cluster galaxy) in order to test whether these parameters influence their observable ISM properties.
In this paper, we present an analysis of the 13CO(1-0) and 12CO(1-0) observations from EMPIRE. Since 13CO has not been observed or mapped as extensively as 12CO in galaxies, our goal is to investigate variations in the 12CO(1-0)-to-13CO(1-0) ratio among and within those galaxies, and to understand if/under which conditions 13CO may be a better tracer of the molecular gas mass than 12CO. Throughout this paper, the 12CO(1-0)-to-13CO(1-0) integrated intensity ratio is denoted . Section 2 describes the observations. Section 3 presents an analysis of with radial profiles and correlation diagrams, as well as a qualitative comparison to models and a derivation of column densities. The physical origin of variations and the ability of the CO lines to trace the molecular gas mass are discussed in section 4. Finally, we summarize our conclusions in section 5.
2 Observations
2.1 EMPIRE observations of 13CO(1-0)
2.1.1 Data reduction
Observations of the IRAM 30-m large program EMPIRE (PI Bigiel) were carried out in 2012 (pilot program for NGC 5194) and between December 2014 and December 2016 (program 206-14, for the other galaxies). We mapped the full discs of 9 nearby spiral galaxies with the EMIR E0 receiver in the on-the-fly mapping mode. The half-power beam width (HPBW) at 110 GHz is 22 arcsec and the adopted spectral resolution is 4 km s-1.
The data were reduced with our in-house pipeline. The main steps include: baseline subtraction with a polynomial function of order 2, rejection of spectra above times the theoretical noise, conversion to main beam temperature assuming main beam and forward efficiencies of and , projection of the spectra onto grids of pixel size 4 arcsec. After gridding, the full width half-maximum (FWHM) of the 13CO(1-0) data is 27 arcsec. This corresponds to a linear resolution of 1.5 kpc for our sample of galaxies. We refer to Jiménez-Donaire et al. (2017c, a) for a detailed description of the data acquisition and reduction. Line calibrators were observed during each run of the campaign and their intensities vary by about 5 per cent only. Table 1 provides the list of our targets and noise levels achieved at the frequency of the 13CO(1-0) line (110.20 GHz).
2.1.2 Moment maps
We used the 12CO(2-1) data from HERACLES (Leroy et al., 2009) as a guide to create integrated intensity maps for the 13CO(1-0) line. The data were retrieved from the HERACLES repository111 http://www.iram-institute.org/EN/content-page-242-7-158-240-242-0.html, convolved to a common resolution of 27 arcsec using Gaussian kernels, and put on the same spatial grid as the EMPIRE data using the IDL procedure hastrom. At each position in the map, we fitted the 12CO(2-1) line with a single Gaussian. For pixels below a signal-to-noise ratio of 5 for the velocity-integrated intensity, we interpolated central velocities and line widths from well-detected neighboring pixels by fitting a plane to the maps. In regions where most pixels are not detected in 12CO(2-1), the interpolated central velocities are not allowed to take values lower (higher) than the minimum (maximum) velocity measured in the well-detected pixels, and the interpolated line widths are set to the average line width measured in the well-detected pixels.
The central velocities and line widths of the 12CO(2-1) line were used as initial guesses for those of the 13CO(1-0) line. We created intensity maps for 13CO(1-0) both by fitting and integrating a single Gaussian and by integrating directly the signal in specific velocity windows. We defined the windows as FWHM of the 12CO(2-1) line, thus the windows vary for each line of sight. The two methods yield differences in integrated intensities that are typically less than 7 per cent. Since the CO line profiles are not always Gaussian, especially in the galaxy centres, we prefer to use the direct integration maps and not the line-fitted maps. We also produced error maps. For each pixel, the error on the integrated intensity is calculated as the standard deviation in the line-free parts of each spectrum, multiplied by the square root of the number of (4 km s-1 wide) channels inside the FWHM given by the Gaussian fit. Figure 13 in the Appendix shows final integrated intensity maps for each galaxy.
| Name | Type | RA | Dec | Dist | PA | Map size | ||||
|---|---|---|---|---|---|---|---|---|---|---|
| (J2000) | (J2000) | (Mpc) | (arcmin) | (deg) | (deg) | (mK) | (K km s-1) | (arcmin2) | ||
| NGC 0628 | SAc | 01:36:41.8 | 15:47:01 | 9.6 | 9.8 | 7 | 20 | 4.8 | ||
| NGC 2903 | SABbc HII | 09:32:10.1 | 21:30:04 | 8.9 | 11.8 | 65 | 204 | 3.5 | ||
| NGC 3184 | SABcd group | 10:18:17.0 | 41:25:28 | 11.8 | 7.4 | 16 | 179 | 3.8 | ||
| NGC 3627 | SABb liner AGN | 11:20:15.0 | 12:59:30 | 9.4 | 10.3 | 62 | 173 | 4.4 | ||
| NGC 4254 | SAc HII | 12:18:49.6 | 14:24:59 | 14.4 | 5.0 | 32 | 55 | 3.0 | ||
| NGC 4321 | SABbc AGN | 12:22:54.9 | 15:49:21 | 14.3 | 6.0 | 30 | 153 | 3.6 | ||
| NGC 5055 | SAbc liner AGN | 13:15:49.2 | 42:01:45 | 7.9 | 11.9 | 59 | 102 | 4.6 | ||
| NGC 5194 | SAbc Seyfert 2 | 13:29:52.7 | 47:11:43 | 7.6 | 7.7 | 20 | 172 | 4.5 | ||
| NGC 6946 | SABcd HII | 20:34:52.2 | 60:09:14 | 6.8 | 11.4 | 33 | 243 | 4.6 |
Notes. See Jiménez-Donaire et al. (2017b) for references on the galaxy parameters. The distance to NGC 0628 has been updated to the value from Kreckel et al. (2017). Morphological types are from the NASA Extragalactic Database. Column 9: rms noise in the 13CO(1-0) data, calculated as the median noise level at the rest frequency of 110.2 GHz, for a spectral resolution of 4 km s-1 and spatial resolution of 27 arcsec. Column 10: average 13CO(1-0) integrated intensity and its statistical uncertainty measured by stacking all spectra across the entire map size given in Column 11.
2.2 Ancillary data
2.2.1 Reference 12CO data
In order to make homogeneous and matched-quality measurements of , we performed new observations of 8 galaxies of the EMPIRE survey (all except NGC 5194) in the 12CO(1-0) line, with the IRAM 30-m telescope. Maps of the entire discs were obtained as part of the programs 061-15, 059-16 (PI Jiménez-Donaire) and D15-12 (PI Cormier). The data were reduced with the same pipeline as for EMPIRE and we produced final cubes at a spatial resolution of 25 arcsec and a spectral resolution of 4 km s-1. We reached sensitivities of 17-30 mK () per 4 km s-1 channel. For NGC 5194, the 12CO(1-0) and 13CO(1-0) data are taken from the PAWS survey (30-m cubes222http://www.mpia.de/PAWS/PAWS/Data.html; Schinnerer et al., 2013; Pety et al., 2013).
All datasets are convolved to a common resolution of 27 arcsec using Gaussian kernels and put on the same spatial grid as the EMPIRE data. Integrated intensity maps are created following the same steps as for the 13CO(1-0) data, described in section 2.1.2.
2.2.2 Ultraviolet and infrared photometry
All of the EMPIRE targets were observed with GALEX as well as with the MIPS instrument onboard Spitzer as part of the programs LVL (Dale et al., 2009) and SINGS (Kennicutt et al., 2003). Herschel photometry exists for all of our targets except NGC 2903. We use user-provided products from the key programs VNGS and KINGFISH (data release 3) (Bendo et al., 2012; Kennicutt et al., 2011). No PACS 100 m observations are available for NGC 5194. The reduction and map-making were done in HIPE versions 9 and 8 and Scanamorphos versions 21 and 16.9, respectively. Convolutions are done using the kernels from Aniano et al. (2011).
2.3 Deriving physical quantities
2.3.1 , ,
From the photometry and spectroscopy, we derive physical quantities such as star-formation rate surface densities (), molecular gas surface densities (), and H2 column densities (). All surface densities are corrected for inclination.
Our SFR estimates are based on IR data. For all galaxies overlapping with KINGFISH, we use the TIR maps calculated with dust models from Galametz et al. (2013). For NGC 5194 and NGC 2903, we compute TIR surface brightness using the generic calibration from Galametz et al. (2013). We combine the bands MIPS 24 m, PACS 70, 160 m and SPIRE 250 m for NGC 5194 and the bands MIPS 24 and 70 m for NGC 2903. For the galaxies in KINGFISH, the comparison of TIR maps calculated from SED models and from the generic calibration yield differences of about 10 per cent for the first combination (MIPS, PACS and SPIRE) and 20 per cent for the second combination (MIPS only). The generic calibration tends to systematically overpredict slightly the TIR flux in the brightest regions. Uncertainty maps are generated by adding in quadrature errors on the fluxes and errors on the calibration coefficients and from the choice of method as quoted above in the case of the TIR calibration. The TIR maps are then converted to star-formation rate surface density maps using the calibration from Murphy et al. (2011).
Molecular gas mass surface densities and H2 column densities are commonly derived using the 12CO(1-0) line as a proxy for H2 and a CO-to-H2 conversion factor. For , the standard conversion factor is of 4.4 M⊙ pc-2 (K km s-1)-1 which includes helium (Bolatto et al., 2013). For , the standard conversion factor is of cm-2 (K km s-1)-1 which does not account for helium. These are considered as reference, Milky-Way values. Variations of the conversion factors are discussed in section 4.2.
2.3.2 Isotope abundance ratio and 12CO abundance
The 12C/13C isotope abundance ratio results from stellar processing and evolution (e.g., Wilson & Rood, 1994). The 12CO/13CO abundance ratio further depends on chemical processes within molecular clouds. While we discuss possible sources of variations in those abundances in section 4, in our analysis we make no difference between the isotope (12C/13C) abundance ratio and the isotopologue (12CO/13CO) abundance ratio. The abundance ratio is largely unconstrained for external galaxies but has been observed to vary within galaxies and from galaxy to galaxy. In the Milky Way, it increases from in the centre to in the outer disc, with a value of 70 in the solar neighborhood (Langer & Penzias, 1990; Wilson & Rood, 1994; Milam et al., 2005). In the Large Magellanic Cloud, it is 50 (Wang et al., 2009). In starburst galaxies, it is found to be 40, and in some ULIRGs it is even (e.g., Martín et al., 2010; Henkel et al., 2014; Sliwa et al., 2017b). Here, we adopt a fiducial value for the isotope abundance ratio of . In the Milky Way, this value corresponds to a distance of kpc or .
The 12CO/H2 abundance ratio is also sensitive to radiative processes and gas chemistry. It can vary by orders of magnitudes from translucent to dense lines-of-sight, with a typical scatter of 0.5 dex at any given H2 column density (van Dishoeck et al., 1992; Sheffer et al., 2008). In our large telescope beam, such different lines of sights are mixed and beam-to-beam variations of the abundance are expected to be smaller. In the following, we take the canonical value of for the 12CO/H2 abundance ratio, which corresponds to a 13CO/H2 abundance ratio of (e.g., Dickman, 1978) and could be uncertain by a factor of a few.


3 Analysis
3.1 13CO(1-0) intensities across galaxies
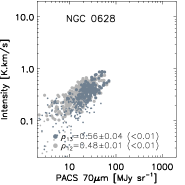
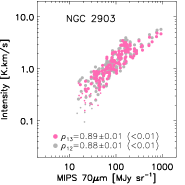
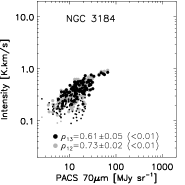
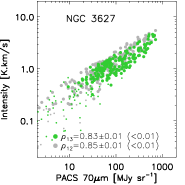
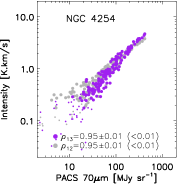
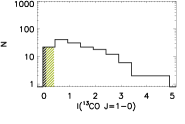
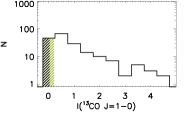
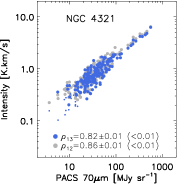
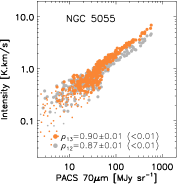
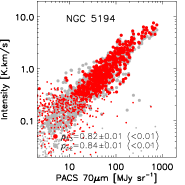
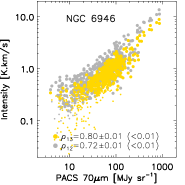
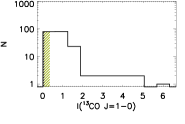
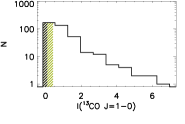
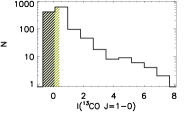
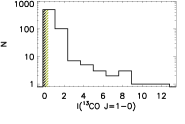
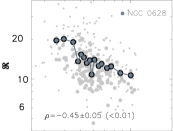
Figure 1 shows the 13CO(1-0) and scaled 12CO(1-0) intensities as a function of the PACS 70 m intensity, which can be seen as a proxy of the star-formation rate surface density, as well as histograms of the 13CO(1-0) intensities for each galaxy. 13CO(1-0) is detected throughout our maps with signal-to-noise ratio in the brightest regions, and the majority of the pixels in our maps are detected at a level. 13CO(1-0) peaks on the galaxy centres, except in NGC 3627 where it peaks on the star-forming knots at the end of the bar (though this may be somewhat an artifact of resolution). In the inter-arm/outer-disc regions, the 13CO(1-0) intensity has values 1 K km s-1 (0.3 K km s-1 for the two faintest galaxies NGC 0628 and NGC 3184).
We quantify correlations with the Spearman’s rank correlation coefficient and its significance using the IDL procedure r_correlate.pro. The correlation coefficient is computed for data points with signal-to-noise ratio of the 13CO(1-0) intensity greater than 5. With this condition, the signal-to-noise of the ancillary data sets described above is generally not a concern. The significance corresponds to the p-value or probability of null hypothesis. It is reported in parenthesis in the figures. The uncertainty () on the coefficient is estimated with a Monte-Carlo simulation. We find that 13CO(1-0) and 12CO(1-0) are generally well correlated with the dust emission from PACS 70 m. Both CO lines show very similar distributions and scatter, with departure from each other in some galaxy centres (e.g., NGC 5055). At the resolution of our data, their line profiles and line widths are also similar (see Fig. 17).
Given the high quality of the data, we perform a line-of-sight based analysis. Only in the following section 3.2, we perform a stacking analysis to extract representative spectra in the different environments of our sample of galaxies.
3.2 in the different environments of spirals
is the ratio of the 12CO(1-0) intensity and the 13CO(1-0) intensity, which have units of K km s-1. We measure in the galaxy centres, arm, inter-arm regions and total emission in our maps by means of stacking. In the stacking step, spectra corresponding to a given region are aligned in velocity using the 12CO(2-1) data as reference and averaged. Jiménez-Donaire et al. (2017b) describes the method in detail and Figure 17 shows stacked spectra of 13CO(1-0) and 12CO(1-0) for the galaxy centres and entire galaxies. CO intensities are then measured by direct integration of the stacked spectra over a velocity window large enough to encompass all the signal. Table 2 reports the values obtained this way for each galaxy as well as averages and dispersions over the sample. Figure 13 in the Appendix shows maps of with contours delineating the centre and arm regions. The regions were defined using cuts in intensity of the 12CO(1-0) line (at our working resolution of 27 arcsec or 1.5 kpc), and the cut levels were chosen by eye. ’Centre’ refers to the galaxy centres (distance to the centre of the galaxy 16 arcsec or inner 0.8 kpc, typically) where the 12CO(1-0) emission is brightest (first cut at CO intensity levels of: 5.5, 35, 7, 30, 32, 22, 30, 32, 40 K km s-1, for NGC 0628, 2903, 3184, 3627, 4254, 4321, 5055, 5194, 6946, respectively). ’Arm’ refers to the galaxy discs where the 12CO(1-0) emission is bright (second cut at CO intensity levels of: 3, 18, 3.5, 11, 11, 8, 10, 10, 10 K km s-1, for NGC 0628, 2903, 3184, 3627, 4254, 4321, 5055, 5194, 6946, respectively). ’Inter-arm’ refers to the inter-arm and outer parts of the maps where the 12CO(1-0) emission is fainter but detected at a signal-to-noise ratio . Finally, ’total’ refers to the entire map where 12CO(1-0) is detected. We note that we also defined contours by hand, identifying centres and arm regions based on 24 m and 70 m continuum images. Values of obtained by stacking with these hand contours vary by at most 10 per cent compared to values reported in Table 2. This 10 per cent discrepancy can be seen as a methodology uncertainty.
Thanks to our sensitive, full maps, we can achieve much better galaxy-integrated and environment-specific measurements than previous investigations of in nearby galaxies. In all galaxies and all environments, the noise of the data indicates that we could have measured ratios up to in the stacks (but the observed ratios are much lower). The mean global (i.e. full-galaxy) value that we measure over our sample is with a standard deviation of . When the galaxies are divided into different environments (centre, arm, inter-arm regions), we obtain similar average values, with standard deviation 2. We notice that the dispersion in is highest in the galaxy centres, with values varying between 7 and 15 (see Table 2). The dispersion is also high in the inter-arm regions, but with larger error bars on individual measurements. Studying, also at a kpc-scale, centres of 10 nearby galaxies with AGN activity, signs of a recent merger, or an intense central starburst, Israel (2009a, b) found values of in the range . In the EMPIRE survey, we find that the galaxies with bright, starburst-dominated nuclei (NGC 2903, NGC 3627, NGC 4321, and NGC 6946) have the largest central values. Two galaxies in our sample have strong bars (NGC 2903 and NGC 3627) and three other galaxies have weaker bars (NGC 3184, NGC 4321, NGC 6946, and possibly NGC 5194). Those barred galaxies also show generally higher central values than the non-barred galaxies. Both properties of having a bar and a starburst-dominated nucleus might be related as bars may help to funnel gas towards the galaxy center – leading to high dense gas fractions (Gallagher et al., 2017) – and to fuel star formation (e.g., Ho et al., 1997). Finally, two galaxies with AGN activity have low central values (NGC 5055, NGC 5194) but the trend is not systematic (e.g., NGC 3627 also has AGN activity).
| Name | ||||
|---|---|---|---|---|
| NGC 0628 | ||||
| NGC 2903 | ||||
| NGC 3184 | ||||
| NGC 3627 | ||||
| NGC 4254 | ||||
| NGC 4321 | ||||
| NGC 5055 | ||||
| NGC 5194 | ||||
| NGC 6946 | ||||
| average all | ||||
| average nuc.(a) |
Notes. The region refers to the entire map disregarding the centre and the arms, i.e. . Errors on the stacked values of correspond to statistical errors. For averages, we indicate the standard deviation of in parenthesis. Only galaxies with nuclear starbursts (NGC 2903, NGC 3627, NGC 4321, and NGC 6946).
3.3 Radial Profiles
3.3.1 Method
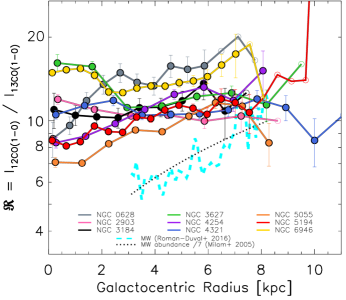
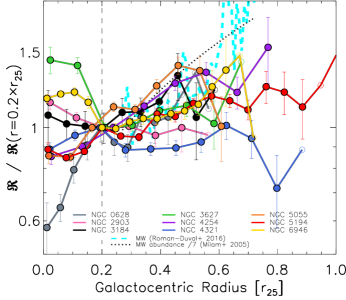
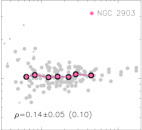
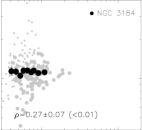
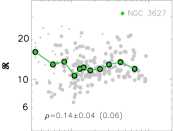
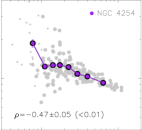
We generate radial profiles for the main tracers discussed in this paper: 13CO(1-0), 12CO(1-0), and 12CO(2-1). We choose a step size in radius of 13.5 arcsec, corresponding to half of the spatial resolution. At a given radius, we measure the average of the intensities within a tilted ring. The width of the rings is taken as the chosen step size (defined along the minor axis), so that the rings are not overlapping, but they are correlated because the beam is oversampled. Table 1 gives the assumed inclinations and position angles. Error bars on those measurements are calculated as the root-mean-squared error within each ring of our error maps and multiplied by the square root of the oversampling factor , defined as = 1.13(map resolution/pixel size)2. All intensity profiles are multiplied by to correct for inclination. Profiles of intensity ratios, such as , are built by dividing the radial profile of the quantity at the numerator with the radial profile of the quantity in the denominator. Figure 16 shows radial profiles of the individual CO line intensities for each galaxy and Figure 2 shows radial profiles of for all galaxies.
3.3.2 Description of the profiles
Radial profiles of 13CO(1-0), 12CO(1-0), and 12CO(2-1) globally follow each other very well for all galaxies (Fig. 16). Intensities peak in the centre and decrease by an order of magnitude at , and even more for NGC 6946 which has a very prominent centre.
Differences in the radial behavior of 13CO(1-0) and 12CO(1-0) are made more obvious by inspecting (Fig. 2). We have reliable measurements of out to kpc or .
- •
-
•
The profiles of NGC 3184 and NGC 4321 are flat at all radii.
-
•
The profiles of NGC 4254, NGC 5194, and NGC 5055 increase steadily by a factor of from centre to outer disc ( kpc).
-
•
The profile of NGC 0628 is peculiar. It increases by a factor of from centre to kpc and stays mostly flat at larger radii.
Centres aside, we find that the profiles increase slightly as a function of radius on average. The increase is mild compared to that observed in the Milky Way (Roman-Duval et al., 2016). At large radii ( kpc), our sample of galaxies and the Milky Way have similar values, but at lower radii, the Milky Way shows systematically lower values, between 5 and 8. increases by a factor of from the inner disc to the outer disc of the Milky Way. Such measurements, along with observations of rarer isotopologues of CO, have been used to infer abundance gradients in the Milky Way (Milam et al., 2005, shown as the black dotted line in Fig. 2). profiles are different in our sample of galaxies, implying that the Milky Way as a massive, rather quiescent galaxy (e.g., Chomiuk & Povich, 2011) that may be compact for its stellar mass, might represent a different physical regime than the galaxies in our survey (e.g., different abundance patterns), or that there could be issues (e.g., geometric) in comparing Milky Way and extragalactic work. For example, the study of Roman-Duval et al. (2016) was limited to regions less than 50 pc away from the Galactic plane and it could be missing substantial 12CO emission at high latitude (Dame et al., 2001) that we do capture in our sample.
3.3.3 Comparison to the literature on nearby spirals
Paglione et al. (2001) observed 13CO(1-0) and 12CO(1-0) along the major axes of NGC 3184, NGC 3627, NGC 5055, NGC 5194 and NGC 6946 with the FCRAO 14-m telescope (beam size 47 arcsec). Their central and outer values globally agree with our observations within errors, except for NGC 3184 for which Paglione et al. (2001) find values two times lower but with marginal detections. For NGC 3627, we find a lower average in the disc (12 instead of 17), but they have much lower statistics. For NGC 6946, we find similar central values but larger values in the disc (13-14 instead of 10). At high resolution (5 arcsec or 150 pc), Meier & Turner (2004) find a range of values between 7-20 in the nucleus of NGC 6946, which is compatible with our central average of . Muraoka et al. (2016) mapped NGC 2903 with the NRO 45-m telescope (beam size 14 arcsec). They find values of that are around 10, which is globally consistent with our results. They divide the galaxy in ten distinct regions and find that varies by a factor of about two in the different environments. Although our resolution is coarser, we do not find as large spatial variations within NGC 2903 as they do. However, we achieve much better signal-to-noise ratios for individual 13CO(1-0) measurements. Garcia-Burillo et al. (1993) mapped NGC 5194 with the IRAM 30-m and find similar values as Pety et al. (2013) (and therefore as us) in the centre and disc of this galaxy. Tosaki et al. (2002) also mapped part of the disc and the centre of NGC 5194 with the NRO telescope and found larger values () in the centre and inter-arm regions and attributed discrepancies in to differences in beam size (17 arcsec versus 25 arcsec). In addition, Tan et al. (2011) observed the centre of NGC 2903 and Li et al. (2015) observed the centres of NGC 3184, NGC 3627, NGC 4254, and NGC 4321 with the PMO 14-m telescope (beam size 55-60 arcsec). Both studies found values consistent with ours. Vila-Vilaro et al. (2015) also observed the centres of NGC 0628, NGC 2903, NGC 4254, and NGC 5055 with the ARO KP 12-m telescope (beam size 56 arcsec). We find similar values as theirs, except for the centre of NGC 4254 (8 instead of 11.5). The discrepancy could be attributed to beam size differences, as we find a global average for NGC 4254 closer to 11, or to calibration uncertainties. Our value in the centre of NGC 4254 is closer to that reported by Li et al. (2015).
In high-resolution mapping observations of nearby disc galaxies selected to lie on the blue sequence and to be actively star-forming, IR-bright galaxies (CARMA STING survey333http://www.astro.umd.edu/~bolatto/STING/), probing scales of pc, Cao et al. (2017) find similar ratios and flat profiles. They report that varies mostly from galaxy to galaxy, with values between 5 and 15. This behavior resembles what we find in the centres of our sample of galaxies, but our profiles in the discs show less scatter. While they are limited by sensitivity and focus on the inner bright, molecular gas-rich regions, we detect fainter and more diffuse regions with EMPIRE, enabling us to probe a wider range of environments (centre, arm, inter-arm regions). gal Sakamoto et al. (1997) performed strip-scan observations of the edge-on spiral NGC 891 at a resolution of 14 arcsec. They find a high value of in the centre and a general increase of , from at kpc to at kpc. The increase of with radius is less pronounced in our sample of galaxies.
Overall, there is generally good agreement between our measurements and those reported in the literature for the EMPIRE galaxies or for similar types of galaxies and at similar scales. When there are discrepancies, these tend to be due to noise in the data. The uniqueness of the EMPIRE survey lies in the large, homogeneous spatial coverage (out to ) and high signal-to-noise ratios achieved.
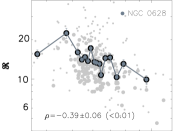
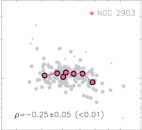
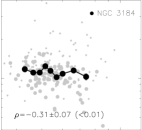
3.4 Correlation with tracers of star formation and ISM properties
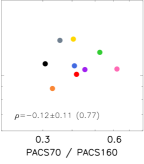
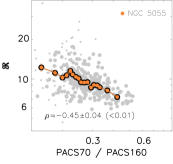
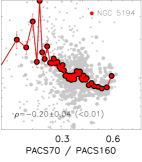
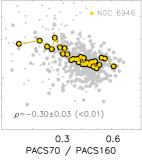
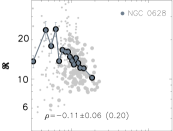
– Individual measurements of as a function of the PACS70/PACS160 flux density ratio. For NGC 2903, we use the MIPS70/MIPS160 flux density ratio.
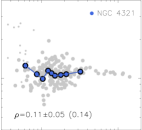
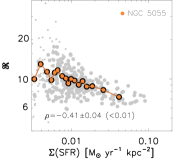
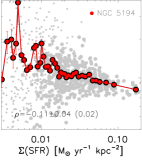
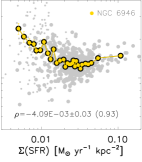
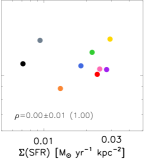
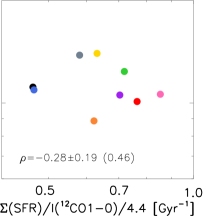
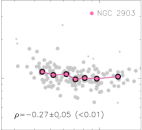
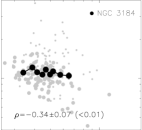
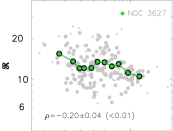
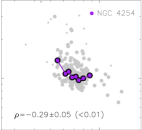
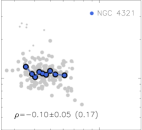
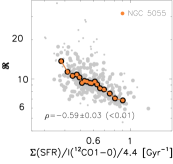
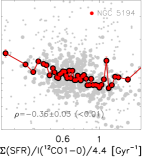
– Individual measurements of as a function of the star-formation rate surface density, .
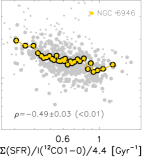
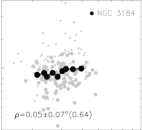
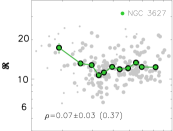
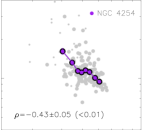
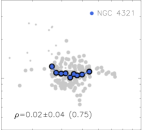
– Individual measurements of as a function of the /CO(1-0) ratio ( star-formation efficiency).
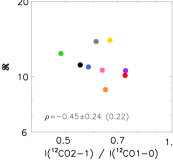
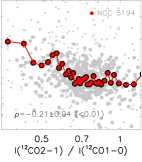
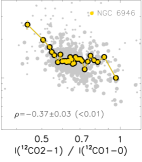
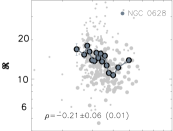
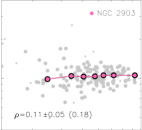
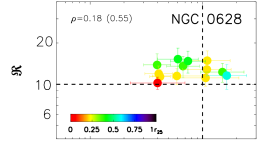
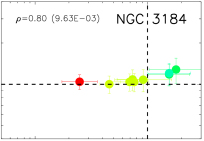
In this section, we investigate how correlates with physical parameters such as the line ratio CO(2-1)/CO(1-0), the IR colour PACS70/PACS160, the star-formation rate surface density (), and the /CO(1-0) ratio ( star-formation efficiency). We use the CO(2-1)/CO(1-0) ratio as a probe of gas conditions (temperature, density, opacity), and the IR colour PACS70/160 as an indicator of dust temperature that could be coupled to the gas temperature in the case where densities are high enough that collisions between dust grains and the gas particles lead to equal gas and dust temperatures.
Figure 3 shows values averaged over entire galaxies while Figure 4 shows the individual kpc-sized regions as well as binned values for each galaxy. To produce these measurements, we first sample our maps with a hexagonal grid of spacing 13.5 arcsec (half of the spatial resolution). For total averages (Fig. 3), we measure the average of each observed quantity (CO intensity, PACS flux density, , etc.) by considering all sampling points, and for ratios, we divide these averages with each other. For the bins, we construct irregular bins of the physical quantities such that each bin contains sampling points. Similarly (Fig. 4), we measure the intensity of each CO line and its error, either by considering the individual sampling points (for the kpc-size regions) or by averaging intensities of the sampling points falling in the bin (binned averages). We then calculate by taking the ratio of these intensities. We do not mask sampling points with low signal-to-noise when doing the binned averages. Error bars are calculated as the dispersion in measurements obtained with a Monte-Carlo simulation.
Inspecting Fig. 3, we find that the global averaged values of are not correlated with any quantity. Looking at integrated galaxies, Aalto et al. (1995) find that the warmest galaxies (F60/F1000.7), which are absent in our EMPIRE sample, display systematically high values (), while and F60/F100 do not correlate for cold-intermediate IR colours (F60/F1000.6), which is in line with our results. Moreover, Davis (2014) report a correlation between and for integrated early-type galaxies. The range that they investigate is much larger than ours (5 orders of magnitude as opposed to a dynamic range in the average of less than 1 dex in our case). This may be why we do not find a significant trend with . We discuss Figure 4 in detail next.
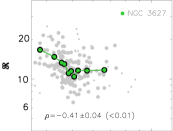
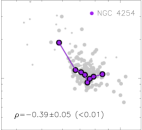
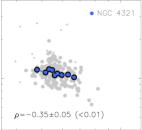
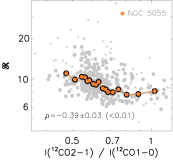
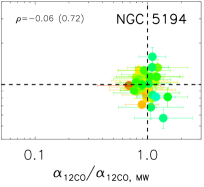
CO(2-1)/CO(1-0) intensity ratio (Fig. 4a): We find that systematically decreases with increasing CO(2-1)/CO(1-0) ratio within galaxies. Moreover, for a given value of CO(2-1)/CO(1-0), there are significant offsets in from galaxy to galaxy. The 13CO(1-0), 12CO(1-0) and 12CO(2-1) lines have upper energy levels of 5.3 K, 5.5 K and 16.6 K, and critical densities of cm-3, cm-3 and cm-3 (for K and ), respectively. We note that the critical density is a function of optical depth when line trapping effects are important (e.g., Scoville & Solomon, 1974; Shirley, 2015). In the case of 12CO, the 12CO(2-1)-to-12CO(1-0) ratio would not only be sensitive to the temperature and density of the gas but also to the optical depth of 12CO which may play a role in dictating where sub-thermal excitation happens (Peñaloza et al., 2017). On kpc-scales, our sample of galaxies span a range of CO(2-1)/CO(1-0) ratios between 0.3 and 2 and show a weak-to-moderate anti-correlation between and CO(2-1)/CO(1-0), indicating that decreases for increasing temperature/density/opacity (see Fig. 10 for model predictions). Both and CO(2-1)/CO(1-0), i.e. the y-axis and x-axis in Fig. 4a, are correlated via 12CO(1-0). We investigate if the correlations are real or not by performing two Monte-Carlo tests that are detailed in Appendix B. Those tests indicate that the observed scatter in the line ratios is physical, it cannot be explained purely by noise. They also indicate that the correlation coefficients that we measure are robust and not driven by the correlated axes. Hence both the variations in the line ratios and the observed correlations are real.
PACS70/160 IR colour (Fig. 4b): All galaxies in our sample span a similar range of PACS70/PACS160 values (). This IR colour can be used as a proxy for the dust temperature. We observe a weak-to-moderate anti-correlation of with PACS70/PACS160 for 5 galaxies: NGC 0628, NGC 4254, NGC 5055, NGC 5194, and NGC 6946. The high PACS70/PACS160 and low values are found in the centre of those galaxies, except for NGC 6946, where they are found in more diffuse regions of the disc. Comparing ratio behaviors between Fig. 4a and Fig. 4b, temperature effects may be at play in those five galaxies, but it is probably not the dominant/unique condition affecting .
SFR surface density (Fig. 4c): All galaxies in our sample span a similar range of values, with NGC 0628 and NGC 3184 being a bit less active. We observe a weak correlation between and for NGC 3184 and a moderate anti-correlation for NGC 4254 and NGC 5055. Those two galaxies have profiles steadily increasing with radius and also show an anti-correlation with the dust temperature. For NGC 3627, the behavior of with is not immediately apparent from the radial profiles (Fig. 2), probably because the star-forming knots at the end of the bar and the centre have high but different values. For the CARMA STING survey, Cao et al. (2017) also find no trend on global scales and moderately decreasing with increasing for some galaxies, their galaxies probing the range M⊙ yr-1 kpc-2.
/CO(1-0) (Fig. 4d): All galaxies in our sample span a similar range of /CO(1-0) values ( Gyr-1), which we have normalized such that they have unit of star-formation efficiency (SFEmol) under a constant, Galactic value. We find that is moderately anti-correlated with /CO(1-0) within all galaxies, i.e. that is lower at high efficiencies, though the two quantities are correlated by construction. As for the CO(2-1)/CO(1-0) intensity ratio, we test those correlations with Monte-Carlo simulations that are detailed in Appendix B. The test indicates that the scatter in the /CO(1-0) values is physical and cannot be purely explained by noise. The correlation coefficients are also robust and highest for NGC 5055 and NGC 6946. Previous works have suggested that variations in the star-formation efficiencies of massive galaxies could be linked to, e.g., a change in the relative fractions of diffuse and dense molecular gas (Saintonge et al., 2012; Shetty et al., 2014), or to enhanced CO excitation in galaxy centres (Leroy et al., 2013). Both effects have implications on the gas opacity and, though moderate, our trends indicate that the optical depth of CO, through , could indeed account for some changes in star-formation efficiencies.
We also explored how correlates with UV/TIR (not shown). This ratio can be viewed as an indicator of the visible/obscured star-formation activity and, for a given geometry, of the ISM photodissociation/shielding ability. The EMPIRE galaxies span a wide range of values for the UV/TIR luminosity ratio. However, we find no clear correlation between and UV/TIR within galaxies.
Overall, most of the trends or lack of trends of with the physical parameters (Fig. 3 and Fig. 4) resemble the trends with galactocentric radius (Fig. 2). None of the parameters is revealing a strong positive or negative correlation, indicating that the kpc-scale resolution may be too coarse to isolate and identify the local effects affecting .
| / | ||
|---|---|---|
| NGC 0628 | 3.6 (0.2) | 0.84 (0.04) |
| NGC 3184 | 4.3 (0.3) | 0.73 (0.03) |
| NGC 3627 | 0.7 (0.2) | 0.59 (0.03) |
| NGC 4254 | 4.3 (0.1) | 0.98 (0.02) |
| NGC 4321 | 1.3 (0.3) | 0.79 (0.04) |
| NGC 5055 | 3.1 (0.2) | 0.86 (0.04) |
| NGC 6946 | 1.2 (0.2) | 0.97 (0.05) |
| all galaxies | 2.3 (0.4) | 0.84 (0.08) |
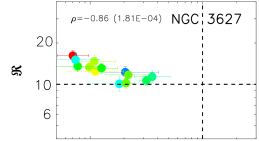
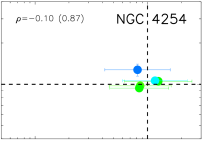
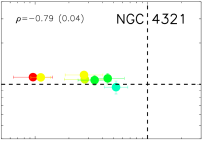
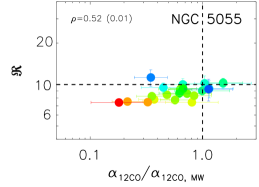
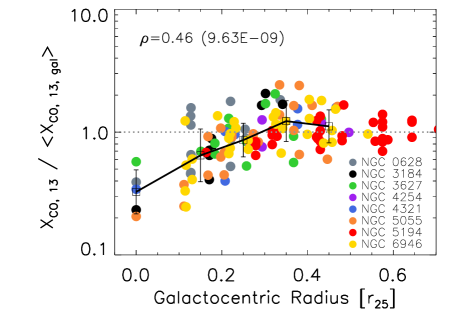
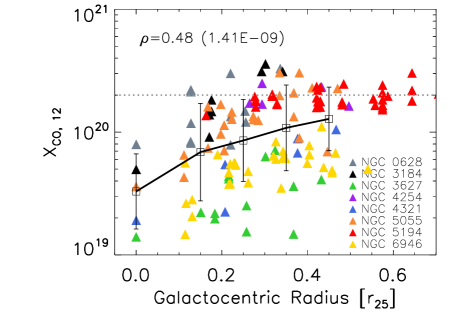
3.5 Correlation between the factor and
Since the physical quantities described above may also influence the conversion of 12CO(1-0) intensity to molecular gas mass, we investigate empirically and with models how the variations in and in the factor, calibrated on the dust reference, are linked.
The factor can be determined indirectly from dust emission. Modeling of the dust emission provides a dust mass that is converted to a total gas mass with a dust-to-gas ratio and to a molecular mass by subtracting the mass of atomic gas. This molecular gas mass or surface density (denoted below ) is then divided by the CO intensity to determine or . Leroy et al. (2011) first applied this by solving for the dust-to-gas ratio and simultaneously on spatially-resolved scales of a few kpc for the Local Group. That method was further employed in Sandstrom et al. (2013) for the HERACLES galaxies (including 8 out of the 9 galaxies of our sample) and is similarly applied to NGC 5194 in Leroy et al. (2017b) and Groves et al. (in prep.). In Sandstrom et al. (2013), is measured for hexagonal pixels of size 37.5 arcsec, using molecular surface densities from dust emission and HERACLES 12CO(2-1) observations. They formally measure that they express as because 12CO(1-0) is more commonly used. However, they adopt a fixed CO line ratio of . Here, with measurements of the 12CO(2-1)/12CO(1-0) ratio for each location, we update those values. As we find 12CO(2-1)/12CO(1-0) ratios spanning a range of values between and on a kpc-scale in our sample of galaxies, we expect the values to change a bit. We calculate the average CO intensities and value in a circular aperture (roughly matched radius of 34.1 arcsec) centered on each of the pixels. The new conversion factor is equal to:
| (1) |
We show a pixel-to-pixel comparison of the old and new values in Figure 8, and we report averages of the new values, of ratios with the old values and dispersions in Table 3. The new values are about 15 per cent lower than the old values. There is a significant offset for NGC 3627 because its 12CO(2-1)/12CO(1-0) ratio is the lowest, with an average value of 0.5 as suggested by our new IRAM 30-m observations as opposed to the canonical value of 0.7 assumed by Sandstrom et al. (2013).
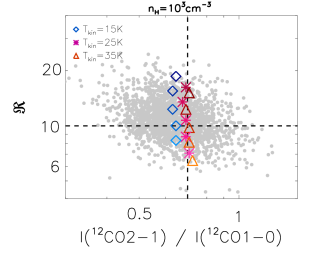
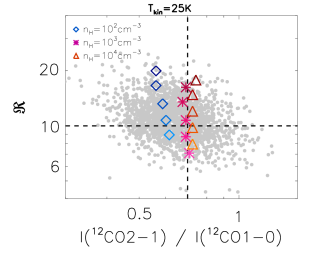
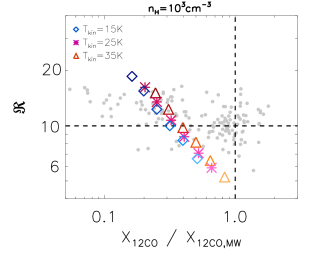
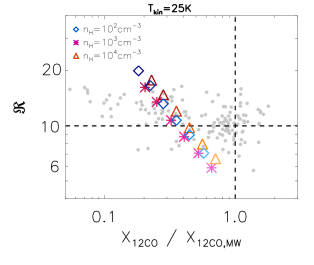
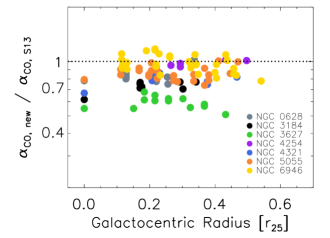
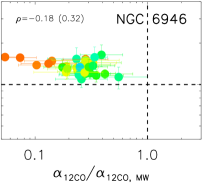
Figure 9 shows as a function of , normalized to the Milky Way value. and are positively correlated in NGC 5055 and NGC 3184, and more weakly in NGC 0628. and are anti-correlated in NGC 3627, NGC4321, and rather weakly in NGC 6946, and the lowest values () are reached in those galaxies. In galaxy centres, one possible explanation for the low values observed is a change in the 12CO optical depth (e.g., Sandstrom et al., 2013). Those optical depth effects seem to be at work in NGC 3627, NGC 6946, and to a lesser extent, NGC 4321.
3.6 Comparison to non-LTE models
To visualize how changes in physical conditions, specifically optical depth, density, and temperature, can affect quantitatively, we compare our observations to models from the non-LTE code RADEX (van der Tak et al., 2007). We note that those physical conditions, especially density and optical depth, could be correlated in real molecular clouds.
We use the grid of models built by Leroy et al. (2017a) to predict , the 12CO(2-1)/12CO(1-0) intensity ratio, and . These models consider a distribution of volume densities (as an approximation for sub-beam density variations) and take into account sub-thermal excitation, but they assume fixed abundances and the spatial coexistence of 12CO and 13CO that fill the beam and are at a common kinetic temperature. In that sense, the models are representative of a single-phase medium, not of a multi-phase medium. Model predictions are scaled to our adopted 13CO and 12CO abundances (section 2.3.2). is computed as the inverse of the 12CO(1-0) emissivity, , where , is the integrated intensity of 12CO(1-0) and is the column density of 12CO. We vary the optical depth of the 12CO(1-0) line, , from to in steps of 0.1 dex. The ratio of the 13CO(1-0) and 12CO(1-0) line optical depths, , is set to 0.03 and the effects of varying this value are discussed below. We assume a lognormal distribution of H2 volume densities with a width dex. Several values of mean volume density ( cm-3) and temperature ( K) are tested. The predicted quantities that we investigate and the trends with density are somewhat sensitive to the selected width of the distribution, but not enough to change the results reported below.
Figure 10 shows predictions of , 12CO(2-1)/12CO(1-0), and . We discuss the effects of optical depth and density separately, but these could be correlated. As expected, the 12CO(2-1)/12CO(1-0) line ratio (top panels) increases for increasing temperature and density, and it is rather constant for increasing (same symbols, different shade). Concerning (bottom panels), decreases and increases with increasing because the 12CO emissivity goes down. is inversely proportional to (see also equation 6 in section 3.7), as long as remains small. The models predict an increase of or decrease of 12CO emissivity – for a fixed – with increasing temperature. Increasing the temperature reduces the opacity per unit mass of 12CO. But to keep constant, the increase in 12CO intensity is not as large as the increase in gas column density because 12CO is optically thick, hence its emissivity goes down. The models predict only mild variations of and with density: decreases most for a density of cm-3 and increases linearly for the densities considered. This can be understood as the emissivity of 12CO peaks at densities of cm-3 (high and low ) while that of 13CO peaks for densities cm-3 (Leroy et al., 2017a).
Overall, we find that the models can only partially reproduce the observations. Density and temperature have a weaker impact on predictions than optical depth. The range of values found in the observations is covered by the models, but the range of 12CO(2-1)/12CO(1-0) ratios and values is not. While one can imagine that a broader range of temperatures or densities (or a different opacity ratio) than tested could explain the range of observed 12CO(2-1)/12CO(1-0) ratios, the trends of with require additional modifications. Focusing on the isotopic abundance ratio (which is proportional to the optical depth ratio in LTE), here we discuss qualitatively which parameter space in the models is compatible with our observations:
-
1.
Galaxies with values in the disc of and (NGC 0628, NGC 3184, NGC 4254, NGC 5194), require the models in Fig. 10 to shift by a factor of either to the right, which can be accomplished by decreasing the 12CO/H2 abundance (keeping the isotopic ratio constant), or up, which can be accomplished by increasing the isotopic abundance ratio (keeping the 12CO/H2 abundance constant).
-
2.
The trend of higher values and lower , noted above for NGC 3627, NGC 6946, and to a lesser extent, NGC 4321, can naturally be explained with the models having low values (). In their centres, the lowest values still require the models to shift by a factor of either to the left, which can be accomplished by increasing the 12CO/H2 abundance (keeping isotopic ratio constant), or down for very low values (12CO becoming optically thin), which can be accomplished by lowering the isotopic abundance ratio (to ).
-
3.
The low and low values in the centre of NGC 5055 can be accounted for with the same modifications as for (ii), but for higher values.
In summary, for the discs of most of galaxies in our sample, the range of and values observed in can be explained by variations in optical depths (for a fixed optical depth ratio or isotopic abundance ratio). However some values, especially in galaxy centres, require a change by a factor of in the optical depth ratio (or isotopic abundance ratio), which seems reasonable. We should keep in mind that physical conditions may also be changing within the model grid (i.e. a multi-phase model would be more representative).
3.7 Optical depths and column densities
Since 13CO(1-0) emission remains optically thin over larger parts of molecular clouds, it is often advocated as a more accurate tracer of the molecular gas mass than 12CO(1-0) in the intermediate-density regime ( cm-3). In this section, we present the optical depth of the 13CO(1-0) line (), 13CO column densities (), and H2 column densities () assuming local thermodynamic equilibrium (LTE). We compare the H2 column densities to those obtained from 12CO(1-0) emission. We opt for a simple framework as an alternative to the non-LTE models such as those presented in the previous section to have more flexibility on the choice of conditions/parameters and, in particular, explore the possibility of 12CO and 13CO having different filling factors. Ultimately, more lines and transitions would be needed for a complete, multi-phase modeling.
3.7.1 Framework
Given LTE, the equations of radiative transfer give the general expression for the observed brightness temperature of a line ():
| (2) |
where is the beam filling factor,
is the line intensity given by the Planck function,
is the excitation temperature,
is the background temperature equal to 2.7 K,
and is the optical depth of the line.
To reduce this equation, we make the following assumptions
for the 13CO(1-0) and 12CO(1-0) lines:
- while ,
- (12CO fills the beam) while is let free.
The optical depth and the column density are given by:
| (3) |
| (4) |
where is the integrated CO line intensity (in K km s-1), obtained by integrating the line profiles which have similar shape and width for both CO lines. Equation 2 corresponds to equation (15.36) from Wilson et al. (2012). At the adopted values ( K), we are in the Rayleigh-Jeans regime. The temperature term is an approximation of the partition function of CO with all energy levels populated in LTE. This simplification is valid for K. If is always small, is an increasing function of because upper states get preferentially populated. We also assume that the continuum is weak (no IR pumping). We refer to Jiménez-Donaire et al. (2017b) for details of the calculations. In case the beam filling factor of 13CO is lower than unity (hence lower than that of 12CO), the quantities and represent local values as opposed to beam-averaged values. To be able to compare H2 column densities derived from 12CO(1-0) and from 13CO(1-0), we shall then consider beam-averaged quantities. The beam-averaged column density of H2 can be deduced from 13CO(1-0) with:
| (5) |
From these formulae, for , the 12CO-to-H2 conversion factor will depend on , which captures the optical depth of the 12CO line. In this case:
| (6) | |||
3.7.2 Results for , , : simplest LTE case (Case 1)
To start with (Case 1), we assume thermalization of the lines and make the most simplifying assumptions, i.e. that both lines have the same excitation temperature, a beam filling factor equal to unity, abundances equal to the fiducial values, and equal to the Milky Way value. The assumed parameters as well as the results for the 13CO optical depths () and column densities ( and ) are reported in Table 4. We give average values of and and their dispersion within the maps, for entire galaxies, their centres, and their discs.
Since our sample of galaxies display quite a narrow range of values, the average values for are very similar in all galaxies and around . Those are beam-averaged values and correspond to (for an isotope abundance ratio of ) and to a 12CO effective critical density of cm-3. For , we find values in the range cm-2 with a factor of two dispersion in the maps. Those correspond to 12CO column densities of cm-2 and are averages over large beams, not local quantities. The implied optically thin 13CO-to-H2 conversion factor is cm-2 (K km s-1)-1.
We find that values of are systematically lower by a factor of 3 compared to values. If our assumptions hold, either 13CO traces poorly the total H2 column densities, or 12CO overpredicts the total H2 column densities. Similar offsets in column densities were found by Meier et al. (2001); Meier & Turner (2004); Meier et al. (2008). Taking the 12CO-based estimates as reference, we can speculate about mechanisms to increase the 13CO-based estimate. To increase by a factor of 3, we would need either an average excitation temperature of 60 K, an isotopic abundance ratio of 180, or a difference in beam filling factors of about . The maximum values allowed for each of those parameters and for each galaxy are reported in Table 4. We note that the beam filling factor can reflect variations in both abundances and emissivities of the lines but here we aim to separate the two effects and we consider that beam filling factors are dominated by emissivity variations. Although uncertainties associated to the adopted abundances are large, and temperatures in the galaxy centres may approach the required 60 K value (e.g., for NGC 6946, Walsh et al., 2002; Meier & Turner, 2004), these requirements seem unlikely to be valid throughout the discs and in all discs of our sample. Moreover, if the temperature is indeed higher than the typical temperature of Galactic molecular clouds, then a Galactic conversion factor would also no longer apply for 12CO. Hence, the discrepancies between H2 column densities derived from 13CO(1-0) and those derived from 12CO(1-0) are most likely due to differences in beam filling factor of the two lines. Presumably, 12CO(1-0) emission fills the beam and traces a more diffuse phase ( cm-3) while 13CO(1-0) emission is confined to a denser phase. In our sample of galaxies, the H2 column densities can be explained by a filling factor fraction of diffuse versus dense gas that varies between and , with a possible trend of higher fraction in galaxies with more clumpy star formation (e.g., NGC 0628, NGC 6946) and lower fraction in galaxies with strong spiral modes (e.g., NGC5055, NGC 5194).
| Name | Assumed conditions | Derived quantities | Limits on conditions | ||||||||||
| (K) | (K) | ( cm-2) | (K) | ||||||||||
| Case 1: simple LTE conditions | |||||||||||||
| NGC 0628 | 20 | 20 | 1 | 60 | 1.0 | (0.33 dex) | (0.38 dex) | 0.29 | |||||
| NGC 2903 | 20 | 20 | 1 | 60 | 1.0 | (0.10 dex) | (0.31 dex) | 0.38 | |||||
| NGC 3184 | 20 | 20 | 1 | 60 | 1.0 | (0.14 dex) | (0.23 dex) | 0.36 | |||||
| NGC 3627 | 20 | 20 | 1 | 60 | 1.0 | (0.18 dex) | (0.36 dex) | 0.33 | |||||
| NGC 4254 | 20 | 20 | 1 | 60 | 1.0 | (0.18 dex) | (0.43 dex) | 0.38 | |||||
| NGC 4321 | 20 | 20 | 1 | 60 | 1.0 | (0.09 dex) | (0.30 dex) | 0.37 | |||||
| NGC 5055 | 20 | 20 | 1 | 60 | 1.0 | (0.15 dex) | (0.35 dex) | 0.46 | |||||
| NGC 5194 | 20 | 20 | 1 | 60 | 1.0 | (0.30 dex) | (0.52 dex) | 0.40 | |||||
| NGC 6946 | 20 | 20 | 1 | 60 | 1.0 | (0.20 dex) | (0.41 dex) | 0.29 | |||||
| Case 2: motivated choice of conditions | |||||||||||||
| NGC 0628 - centre | 60 | 30 | 1 | 30 | 0.4 | (0.09 dex) | (0.11 dex) | 0.75 | |||||
| NGC 0628 - disc | 30 | 20 | 2 | 60 | 0.7 | (0.35 dex) | (0.39 dex) | 0.86 | |||||
| NGC 2903 - centre | 60 | 30 | 1 | 30 | 0.4∗ | (0.03 dex) | (0.08 dex) | 0.65 | |||||
| NGC 2903 - disc | 30 | 20 | 2 | 60 | 1.0∗ | (0.11 dex) | (0.28 dex) | 0.88 | |||||
| NGC 3184 - centre | 60 | 30 | 1 | 30 | 0.3 | (0.03 dex) | (0.05 dex) | 0.98 | |||||
| NGC 3184 - disc | 30 | 20 | 2 | 60 | 0.9 | (0.17 dex) | (0.22 dex) | 0.93 | |||||
| NGC 3627 - centre | 60 | 30 | 1 | 30 | 0.1 | (0.08 dex) | (0.11 dex) | 2.30 | |||||
| NGC 3627 - disc | 30 | 20 | 2 | 60 | 0.2 | (0.19 dex) | (0.37 dex) | 2.07 | |||||
| NGC 4254 - centre | 60 | 30 | 1 | 30 | 0.4∗ | (0.02 dex) | (0.04 dex) | 0.93 | |||||
| NGC 4254 - disc | 30 | 20 | 2 | 60 | 0.8 | (0.20 dex) | (0.42 dex) | 1.12 | |||||
| NGC 4321 - centre | 60 | 30 | 1 | 30 | 0.1 | (0.04 dex) | (0.16 dex) | 2.47 | |||||
| NGC 4321 - disc | 30 | 20 | 2 | 60 | 0.4 | (0.11 dex) | (0.26 dex) | 2.17 | |||||
| NGC 5055 - centre | 60 | 30 | 1 | 30 | 0.2 | (0.05 dex) | (0.09 dex) | 2.31 | |||||
| NGC 5055 - disc | 30 | 20 | 2 | 60 | 0.7 | (0.17 dex) | (0.34 dex) | 1.50 | |||||
| NGC 5194 - centre | 60 | 30 | 1 | 30 | 0.4∗ | (0.06 dex) | (0.09 dex) | 0.95 | |||||
| NGC 5194 - disc | 30 | 20 | 2 | 60 | 1.0 | (0.27 dex) | (0.44 dex) | 0.93 | |||||
| NGC 6946 - centre | 60 | 30 | 1 | 30 | 0.2∗ | (0.05 dex) | (0.22 dex) | 0.87 | |||||
| NGC 6946 - disc | 30 | 20 | 2 | 60 | 0.4 | (0.20 dex) | (0.35 dex) | 1.31 | |||||
Notes. Column 1: galaxy name. Columns 2-3: assumed excitation temperatures of the 12CO(1-0) and 13CO(1-0) lines. Level population of the two levels of interest corresponding to the level population as predicted by LTE at the specific temperature. Column 4: assumed ratio of beam filling factors. Column 5: assumed isotope abundance ratio. Column 6: assumed value of the 12CO(1-0)-to-H2 conversion factor, normalized to the Milky Way value. The values are based on the results from Sandstrom et al. (2013) when available and otherwise (as indicated by the symbol ∗) motivated by Bolatto et al. (2013). Column 7: mean optical depth of the 13CO(1-0) line and dispersion in the map in parenthesis. Column 8: column density of the 13CO molecule and dispersion in the map in parenthesis. Column 9: ratio of H2 column densities obtained from 13CO(1-0) emission with the conditions given in columns 3-5 and from 12CO(1-0) emission using the conversion factor given in column 6. Columns 10-11-12: maximum values allowed for the physical conditions such that column 9 equals to unity.
3.7.3 Considerations on our assumptions
The discrepancy between the H2 column densities derived from 13CO(1-0) and those derived from 12CO(1-0) may be due to oversimplifying assumptions, probably because, in our large beam size, we are probing clouds with a range of properties (densities, temperatures, optical depths; Szűcs et al., 2016; Leroy et al., 2017a). For example, abundance variations dependent on column density can change by a factor of in Galactic molecular clouds (Goldsmith et al., 2008), though not sufficiently enough to reconcile LTE masses with the higher virial masses (Heyer et al., 2009). In the limit of co-existing 12CO and 13CO emission, and for a given set of physical conditions as chosen for Case 1, considering a sub-beam density distribution (section 3.6) would not be sufficient to reconcile column densities (models predict below the Milky-Way value). In numerical simulations of realistic molecular clouds, Szűcs et al. (2016) investigate how standard methods (13CO and LTE, 12CO and , the virial method) perform in recovering the true molecular mass/column density. They find that the 13CO method is the worst predictor and systematically underpredicts the true mass by a factor of because of chemical and optical depth issues. Throughout our maps and with a beam size larger than the typical size of a molecular cloud, remains small, below 0.2, and the variations from beam to beam are not significant enough to change . It is possible that our values are slightly underestimated because 13CO is not completely optically thin and hides dense gas within the beam, although this explanation is unlikely. Indeed, in Galactic molecular clouds, can be locally enhanced on local, sub-parsec scales (e.g., Kramer et al., 1999, 2004; Jakob et al., 2007), but the impact on the global H2 column densities derived is marginal (e.g., Wong et al., 2008). Our low values for are indicative of dense gas mixed with large amounts of diffuse gas within our (kpc-scale) beam.
12CO(1-0) being optically thick leads to line trapping with the effect of lowering the critical density of the 12CO line. 12CO can emit strongly in low-density gas that makes up a large part of molecular clouds, and where 13CO emission is weak because it is sub-thermally excited (e.g. Goldsmith et al., 2008; Leroy et al., 2017a). In that case, the fact that the bulk of the 12CO and 13CO emission does not trace the same gas can naturally explain the lower values compared to the 12CO-based estimates. To reasonable approximation, for optically thin emission the emissivity per molecule scales with the density for , and is constant for . The CO critical density in the optically thin case is cm-3, so a factor of 3 correction in column densities would be expected if the volume density of the gas dominating the 13CO emission were cm-3. Conversely, one would only expect that the 13CO would produce LTE-like levels of emission if the density were above cm-3, which is clearly a large density for the bulk of molecular clouds. The 12CO(1-0) emission is presumably more extended than the 13CO(1-0) emission, as seen in resolved (pc-scales) studies (e.g., Pety et al., 2013). In the Milky Way, Roman-Duval et al. (2016) quantify the fraction of diffuse gas (gas detected in 12CO(1-0) but not in 13CO(1-0)) and dense gas (gas detected in both 12CO(1-0) and 13CO(1-0)). In terms of luminosity, they find that half of the gas is diffuse and half is dense in the outer disc, while in the inner disc, most of the gas ( per cent) is dense.
Non-LTE considerations, such as different excitation temperatures, abundances, and filling factors for the two lines (mimicking a two-phase model) are explored in the following (Case 2).
3.7.4 Results for , , : motivated choice of conditions (Case 2)
In the second case, we allow for the lines to be non-thermalized and we adopt reasonable physical parameters for the centre and discs of our sample based on Galactic studies and on results from section 3.5. In the centres, the temperatures and filling factor of dense gas are assumed higher than in the discs, and the isotopic abundance is assumed lower. The assumed parameters and resulting quantities are listed in Table 4.
By allowing the excitation temperatures and the beam filling factors of the two CO lines to differ, the resulting values generally increase with respect to Case 1. is found around in the centres and around in the discs. has similar values than in Case 1 for the discs, but larger values for the centres, around cm-2, because of the higher temperatures used.
When we adopt more realistic conditions for the centres and discs of our sample, the values of get closer to the values of than in Case 1. The results are also very sensitive to the adopted factors. The values found by Sandstrom et al. (2013), based on dust emission, are generally lower than the standard Milky Way value. For the discs, the need for a higher filling factor of diffuse versus dense gas (by a factor of about ) still persists in most galaxies. In the centres, the effect of a low value is somewhat compensated by adopting a lower isotope abundance ratio, without necessarily requiring a change in the beam filling factors. However, in NGC 3627, NGC 4321, and NGC 5055, the values are so low that this leads to 13CO predicting twice more H2 than 12CO. In those galaxies, reconciling with requires either lower temperatures than assumed, or lower abundance ratios, or larger filling factors for 13CO than for 12CO. Both conditions on the temperatures and filling factors seem unrealistic and the need for changing abundances is in line with results from section 3.5. It is also possible that uncertainties on in those galaxies dominate here.
4 Discussion
4.1 The ratio: origin of variations
The main trends of as a function of galactocentric radius that we find are: (1) a slight increase from centre to outer disc (by a factor of 2 at most); (2) offsets between galaxies (by a factor of 2 at most); (3) a high value in the centres of NGC 3627 and NGC 6946. Causes for variations are essentially linked to isotopic (or isotopolgue) abundances or gas physical conditions. They are discussed extensively for external galaxies in, e.g., Paglione et al. (2001); Tan et al. (2011); Danielson et al. (2013); Davis (2014) and briefly examined here:
-
Changes in isotope abundance due to stellar nucleosynthesis (e.g., Henkel & Mauersberger, 1993; Casoli et al., 1992). After a recent burst, one expects the 12C and 18O abundances to be enhanced relative to the 13C abundance (e.g., Meier et al., 2014; Sliwa et al., 2017b) and to increase, although the actual abundances are sensitive to the star-formation history and chemical effects within a galaxy. In the Milky Way, observations show an increase of the 12C/13C and 16O/18O abundance ratios with galactocentric radius (e.g., Milam et al., 2005) that can be reproduced by time-dependent models (e.g., Romano et al., 2017). A mild radial increase of the isotope abundance ratio (similar to or shallower than the gradient observed in the Milky Way) would naturally explain the steadily increasing profiles of some of the galaxies in our sample.
-
Changes in abundance due to selective photo-dissociation (e.g., Bally & Langer, 1982; Visser et al., 2009). Since 13CO is less abundant than 12CO and their abundances are coupled, one expects 13CO to be preferentially photo-dissociated under hard radiation fields. The effect is less clear for C18O as it can be formed in a separate way (Bron et al., 2017). Simulating a suite of molecular clouds, Szűcs et al. (2014) showed that the effect of selective photo-dissociation on the 12CO/13CO abundance ratio is minimal. Jiménez-Donaire et al. (2017c) also argue that shielding from dust and H2 dominates over self-shielding of CO molecules. Therefore, we do not consider selective photo-dissociation as a dominant effect.
-
Changes in abundance due to chemical fractionation (e.g., Liszt, 2007). This process can enhance the abundance of 13CO by a factor of 2-3 at low temperature and low optical depth in molecular clouds (Szűcs et al., 2014). It is believed to have a non-dominant effect on large (kpc) scales in the discs of galaxies (Paglione et al., 2001), though our C18O(1-0) observations do not rule out fractionation as an important effect (Jiménez-Donaire et al., 2017c). The lowest ratios are found in the centres of a few galaxies and anti-correlates with dust temperature and for those galaxies, the inverse of what is expected from chemical fractionation. Hence we consider chemical fractionation as an unlikely explanation for the lowest values.
-
Changes in physical conditions such as gas density, temperature, and opacity (e.g., Pineda et al., 2008; Wong et al., 2008). Theoretically, we expect 13CO(1-0) emission to trace denser and cooler gas than 12CO(1-0). As explored in section 3.4, temperature/excitation may drive some of the lower values observed but it is not the only condition affecting . The presence of diffuse emission or increased turbulence (for example, due to a stellar bar) would lower the optical depth of 12CO(1-0) and boost its emission relative to 13CO(1-0) (high ). Using several J transitions of 12CO and 13CO, Israel (2009a, b) model the centres of galaxies that have active nuclei with two ISM components, one hot and tenuous component with low optical depth, and one cooler and denser component. A different mixing of such two components (with different physical conditions or in different proportions) may explain the range of values observed in our sample of galaxies. The centre of NGC 3627 displays the largest 12CO(1-0) line widths (noting that this includes resolution and inclination effects, and its strong stellar bar could add significant non-circular motions as well). In the centre of NGC 6946, Wu et al. (2017) also find larger velocity dispersions by analysing cloud-scale 12CO(2-1) observations, although Meier & Turner (2004) do not find a correlation between line width and .
We conclude that changes in the isotopic abundance due to nucleosynthesis or/and changes in the gas physical conditions, such as a different mixture of dense, cold gas and diffuse, warm gas that impacts on the mean opacity, could account for the trends with radius and offsets between galaxies. In the galaxy centres, turbulence/bars could account for the highest values that we observe, but their low values still argue for changes in isotopic abundances (section 3.5). To disentangle the effects of abundance and physical conditions on , at least another 13CO transition would be needed for a future, non-LTE modeling analysis.
4.2 12CO, 13CO, and the conversion factor
In this section, we aim to understand under which circumstances 13CO(1-0) can be used to improve estimates of the molecular gas mass.
4.2.1 12CO(1-0) and 13CO(1-0) as tracers of star-formation and molecular gas mass
Galaxy centres are particularly interesting because they show some of the strongest variations in observations (including in ) and in physical properties in spiral galaxies. Several studies have found that the factor that converts 12CO(1-0) intensity to molecular gas surface density is lower in the centres of galaxies (e.g., Oka et al., 2001; Zhu et al., 2009; Sandstrom et al., 2013). This could be due to factors such as an excess of 12CO(1-0) emission from increased temperatures and large velocity dispersions lowering the optical depth of 12CO (e.g., Bolatto et al., 2013). In our sample, high 12CO(2-1)/12CO(1-0) ratios, tracing higher temperatures/densities, are indeed observed in some galaxy centres (Leroy et al., 2009, 2013). The lowest factors are also found for galaxies with the highest (see section 3.5). In those cases, knowledge on both 12CO(1-0) and 13CO(1-0) emission can help reduce uncertainties on if the later is unknown. However, we do not find a systematic increase of 12CO(1-0) emission relative to 13CO(1-0) in the galaxy centres. This implies that, at kpc-scales in normal star-forming disc galaxies, the issues encountered when using 12CO(1-0) as a tracer of the molecular gas mass are not systematically solved by using 13CO(1-0).
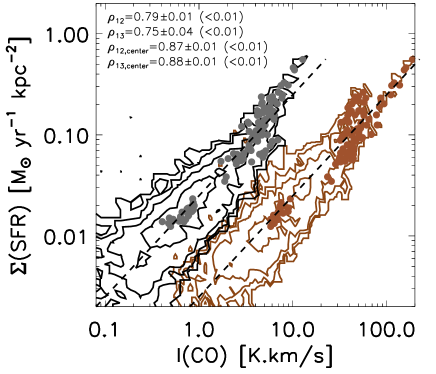
Figure 11 shows the correlation between and the 13CO(1-0) and 12CO(1-0) intensities of all EMPIRE galaxies. Density of data points are plotted as contours and data points corresponding to galaxy centres are overplotted (filled circles, centres are defined by a cut in CO intensity and radial distance, see section 3.2). The strengths of the correlations as well as the contour shapes are similar for both lines. The correlation between 12CO(1-0) and is marginally tighter than with 13CO(1-0) when considering all data points and it is the same when considering centre points only. In the brightest regions ( M⊙ yr-1 kpc-2; corresponding to the centres of all galaxies except NGC 0628 and NGC 3184), the 13CO(1-0) data points show slightly less scatter with than 12CO(1-0), and the star-formation efficiency from 13CO(1-0) also has less scatter. In those bright regions, the distribution of 13CO(1-0) data points tend to follow a super-linear relation with while the distribution of 12CO(1-0) data points appears to be bimodal with points (corresponding to NGC 6946) following a linear relation and points (corresponding to NGC 5194) following a super-linear relation. Hence 13CO does not appear to be a more stable tracer of the SFR than 12CO in our sample of disc galaxies, except at the high end.
The analysis of H2 column densities under the LTE assumption in section 3.7 has shown that 13CO(1-0) systematically underpredicts masses of H2, both in all pixels of our maps and if we consider integrated measurements. The behavior of the central pixels is obscured by the behavior of the more numerous disc pixels when looking at galaxies in their entirety. We have attributed the low H2 column densities derived from 13CO(1-0) in the discs to, mainly, the presence of diffuse gas that is traced by 12CO(1-0) or dust emission but not by 13CO. General methods to convert the dust and 12CO(1-0) emission of galaxies to mass, however, are not calibrated on those diffuse phases and may overestimate the molecular gas mass. In turn, the presence of CO-dark gas could compensate somewhat for this overestimation (see Liszt et al., 2010; Liszt & Pety, 2012). While 13CO fails in retrieving the bulk molecular gas mass, its emission may vary less than 12CO in the galaxy centres where the fraction of dense gas is larger and 13CO traces better the intermediate-density regime ( cm-3).
4.2.2 The factor from 13CO(1-0) emission
| average all | 10.0 (0.29) | 3.6 (0.25) | 10.8 (0.29) |
|---|---|---|---|
| average nuc.(a) | 4.9 (0.10) | 2.2 | 5.3 (0.11) |
Average values, in units of cm-2 (K km s-1)-1. The standard deviation is given in parenthesis and is in dex. The averages are measured as the mean of the logarithmic values of . Galaxies with nuclear starbursts (NGC 2903, NGC 3627, NGC 4321, and NGC 6946).
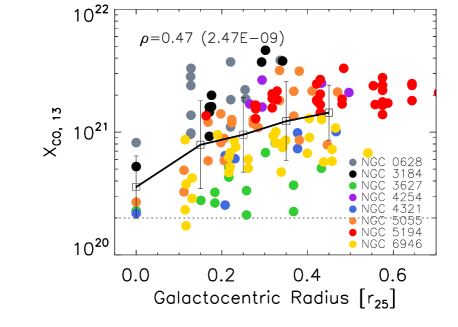
We can derive an empirical factor from 13CO(1-0) emission by dividing dust-based H2 column densities (see section 3.7.3) by the 13CO(1-0) intensity: or . Figure 12 shows values of (absolute and normalized to the average in each galaxy) as a function of distance to the centre for all galaxies. Averaged values in different parts of the galaxies are reported in Table 5. For entire galaxies, we find an average value of cm-2 (K km s-1)-1 over our sample. If one were to consider a galactic conversion factor appropriate, then can just be obtained by scaling with , and the average factor to use would be cm-2 (K km s-1)-1.
As for (Sandstrom et al., 2013), has lower values in the galaxy centres, by a factor of , and increases with distance. The scatter is large for absolute values and reduces to less than a factor of 2 for values normalized to each galaxy average. Such trends are also observed but less pronounced with and the stellar surface density decreasing with increasing because those quantities have higher values in galaxy centres. Sandstrom et al. (2013) found that the 12CO(1-0)-to-H2 conversion factor, , varies more within the galaxies dominated by a central starburst: it is about one order of magnitude lower than the Galactic value in the centres and three times lower on average. Such low conversion factors can be found for extreme starbursts like LIRGs (Downes & Solomon, 1998; Kamenetzky et al., 2014; Sliwa et al., 2017a). The galaxies dominated by a central starburst in Sandstrom et al. (2013) that are overlapping with our EMPIRE sample are NGC 3627, NGC 4321, and NGC 6946 (bottom panel of Figure 12). Those galaxies have higher values in their centres and on average. The top panel of Figure 12 shows that they have lower than the other galaxies on average, and slightly less variation from centre to outer disc than with 12CO(1-0) because of their declining profiles. Within galaxies, and show a similar dispersion of 0.2 dex, but there are still large variations from galaxy to galaxy. Taking all galaxies together, the dispersion per radial bin is about 0.30 dex for and 0.35 dex for .
Overall, our results suggest that the observed changes in cannot be explained purely by 12CO optical depth effects. In that case we would expect to stay approximately constant, while changes. In contrast, our observations favor variations in as well, with lower values in the centres. This suggests that some combination of varying parameters (abundance, optical depth, etc.) is also affecting . We note that these conclusions are all tied to H2 column estimates from the dust-based method, so they are subject to the same systematic uncertainties inherent in that technique.
5 Conclusions
We present new observations of the 13CO(1-0) emission from the EMPIRE survey (Bigiel et al., 2016; Jiménez-Donaire et al., 2017a) and of the 12CO(1-0) emission from follow-up programs obtained with the IRAM 30-m in 9 nearby spiral galaxies (NGC 0628, NGC 2903, NGC 3184, NGC 4254, NGC 4321, NGC 5055, NGC 6946; and NGC 5194 from PAWS, Pety et al. 2013). 13CO(1-0) is detected at high signal-to-noise across the entire molecular disc in those galaxies. We summarize our results as follows:
-
-
The integrated intensity of 13CO(1-0) is on average 11 times fainter than that of 12CO(1-0). The 12CO(1-0)-to-13CO(1-0) intensity ratio () does not vary significantly within or amongst galaxies in our sample (at a resolution of 1.5 kpc), by a factor of 2 at most, and the spread in values is largest in the galaxy centres. On those spatial scales, the 12CO(2-1)-to-12CO(1-0) ratio varies between 0.3 and 2.
-
-
We correlate with several physical quantities on global and resolved scales. We find no strong trend on global scales. On resolved scales, anti-correlates weakly to moderately with the 12CO(2-1)/12CO(1-0) ratio, the IR colour, , and the SFE (/). Anti-correlations are more visible for galaxies with lowest values in their centres (NGC 4254, NGC 5055, NGC 5194), which we interpret as a local temperature/excitation effect. However, other conditions such as density/optical depths must be at play to explain all behaviors.
-
-
We find that galaxies with starburst-dominated nuclei (which are also barred galaxies) have higher values in their centres than the other galaxies in our sample. In those galaxies, the anti-correlation of with the conversion factor from dust is compatible with optical depth effects. Changes in the isotope abundance ratio from stellar nucleosynthesis due to the recent central bursts are also possible.
-
-
Assuming LTE and fixed abundances, we compute optical depths and column densities for the 13CO(1-0) line. Beam-averaged optical depths are on the order of . We find that the H2 column densities derived from 13CO(1-0) are systematically lower by a factor of than those derived from 12CO(1-0). Those discrepancies can be mainly explained by non-LTE effects (significant diffuse phase in the discs where 13CO is sub-thermally excited) or departure of abundances from nominal galactic values.
-
-
Assuming H2 column densities from dust emission, we calculate an empirical 13CO(1-0)-to-H2 conversion factor. The average value found in our sample is cm-2 (K km s-1)-1. It increases from galaxy centre to outer disc with similar scatter (0.3 dex) than the 12CO(1-0)-to-H2 conversion factor (based on 12CO(2-1) data; Sandstrom et al. 2013). Except in the centres, 13CO does not appear as a more stable tracer of the molecular gas mass or star-formation rate than 12CO(1-0) in normal star-forming disc galaxies.
Despite being optically thin, the use of 13CO(1-0) emission as a tracer of total mass seems to be limited in normal star-forming disc galaxies, due to the presence of a significant diffuse phase and variations in physical conditions of the gas and abundances. To constrain those, systematic observations of at least one more 13CO transitions will be an important next step.
Acknowledgements
We thank Sacha Hony, Maud Galametz, Frédéric Galliano for useful discussions, and the referee for a careful reading of our manuscript. DC is supported by the European Union’s Horizon 2020 research and innovation programme under the Marie Skłodowska-Curie grant agreement No 702622. DC also acknowledges support from the DAAD/PROCOPE projects 57210883/35265PE. MJJD and FB acknowledge support from DFG grant BI 1546/1-1. FB acknowledges funding from the European Union’s Horizon 2020 research and innovation programme (grant agreement No 726384 - EMPIRE). The work of MG and AKL is partially supported by the National Science Foundation under Grants No. 1615105, 1615109, and 1653300. ER is supported by a Discovery Grant from NSERC of Canada. ES acknowledges funding from the European Research Council (ERC) under the European Union s Horizon 2020 research and innovation programme (grant agreement No. 694343) This work is based on observations carried out with the IRAM 30-m Telescope. IRAM is supported by INSU/CNRS (France), MPG (Germany) and IGN (Spain).
References
- Aalto et al. (1995) Aalto S., Booth R. S., Black J. H., Johansson L. E. B., 1995, A&A, 300, 369
- Alatalo et al. (2015) Alatalo K., et al., 2015, MNRAS, 450, 3874
- Aniano et al. (2011) Aniano G., Draine B. T., Gordon K. D., Sandstrom K., 2011, PASP, 123, 1218
- Arimoto et al. (1996) Arimoto N., Sofue Y., Tsujimoto T., 1996, PASJ, 48, 275
- Bally & Langer (1982) Bally J., Langer W. D., 1982, ApJ, 255, 143
- Bendo et al. (2012) Bendo G. J., Galliano F., Madden S. C., 2012, MNRAS, 423, 197
- Bigiel et al. (2016) Bigiel F., et al., 2016, ApJ, 822, L26
- Bolatto et al. (2013) Bolatto A. D., Wolfire M., Leroy A. K., 2013, ARA&A, 51, 207
- Bron et al. (2017) Bron E., et al., 2017, preprint, (arXiv:1710.07288)
- Cao et al. (2017) Cao Y., Wong T., Xue R., Bolatto A. D., Blitz L., Vogel S. N., Leroy A. K., Rosolowsky E., 2017, preprint, (arXiv:1709.00066)
- Casoli et al. (1992) Casoli F., Dupraz C., Combes F., 1992, A&A, 264, 55
- Chomiuk & Povich (2011) Chomiuk L., Povich M. S., 2011, AJ, 142, 197
- Cormier et al. (2014) Cormier D., et al., 2014, A&A, 564, A121
- Dale et al. (2009) Dale D. A., et al., 2009, ApJ, 693, 1821
- Dame et al. (2001) Dame T. M., Hartmann D., Thaddeus P., 2001, ApJ, 547, 792
- Danielson et al. (2013) Danielson A. L. R., et al., 2013, MNRAS, 436, 2793
- Davis (2014) Davis T. A., 2014, MNRAS, 445, 2378
- Dickman (1978) Dickman R. L., 1978, ApJS, 37, 407
- Downes & Solomon (1998) Downes D., Solomon P. M., 1998, ApJ, 507, 615
- Encrenaz et al. (1979) Encrenaz P. J., Stark A. A., Combes F., Wilson R. W., 1979, A&A, 78, L1
- Fukui & Kawamura (2010) Fukui Y., Kawamura A., 2010, ARA&A, 48, 547
- Galametz et al. (2013) Galametz M., et al., 2013, MNRAS, 431, 1956
- Gallagher et al. (2017) Gallagher M., et al., 2017, Dense gas, dynamical equilibrium pressure, and star formation in four nearby star-forming galaxies, submitted
- Garcia-Burillo et al. (1993) Garcia-Burillo S., Guelin M., Cernicharo J., 1993, A&A, 274, 123
- Goldsmith et al. (2008) Goldsmith P. F., Heyer M., Narayanan G., Snell R., Li D., Brunt C., 2008, ApJ, 680, 428
- Henkel & Mauersberger (1993) Henkel C., Mauersberger R., 1993, A&A, 274, 730
- Henkel et al. (2014) Henkel C., et al., 2014, A&A, 565, A3
- Heyer & Dame (2015) Heyer M., Dame T. M., 2015, ARA&A, 53, 583
- Heyer et al. (2009) Heyer M., Krawczyk C., Duval J., Jackson J. M., 2009, ApJ, 699, 1092
- Ho et al. (1997) Ho L. C., Filippenko A. V., Sargent W. L. W., 1997, ApJ, 487, 591
- Israel (2009a) Israel F. P., 2009a, A&A, 493, 525
- Israel (2009b) Israel F. P., 2009b, A&A, 506, 689
- Jakob et al. (2007) Jakob H., Kramer C., Simon R., Schneider N., Ossenkopf V., Bontemps S., Graf U. U., Stutzki J., 2007, A&A, 461, 999
- Jiménez-Donaire et al. (2017a) Jiménez-Donaire M. J., et al., 2017a, EMPIRE dense gas relations, in prep.
- Jiménez-Donaire et al. (2017b) Jiménez-Donaire M. J., et al., 2017b, MNRAS, 466, 49
- Jiménez-Donaire et al. (2017c) Jiménez-Donaire M. J., et al., 2017c, ApJ, 836, L29
- Kamenetzky et al. (2014) Kamenetzky J., Rangwala N., Glenn J., Maloney P. R., Conley A., 2014, ApJ, 795, 174
- Kennicutt & Evans (2012) Kennicutt R. C., Evans N. J., 2012, ARA&A, 50, 531
- Kennicutt et al. (2003) Kennicutt Jr. R. C., et al., 2003, PASP, 115, 928
- Kennicutt et al. (2011) Kennicutt R. C., et al., 2011, PASP, 123, 1347
- Kramer et al. (1999) Kramer C., Alves J., Lada C. J., Lada E. A., Sievers A., Ungerechts H., Walmsley C. M., 1999, A&A, 342, 257
- Kramer et al. (2004) Kramer C., Jakob H., Mookerjea B., Schneider N., Brüll M., Stutzki J., 2004, A&A, 424, 887
- Kreckel et al. (2017) Kreckel K., Groves B., Bigiel F., Blanc G. A., Kruijssen J. M. D., Hughes A., Schruba A., Schinnerer E., 2017, ApJ, 834, 174
- Krips et al. (2010) Krips M., Crocker A. F., Bureau M., Combes F., Young L. M., 2010, MNRAS, 407, 2261
- Langer & Penzias (1990) Langer W. D., Penzias A. A., 1990, ApJ, 357, 477
- Leroy et al. (2009) Leroy A. K., et al., 2009, AJ, 137, 4670
- Leroy et al. (2011) Leroy A. K., et al., 2011, ApJ, 737, 12
- Leroy et al. (2013) Leroy A. K., et al., 2013, AJ, 146, 19
- Leroy et al. (2017a) Leroy A. K., et al., 2017a, ApJ, 835, 217
- Leroy et al. (2017b) Leroy A. K., et al., 2017b, ApJ, 846, 71
- Li et al. (2015) Li F.-C., Wu Y.-W., Xu Y., 2015, Research in Astronomy and Astrophysics, 15, 785
- Liszt (2007) Liszt H. S., 2007, A&A, 476, 291
- Liszt & Pety (2012) Liszt H. S., Pety J., 2012, A&A, 541, A58
- Liszt et al. (2010) Liszt H. S., Pety J., Lucas R., 2010, A&A, 518, A45
- Martín et al. (2010) Martín S., Aladro R., Martín-Pintado J., Mauersberger R., 2010, A&A, 522, A62
- Meier & Turner (2004) Meier D. S., Turner J. L., 2004, AJ, 127, 2069
- Meier et al. (2001) Meier D. S., Turner J. L., Crosthwaite L. P., Beck S. C., 2001, AJ, 121, 740
- Meier et al. (2008) Meier D. S., Turner J. L., Hurt R. L., 2008, ApJ, 675, 281
- Meier et al. (2014) Meier D. S., Turner J. L., Beck S. C., 2014, ApJ, 795, 107
- Milam et al. (2005) Milam S. N., Savage C., Brewster M. A., Ziurys L. M., Wyckoff S., 2005, ApJ, 634, 1126
- Muraoka et al. (2016) Muraoka K., et al., 2016, PASJ, 68, 89
- Murphy et al. (2011) Murphy E. J., et al., 2011, ApJ, 737, 67
- Narayanan et al. (2011) Narayanan D., Krumholz M., Ostriker E. C., Hernquist L., 2011, MNRAS, 418, 664
- Oka et al. (2001) Oka T., Hasegawa T., Sato F., Tsuboi M., Miyazaki A., Sugimoto M., 2001, ApJ, 562, 348
- Paglione et al. (2001) Paglione T. A. D., et al., 2001, ApJS, 135, 183
- Papadopoulos et al. (2012) Papadopoulos P. P., van der Werf P., Xilouris E., Isaak K. G., Gao Y., 2012, ApJ, 751, 10
- Peñaloza et al. (2017) Peñaloza C. H., Clark P. C., Glover S. C. O., Shetty R., Klessen R. S., 2017, MNRAS, 465, 2277
- Pety et al. (2013) Pety J., et al., 2013, ApJ, 779, 43
- Pineda et al. (2008) Pineda J. E., Caselli P., Goodman A. A., 2008, ApJ, 679, 481
- Roman-Duval et al. (2016) Roman-Duval J., Heyer M., Brunt C. M., Clark P., Klessen R., Shetty R., 2016, ApJ, 818, 144
- Romano et al. (2017) Romano D., Matteucci F., Zhang Z.-Y., Papadopoulos P. P., Ivison R. J., 2017, MNRAS, 470, 401
- Saintonge et al. (2012) Saintonge A., et al., 2012, ApJ, 758, 73
- Sakamoto et al. (1997) Sakamoto S., Handa T., Sofue Y., Honma M., Sorai K., 1997, ApJ, 475, 134
- Sandstrom et al. (2013) Sandstrom K. M., et al., 2013, ApJ, 777, 5
- Schinnerer et al. (2013) Schinnerer E., et al., 2013, ApJ, 779, 42
- Scoville & Solomon (1974) Scoville N. Z., Solomon P. M., 1974, ApJ, 187, L67
- Sheffer et al. (2008) Sheffer Y., Rogers M., Federman S. R., Abel N. P., Gredel R., Lambert D. L., Shaw G., 2008, ApJ, 687, 1075
- Shetty et al. (2011) Shetty R., Glover S. C., Dullemond C. P., Ostriker E. C., Harris A. I., Klessen R. S., 2011, MNRAS, 415, 3253
- Shetty et al. (2014) Shetty R., Clark P. C., Klessen R. S., 2014, MNRAS, 442, 2208
- Shirley (2015) Shirley Y. L., 2015, PASP, 127, 299
- Sliwa et al. (2017a) Sliwa K., Wilson C. D., Matsushita S., Peck A. B., Petitpas G. R., Saito T., Yun M., 2017a, ApJ, 840, 8
- Sliwa et al. (2017b) Sliwa K., Wilson C. D., Aalto S., Privon G. C., 2017b, ApJ, 840, L11
- Solomon & Sage (1988) Solomon P. M., Sage L. J., 1988, ApJ, 334, 613
- Sternberg et al. (2014) Sternberg A., Le Petit F., Roueff E., Le Bourlot J., 2014, ApJ, 790, 10
- Szűcs et al. (2014) Szűcs L., Glover S. C. O., Klessen R. S., 2014, MNRAS, 445, 4055
- Szűcs et al. (2016) Szűcs L., Glover S. C. O., Klessen R. S., 2016, MNRAS, 460, 82
- Tan et al. (2011) Tan Q.-H., Gao Y., Zhang Z.-Y., Xia X.-Y., 2011, Research in Astronomy and Astrophysics, 11, 787
- Tielens & Hollenbach (1985) Tielens A. G. G. M., Hollenbach D., 1985, ApJ, 291, 722
- Tosaki et al. (2002) Tosaki T., Hasegawa T., Shioya Y., Kuno N., Matsushita S., 2002, PASJ, 54, 209
- Vila-Vilaro et al. (2015) Vila-Vilaro B., Cepa J., Zabludoff A., 2015, ApJS, 218, 28
- Visser et al. (2009) Visser R., van Dishoeck E. F., Black J. H., 2009, A&A, 503, 323
- Walsh et al. (2002) Walsh W., Beck R., Thuma G., Weiss A., Wielebinski R., Dumke M., 2002, A&A, 388, 7
- Wang et al. (2009) Wang M., Chin Y.-N., Henkel C., Whiteoak J. B., Cunningham M., 2009, ApJ, 690, 580
- Wilson & Rood (1994) Wilson T. L., Rood R., 1994, ARA&A, 32, 191
- Wilson et al. (1997) Wilson C. D., Walker C. E., Thornley M. D., 1997, ApJ, 483, 210
- Wilson et al. (2012) Wilson T. L., Rohlfs K., Huttemeister S., 2012, Tools of Radio Astronomy, 5th edition
- Wolfire et al. (2010) Wolfire M. G., Hollenbach D., McKee C. F., 2010, ApJ, 716, 1191
- Wong et al. (2008) Wong T., et al., 2008, MNRAS, 386, 1069
- Wu et al. (2017) Wu Y.-L., Sakamoto K., Pan H.-A., 2017, ApJ, 839, 6
- Young & Sanders (1986) Young J. S., Sanders D. B., 1986, ApJ, 302, 680
- Zhu et al. (2009) Zhu M., Papadopoulos P. P., Xilouris E. M., Kuno N., Lisenfeld U., 2009, ApJ, 706, 941
- de Vaucouleurs & Pence (1978) de Vaucouleurs G., Pence W. D., 1978, AJ, 83, 1163
- van Dishoeck & Black (1988) van Dishoeck E. F., Black J. H., 1988, ApJ, 334, 771
- van Dishoeck et al. (1992) van Dishoeck E. F., Glassgold A. E., Guelin M., Jaffe D. T., Neufeld D. A., Tielens A. G. G. M., Walmsley C. M., 1992, in Singh P. D., ed., IAU Symposium Vol. 150, Astrochemistry of Cosmic Phenomena. p. 285
- van der Tak et al. (2007) van der Tak F. F. S., Black J. H., Schöier F. L., Jansen D. J., van Dishoeck E. F., 2007, A&A, 468, 627
Appendix A EMPIRE 13CO(1-0) observations and radial profiles
This Appendix presents an atlas of the dust continuum at 70 m, 13CO(1-0) emission, and in the EMPIRE galaxies, as well as radial profiles and stacked spectra of CO lines for each galaxy.
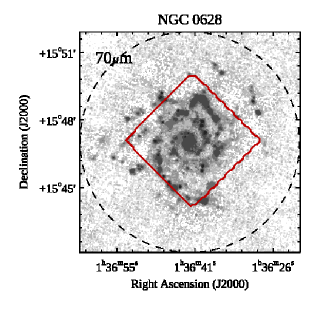
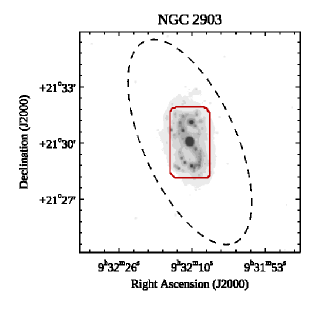
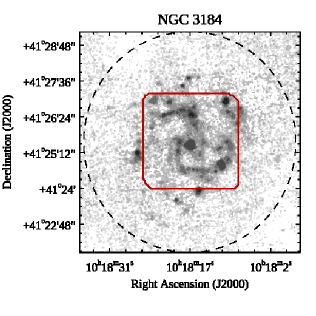
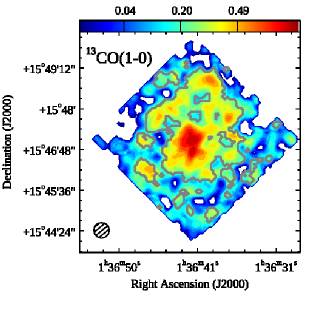
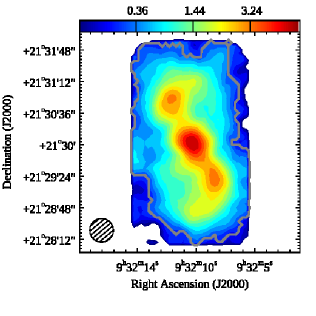
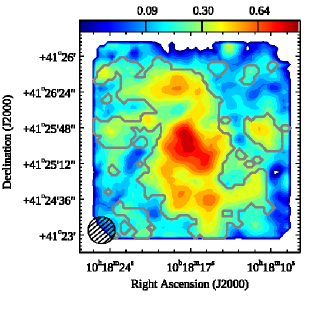
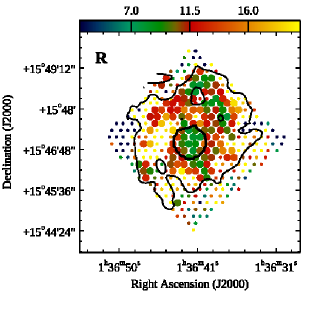
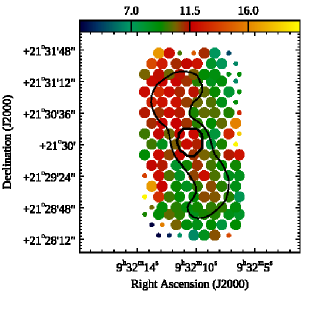
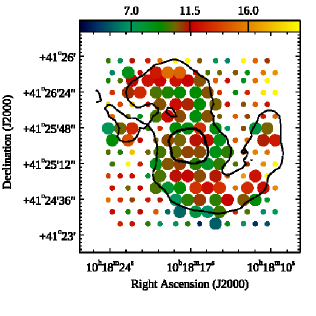
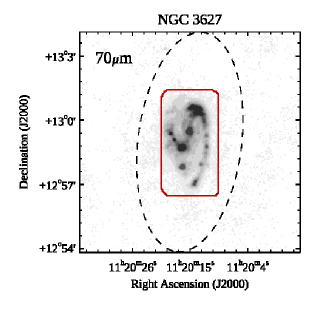
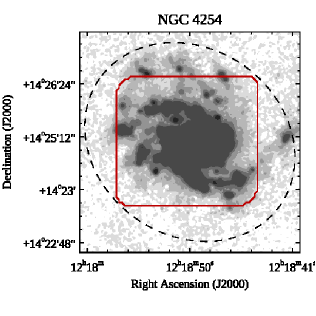
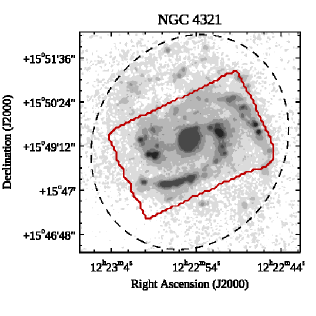
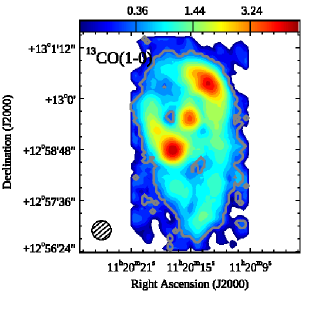
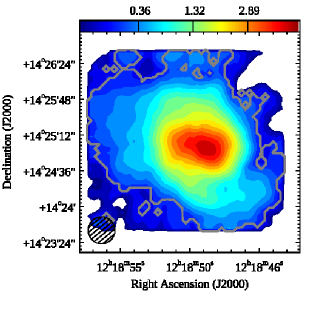
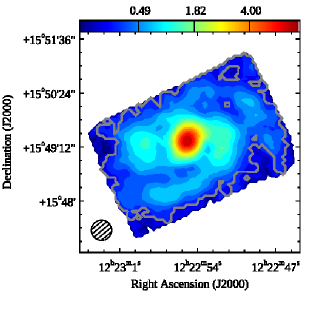
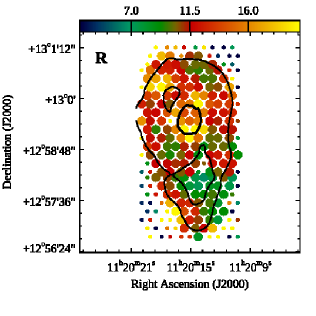
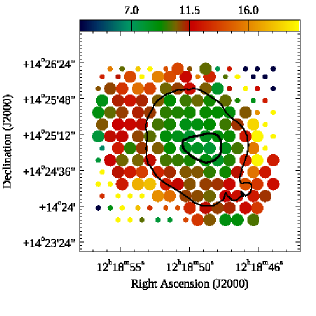
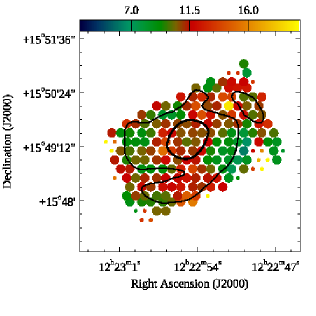
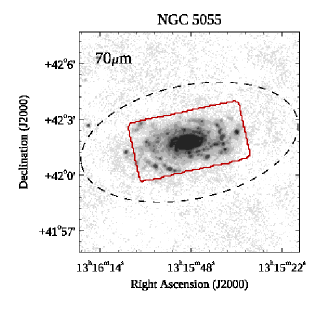
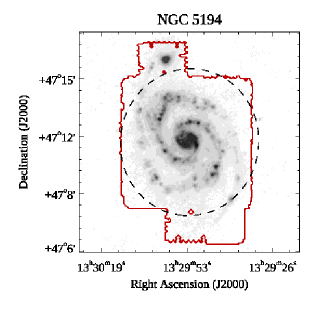
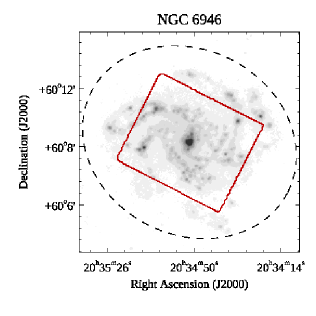
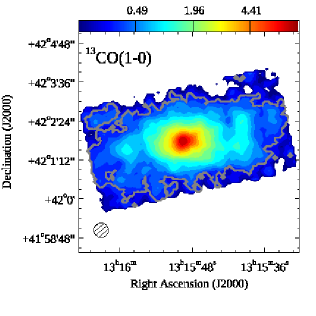
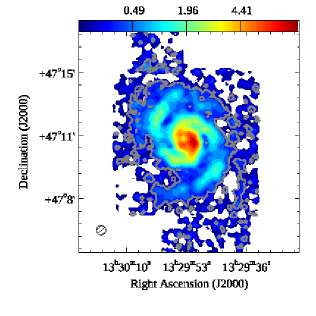
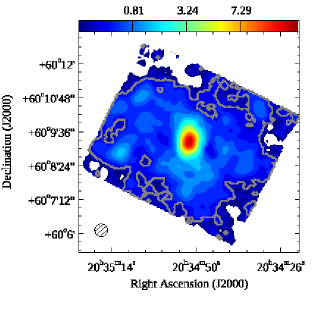
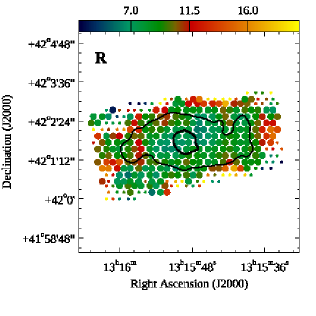
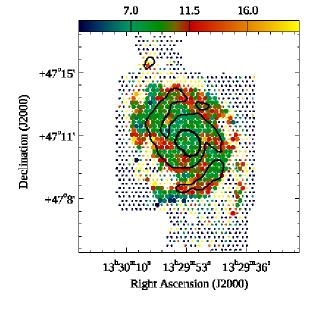
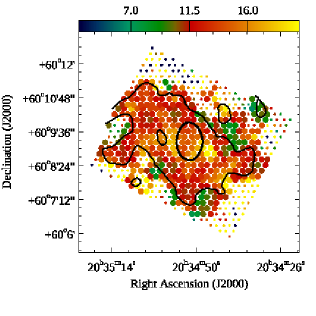
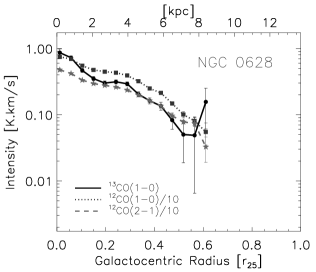
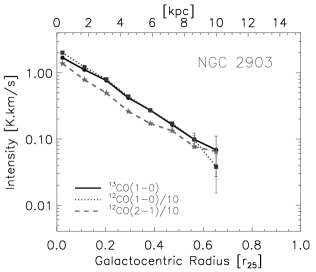
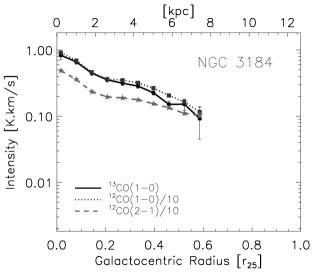
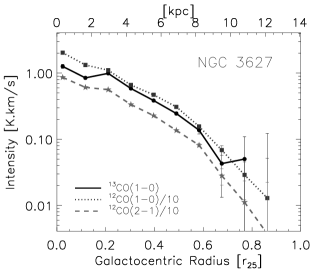
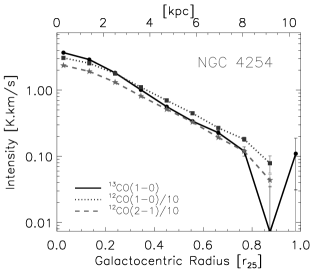
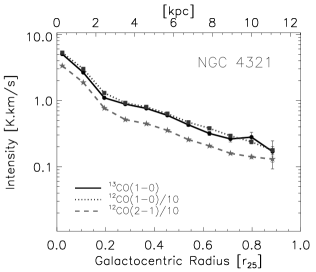
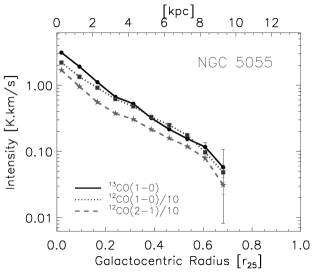
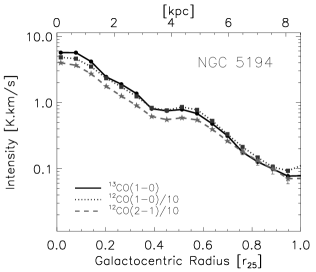
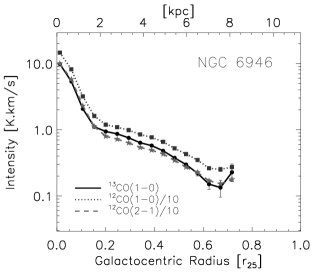
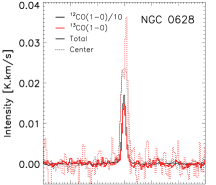
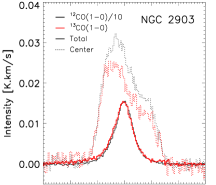
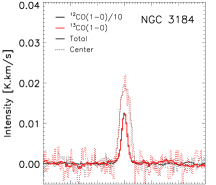
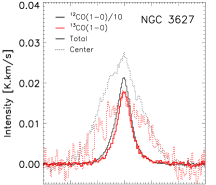
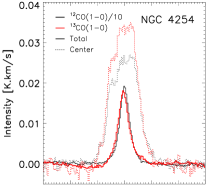
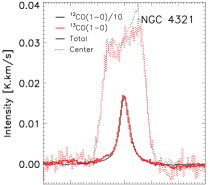
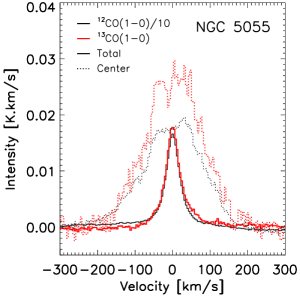
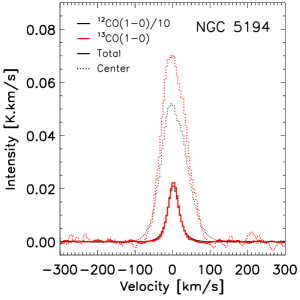
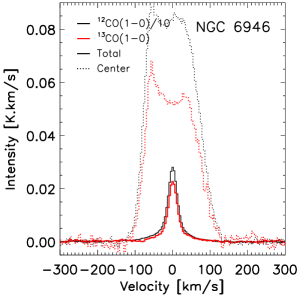
Appendix B Monte-Carlo test of ratio variations
We perform two Monte-Carlo tests regarding the ratios CO(2-1)/CO(1-0), (SFR)/CO(1-0), and 1/.
CO(2-1)/CO(1-0) and 1/: For the first test, we aim to understand whether there are real physical variations in the line ratios or whether the scatter in line ratio values can be explained by noise only. The distribution of lines ratios using noisy data is non-Gaussian even if the noise on the line measurements is Gaussian. Here we are not interested in the exact shape of the distribution of the line ratios but rather whether the observed range could be driven by the uncertainties on the line measurements. To this end we compare the line ratio distribution with Monte-Carlo simulations as follows. We consider the observed 12CO(1-0) intensities as true values and generate new 13CO(1-0) and 12CO(2-1) intensities considering fixed line ratios with 12CO(1-0) and adding noise based on the observed uncertainties of each measurement. The value of the fixed line ratio is set to the median of the observed ratios, though this value does not really matter for this experiment. We iterate this process 1 000 times, and, for each iteration, we calculate the standard deviation of the simulated line ratios. For both and CO(2-1)/CO(1-0), we find that the peak of the distribution of those standard deviations is systematically lower by a factor of 2 compared to the standard deviation of the observed line ratios. The peak is closer to the observed value only for in NGC 3184. Hence we conclude that the scatter in the observed and CO(2-1)/CO(1-0) ratios is largely physical.
For the second test, we aim to verify the robustness of the correlation coefficients measured in Fig. 4a. For this, we generate new 13CO(1-0), 12CO(1-0), and 12CO(2-1) intensities by taking the observed intensities and adding noise based on the observed uncertainties of each measurement. We also iterate the process 1 000 times. We find that the peak of the distribution of standard deviations is slightly larger than the standard deviation of the observed ratios because of the noise added by the simulations. For each iteration, we measure the correlation coefficient and slope between and CO(2-1)/CO(1-0). We find that the distribution of the correlation coefficients is well peaked around the coefficient measured on the observations. This indicates that the correlations persist after adding noise. The distribution of the slopes generally peaks around and it is less well peaked, probably because the dynamic range in the ratios is not very large.
(SFR)/CO(1-0) and 1/: The same two tests as described above are performed for (SFR)/CO(1-0) instead of CO(2-1)/CO(1-0). Here, we find for all galaxies that the peak of the distribution of the standard deviations in the simulated (SFR)/CO(1-0) values is systematically lower by a factor of 2 compared to the observed standard deviation. Hence the scatter in the observed (SFR)/CO(1-0) values is physical.
The second test indicates that the correlation coefficients and slope values between and (SFR)/CO(1-0) reported in Fig. 4d are also robust. The distribution of the slopes is more peaked than with CO(2-1)/CO(1-0).