Multiwavelength characterisation of the accreting millisecond X-ray pulsar and ultra-compact binary IGR J17062–6143
Abstract
IGR J17062–6143 is an ultra-compact X-ray binary (UCXB) with an orbital period of 37.96 min. It harbours a millisecond X-ray pulsar that is spinning at 163 Hz and and has continuously been accreting from its companion star since 2006. Determining the composition of the accreted matter in UCXBs is of high interest for studies of binary evolution and thermonuclear burning on the surface of neutron stars. Here, we present a multi-wavelength study of IGR J17062–6143 aimed to determine the detailed properties of its accretion disc and companion star. The multi-epoch photometric UV to near-infrared spectral energy distribution (SED) is consistent with an accretion disc . The SED modelling of the accretion disc allowed us to estimate an outer disc radius of cm and a mass-transfer rate of M⊙ yr-1. Comparing this with the estimated mass-accretion rate inferred from its X-ray emission suggests that 90% of the transferred mass is lost from the system. Moreover, our SED modelling shows that the thermal emission component seen in the X-ray spectrum is highly unlikely from the accretion disc and must therefore represent emission from the surface of the neutron star. Our low-resolution optical spectrum revealed a blue continuum and no emission lines, i.e. lacking H and He features. Based on the current data we cannot conclusively identify the nature of the companion star, but we make recommendations for future study that can distinguish between the different possible evolution histories of this X-ray binary. Finally, we demonstrate how multiwavelength observations can be effectively used to find more UCXBs among the LMXBs.
keywords:
accretion, accretion discs – stars: neutron – X-rays: binaries – X-rays: individual: IGR J17062–61431 Introduction
IGR J17062–6143 is a weak X-ray source that was discovered by Integral in 2006. Only years later, it was identified as an accreting neutron star (NS) low-mass X-ray binary (LMXB) when a thermonuclear burst was detected with Swift in 2012 (Degenaar et al., 2012). Since its discovery, the source seems to have been persistently accreting at a low luminosity of (Remillard & Levine, 2008; Degenaar et al., 2012; Degenaar et al., 2017), and two energetic, long thermonuclear X-ray bursts have been detected (in 2012 and 2015; Degenaar et al., 2013; Keek et al., 2017).
A detailed study of the X-ray spectrum of IGR J17062–6143 revealed a broad Fe-K emission line near keV. Modeling this feature as X-rays reflecting off the accretion disc (Fabian & Ross, 2010), suggests that the inner edge of the disc is truncated at km () from the neutron star (Degenaar et al., 2017; van den Eijnden et al., 2018). This contrasts with LMXBs accreting at higher rates, where the inner disc typically resides a factor closer to the compact primary (e.g. Cackett et al., 2010; Ludlam et al., 2017, for sample studies). The truncation is likely a direct effect of the low accretion rate, e.g. resulting from the formation of a radiatively-inefficient accretion flow. Alternatively, the magnetosphere of the neutron star may push the accretion disc out (Degenaar et al., 2017). At the low accretion rate inferred for IGR J17062–6143, this would require a magnetic field strength of G (van den Eijnden et al., 2018).
A single archival 1.2 ks RXTE observation revealed coherent X-ray pulsations at a frequency of 163.65 Hz (Strohmayer & Keek, 2017), suggesting that IGR J17062–6143 is an accreting millisecond X-ray pulsar (AMXP). The AMXPs form a sub-class of LMXBs in which the neutron star is able to channel plasma from the accretion disc along its magnetic field lines onto its magnetic poles (e.g. Wijnands & van der Klis, 1998). The presence of X-ray pulsations was confirmed with new data from NICER, and suggests that the neutron star has a magnetic field strength of G (Strohmayer et al., 2018). This is similar to that of other AMXPs (e.g. SAX J1808-359; Mukherjee et al., 2015), and consistent with the inner disc radius measurement from X-ray reflection modeling (Degenaar et al., 2017; van den Eijnden et al., 2018).
Timing of the X-ray pulsations allowed to measure an orbital period of 37.96 min (Strohmayer et al., 2018). LMXBs with such short orbital periods are referred to as ultra-compact X-ray binaries (UCXBs) and can only harbour H-poor donor stars (e.g. Nelson et al., 1986; Nelemans & Jonker, 2010). Based on its sustained low accretion rate, which is easier to achieve if the accretion disc is small (e.g. Tsugawa & Osaki, 1997; in’t Zand et al., 2007; Hameury & Lasota, 2016), and the enhanced oxygen abundance inferred from high-resolution X-ray spectral modeling, it was previously hypothesized that IGR J17062–6143 could be an UCXB (van den Eijnden et al., 2018). UCXBs are a particularly intersting sub-population of LMXBs that are expected to be promising targets for future gravitational wave interferometry experiments (e.g. Nelemans, 2003). Furthermore, UCXBs are interesting laboratories to study the ashes of stellar nuclear burning (e.g. Deloye & Bildsten, 2003), and binary evolution models (e.g. Nelemans et al., 2010), as well as models of thermonuclear burning on the surface of neutron stars (e.g. Cumming, 2003; Cumming et al., 2006).
In this work, we present a multi-wavelength study of IGR J17062–6143. In Section 2, we present observations from X-ray to near-IR (NIR). In Section 3 we construct an average SED and present our optical spectrum, which we use to constrain the properties of the accretion disc and donor star. In Section 4, we discuss the implications for the evolutionary history of IGR J17062–6143, and for thermonuclear burning models, and demonstrate that multi-wavelength observing campaigns can effectively be used to find new candidate UCXBs among the LMXB population.
2 Observations
2.1 Faulkes Optical photometry
We observed the field of IGR J17062–6143 with the 2-m robotic Faulkes Telescope South (FTS), at Siding Spring, Australia, on 2016 October 4 and 2016 October 6. On both dates, 300-sec exposures were made in three filters; Sloan Digital Sky Survey (SDSS) , and -bands. FTS was equipped with a camera with a pixel scale of 0.304 arcsec pixel-1 and a field of view of arcmin. The images were de-biased and flat-fielded using the automatic Las Cumbres Observatory (LCO) pipeline banzai. The seeing as measured from the images was 2.8′′ and 1.9′′ on 4 and 6 October, respectively.
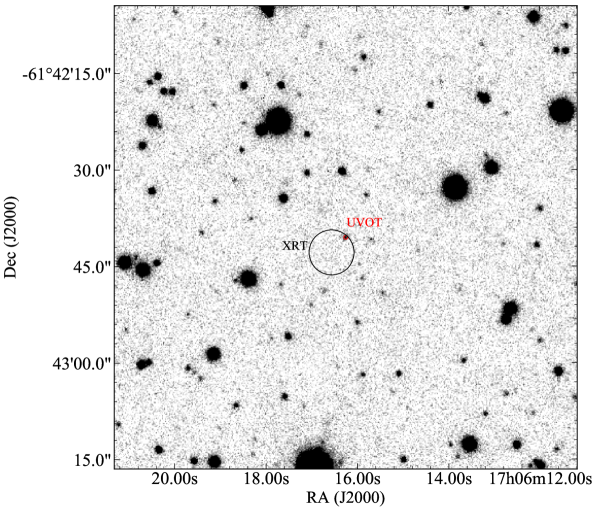
We detected a faint source consistent with the position of IGR J17062–6143 in all images. The spatial resolution in the FTS images is too poor to separate out the faint nearby source detected in our Magellan NIR images, but this object likely has a negligible contribution to our optical images (see Section 2.3). The optical counterpart is bluer than the surrounding field stars (shown in the bottom panel of Fig. 1), which is consistent with emission from an accretion disc. Photometry was carried out using PHOT in IRAF111http://iraf.noao.edu/. Flux calibration was achieved using the known , and magnitudes of four stars in the field of view tabulated in the AAVSO Photometric All-Sky Survey (APASS; Henden et al., 2009). The resulting magnitudes are given in Table 1. The errors include the 1 uncertainty in the comparison star magnitudes, which are small; the error is dominated by the S/N of the X-ray binary.
2.2 Swift UV photometry
IGR J17062–6143 has been observed multiple times with Swift since its discovery in 2006, which provides a rich photometric optical and UV characterisation of the system. We downloaded all the available calibrated UVOT data files from the Swift Data Centre and performed aperture photometry using uvotsource (as implemented in HEASOFT v6.18) using a 4 arcsec aperture for the target source and an 11 arcsec aperture for the background region. Although the full data set includes measurements during two type-I X-ray bursts (Degenaar et al., 2013; Keek et al., 2017), we have excluded them for the analysis in the following sections. We present the average fluxes in every UVOT filter in Table 1, where the quoted errors reflect the r.m.s. The individual measurements are shown in Table 2.
2.3 Magellan NIR photometry
We obtained near-infrared (NIR) photometry with the FourStar camera (Persson et al., 2013) at the 6.5m Baade Magellan Telescope in Cerro las Campanas, Chile. The images were taken in two observing campaigns, 2013 June 16 and 2014 May 8. We observed the source in three filters , and ; the details of the individual observations are presented in Table 1. The telescope was nodded in a AB-AB mode, in order to optimise sky subtraction. The iraf/fsred package (provided by Andy Monson) was used to de-bias, flat-field, align, and co-add the FourStar observations for each object and filter. Aperture photometry was performed using 2MASS sources to determine the zero-point.
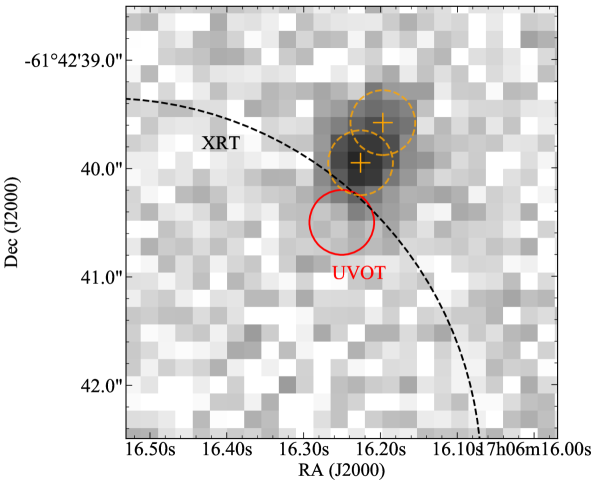
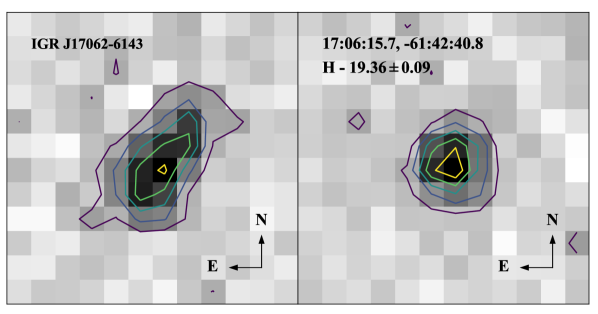
We clearly detect a source at the position of IGR J17062–6143 in all three filters, as shown in the NIR finding chart in Fig. 1. The high quality of the NIR images, with a measured seeing of arcsec, and a smaller pixel scale (0.159" pixel-1) revealed a fainter source blended in the north-west direction as shown in Fig. 2. We performed PSF photometry using daophot to extract the individual measurements, given in Table 1. The centroid for brightest, Southern source is 17:06:16.226(16), -61:42:39.95(23) and for the fainter Northern source is 17:06:16.197(22), -61:42:39.58(29). The errors on the positions represent the 90% upper bound statistical uncertainty on the centroid for all stars detected at a similar magnitude. We also note a " rms uncertainty for astrometric solution over the entire field. The latter are explicitly shown in the middle and bottom panels of Fig. 1.
The brighter NIR source is more consistent with the position of the blue optical counterpart detected in our Faulkes images, and also with its Swift/UVOT coordinates. We therefore identify the brighter NIR source as the counterpart to IGR J17062–6143. The fainter source has 2MASS colours and (magnitudes in Table 1 are shown in AB system)222In the 2MASS photometric system, this fainter source , and , consistent with a late-M star. Our photometric method minimises the contribution in the NIR and given the colours of this source, the contribution in the optical and UV bands is negligible.

| Facility | Filter | Date | Exposure | Magnitude | ||||
| Å | UTC | s | AB mag | |||||
| Swift | UVW2 | 1928 | 20.10 0.05 | |||||
| UVM2 | 2246 | see | see | 20.40 0.15 | ||||
| UVW1 | 2600 | Appendix | Appendix | 20.03 0.08 | ||||
| U | 3465 | § A | § A | 19.85 0.39 | ||||
| B | 4349 | 20.30 1.69 | ||||||
| Faulkes | g’ | 4770 | 2016-10-04 | 300 | 20.23 0.16 | |||
| 2016-10-06 | 300 | 20.29 0.13 | ||||||
| r’ | 6231 | 2016-10-04 | 300 | 20.30 0.17 | ||||
| 2016-10-06 | 300 | 20.12 0.10 | ||||||
| i’ | 7625 | 2016-10-04 | 300 | 20.37 0.19 | ||||
| 2016-10-06 | 300 | 20.05 0.12 | ||||||
| Magellan | J | 12350 | 2013-06-16 | 87 | 20.54 0.08 | |||
| IGR J17062–6143 | 2014-05-17 | 306 | 20.84 0.04 | |||||
| H | 16620 | 2013-06-16 | 306 | 20.63 0.08 | ||||
| 2014-05-17 | 157 | 20.44 0.05 | ||||||
| Ks | 21590 | 2013-06-16 | 218 | 20.98 0.11 | ||||
| 2014-05-17 | 157 | 20.78 0.10 | ||||||
| Magellan | J | 12350 | 2014-05-17 | 87 | 23.39 0.18 | |||
| Fainter source | H | 16620 | 2014-05-17 | 306 | 22.96 0.44 | |||
| Ks | 21590 | 2014-05-17 | 218 | 22.93 0.39 |
2.4 Swift X-ray spectroscopy
We extracted all available Swift/XRT spectra of IGR J17062–6143 between the NIR and optical observations to obtain a long-term X-ray light curve of the source. We used the Swift/XRT Online Data Products Generator333See http://www.swift.ac.uk/user_objects/index.php (Evans et al., 2009) to extract WT-mode and PC-mode spectra from in total epochs. To each spectrum, we fitted a simple absorbed blackbody plus power law model [tbabs*(bbodyrad+powerlaw)] in xspec v12.9.0 (Arnaud, 1996) and calculated the unabsorbed flux in the – keV range. We assumed an absorbing hydrogen column density of (Degenaar et al., 2017).
In Figure 3 we show the long-term light curve, where the Eddington ratio was calculated assuming the empirical Eddington luminosity of erg s-1 (Kuulkers et al., 2003), a distance of kpc (Keek et al., 2017), and a bolometric correction factor of 2 to convert from keV to bolometric fluxes (e.g. in’t Zand et al., 2007; Galloway et al., 2008). It can be seen that the X-ray luminosity varied in a range of over the past decade.

2.5 Gemini optical spectroscopy
We obtained long-slit spectroscopic observations of IGR J17062–6143 with the Gemini Multi-Object Spectrograph (GMOS) at the 8m Gemini South telescope under a Fast Turnaround program (GS-2016A-FT-24) on 2016 September 27. The GMOS instrument uses the Hamamatsu CCD ( pixels). Six spectra of 900s, three centred at 570 nm and three at 580 nm to avoid the chip gaps, were taken using the the B150 grating (150 l/mm), a slit width of and a binning. The GG455_G0329 blocking filter was also used in order to avoid second order overlap. The chosen set-up resulted in the spectral coverage of the Å wavelength range and a spectral resolution of 3 Å. The seeing during the observation was . A CuAr lamp was also observed for each configuration in order to perform the wavelength calibration.
Spectra were reduced using the iraf-gemini package. The flux calibration of each spectrum was executed using observations of a standard star, also taken as part of the program and the errors propagated through the gemini pipeline. Finally, in order to increase the signal-to-noise (S/N), the six spectra were combined to obtain a final spectrum with a S/N of at 6500 Å and 7500 Å, and at 8500 Å. The final spectrum was cut to keep the spectral region between 5000 and 9000 Å, as shown in Fig. 4. The bluest part of the spectrum was removed as the filter lowered the response at those wavelengths. On the other side, the reddest part was cut out because the atmospheric absorption becomes too significant and distorts the slope of the continuum. A few features were left in the final spectrum, marked as crosses in Fig. 4. We checked the individual spectra before combining in order to asses the validity of every singular feature. Most of them were tracked to bad background subtraction and cosmic ray removal. We only find the Na i doublet 5889, 5895 Å to be present in all six spectra. Given the intrinsic variability of the object and non-simultaneity of the observations (see Section 3.2), we did not attempt to use the Faulkes photometry to perform a correction on the flux calibration.
3 Results
3.1 A featureless optical spectrum
The optical spectrum of IGR J17062–6143, displayed in Fig. 4, shows a blue continuum with no emission line features. We only identify one absorption feature, due to interstellar extinction of Na i doublet 5889, 5895 Å. We find a feature around 7816 Å, which is coincident with a known He i line. However, after looking at the individual data (only three of the six had information in this region since it lies on the detector gap for the others), we find that the feature is an instrumental artefact.
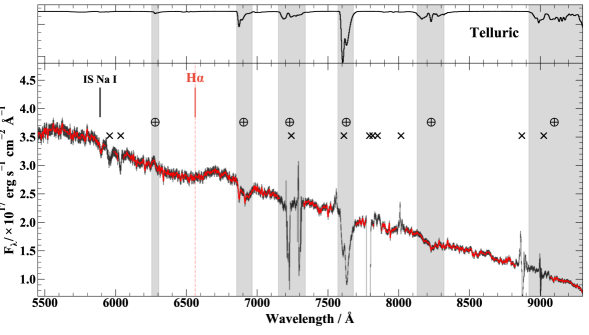
The optical spectra of LMXBs are typically dominated by that of the irradiated accretion disc, showing a blue continuum with strong Balmer, Heii and Bowen emission features (see e.g. Charles & Coe, 2006). Occasionally, LMXBs can show broad absorption features when actively accreting (see e.g. Cornelisse et al., 2009). However, studies of confirmed and candidate UCXBs have revealed similarly featureless optical spectra as we see for IGR J17062–6143 (e.g. Nelemans et al., 2004; Nelemans et al., 2006a). Whereas the optical spectra of white dwarf analogues of UCXBs (so-called AM CVns) show rich line spectra, detecting emission lines of He, C, N, and O, in optical spectra of UCXBs appears to be only achievable when high signal to noise data is available (e.g. Nelemans et al., 2004).
3.2 Spectral energy distribution
We used our multi-wavelength data to construct the SED of IGR J17062–6143. The broadband SED of IGR J17062–6143 is shown in Fig. 5. We fit the UV to NIR data to a phenomenological extincted power-law model of the form . We used as our goodness-of-fit parameter and the 1 confidence intervals were obtained by scaling the errors so . Based on the hydrogen column density inferred from analysing X-ray spectral data, (Degenaar et al., 2017) and consistent with the line of sight extinction, we apply a reddening of E(B-V) (Willingale et al., 2013). We then obtain a power-law index , consistent with the plateau formed by a steady-state accretion disc (Lynden-Bell, 1969; Frank et al., 2002). Moreover, the surface temperature of the donors in UCXBs is expected to be K after they evolve past their period minimum, and then quickly cool to just a few K, for periods min (Deloye et al., 2007). In combination with their small radius (), we expect their emission to contribute 1% in all the UV–NIR range. Combined with the index obtained from our power-law fit to the SED, we therefore assume that the UV-NIR wavelength range is dominated entirely by the accretion disc.
In order to retrieve physical parameters, which are more informative than a simple power law, we have used the model of an irradiated accretion disc as in Chakrabarty (1998, Eq. 10 to 15). This model consists of an optically thick, geometrically thin accretion disc (Shakura & Sunyaev, 1973; Frank et al., 2002), which emission is modified by the central X-ray source. Therefore, the temperature profile is defined by the combination of internal viscous heating and shallow X-ray heating. We have assumed a disc albedo and a canonical mass for the NS of M M⊙. In order to compare the disc model to the available photometry ( and , their associated 1 uncertainties), we applied the reddening of the object to the model spectrum and performed synthetic photometry for every filter in our sample. We have excluded the spectrum from our analysis due to an unreliable absolute flux calibration (see Sec. 2.5).
To derive the best fit parameters, we explored the parameter space by using a MCMC procedure as implemented in emcee (Foreman-Mackey et al., 2013)444http://dan.iel.fm/emcee/current/.. The likelihood function, , that we employed to retrieve the best fit parameters, where the uncertainties are Gaussian and independent, is given by
| (1) |
where model prediction for each filter is and the total variance is defined as . We have added a fractional scatter, , common to the dataset, in order to reflect any intrinsic variability and non-simultaneity of the observations. Also, this added scatter will reflect any contamination arising from the dim star detected at NIR wavelengths (see §2.3). The choice of priors for our MCMC procedure is described below.
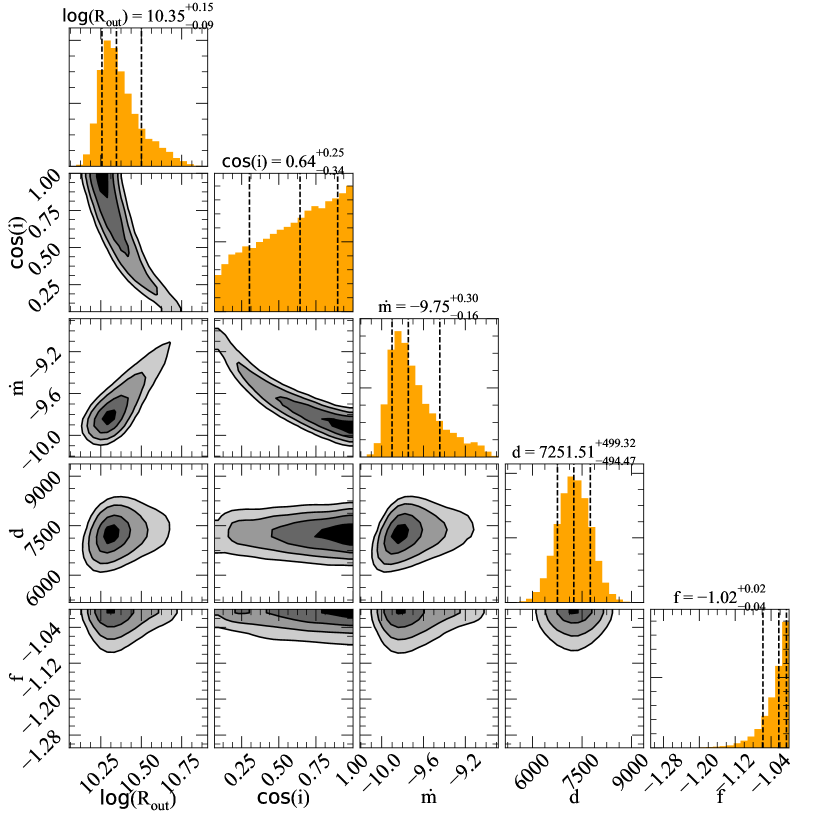
During the energetic 2015 thermonuclear burst, signatures of photospheric radius expansion were observed, which is an indication that the Eddington limit was reached and puts the system at a distance of kpc (Keek et al., 2017). This measurement is likely more accurate than the kpc estimate inferred from the 2012 thermonuclear burst (Degenaar et al., 2013), because the 2015 burst had softer energy coverage near its peak (using MAXI; 2–20 keV) than the 2012 one (using Swift/BAT; 15–50 keV), and should thus provide more reliable constraints on the soft keV black body emission. We therefore used the Keek et al. (2017) measurement and its associated error as a Gaussian prior for the distance. We again use E(B-V)0.135 based on X-ray spectral fitting results (Degenaar et al., 2017) and assuming (typical for the Milky Way; Predehl & Schmitt, 1995). Furthermore, we used an inner disk radius of , based on X-ray reflection analysis (Degenaar et al., 2017; van den Eijnden et al., 2018).555When left as a free fit parameter in our SED modelling, the inner disc radius was poorly constrained, which is not surprising given the lack of information in the far-UV ( Å) region of the spectrum that would be sensitive to the inner disk radius. For the other disc parameters, the outer radius and mass-transfer rate , we assumed log-uniform priors. We also imposed the condition that .
The SED with the best fit is shown in Fig. 5 (joint and marginal posterior distributions are shown in Appendix B). We found the outer radius of the disc to be well constrained cm. The inclination of the system is unconstrained by our fits, but we can infer a 2 upper limit of , consistent with its X-ray spectral properties (Degenaar et al., 2017; van den Eijnden et al., 2018). We obtain a M⊙ yr-1, which suggest a high optical luminosity. This evident discrepancy between the and that inferred from the low X-ray luminosity is discussed in Section 4.
We have included the best X-ray fitting components (bbody+gaussian+powerlaw) to the simultaneous XMM-Newton and NuStar data presented in van den Eijnden et al. (2018) in Fig. 5. Our SED fitting suggests that the thermal component in the X-ray spectrum (bbody) is highly unlikely to be from the disc, and more in line with thermal emission from the NS or boundary layer. This was previously proposed for this and other NSs accreting at low rates based on the inferred temperature and emitting radius of the thermal X-ray emission component (e.g. Armas Padilla et al., 2011; Wijnands et al., 2015; Degenaar et al., 2017), but now for the first time demonstrated very clearly by studying the multi-wavelength SED.

4 Discussion
We have performed a multi-wavelength analysis of the AMXP and UCXB IGR J17062–6143. Our UV to NIR SED can be very well described by a standard accretion disc. From our SED modelling, we measure an outer accretion disc radius of cm and a mass-transfer rate of M⊙ yr-1. Moreover, our SED modelling demonstrates that accretion disc spectrum does not extend into the soft X-rays. This implies that the thermal emission component that is seen in the X-ray spectrum of IGR J17062–6143 and other NS LMXBs accreting at low rates is likely from the surface of the NS, as was previously hypothesised based on X-ray spectral analysis (e.g. Armas Padilla et al., 2013; Degenaar et al., 2017). Furthermore, our low-resolution optical spectrum shows a blue-continuum consistent with an accretion disc, no emission lines of H, He or other elements are observed. In the next sections we discuss the implications of our results.
4.1 The system parameters of IGR J17062–6143
Theoretically, UCXBs can have different types of donor stars; an evolved (i.e. H-deficient) main sequence star, a He star, or a white dwarf (WD). Based on the measured orbital period and mass-accretion rate inferred from X-ray observations, Strohmayer & Keek (2017) favored a He donor for IGR J17062–6143. However, if significant mass loss occurs (i.e. if the mass-accretion rate is very different from the mass-transfer rate), the properties of IGR J17062–6143 can also be consistent with a CO WD donor. The latter scenario was proposed by van den Eijnden et al. (2018) based on an apparent overabundance of O inferred from high-resolution X-ray spectral fitting.
Unfortunately, the lack of H and He features in our optical spectra do not directly constrain the donor type. Firstly, it does not fully rule out the presence of H and He in the accreted material; accretion disc spectral models suggest that He and H fractions up to 10% might remain undetected in optical spectra (Werner et al., 2006). Moreover, depending on the amount of He that the donor burned before overflowing its Roche lobe, He donors may have relatively little He left and the accretion disc spectra of these systems may look similar to those harbouring CO donors (Nelemans et al., 2010).
Understanding the composition of the matter accreted in UCXBs is of great value for understanding the thermonuclear burning of matter accreted onto the surface of NSs. Vice versa, the bursting behaviour can potentially be used to constrain the nature of the companion star (e.g. Cumming, 2003). Both bursts detected from IGR J17062–6143 were of unusually long duration and are indicative of the ignition of a thick layer of He. Such bursts are expected to occur for NSs that accrete He-rich material (e.g. in ’t Zand et al., 2005; Cumming et al., 2006). Another system that displays energetic and long X-ray bursts, 4U 0614+091, was suspected to harbour a CO white dwarf companion based on the lack of H and He features in its optical spectrum (e.g. Nelemans et al., 2004; Nelemans et al., 2006b). However, it was pointed out by Kuulkers et al. (2010) that it is difficult to produce its observed long He bursts if the donor is a CO WD with very little He. One possible solution would be to invoke additional physics, such as spallation (e.g. Bildsten et al., 1992).
The case of 4U 0614+091 shows that the energetics of the thermonuclear X-ray bursts of IGR J17062–6143 do not unambiguously constrain the properties of its companion star. The recurrence time of thermonuclear X-ray burst may also contain information on the composition of the accreted matter. For instance, for the UCXB 4U 1820–30, the recurrence time between its thermonuclear X-ray bursts was used to investigate the evolutionary history of the binary (Cumming, 2003). However, the short thermonuclear X-ray bursts of 4U 1820–30 recur on a much shorter time scale (hours) than the long thermonuclear bursts that are observed for IGR J17062–6143 (estimated to be months; e.g. Degenaar et al., 2010). Indeed, only two bursts have been detected for IGR J17062–6143 and it is plausible that other bursts from these system have been missed. Therefore, we cannot put any meaningful constraints on the recurrence time of the bursts in IGR J17062–6143 and use that to investigate its evolutionary history.
We note that the low X-ray luminosity of IGR J17062–6143 contrasts with the much higher mass-transfer rate from the donor implied by our SED modelling, as well as theoretical predictions for UCXBs (e.g. Sengar et al., 2017). If the X-ray luminosity from the blackbody component is due to accretion onto the NS surface (van den Eijnden et al., 2018), erg s-1, we can obtain an estimate on the mass accretion rate. Assuming a totally efficient conversion of the accretion power into , we find M⊙ yr-1. Comparing this to the mass transfer rate of M⊙ yr-1 inferred form our SED modelling, this would require that the system, in order for mass conservation to hold, ejects % of the in-falling material.
One possible mechanism to reconcile this discrepancy is that the NS magnetosphere is truncating the inner accretion disc and acts as a magnetic propeller that drives an outflow (Illarionov & Sunyaev, 1975). High-resolution X-ray spectral analysis of IGR J17062–6143 showed hints of a wind-like outflow in the form of oxygen-rich absorption and emission features (van den Eijnden et al., 2018). Several other LMXBs, including AMXPs, show (indirect) evidence for highly non-conservative mass transfer (e.g. di Salvo et al., 2008; Ponti et al., 2012; Marino et al., 2017; Tetarenko et al., 2018; Ziółkowski & Zdziarski, 2018).
We conclude that our current multiwavelength data set, and the bursting behaviour of IGR J17062–6143, do not allow us to narrow down the nature of its companion star. However, this can potentially be achieved with additional observations. Nelemans et al. (2010) demonstrated that abundance ratios of N and C provide a strong diagnostic of the formation scenario of UCXBs, and even the mass of the progenitor of the donor star. Furthermore, N/O and O/C ratios can distinguish between a He and WD donor star. Our multiwavelength study and SED modelling show that IGR J17062–6143 is bright in the FUV. Spectral FUV studies have been performed for a handful of (weakly extinct) LMXBs, and resulted in the detection of prominent emission lines of N, C, O, and He, giving valuable insight into the composition of the accreted matter and the evolutionary history of the binary (e.g. Schulz et al., 2001; Haswell et al., 2002; Froning et al., 2011). Obtaining a FUV spectrum of IGR J17062–6143 with HST is therefore expected to provide the opportunity to elucidate the composition of the accreted matter and the nature of the donor star.
4.2 Multi-wavelength studies as a tool to find UCXBs
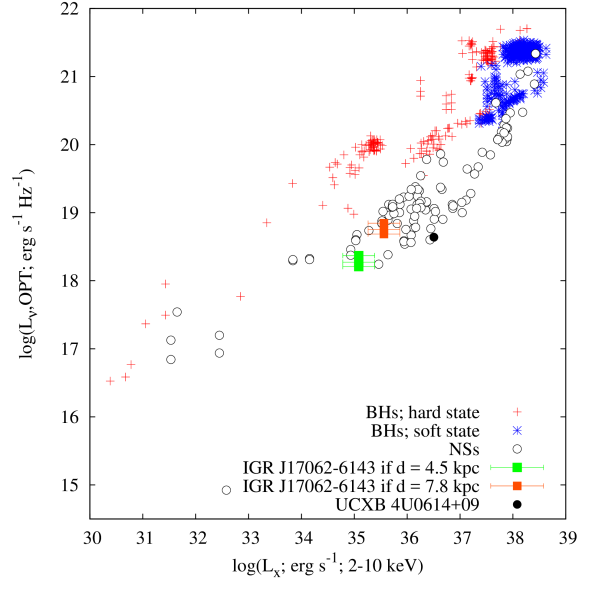
To date, only 2 dozen of UCXBs are known in our Galaxy (e.g. Nelemans & Jonker, 2010). Among the LMXB population, the most promising candidates for identifying new (candidate) UCXBs are the systems that, like IGR J17062–6143, persistently accrete at a very low rate (e.g. in’t Zand et al., 2007; Degenaar et al., 2017); the so-called very-faint X-ray binaries (VFXBs). Therefore, we use our multi-wavelength data set on IGR J17062–6143 to test indirect methods to constrain ; verifying these methods for a system with known parameters could aid in observational campaigns of other VFXBs. Such methods concern the relative contributions of the optical/infrared to X-ray fluxes (van Paradijs & McClintock, 1994; Revnivtsev et al., 2012). As the central X-ray source illuminates the accretion disc, a fraction of the incident energy is reprocessed, modifying the emitted SED. The intrinsic emission of the donor likely does not significantly contribute to the total luminosity.
We have plotted the X-ray/optical luminosities of IGR J17062–6143 against a large sample of BHs and NSs in Fig. 6. As clearly shown, both classes of LMXBs have a different correlation, where BHs are a factor brighter in optical than NS LMXBs (Russell et al., 2006). Taking into account both estimates of the distance, IGR J17062–6143 lies comfortably within the NS track. However, despite its position at the lower end of the NS track, we caution against any inference on the orbital period from the low optical luminosity alone (e.g. van Paradijs & McClintock, 1994). In particular, IGR J17062–6143’s luminosity is similar to other NS LMXBs with widely different orbital periods such as SAX J1808.4-3658 (2.013 hr, Chakrabarty & Morgan, 1998), 4U 1608-52 (12.89 hr, Wachter et al., 2002) and Aql X-1 (18.95 hr, Chevalier & Ilovaisky, 1998).
On the other hand, the empirical relationship developed by Revnivtsev et al. (2012) provides another framework to characterise persistent LMXBs, such as IGR J17062–6143. At NIR wavelengths, the system is assumed to be dominated by the reprocessing of the central X-ray flux in the accretion disc and the secondary star. The use of exclusive persistent NS-sources provides a more homogeneous data set (small variability and mass-dependence) to perform the calibration of this relationship. This method describes the absolute magnitude in the -band (in Vega system) as a function of the orbital period and X-ray luminosity,
| (2) |
where
| (3) |
In order to calculate the luminosity, we used a distance of kpc (Keek et al., 2017), an extinction value of , a correction on the extinction for the band (Rieke & Lebofsky, 1985) and a fixed . We find, for both NIR -band measurements, an orbital period of hr and hr666If we use a value for kpc (Degenaar et al., 2013), we obtain shorter orbital periods hr.. The 1 uncertainties on the orbital periods were calculated via a Monte Carlo simulation.
Alternatively, we can constrain the orbital period by using the size of the accretion disc, measured in our SED modelling. The outer parts of the disc will be heavily affected by the tidal interaction of the companion thus regulating its maximum size (Paczynski, 1977). This tidal radius, , can be approximated by
| (4) |
where is the orbital separation and the mass ratio of the system. On the other hand, the minimum outer disc radius, is determined by the angular momentum of the particles after they exit the inner Lagrangian point. This can be approximated by the following equation (Verbunt & Rappaport, 1988):
| (5) |
valid for . We can find a family of solutions of and as a function of mass ratio given a fixed orbital period, as shown in Fig. 7. Any allowed orbital period of the system should reside, for a given donor mass (assuming a canonical mass for the neutron star M M⊙), between both curves. Despite the large uncertainties associated to the SED modelling, this methodology allows us to confidently exclude systems with P hr (at more than 2) and highly suggestive of a system with P hr since the estimates of the disc are smaller than the minimum radius .

We conclude that the multi-epoch UV, optical and NIR photometry allows us to model the accretion disc and retrieve physical parameters of the binary system, such as the outer disc radius and mass transfer, that point to a system with an orbital period of hr. In addition, we employed empirical relations to estimate an orbital period between 0.3-0.5 hr for IGR J17062–6143. Both techniques thus yield results that are consistent with the directly measured orbital period of 37.96 min from timing the X-ray pulsations. This demonstrates that multi-wavelength observations can effectively be used to search for UCXBs among VFXBs.
Acknowledgements
We thank the referees for valuable comments and suggestions that significantly improved this work. JVHS, ND, and JvE are supported by a Vidi grant awarded to ND by the Netherlands Organization for Scientific Research (NWO). JVHS acknowledges partial support from “NewCompStar", COST Action MP1304 and thanks the IoA, Cambridge for their hospitality during the exchange visit. DA acknowledges support from the Royal Society. RW is supported by an NWO Top grant, module 1. VC is supported by a grant awarded by the Consejo Nacional de Investigaciones Científicas y Técnicas (CONICET), Argentina. We thank Andy Monson for developing and supporting FSRED and for help installing that package. We are grateful to Neil Gehrels and the Swift duty scientists for making ToO observations of IGR J17062–6143 possible. We also thank German Gimeno and the Gemini duty scientists for the observation of IGR J17062–6143 under a FT observing program. The Faulkes Telescopes are maintained and operated by the Las Cumbres Observatory (LCO). We acknowledge the use of public data from the Swift data archive. This research made use of astropy, a community-developed core Python package for Astronomy (Astropy Collaboration et al., 2013), matplotlib (Hunter, J. D., 2007) and aplpy (Robitaille & Bressert, 2012).
References
- Armas Padilla et al. (2011) Armas Padilla M., Degenaar N., Patruno A., Russell D. M., Linares M., Maccarone T. J., Homan J., Wijnands R., 2011, MNRAS, 417, 659
- Armas Padilla et al. (2013) Armas Padilla M., Degenaar N., Wijnands R., 2013, MNRAS, 434, 1586
- Arnaud (1996) Arnaud K. A., 1996, in Jacoby G. H., Barnes J., eds, Astronomical Society of the Pacific Conference Series Vol. 101, Astronomical Data Analysis Software and Systems V. p. 17
- Astropy Collaboration et al. (2013) Astropy Collaboration et al., 2013, A&A, 558, A33
- Bildsten et al. (1992) Bildsten L., Salpeter E. E., Wasserman I., 1992, ApJ, 384, 143
- Cackett et al. (2010) Cackett E. M., et al., 2010, ApJ, 720, 205
- Chakrabarty (1998) Chakrabarty D., 1998, ApJ, 492, 342
- Chakrabarty & Morgan (1998) Chakrabarty D., Morgan E. H., 1998, Nature, 394, 346
- Charles & Coe (2006) Charles P. A., Coe M. J., 2006, Optical, ultraviolet and infrared observations of X-ray binaries. pp 215–265
- Chevalier & Ilovaisky (1998) Chevalier C., Ilovaisky S. A., 1998, IAU Circ., 6806
- Cornelisse et al. (2009) Cornelisse R., et al., 2009, A&A, 495, L1
- Cumming (2003) Cumming A., 2003, ApJ, 595, 1077
- Cumming et al. (2006) Cumming A., Macbeth J., in ’t Zand J., Page D., 2006, ApJ, 646, 429
- Degenaar et al. (2010) Degenaar N., et al., 2010, MNRAS, 404, 1591
- Degenaar et al. (2012) Degenaar N., Altamirano D., Wijnands R., 2012, The Astronomer’s Telegram, 4219
- Degenaar et al. (2013) Degenaar N., Miller J. M., Wijnands R., Altamirano D., Fabian A. C., 2013, ApJ, 767, L37
- Degenaar et al. (2017) Degenaar N., Pinto C., Miller J. M., Wijnands R., Altamirano D., Paerels F., Fabian A. C., Chakrabarty D., 2017, MNRAS, 464, 398
- Deloye & Bildsten (2003) Deloye C. J., Bildsten L., 2003, ApJ, 598, 1217
- Deloye et al. (2007) Deloye C. J., Taam R. E., Winisdoerffer C., Chabrier G., 2007, in Napiwotzki R., Burleigh M. R., eds, Astronomical Society of the Pacific Conference Series Vol. 372, 15th European Workshop on White Dwarfs. p. 447 (arXiv:astro-ph/0610609)
- Evans et al. (2009) Evans P. A., et al., 2009, MNRAS, 397, 1177
- Fabian & Ross (2010) Fabian A. C., Ross R. R., 2010, Space Sci. Rev., 157, 167
- Foreman-Mackey (2016) Foreman-Mackey D., 2016, The Journal of Open Source Software, 24
- Foreman-Mackey et al. (2013) Foreman-Mackey D., Hogg D. W., Lang D., Goodman J., 2013, PASP, 125, 306
- Frank et al. (2002) Frank J., King A., Raine D. J., 2002, Accretion Power in Astrophysics: Third Edition
- Froning et al. (2011) Froning C., et al., 2011, ApJ, 743, 26
- Galloway et al. (2008) Galloway D. K., Muno M. P., Hartman J. M., Psaltis D., Chakrabarty D., 2008, ApJS, 179, 360
- Hameury & Lasota (2016) Hameury J.-M., Lasota J.-P., 2016, A&A, 594, A87
- Haswell et al. (2002) Haswell C., Hynes R., King A., Schenker K., 2002, MNRAS, 332, 928
- Henden et al. (2009) Henden A. A., Welch D. L., Terrell D., Levine S. E., 2009, in American Astronomical Society Meeting Abstracts #214. p. 669
- Hunter, J. D. (2007) Hunter, J. D. 2007, Computing In Science & Engineering, 9, 90
- Illarionov & Sunyaev (1975) Illarionov A. F., Sunyaev R. A., 1975, A&A, 39, 185
- Keek et al. (2017) Keek L., Iwakiri W., Serino M., Ballantyne D. R., in’t Zand J. J. M., Strohmayer T. E., 2017, ApJ, 836, 111
- Kuulkers et al. (2003) Kuulkers E., den Hartog P. R., in’t Zand J. J. M., Verbunt F. W. M., Harris W. E., Cocchi M., 2003, A&A, 399, 663
- Kuulkers et al. (2010) Kuulkers E., et al., 2010, A&A, 514, A65
- Ludlam et al. (2017) Ludlam R. M., et al., 2017, ApJ, 836, 140
- Lynden-Bell (1969) Lynden-Bell D., 1969, Nature, 223, 690
- Marino et al. (2017) Marino A., Di Salvo T., Gambino A. F., Iaria R., Burderi L., Matranga M., Sanna A., Riggio A., 2017, A&A, 603, A137
- Mukherjee et al. (2015) Mukherjee D., Bult P., van der Klis M., Bhattacharya D., 2015, MNRAS, 452, 3994
- Nelemans (2003) Nelemans G., 2003, in Centrella J. M., ed., American Institute of Physics Conference Series Vol. 686, The Astrophysics of Gravitational Wave Sources. pp 263–272 (arXiv:astro-ph/0310800), doi:10.1063/1.1629441
- Nelemans & Jonker (2010) Nelemans G., Jonker P. G., 2010, New Astron. Rev., 54, 87
- Nelemans et al. (2004) Nelemans G., Jonker P. G., Marsh T. R., van der Klis M., 2004, MNRAS, 348, L7
- Nelemans et al. (2006a) Nelemans G., Jonker P. G., Steeghs D., 2006a, MNRAS, 370, 255
- Nelemans et al. (2006b) Nelemans G., Jonker P. G., Steeghs D., 2006b, MNRAS, 370, 255
- Nelemans et al. (2010) Nelemans G., Yungelson L. R., van der Sluys M. V., Tout C. A., 2010, MNRAS, 401, 1347
- Nelson et al. (1986) Nelson L. A., Rappaport S. A., Joss P. C., 1986, ApJ, 304, 231
- Paczynski (1977) Paczynski B., 1977, ApJ, 216, 822
- Persson et al. (2013) Persson S. E., et al., 2013, PASP, 125, 654
- Ponti et al. (2012) Ponti G., Fender R., Begelman M., Dunn R., Neilsen J., Coriat M., 2012, MNRAS, 422, L11
- Predehl & Schmitt (1995) Predehl P., Schmitt J. H. M. M., 1995, A&A, 293, 889
- Remillard & Levine (2008) Remillard R. A., Levine A. M., 2008, The Astronomer’s Telegram, 1853
- Revnivtsev et al. (2012) Revnivtsev M. G., Zolotukhin I. Y., Meshcheryakov A. V., 2012, MNRAS, 421, 2846
- Ricci et al. (2008) Ricci C., Beckmann V., Carmona A., Weidenspointner G., 2008, The Astronomer’s Telegram, 1840
- Rieke & Lebofsky (1985) Rieke G. H., Lebofsky M. J., 1985, ApJ, 288, 618
- Robitaille & Bressert (2012) Robitaille T., Bressert E., 2012, APLpy: Astronomical Plotting Library in Python, Astrophysics Source Code Library
- Russell et al. (2006) Russell D. M., Fender R. P., Hynes R. I., Brocksopp C., Homan J., Jonker P. G., Buxton M. M., 2006, MNRAS, 371, 1334
- Russell et al. (2007) Russell D. M., Fender R. P., Jonker P. G., 2007, MNRAS, 379, 1108
- Schulz et al. (2001) Schulz N. S., Chakrabarty D., Marshall H. L., Canizares C. R., Lee J. C., Houck J., 2001, ApJ, 563, 941
- Sengar et al. (2017) Sengar R., Tauris T. M., Langer N., Istrate A. G., 2017, preprint
- Shakura & Sunyaev (1973) Shakura N. I., Sunyaev R. A., 1973, A&A, 24, 337
- Strohmayer & Keek (2017) Strohmayer T., Keek L., 2017, ApJ, 836, L23
- Strohmayer et al. (2018) Strohmayer T. E., et al., 2018, ApJ, 858, L13
- Tetarenko et al. (2018) Tetarenko B. E., Lasota J.-P., Heinke C. O., Dubus G., Sivakoff G. R., 2018, Nature, 554, 69
- Tsugawa & Osaki (1997) Tsugawa M., Osaki Y., 1997, PASJ, 49, 75
- Verbunt & Rappaport (1988) Verbunt F., Rappaport S., 1988, ApJ, 332, 193
- Wachter et al. (2002) Wachter S., Hoard D. W., Bailyn C. D., Corbel S., Kaaret P., 2002, ApJ, 568, 901
- Werner et al. (2006) Werner K., Nagel T., Rauch T., Hammer N. J., Dreizler S., 2006, A&A, 450, 725
- Wijnands & van der Klis (1998) Wijnands R., van der Klis M., 1998, Nature, 394, 344
- Wijnands et al. (2015) Wijnands R., Degenaar N., Armas Padilla M., Altamirano D., Cavecchi Y., Linares M., Bahramian A., Heinke C. O., 2015, MNRAS, 454, 1371
- Willingale et al. (2013) Willingale R., Starling R. L. C., Beardmore A. P., Tanvir N. R., O’Brien P. T., 2013, MNRAS, 431, 394
- Ziółkowski & Zdziarski (2018) Ziółkowski J., Zdziarski A. A., 2018, MNRAS, 480, 1580
- di Salvo et al. (2008) di Salvo T., Burderi L., Riggio A., Papitto A., Menna M. T., 2008, MNRAS, 389, 1851
- in ’t Zand et al. (2005) in ’t Zand J., Cumming A., van der Sluys M., Verbunt F., Pols O., 2005, A&A, 441, 675
- in’t Zand et al. (2007) in’t Zand J. J. M., Jonker P. G., Markwardt C. B., 2007, A&A, 465, 953
- van Paradijs & McClintock (1994) van Paradijs J., McClintock J. E., 1994, A&A, 290, 133
- van den Eijnden et al. (2018) van den Eijnden J., et al., 2018, MNRAS, 475, 2027
Appendix A Swift photometry
We present in Table 2 all the individual measurements obtained with Swift/UVOT used in the SED modelling in AB mag with the X-ray flux associated for each pointing. Details on the data reduction can be found in Section 2.2 for UVOT and Section 2.4 for XRT.
| Filter | MJD | Exposure Time | Magnitude | [2-10 keV] | |
|---|---|---|---|---|---|
| s | UVOT System | mJy | erg s-1 cm-2 | ||
| UVW2 | 54587.45660 | 277.0 | 19.97 0.12 | 0.037 0.004 | 1.478 0.148 |
| UVW2 | 54588.19469 | 1061.9 | 20.11 0.08 | 0.033 0.002 | 1.268 0.127 |
| UVW2 | 54588.05937 | 283.2 | 20.18 0.13 | 0.031 0.004 | 1.268 0.127 |
| UVW2 | 54592.43834 | 790.6 | 20.15 0.08 | 0.032 0.002 | 2.325 0.232 |
| UVW2 | 54592.33448 | 224.1 | 20.07 0.14 | 0.034 0.004 | 2.325 0.232 |
| UVW2 | 54593.74933 | 1184.3 | 20.13 0.07 | 0.032 0.002 | 1.991 0.199 |
| UVW2 | 54593.61518 | 460.4 | 20.15 0.11 | 0.032 0.003 | 1.991 0.199 |
| UVW2 | 54594.61436 | 2391.6 | 20.08 0.06 | 0.034 0.002 | 1.991 0.199 |
| UVW2 | 54594.27713 | 66.7 | 20.08 0.24 | 0.034 0.007 | 1.991 0.199 |
| UVW2 | 54595.28439 | 3163.7 | 20.08 0.05 | 0.034 0.002 | 1.934 0.193 |
| UVW2 | 54595.01637 | 558.8 | 20.15 0.10 | 0.032 0.003 | 1.157 0.116 |
| UVW2 | 54597.42468 | 4067.9 | 20.11 0.05 | 0.033 0.002 | 1.576 0.158 |
| UVW2 | 54597.02051 | 627.1 | 20.18 0.09 | 0.031 0.003 | 1.576 0.158 |
| UVW2 | 54661.53944 | 6809.6 | 20.03 0.05 | 0.035 0.001 | 1.598 0.160 |
| UVW2 | 54661.33972 | 1021.9 | 20.08 0.07 | 0.034 0.002 | 1.598 0.160 |
| UVM2 | 57624.60002 | 805.1 | 20.72 0.16 | 0.019 0.003 | 0.546 0.055 |
| UVM2 | 57630.18016 | 992.4 | 20.90 0.16 | 0.016 0.002 | 0.306 0.031 |
| UVM2 | 57639.42057 | 1088.9 | 20.40 0.11 | 0.025 0.003 | 0.358 0.036 |
| UVM2 | 57646.85150 | 551.5 | 20.97 0.23 | 0.015 0.003 | 0.323 0.032 |
| UVM2 | 54587.78830 | 82.7 | 20.46 0.37 | 0.024 0.008 | 1.268 0.127 |
| UVM2 | 54588.06322 | 213.8 | 20.12 0.19 | 0.033 0.006 | 1.268 0.127 |
| UVM2 | 54592.33732 | 130.4 | 19.97 0.22 | 0.037 0.008 | 2.325 0.232 |
| UVM2 | 54593.62108 | 294.3 | 19.80 0.14 | 0.044 0.006 | 1.991 0.199 |
| UVM2 | 54594.27809 | 47.5 | 20.91 0.64 | 0.016 0.009 | 1.991 0.199 |
| UVM2 | 54595.02385 | 414.6 | 20.16 0.14 | 0.031 0.004 | 1.157 0.116 |
| UVM2 | 54598.03805 | 833.0 | 19.99 0.09 | 0.037 0.003 | 1.576 0.158 |
| UVW1 | 54587.45231 | 141.5 | 20.04 0.19 | 0.034 0.006 | 1.478 0.148 |
| UVW1 | 54588.05504 | 141.5 | 20.11 0.20 | 0.032 0.006 | 1.268 0.127 |
| UVW1 | 54590.10843 | 437.2 | 19.93 0.12 | 0.038 0.004 | 1.032 0.103 |
| UVW1 | 54590.00866 | 121.8 | 20.44 0.31 | 0.024 0.007 | 1.032 0.103 |
| UVW1 | 54592.14843 | 130.5 | 20.08 0.22 | 0.033 0.007 | 2.325 0.232 |
| UVW1 | 54593.60824 | 230.1 | 19.86 0.14 | 0.041 0.005 | 1.991 0.199 |
| UVW1 | 54594.27599 | 33.2 | 19.93 0.36 | 0.038 0.013 | 1.991 0.199 |
| UVW1 | 54595.00798 | 279.3 | 19.83 0.12 | 0.042 0.005 | 1.157 0.116 |
| U | 54587.45361 | 70.6 | 19.87 0.26 | 0.042 0.010 | 1.478 0.148 |
| U | 54588.05633 | 70.6 | 19.73 0.24 | 0.047 0.010 | 1.268 0.127 |
| U | 54590.00952 | 16.4 | 20.55 1.57 | 0.022 0.032 | 1.032 0.103 |
| U | 54592.33206 | 55.9 | 19.45 0.22 | 0.061 0.012 | 2.325 0.232 |
| U | 54593.61033 | 114.9 | 19.56 0.17 | 0.055 0.009 | 1.991 0.199 |
| U | 54594.27633 | 16.5 | 19.10 0.31 | 0.084 0.024 | 1.991 0.199 |
| U | 54595.01050 | 139.5 | 19.87 0.19 | 0.042 0.007 | 1.157 0.116 |
| U | 54600.41665 | 3073.0 | 19.68 0.05 | 0.050 0.002 | 1.548 0.155 |
| U | 54600.18262 | 339.6 | 19.74 0.15 | 0.047 0.007 | 1.675 0.167 |
| U | 54660.40377 | 993.9 | 19.70 0.07 | 0.049 0.003 | 1.598 0.160 |
| U | 57644.49897 | 1932.3 | 20.38 0.10 | 0.026 0.002 | 0.435 0.044 |
| U | 57644.46425 | 982.6 | 20.57 0.17 | 0.022 0.003 | 0.435 0.044 |
| B | 54587.45449 | 70.6 | 20.04 0.56 | 0.035 0.018 | 1.478 0.148 |
| B | 54588.05722 | 70.6 | 20.73 1.02 | 0.018 0.017 | 1.268 0.127 |
| B | 54592.33277 | 55.9 | 19.36 0.36 | 0.065 0.021 | 2.325 0.232 |
| B | 54593.61173 | 114.9 | 20.15 0.49 | 0.031 0.014 | 1.991 0.199 |
| B | 54594.27658 | 16.5 | 21.72 5.05 | 0.007 0.034 | 1.991 0.199 |
| B | 54595.01220 | 139.5 | 19.80 0.32 | 0.043 0.013 | 1.157 0.116 |
Appendix B SED Posterior distributions
We present the joint and marginal posterior distributions of the accretion disc parameters obtained in the SED fit in Fig. 8 (see Sec. 3.2). We used corner.py (Foreman-Mackey, 2016) to visualise the MCMC chains.