UV-Luminous, Star-Forming Hosts of z2 Reddened Quasars in the Dark Energy Survey
\par\LTX@newpageAbstract
We present the first rest-frame UV population study of 17 heavily reddened, high-luminosity (E(B-V) 0.5; L 1046ergs-1) broad-line quasars at . We combine the first year of deep, optical, ground-based observations from the Dark Energy Survey (DES) with the near infrared VISTA Hemisphere Survey (VHS) and UKIDSS Large Area Survey (ULAS) data, from which the reddened quasars were initially identified. We demonstrate that the significant dust reddening towards the quasar in our sample allows host galaxy emission to be detected at the rest-frame UV wavelengths probed by the DES photometry. By exploiting this reddening effect, we disentangle the quasar emission from that of the host galaxy via spectral energy distribution (SED) fitting. We find evidence for a relatively unobscured, star-forming host galaxy in at least ten quasars, with a further three quasars exhibiting emission consistent with either star formation or scattered light. From the rest-frame UV emission, we derive instantaneous, dust-corrected star formation rates (SFRs) in the range 25 < SFRUV < 365 M⊙yr-1, with an average SFRUV = 130 95 M⊙yr-1. We find a broad correlation between SFRUV and the bolometric quasar luminosity. Overall, our results show evidence for coeval star formation and black hole accretion occurring in luminous, reddened quasars at the peak epoch of galaxy formation.
keywords:
quasars: general – galaxies: evolution – galaxies: star formation – galaxies: high redshift – galaxies: active – ultraviolet: galaxies1 Introduction
Active galactic nuclei (AGN) are thought to govern many fundamental processes within galaxies, from the quenching of their star formation to their morphological evolution. In nearby galaxies, tight correlations have been observed between the central black hole mass (MBH) and several properties of the galactic bulge e.g. bulge mass, Mbulge (magorrian98), bulge luminosity, Lbulge (faber76), the stellar velocity dispersion, , and the stellar mass, M∗ (kormendy13). Furthermore, black hole (BH) accretion and star formation both appear to peak at 2 (e.g. aird15; madau14), indicating a likely link between star formation and AGN activity in galaxies. Some galaxy formation scenarios postulate that the same gas supply can fuel both star formation and accretion onto the BH in massive galaxies (e.g. hopkins08; narayanan10). sanders88, for example, suggest that the most luminous systems evolve from merger-driven starbursts to UV-luminous quasars, appearing heavily obscured during the transition phase, when remnant dust from the decaying starburst is being cleared out of the galaxy. Studying the connection between dust obscuration, BH accretion and star formation in the most luminous quasars is therefore an important test of such galaxy evolution models.
Actively accreting super-massive black holes (SMBHs), or quasars, typically outshine their host galaxies by several orders of magnitude, particularly at rest-frame ultraviolet (UV) wavelengths, where the quasar continuum peaks. For this reason, quasar host galaxy studies in the rest-frame UV and optical require highly spatially-resolved images to separate light from the host galaxy from that of the quasar. This limitation means such studies have largely been confined to low redshifts (z < 1), where good spatial resolution is much easier to achieve (e.g. dunlop03; matsuoka15). At these low redshifts, host galaxy emission has been separated from that of the AGN via both image (e.g. jahnke04; sanchez14) and spectral decomposition (e.g. berk06; matsuoka15), with these studies finding a strong correlation between MBH and Mbulge. However there appears to be no correlation between the quasar accretion rate and star formation rate (SFR) of the host at these low redshifts (e.g. urrutia12).
At higher redshifts (z2) - the epoch at which BH activity peaks - a handful of studies have used high-resolution spaced-based imaging from the Hubble Space Telescope (HST) to spatially isolate the host galaxy emission, although these studies have largely targeted moderate-luminosity quasars (L1043-44ergs-1), where emission from the galaxy makes up a significant fraction of the flux in the rest-frame UV/ optical (e.g. jahnke04). In these moderate-luminosity quasars, jahnke04 find no dependence of the SFR on the quasar luminosity, deriving SFRs 6 M⊙yr-1 (prior to dust correction) across their entire quasar sample. To analyse the hosts of more luminous quasars, studies have primarily relied on observations at longer wavelengths in the far infra-red (FIR) to millimetre regime, where the host galaxy emission peaks (e.g. priddey03; harris16). Unlike their low-redshift and lower-luminosity counterparts, the SFRs of high-luminosity quasars at z 2 have been shown to correlate with Lbol,QSO, with several studies finding more luminous quasars to reside in more actively star-forming hosts (e.g. coppin08; hatziminaoglou10; rosario12; delvecchio15; xu15; harris16).
Several studies have also attempted to probe these luminous, high-redshift quasar hosts in the rest-frame optical to near infra-red (NIR), making use of emission at rest-frame wavelengths of 1m, where the fraction of galaxy-to-quasar emission is larger than in the rest-frame UV (e.g. ridgway01; kukula01). Even in this wavelength regime, however, these studies have typically required high-resolution space-based imaging from HST in order to accurately subtract the quasar point spread function (PSF) from the galaxy emission - a problem which remains challenging (e.g. mechtley16). The majority of these studies find an enhanced merger fraction in populations of high-luminosity quasars, although this conclusion remains disputed (e.g. villforth16).
An alternative approach to observing quasar hosts at optical/ NIR wavelengths is to exploit dust obscuration towards the quasar line-of-sight, which can heavily redden the quasar continuum and enhance the fractional flux contribution of the galaxy at these wavelengths (e.g. urrutia08; urrutia12; glikman15; fan16). This approach has also been used to study quasar hosts in the rest-frame UV, but the rare nature of these heavily-reddened quasars has limited high-redshift studies to individual objects (e.g. cai14). These high-redshift, dust-obscured quasars may provide key insights into the connection between quasars and their hosts, with sanders88 suggesting that a connection between Lbol,QSO and SFR may be more prominent among these dusty systems than among un-obscured quasars.
This paper presents the first rest-frame UV population study of luminous (L1046ergs-1) heavily dust-reddened quasars at , selected from the work of banerji12; banerji15. The heavy dust reddening in our sample (0.5 - 2.0) means the quasar light is obscured in the rest-frame UV, potentially exposing emission from the host galaxy at these wavelengths. However, at even the most UV-bright star-forming galaxies with SFR > 100 M⊙yr-1 require deep imaging to be detected, in part due to the effects of surface brightness dimming (e.g. reddy08; reddy12). With the current generation of optical imaging surveys, such as Hyper Suprime-Cam, VST-KiDS and the Dark Energy Survey (DES), deep, ground-based imaging of these systems is now possible over wide fields (>1000 deg2) for the first time. In this work, we make use of data from the first year of DES observations (drlica17).
The paper is structured as follows. Section 2 outlines the sample of dust-reddened quasars to be considered. Section 3 details the methods used to fit spectral energy distributions (SEDs) to the photometry, with the results of the fitting given in Section 4. Section LABEL:sec:discussion compares our results with independent studies of these quasars and our key findings are summarised in Section LABEL:sec:conclusions. Throughout this work, we assume a flat CDM cosmology with = 70 km s-1 Mpc-1, = 0.3 and = 0.7. All quoted magnitudes are based on the AB system, which is the native magnitude system for DES. In the case of the UKIDSS and VISTA, the following Vega to AB conversions have been applied:
JUKIDSS,AB = JUKIDSS,Vega+0.938;
HUKIDSS,AB = HUKIDSS,Vega+1.379;
KUKIDSS,AB = KUKIDSS,Vega+1.900;
JVISTA,AB = JVISTA,Vega+0.937;
HVISTA,AB = HVISTA,Vega+1.384;
KSVISTA,AB = KSVISTA,Vega+1.839.
2 Data
The reddened quasars at redshifts outlined in banerji12; banerji15 form the basis of our investigation. The sample selection criteria and the new imaging data are described below.
2.1 NIR Selection of Luminous Reddened Quasars
Red quasar candidates were identified using NIR imaging from wide-field surveys such as the UKIDSS Large Area Survey (ULAS) and VISTA Hemisphere Survey (VHS), as detailed in banerji12; banerji15. Objects that appeared as point-sources in the -band, with K 18.4111Magnitudes were calculated within a 1 arcsecond radius aperture (apermag3) and include an aperture correction appropriate for point sources., formed the flux-limited base sample. Targets were further required to possess extremely red NIR colours, (J-K) 1.5 (corresponding to an E(B-V) 0.5 at . A point-source restriction was also applied to ensure that the -band light is dominated by an unresolved object, therefore excluding galaxies and isolating high-redshift, NIR-luminous quasars. Of the 66 targets selected in this manner, 61 were successfully followed up with either SINFONI VLT or Gemini-GNIRS observations(banerji12; banerji13; banerji15). 38 of these were spectroscopically-confirmed to be Type-1 broad-line (BL) quasars at and form the parent spectroscopic sample of heavily reddened quasars for this paper. With extinction-corrected bolometric luminosities of L1047ergs-1 and MBH 109-10 M⊙ (banerji15), these quasars are among the most luminous and massive accreting SMBHs known at this epoch.
Detecting even the most luminous, star-forming quasar host galaxies at z 2 requires deep optical imaging data. The most UV-luminous, star-forming galaxies at 2 currently known have typical -band magnitudes fainter than 22 (AB) (e.g. reddy08). These magnitudes lie below the flux limit of wide-field optical imaging surveys such as the Sloan Digital Sky Survey (SDSS), which, until recently was the deepest optical imaging survey available over the 1000 deg2 area overlapping the VHS and ULAS survey footprints.
2.2 Reddened Quasars in the Dark Energy Survey (DES)
We make use of new deep optical photometry for the reddened quasars from observations conducted as part of the Dark Energy Survey (DES). DES is a wide-field survey, imaging 5000 deg2 of the southern celestial hemisphere in the grizY-bands (frieman13; flaugher15; abbott16). The 5-year survey began in 2013 and uses the 570 Megapixel DECam on the 4m Blanco telescope at the Cerro Tololo Inter-American Observatory (CTIO). DES is among the deepest wide-field surveys currently in operation and will eventually reach depths of 24.0 (10; AB) for extended sources.
Here, we primarily make use of observations conducted during the first year of DES operations (2013 Aug - 2014 Feb) corresponding to the Year 1 Annual 1 (Y1A1) internal data release (diehl14). Sixteen of the 38 reddened quasars in our spectroscopic sample overlap with the DES Y1A1 footprint, which covers 1800 deg2. The 10 limiting magnitudes reached by the Y1A1 data in a 2 arcsec aperture are summarised in Table 2.2 for each of the DES bands.
| Filter | (Å) | Magnitude Limit |
|---|---|---|
| (10; AB) | ||
| 4824 | 23.4 | |
| 6432 | 23.2 | |
| 7806 | 22.5 | |
| 9179 | 21.8 | |
| 9883 | 20.1 | |
| Name | RA | DEC | log10(Lbol,QSO/erg s-1 (L⊙)) | log10(MBH/M⊙) | |
|---|---|---|---|---|---|
| ULASJ0016-0038 | 4.0025 | -0.6498 | 2.194 | 46.54 (12.95) | 9.3 |
| ULASJ1002+0137 | 150.5470 | 1.6185 | 1.595 | 46.51 (12.92) | 10.1 |
| VHSJ2024-5623 | 306.1074 | -56.3898 | 2.282 | 46.63 (13.05) | 9.8 |
| VHSJ2028-5740 | 307.2092 | -57.6681 | 2.121 | 47.66 (14.08) | 10.1 |
| VHSJ2100-5820 | 315.1403 | -58.3354 | 2.360 | 47.08 (13.50) | 9.1 |
| VHSJ2115-5913 | 318.8817 | -59.2188 | 2.115 | 47.49 (13.91) | 9.3 |
| ULASJ2200+0056 | 330.1036 | 0.9346 | 2.541 | 47.34 (13.76) | 9.2 |
| VHSJ2220-5618 | 335.1398 | -56.3106 | 2.220 | 47.87 (14.28) | 9.9 |
| ULASJ2224-0015 | 336.0392 | -0.2566 | 2.223 | 46.87 (13.28) | 8.9 |
| VHSJ2227-5203 | 336.9491 | -52.0582 | 2.656 | 46.87 (13.29) | 10.0 |
| VHSJ2235-5750 | 338.9331 | -57.8371 | 2.246 | 47.13 (13.55) | 10.1 |
| VHSJ2256-4800 | 344.1443 | -48.0088 | 2.250 | 47.43 (13.85) | 10.1 |
| VHSJ2257-4700 | 344.2589 | -47.0156 | 2.156 | 46.60 (13.02) | 9.5 |
| VHSJ2306-5447 | 346.5010 | -54.7882 | 2.372 | 46.90 (13.32) | 10.0 |
| ULASJ2315+0143 | 348.9842 | 1.7307 | 2.560 | 48.06 (14.48) | 8.8 |
| VHSJ2332-5240 | 353.0387 | -52.6780 | 2.450 | 46.78 (13.19) | 9.5 |
| VHSJ2355-0011 | 358.9394 | -0.1893 | 2.531 | 47.34 (13.75) | 10.1 |


For a single quasar, ULASJ1002+0137, in the COSMOS field, we also make use of DECam observations conducted as part of the Science Verification. This data goes considerably deeper than the Y1A1 data, reaching an -band magnitude limit of 25.1 in a 2 arcsec aperture (10; AB). We note however, that the optical magnitudes of ULASJ1002+0137 are such that it would also be detected with the Y1A1 depths, had this region been part of the Y1A1 footprint. The sample considered in this work therefore consists of 17 spectroscopically-confirmed reddened quasars at , shown to be representative of the parent sample of 38 reddened quasars in terms of redshift, luminosity and BH mass. The DECam band observations for the sample are summarised in Table 2, with the corresponding -band colour composite images given in Fig. 1.
At redshifts , the DES filters trace emission at rest-frame UV wavelengths (1300 - 3800 Å). We use the DES magauto SExtractor magnitudes for our sources, which have been shown to perform best in SED-fitting of galaxies with the DES data (e.g. sanchez14). The magauto magnitudes are preferred to the DES model magnitudes as the model magnitudes assume an exponential disk model, which may not be appropriate for our high-redshift galaxies. We note however, that differences between the model and magauto magnitudes are typically small and our choice of magnitudes therefore does not affect the main conclusions of this study. The magauto magnitudes do however underestimate the fluxes of point sources, as no aperture correction is applied. Indeed, reed17 find that for point sources in DES Y1A1, the magauto values are systematically fainter by 0.1 mag compared to the magpsf values. Although our quasars are mostly extended in the DES -bands, they are often unresolved in the DES -band, where the magauto values are 0.1 mags fainter than the magpsf values. Once again, we find these magnitude variations to have a negligible effect on the results of this study. The DES magauto magnitudes for all 17 sources are presented in Table 3. All photometry has been corrected for any spatial non-uniformity in the global calibration and for the effects of Galactic extinction using the stellar locus regression technique described in drlica17. Sixteen of the 17 quasars in our sample are detected at in at least one of the DES bands.
| Name | - | ||||||
|---|---|---|---|---|---|---|---|
| ULASJ0016-0038 | 24.36 | 23.16 0.08 | 1.20 | 21.80 0.04 | 21.19 0.04 | - | 20.43 0.10 |
| ULASJ1002+0137 | 28.14 | 23.55 0.05 | 4.59 | 23.01 0.03 | 22.14 0.02 | 21.36 0.02 | 21.06 0.04 |
| VHSJ2024-5623 | 25.34 | 24.81 0.37 | 0.53 | 23.68 0.16 | 22.34 0.07 | 21.63 0.07 | 21.69 0.23 |
| VHSJ2028-5740 | 29.19 | 24.15 0.24 | 5.04 | 23.32 0.12 | 22.45 0.08 | 21.61 0.08 | 21.37 0.26 |
| VHSJ2100-5820 | 26.95 | 25.37 0.49 | 1.58 | 24.51 0.39 | 23.56 0.21 | 22.17 0.13 | 22.37 0.68 |
| VHSJ2115-5913 | 27.61 | 22.52 0.05 | 5.09 | 22.28 0.08 | 21.90 0.09 | 21.14 0.11 | 21.37 0.50 |
| ULASJ2200+0056 | 23.70 | 22.03 0.03 | 1.67 | 21.36 0.02 | 20.71 0.02 | 19.90 0.01 | 19.60 0.04 |
| VHSJ2220-5618 | 24.99 | 23.24 0.06 | 1.75 | 22.63 0.06 | 21.72 0.04 | 20.53 0.03 | 20.04 0.05 |
| ULASJ2224-0015 | 24.78 | 23.65 0.10 | 1.13 | 22.82 0.06 | 21.77 0.04 | 20.89 0.03 | 21.03 0.11 |
| VHSJ2227-5203 | 28.59 | 23.88 0.16 | 4.71 | 23.22 0.08 | 22.45 0.05 | 21.35 0.05 | 21.56 0.18 |
| VHSJ2235-5750 | 24.44 | 23.20 0.09 | 1.24 | 22.71 0.07 | 21.82 0.05 | 21.05 0.04 | 20.74 0.09 |
| VHSJ2256-4800 | 24.27 | 22.76 0.07 | 1.51 | 22.55 0.05 | 22.20 0.08 | 21.32 0.05 | 20.90 0.15 |
| VHSJ2257-4700 | 25.88 | 25.57 0.46 | 0.31 | 23.83 0.14 | 22.48 0.07 | 21.57 0.07 | 21.43 0.26 |
| VHSJ2306-5447 | 25.87 | 24.07 0.12 | 1.80 | 23.90 0.16 | 22.66 0.08 | 21.69 0.06 | 21.75 0.34 |
| ULASJ2315+0143 | 30.55 | 22.70 0.08 | 7.85 | 22.46 0.10 | 22.47 0.20 | 21.94 0.19 | - |
| VHSJ2332-5240 | 25.78 | 23.49 0.10 | 2.29 | 23.49 0.14 | 23.01 0.15 | 22.27 0.14 | 22.54 0.82 |
| VHSJ2355-0011 | 25.98 | 22.43 0.03 | 3.55 | 22.51 0.06 | 22.18 0.06 | 21.64 0.06 | 21.41 0.19 |
| Name | modestg | modestr | modesti | modestz |
|---|---|---|---|---|
| ULASJ0016-0038 | 2 | 2 | 2 | 1 |
| ULASJ1002+0137 | 1 | 1 | 1 | 3 |
| VHSJ2024-5623 | 1 | 1 | 3 | 3 |
| VHSJ2028-5740 | 1 | 1 | 1 | 3 |
| VHSJ2100-5820 | 1 | 1 | 1 | 1 |
| VHSJ2115-5913 | 1 | 1 | 1 | 3 |
| ULASJ2200+0056 | 2 | 2 | 2 | 2 |
| VHSJ2220-5618 | 1 | 1 | 1 | 1 |
| ULASJ2224-0015 | 0 | 2 | 2 | 2 |
| VHSJ2227-5203 | 3 | 2 | 3 | 0 |
| VHSJ2235-5750 | 2 | 1 | 1 | 3 |
| VHSJ2256-4800 | 1 | 1 | 3 | 3 |
| VHSJ2257-4700 | 0 | 3 | 3 | 2 |
| VHSJ2306-5447 | 1 | 1 | 1 | 3 |
| ULASJ2315+0143 | 1 | 1 | 1 | 1 |
| VHSJ2332-5240 | 1 | 1 | 0 | 2 |
| VHSJ2355-0011 | 3 | 1 | 1 | 2 |
The DES magauto values presented in Table 3 appear to over-estimate the -band flux compared to those found via the SED fitting in banerji12; banerji15 (). Assuming the reddening towards the quasar sight line calculated from modelling the NIR photometry (banerji12; banerji15), we derive -band magnitudes 1.0 mag fainter than the DES magauto magnitudes in 15 of the 17 quasars. This suggests that the DECam images are detecting some source of excess emission in the rest-frame UV that cannot be accounted for by a reddened quasar template.
To quantify whether the excess emission in the -band photometry (Table 3) extends beyond the local PSF, we use the modest star-galaxy classifier (drlica17), based on the spread_model quantity from SExtractor. spread_model is defined to be a normalised linear discriminant between the best-fit local PSF-model and a more extended, exponential disk model convolved with the PSF (desai12). The modest classifier takes account both of the value of spread_model and its associated error in each band. modest has been optimised for the selection of a high-purity galaxy sample in DES by comparing to classifications from both deep space-based (HST) and high-quality ground-based (CFHTLens) surveys. The contamination rate from stars is estimated to be 5 per cent for (drlica17). modest classifications for the full sample are given in Table 4, where a modest classification of 0 denotes an unphysical PSF fit (likely star) while 1 indicates a high-confidence galaxy, 2 indicates a high-confidence star and 3 denotes an ambiguous classification. A detailed morphological analysis is beyond the scope of this paper. Instead, we simply seek to discriminate between point-like sources and extended images, which could indicate the detection of the host galaxy.
Ten of the 17 reddened quasars in our sample are morphologically classified as high-confidence galaxies in the DES -band, with a further two having an ambiguous classification and therefore also consistent with being spatially extended. This number of high-confidence galaxies increases to 12 in the -band, representing 70% of our sample. Even in the redder DES bands, 9 (7) of the quasars are classified as being extended beyond the local PSF in the - (-)bands. Quasar emission is spatially unresolved, yet the modest classifications in Table 4 indicate a significant fraction of our quasar sample to be spatially resolved in the DES ground-based imaging. Moreover, this fraction of extended sources increases at bluer wavelengths. Investigating the reason for the spatial extension and the excess rest-frame UV emission seen from these quasars in the DES data forms the central aim of the paper.
3 Spectral Energy Distribution (SED) Fitting
To characterise the nature of the rest-frame UV emission seen in the DECam images, we fit SED models to the DES and the ULAS/VHS NIR photometry for each source. We thus determine a model SED spanning rest-frame UV through optical wavelengths (approximately 1400-7000 Å) for each of the reddened quasars in our sample. In cases where the photometric errors are 10 per cent of the observed flux, an error floor of 10 per cent is applied prior to the SED-fitting to mitigate against the effect of any systematic uncertainties in the photometry and quasar variability (Section LABEL:sec:qso_variability). This floor has been selected to represent the scatter in unreddened quasar SEDs over the rest-frame wavelength interval 120010 000 Å . Although the parametric quasar model used in this work (Section 3.1) is found empirically to reproduce the broad-band colours () of unreddened quasars 222The quasar model reproduces broad-band quasar colours to mag, based on quasars at with from the SDSS DR7 quasar catalogue (schneider10), not all quasar SEDs look exactly the same, rather there appears to be a scatter 10 per cent. The effectiveness of the parametric model at reproducing the broad-band quasar colours is not expected to improve among reddened populations and so we apply this scatter as a floor on the photometric errors to avoid large contributions to the values (Section 3.3).
3.1 Quasar Model
We make use of a refined version of the quasar model described in maddox08, which has been used in a number of studies including hewett06 and maddox12. The continuum in the rest-frame UV is represented by two power-laws, , where at 2340 Å and at > 2340 Å. To account for the reddening of the quasar, we apply an extinction curve, which has been determined empirically using quasars in the seventh data release of the Sloan Digital Sky Survey (SDSS DR7) and is very similar in form to that presented by gallerani10. Whilst there is no 2200 Å feature in the extinction curve, the amount of extinction at wavelengths < 2500 Å is somewhat less than that derived from the Small Magellanic Cloud (SMC) (pei92). We note, however, that due to the significant reddening of the quasars in our sample (), the extinction of the quasar light in the rest-frame UV is so great that the exact form of the extinction curve is not important. The results presented in this paper would be essentially identical if an SMC-like extinction curve were used.
The above quasar model also incorporates UV and optical emission lines and FeII multiplets based on the Large Bright Quasar Survey (LBQS) composite of francis91. In general the strengths of the emission lines do not significantly affect the quasar broad-band colours except in the case of H-, which has a higher equivalent width relative to the other lines. We therefore adjust the H- equivalent width in the quasar model for each reddened quasar to match that measured from the NIR spectra in banerji12; banerji15. Hence, all reddening estimates for the quasars presented in this paper account for the effect of the H emission line on the observed colours.
3.2 Host Galaxy Model
A key aim of this study is to investigate whether the emission observed in the rest-frame UV is consistent with that of a star-forming host. Given the limited photometry tracing the rest-frame UV emission, we are unable to solve for all properties of the galaxy in the fitting. Instead, we consider a single star-forming galaxy SED template from bruzual03 with a constant star formation history (SFH) to model the host galaxy emission. The galaxy model is attenuated using a two-component charlot00 dust model, with = 1.0 (corresponding to an 0.35) affecting the young stellar populations, which is consistent with the level of dust extinction seen in local star-forming galaxies. In cases where we see a significant deviation of the rest-frame UV-slope as traced by our and -band photometry, from that in the default host galaxy model, we also consider galaxy models with = 0.2 and = 5.0, representing bluer and redder rest-frame UV colours respectively (bruzual03). We note however, that the rest-frame UV slope in the host galaxy model is sensitive to both the dust content () and the SFH. Due to the limited photometry tracing the rest-frame UV and the degenerate nature of these two parameters, we cannot derive meaningful estimates for both and the SFH, so we are limited to these discrete scenarios. In all cases, we assume a chabrier03 initial mass function (IMF) and solar metallicity.
3.3 Fitting Method
We fit the combined optical+NIR photometry of the individual quasars using combinations of the models described above, in order to investigate the source of the excess rest-frame UV emission. In particular, we consider three scenarios: (i) the rest-frame UV flux arises from resonantly scattered Lyman- emission, (ii) the excess emission is scattered continuum light from the central quasar, and (iii) we are seeing UV emission due to star formation in the quasar host galaxy. Although in reality, the rest-frame UV emission is likely due to some combination of the above, the limited DES photometry means we are unable to simultaneously solve for a mix of multiple scenarios. Instead, we seek only to determine the dominant source in each case. To quantify the likelihood of each scenario, we make use of statistics, calculating the reduced for each quasar in the sample, i.e.
| (1) |
where a 1 indicates a good fit. and denote the photometric and model fluxes respectively. is the number of degrees of freedom (with = ) and denotes the photometric errors, floored at 10 per cent. In order to obtain full posterior distributions for all free parameters and marginalise over nuisance parameters, we employ a Markov Chain Monte-Carlo (MCMC) method (metropolis53; hastings70; foreman13) to explore the parameter space. Throughout the fitting we assume flat priors across the entire parameter space.
4 Results
This section presents the results of fitting different combinations of the above models to the combined optical+NIR photometry. We initially consider only a reddened quasar template, but later consider three possible sources of the rest-frame UV emission - (i) resonantly-scattered Lyman-, (ii) scattered quasar continuum and (iii) a relatively un-obscured star-forming host galaxy.
4.1 Quasar Only SED-Fits
We begin by modelling the photometry with a reddened quasar template, setting the only free parameter - the quasar dust reddening () - to lie in the range 0.3 5.0. Four quasars are found to be well-fit by this model - VHSJ2024-5623, VHSJ2100-5820, VHSJ2257-4700 and ULASJ0016-0038, returning a < 2.5 and residuals () across all bands. The fitted templates for each of these four quasars, along with their associated residuals, are presented in Fig. 2.


The derived values of for each of the four quasars in Fig. 2 are presented in Table 5, with all four quasars returning an consistent to within 0.1 of those presented in banerji12; banerji15 (hereafter denoted ). Although values of were derived using only the NIR -band photometry, our fitting provides little evidence for additional rest-frame UV emission in the DES Y1A1 photometry of these quasars. Despite the modest classifier characterising two of these sources (VHSJ2024-5623 and VHSJ2100-5820) as high-confidence galaxies in the DES and -bands, we find that a reddened quasar SED is sufficient to fit the photometric data in both cases. Any extended emission in these galaxies is therefore faint and difficult to disentangle from the quasar emission via SED modelling. As such, we find these four quasars to be well characterised by a reddened-quasar template alone and therefore exclude them from the remainder of our analysis. Conversely, the remaining 13 quasars in the sample return > 5 when fitted in the above manner, indicating that some additional component is required in the model to account for the observed rest-frame UV flux.
| Name | ||
|---|---|---|
| ULASJ0016-0038 | 0.43 | 0.5 |
| VHSJ2024-5623 | 0.58 | 0.6 |
| VHSJ2100-5820 | 0.81 | 0.8 |
| VHSJ2257-4700 | 0.67 | 0.7 |
4.2 Scattered Light
4.2.1 Scattered Lyman-alpha Emission
One possible explanation for the rest-frame UV flux in the 13 remaining quasars is Lyman- emission, which can appear spatially extended due to resonant scattering by the surrounding material. We immediately rule out this possibility for seven of the quasars in our sample, as the Lyman- emission falls outside the wavelength range of the DES -band333Lyman- lies at 1216 Å in the rest-frame, which corresponds to 3155-4446Å in the observed frame over the full redshift range of our sample. Thus the Lyman- line only affects the DES -band fluxes in our SED fits for all the quasars.. We model the remaining six quasars - ULASJ2200+0056, VHSJ2227-5203, VHSJ2306-5447, ULASJ2315+0143, VHSJ2332-5240 and VHSJ2355-0011 - with a two-component model consisting of a reddened quasar template and a Lyman- emission line. As in the quasar-only fitting (Section 4.1), is set to lie in the range 0.3 5.0, while the fraction of scattered Lyman- can take values 0 1, where = 1 represents the complete scattering of Lyman- photons.
Fitting this model returns > 2.5 for four of the six quasars listed above, indicating that scattered Lyman- emission cannot accurately reproduce the rest-frame UV flux observed in these systems. Although both ULASJ2200+0056 and VHSJ2306-5447 return 2, we note that excess rest-frame UV emission relative to the reddened quasar model is detected in multiple bands in ULASJ2200+0056, further ruling out the scattered Lyman- scenario for this quasar. From this, we conclude VHSJ2306-5447 to be the only quasar for which the rest-frame UV flux may arise solely from Lyman- emission. The best fit SED of this scenario for VHSJ2306-5447 in shown in Fig. 3. For the remaining 12 quasars, we require some other mechanism to characterise the observed emission in the rest-frame UV.

4.2.2 Scattered Quasar Continuum Light
It is also possible that some fraction of the rest-frame UV quasar continuum light is being scattered into our line of sight by the surrounding dust. The extent of this scattering is assumed to be wavelength-independent and is modelled with two quasar templates, one of which is completely un-obscured to represent the scattered continuum. The dust reddening of the obscured quasar and the fraction of scattered continuum form the two free parameters in the fitting, taking values 0.3 5.0 and 0 1 respectively, where an = 1 represents the complete scattering of the quasar continuum. This model generally appears to provide a good fit to the photometry, finding a scattering fraction 0.2 per cent across all sources and returning a < 2.5 in 10 of the 13 quasars, with only three quasars - VHSJ2028-5740, VHSJ2227-5203 and VHSJ2256-4800 - returning > 2.5.
The modest classifier show evidence for spatially extended emission in all but two (ULASJ2200+0056 and ULASJ2224-0015) of the quasars well-fit by this model (Section 2). obied16 show that giant ’scattering cones’ of free electrons and dust can scatter the quasar continuum out to 10kpc, resulting in extended regions with narrow line emission and indeed integral field spectroscopy of luminous, obscured quasars have shown narrow-line regions extended over scales of 20-30 kpc (liu13). The NIR spectra of our reddened quasar sample (banerji12; banerji15) however, show emission from narrow line regions to be weak, thus ruling out the presence of such a scattering cone. Considering the small fraction of quasar light being scattered in our sample (0.2 per cent), it is also possible that extended emission arises from scattering within the interstellar medium (ISM) (e.g. young09). We note however, that in an ionised ISM with a conventional dust-to-gas ratio, scattering by dust has been shown to dominate over free-electron scattering by a factor 10 in the UV (weingartner01; draine03). draine03 have shown this dust scattering to be strongly biased towards forward scattering, meaning the single scattering of the quasar continuum is unlikely to scatter into the line of sight when considering Type-1 quasars, such as those in our sample. Furthermore, if a small fraction of this emission were to be scattered into our line of sight, we would expect a much bluer quasar spectrum than the fitted unobscured quasar SED, as the scattering efficiency rapidly increases at shorter wavelengths. We find no evidence to suggest a bluer quasar template would better fit the DES photometry of our sample and hence conclude this scenario to be unlikely. Although we cannot rule out the scattered light scenario in explaining the UV excess in ULASJ2200+0056 or ULASJ2224-0015, where we see no evidence for extended emission, we likely require an alternative explanation for the remainder of our quasar sample.
The above SED model used to test for the scattered quasar continuum could also represent a system with two AGN (e.g. following a merger event) in which only one is significantly obscured by dust. We quickly rule out the possibility of clustered quasars, as their typical angular separations (2.9 7.7 arcsec eftekharzadeh17) exceed the 1 arcsec angular resolution of DES, yet we see no evidence for a second quasar in the DES images (Fig. 1). Thus, if our systems were to contain two quasars they would need to be at small physical separations, but have very different line-of-sight extinctions. Based on our fitting results, the second quasar would also need to have Lbol,QSO 500 times (7 magnitudes) fainter that the primary (reddened) quasar and although there are very few constraints on the number densities of such low-luminosity AGN, the combination of properties required for this explanation to hold makes the scenario somewhat implausible.
4.3 Host Galaxy Emission
Finally, we explore the possibility of the rest-frame UV flux arising from a relatively un-obscured star-forming host galaxy modelled by the galaxy templates outlined in Section 3, assuming a constant SFH. Although the real SFH of the galaxy is likely to consist of bursts of star formation, alongside phases of quiescence and steady formation, we later demonstrate this assumption of a constant SFH to provide a good description of the rest-frame UV photometry for the vast majority of our sample.
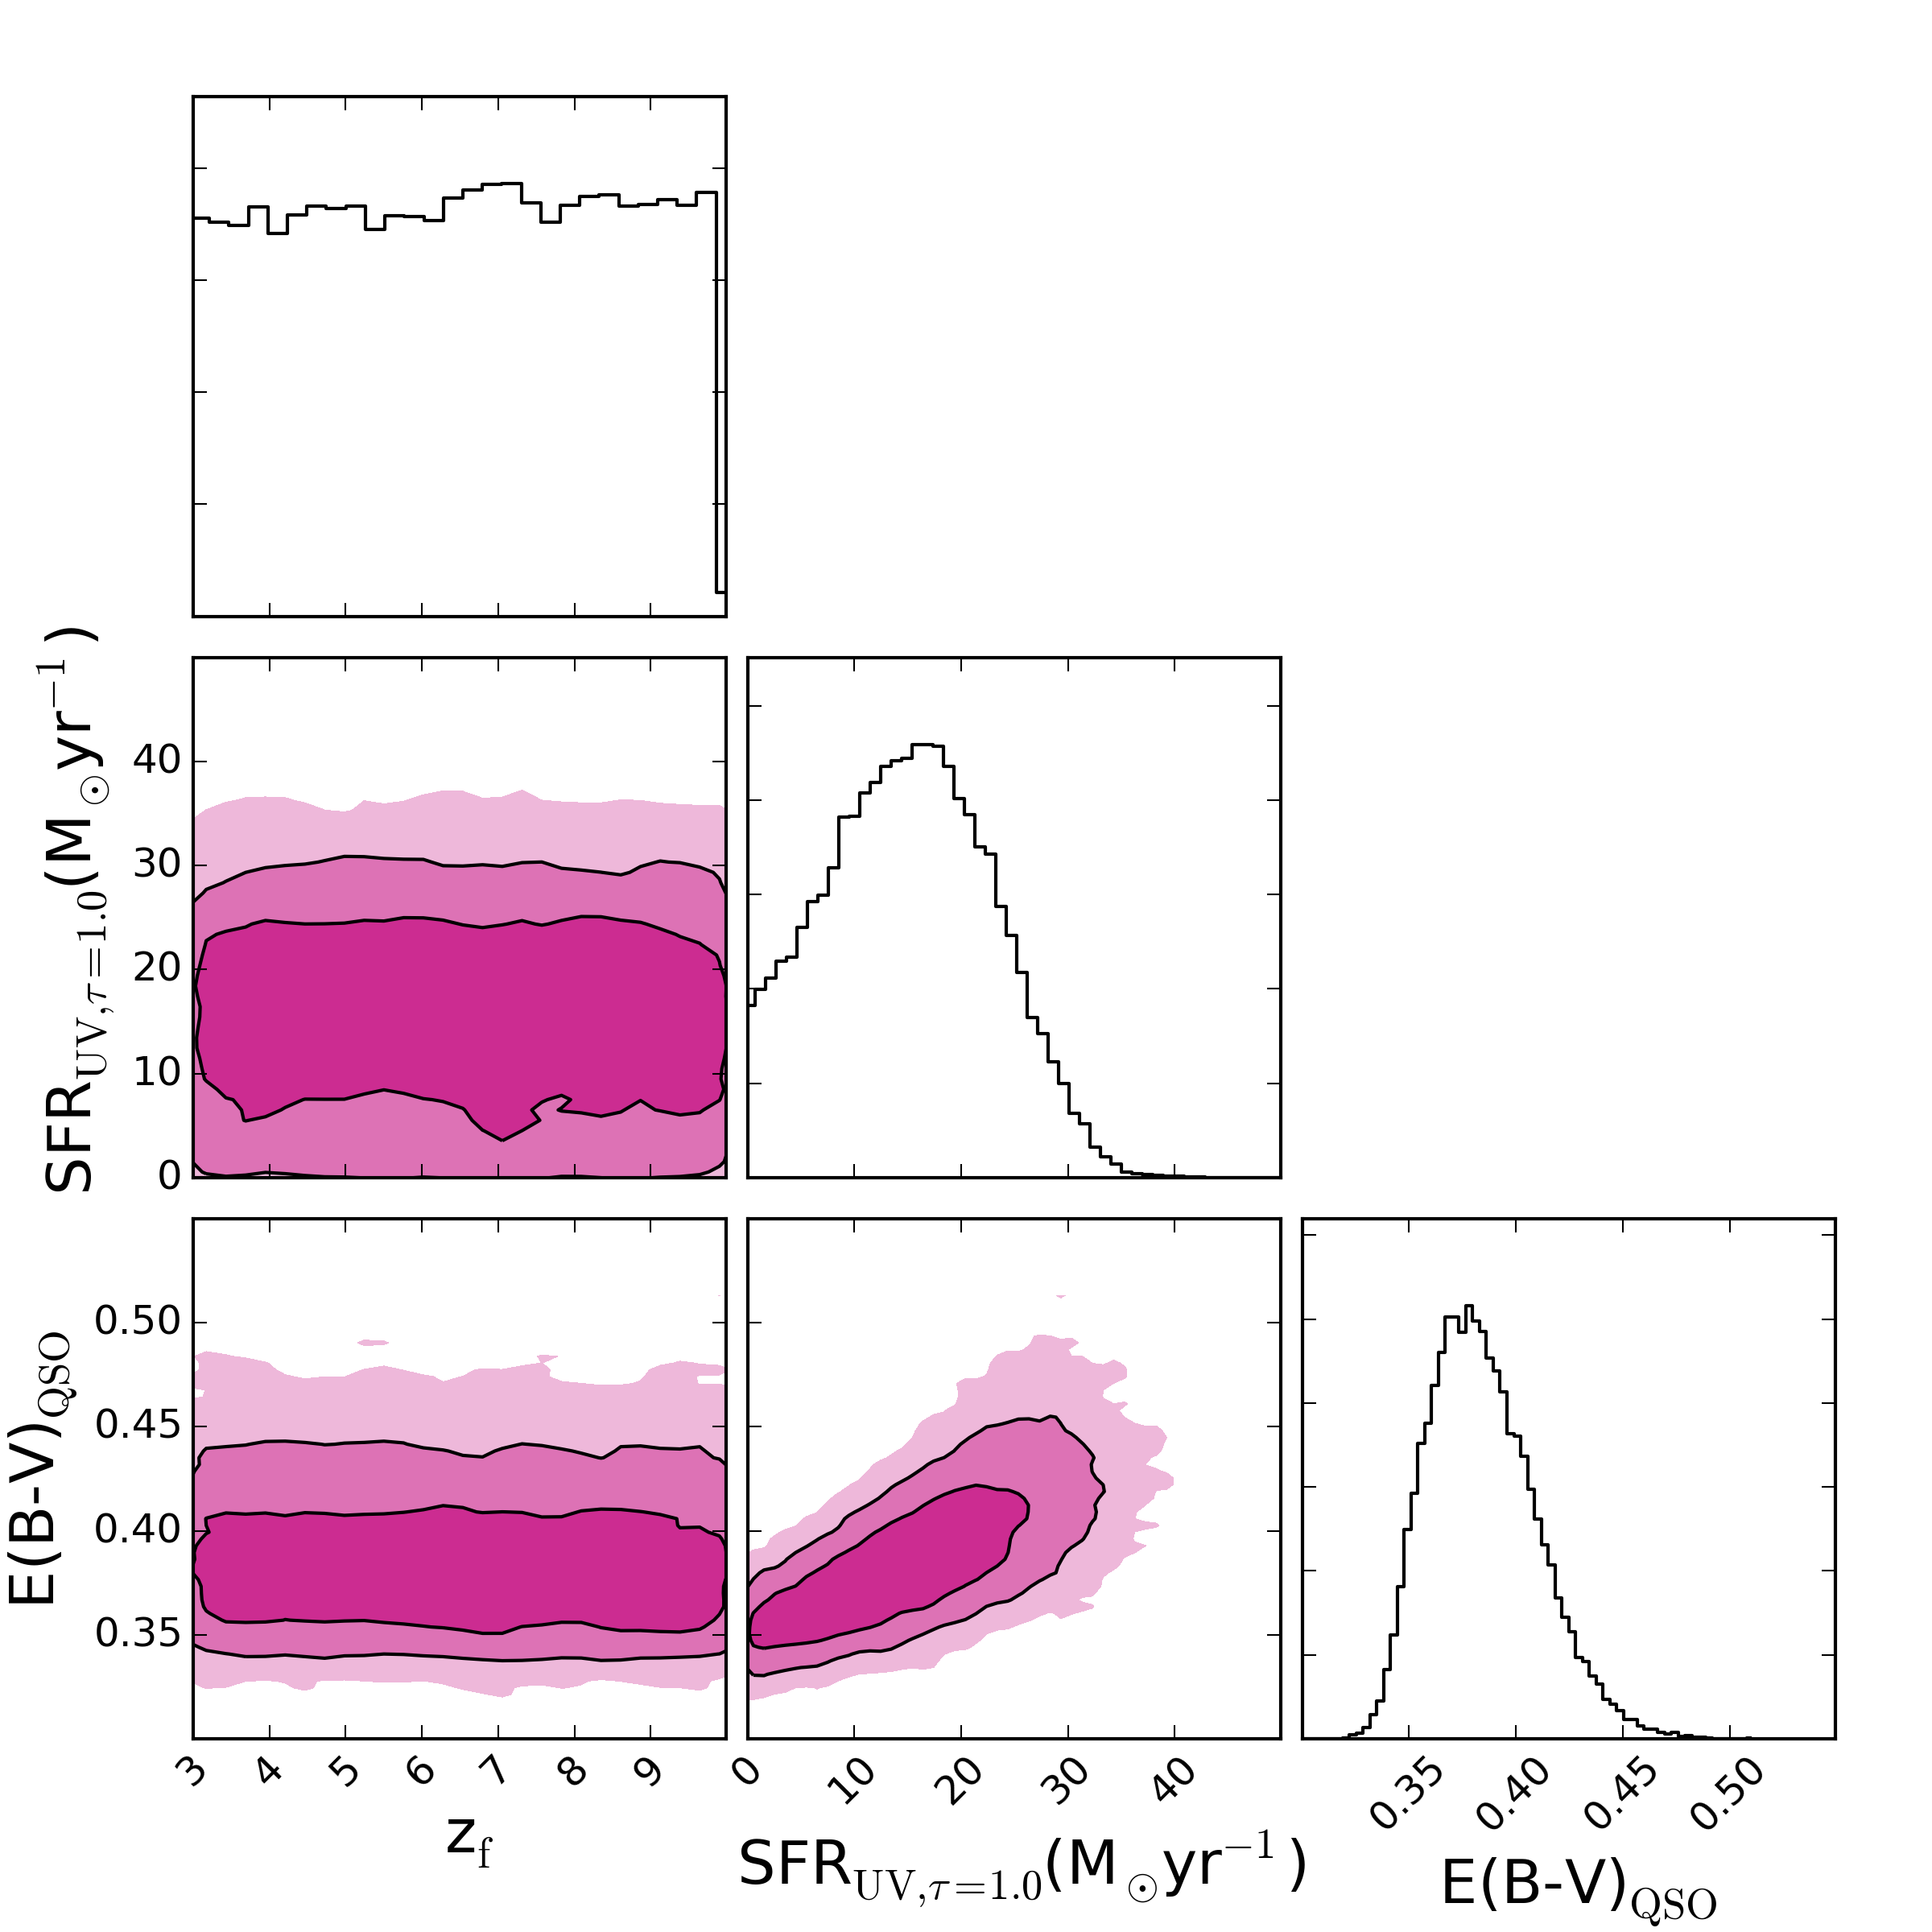
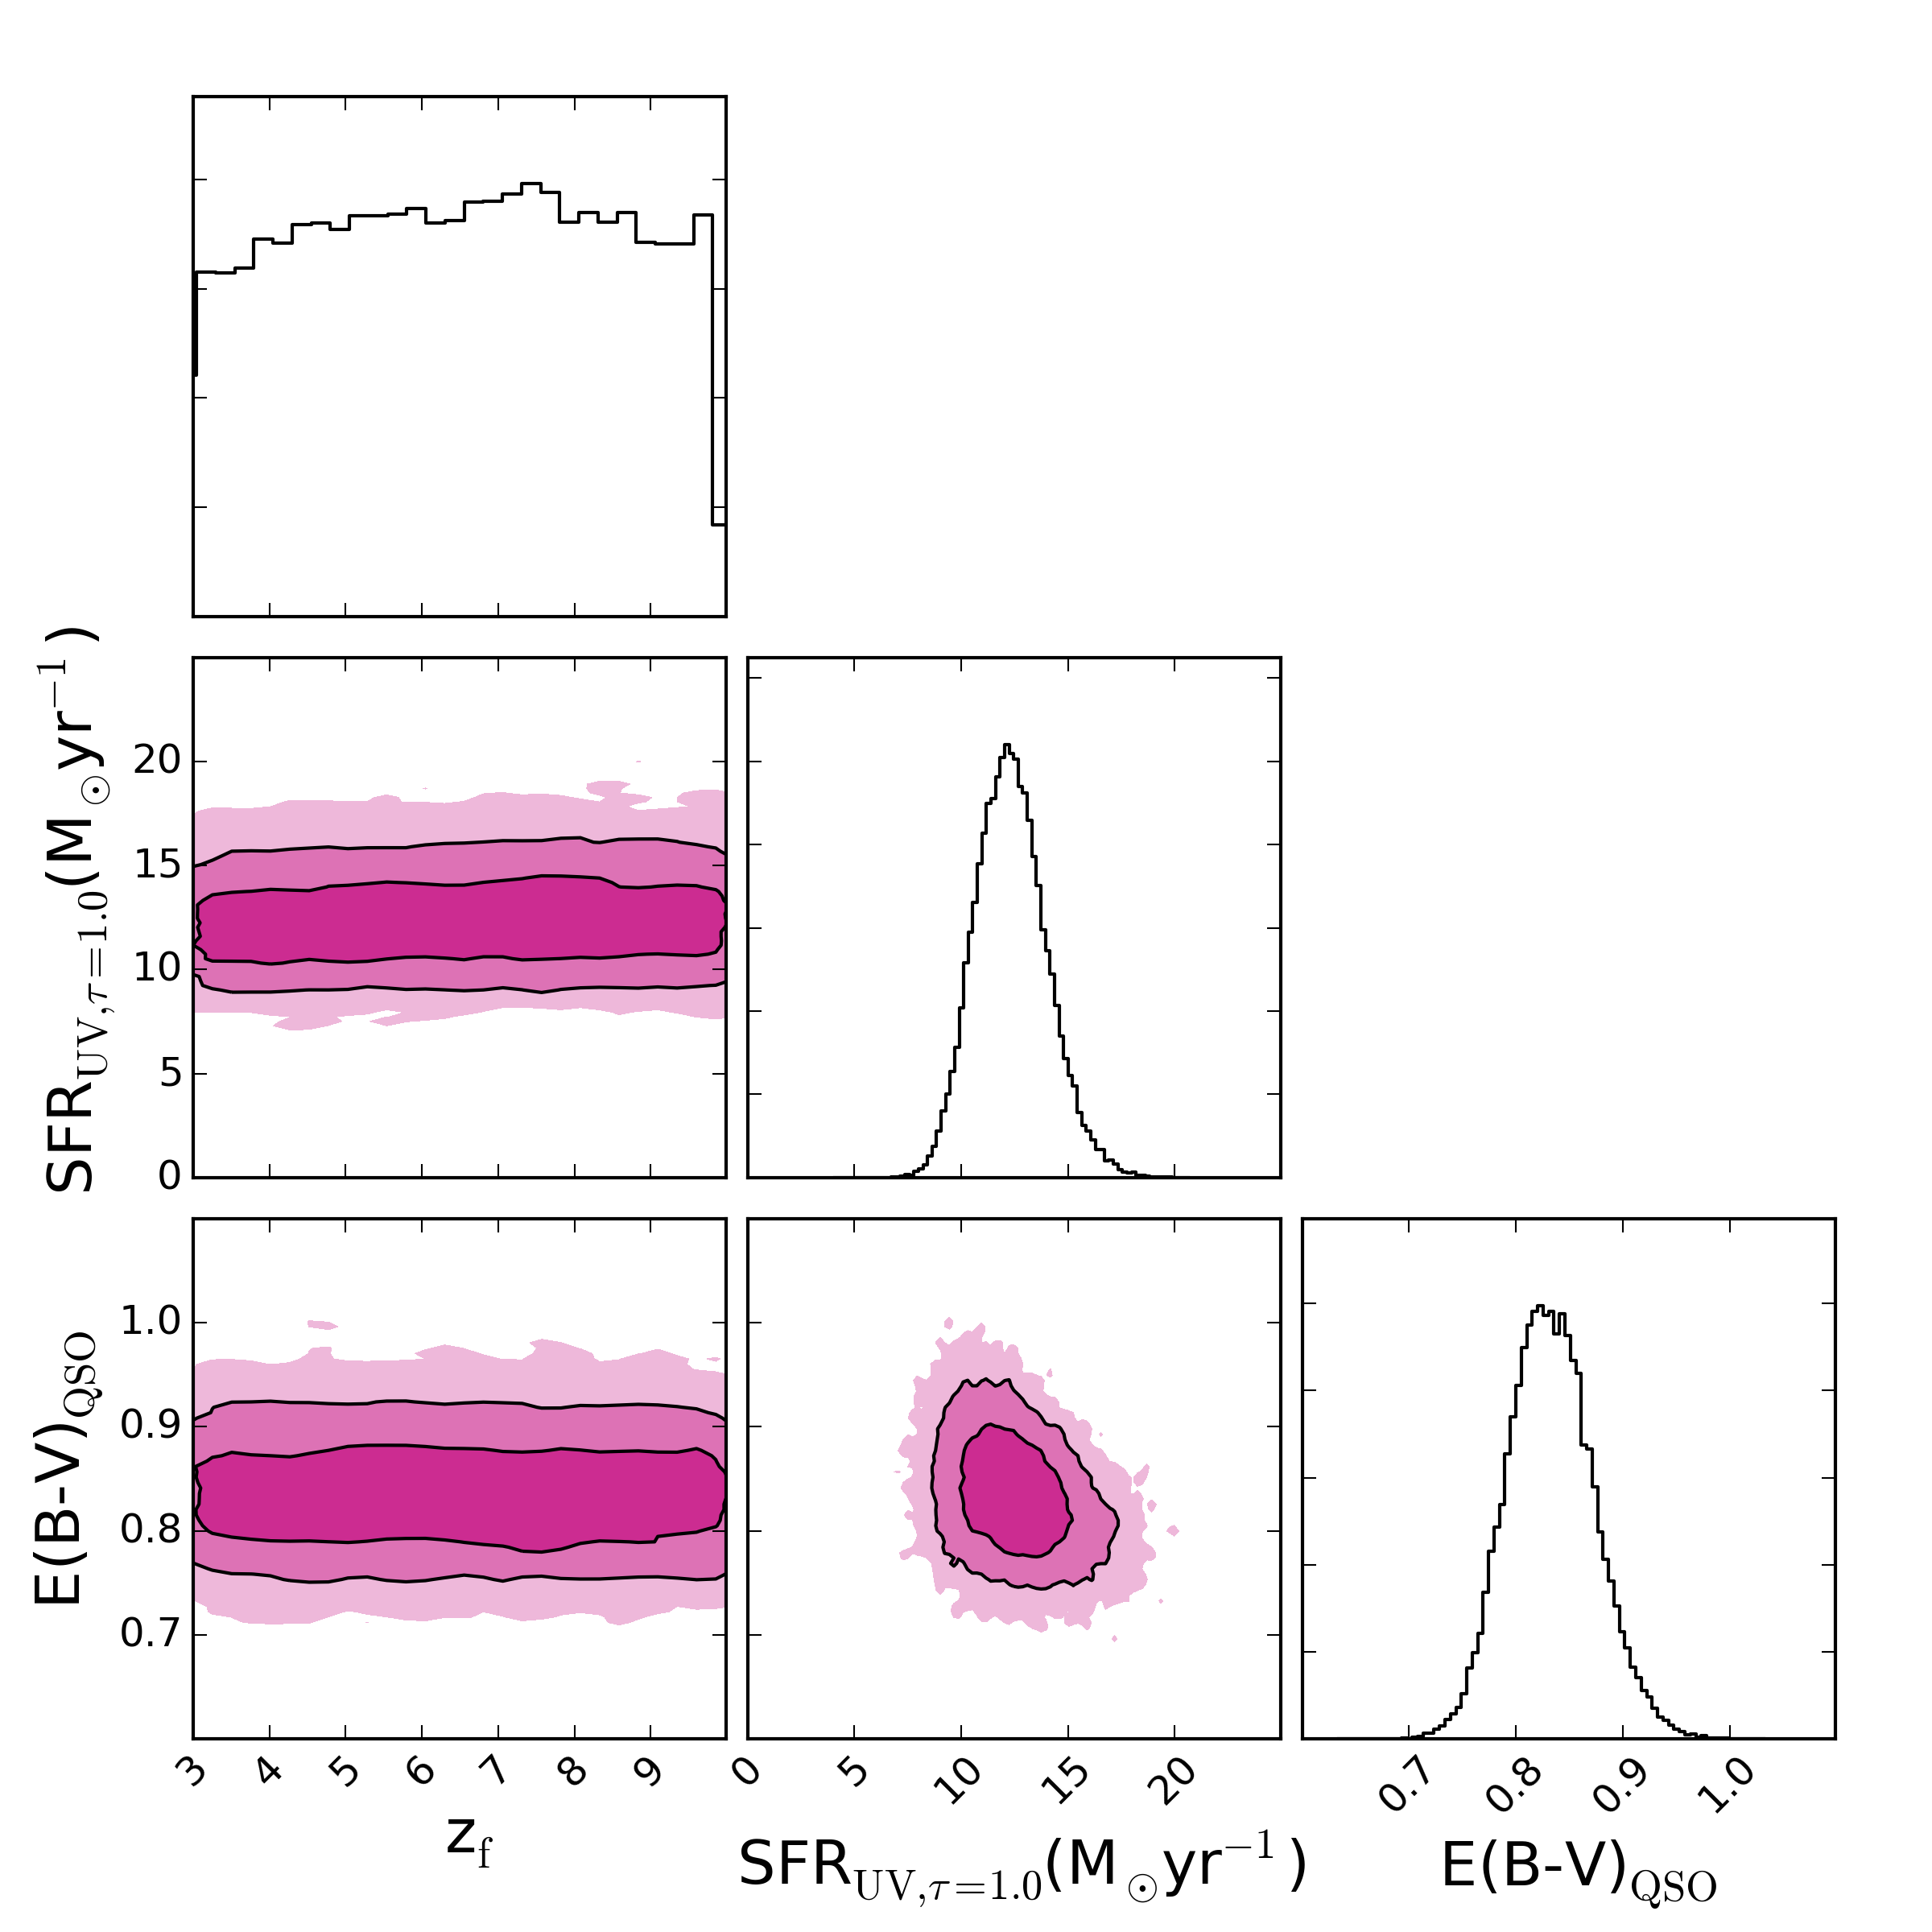
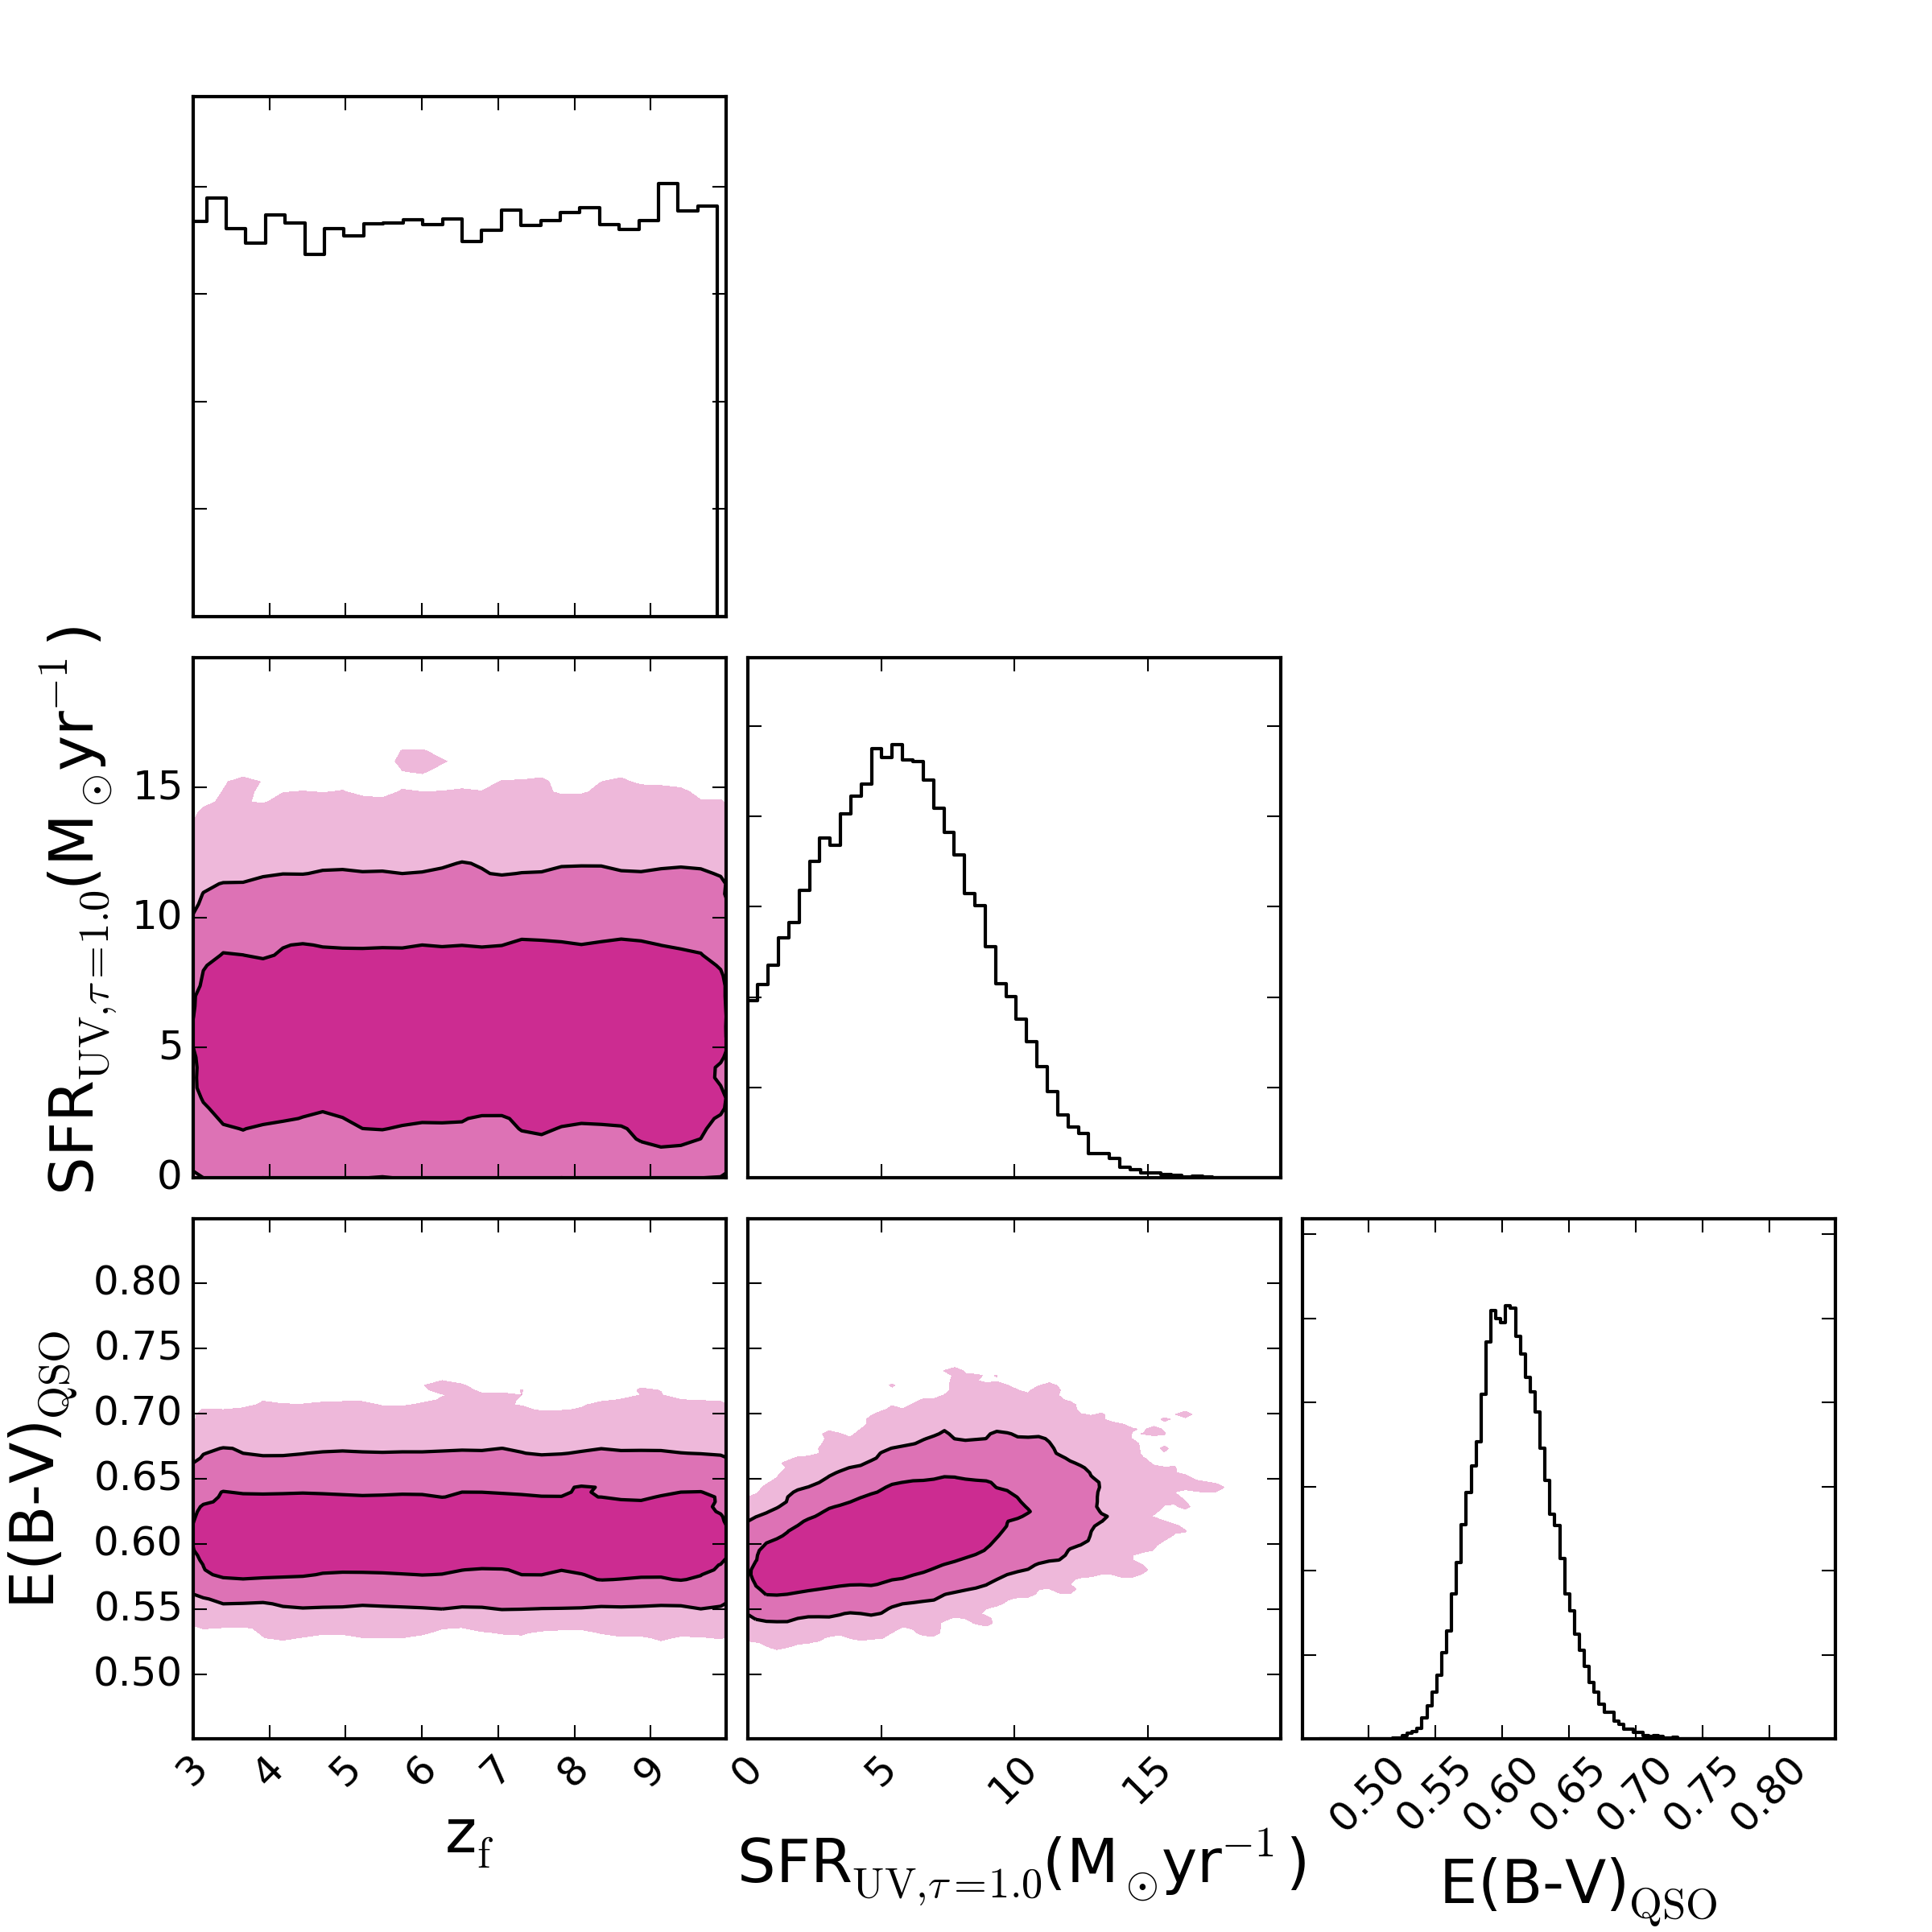
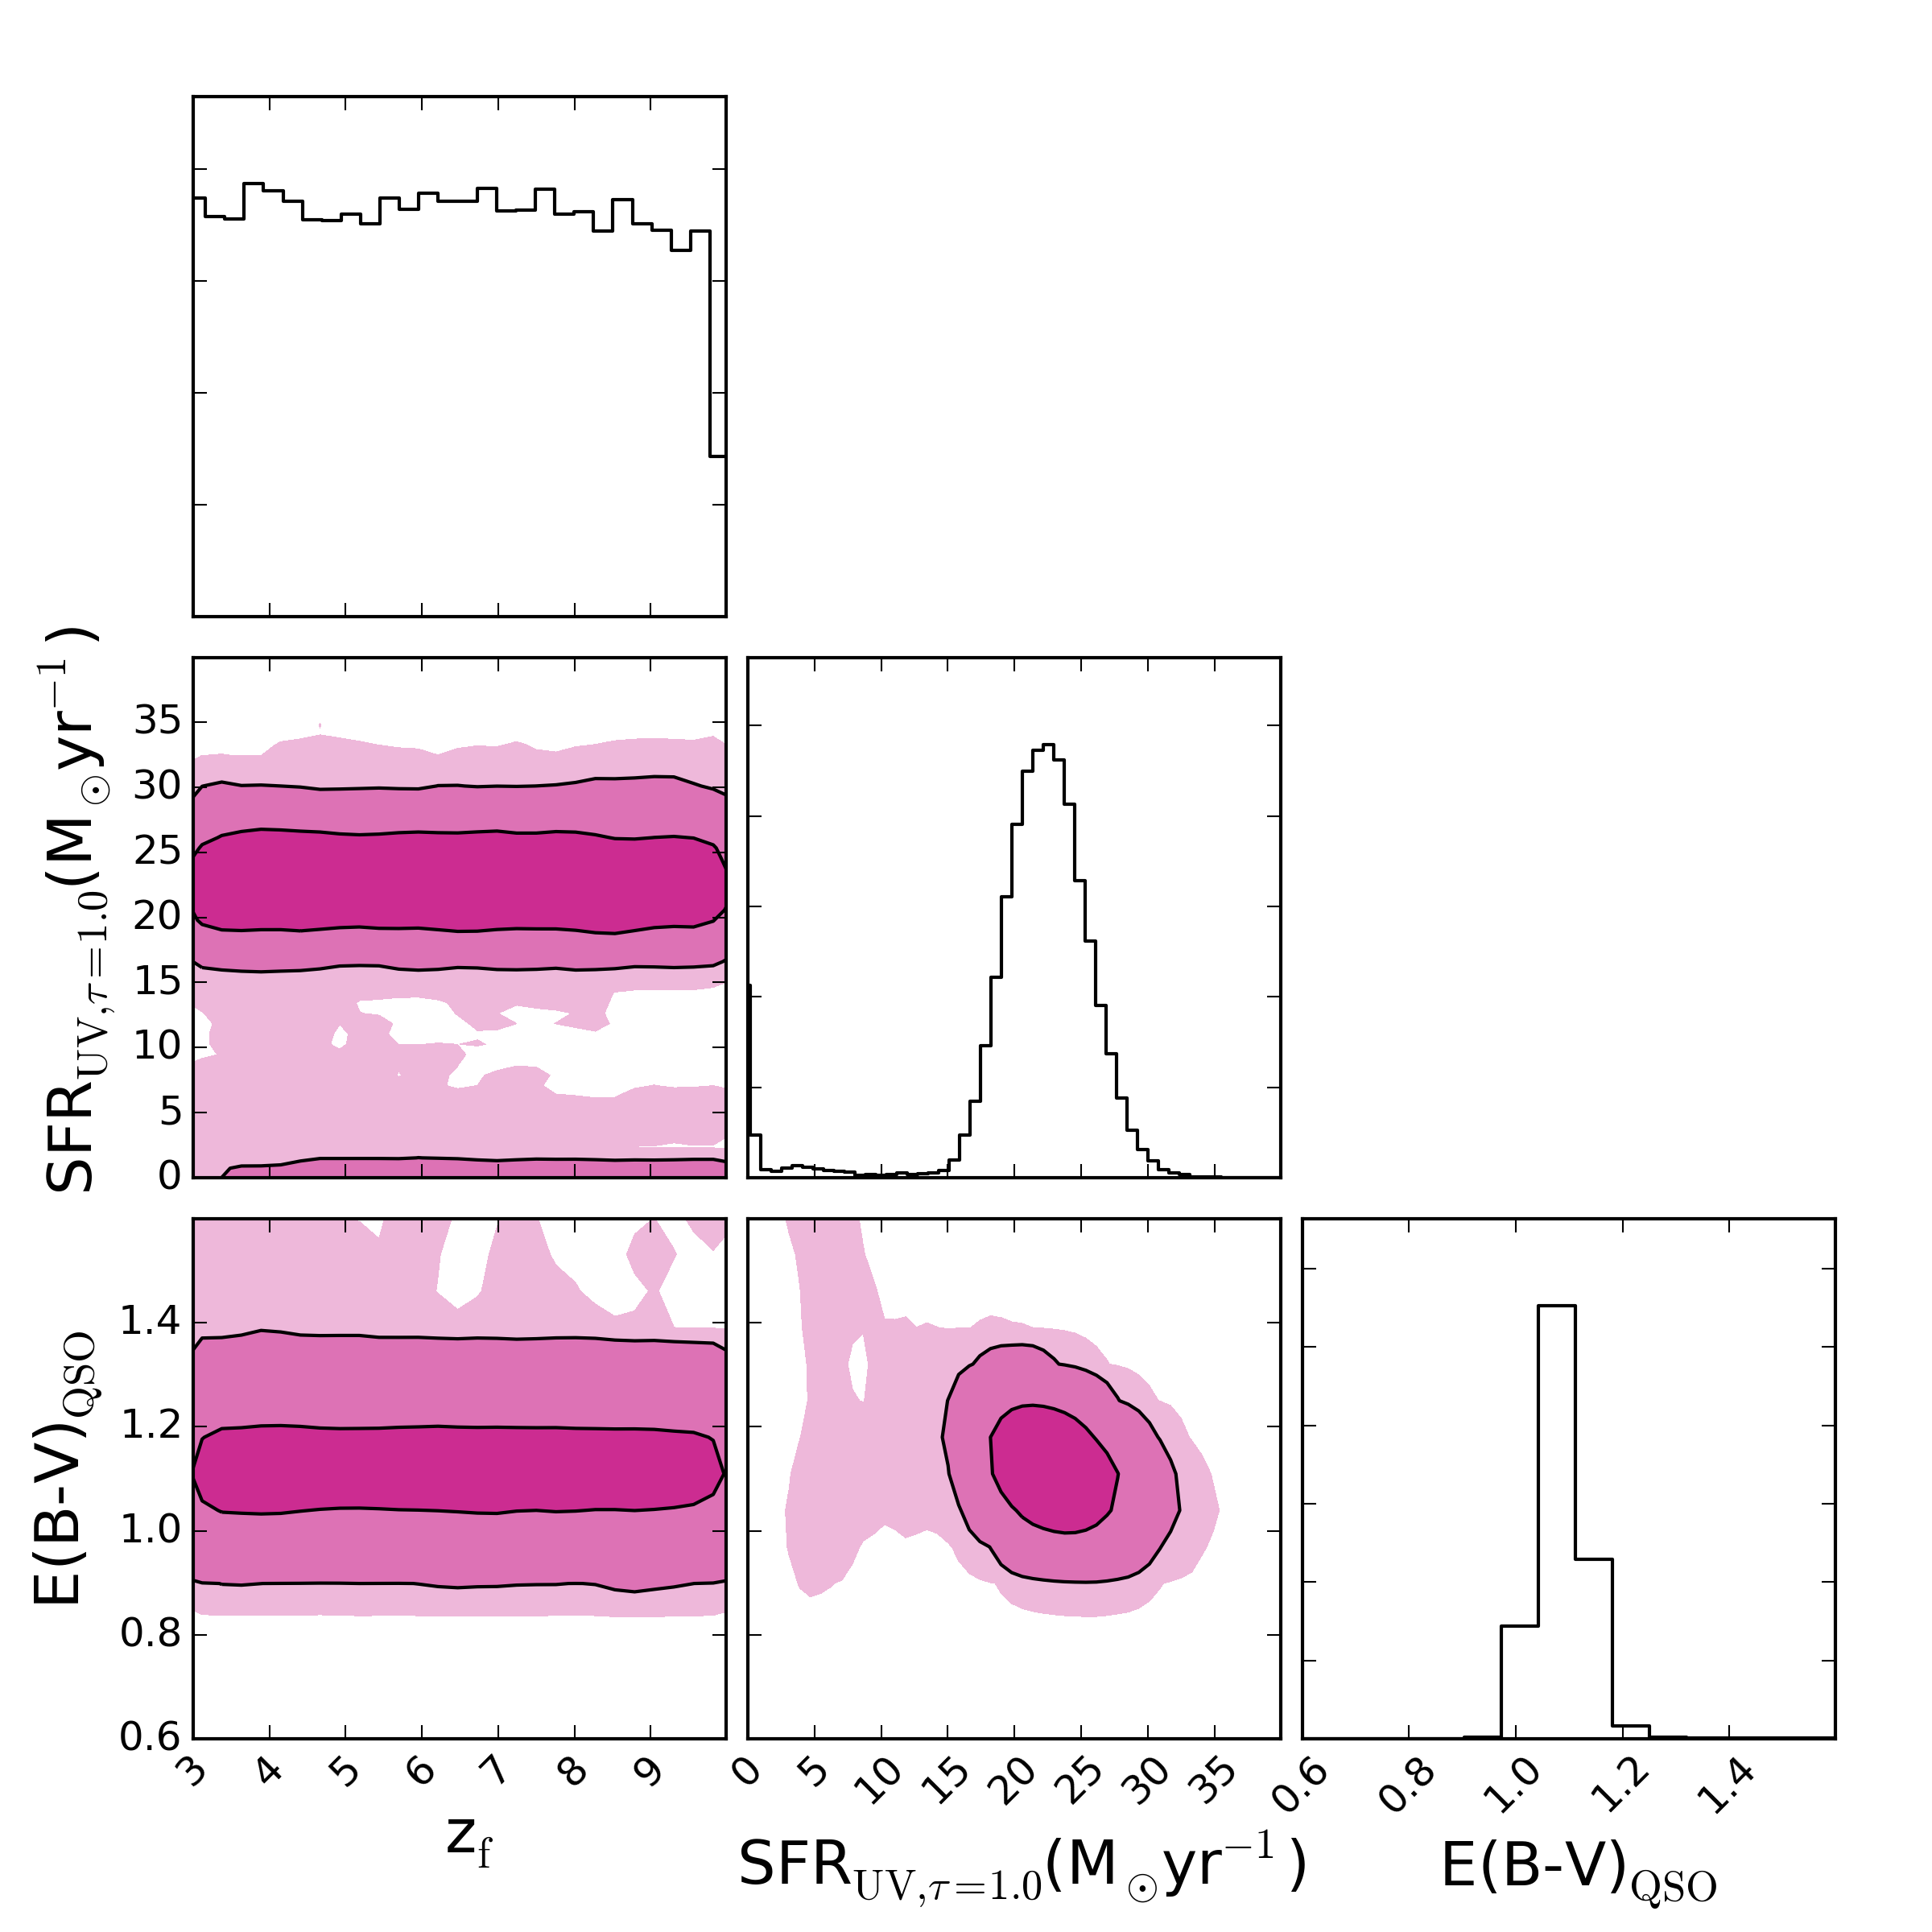
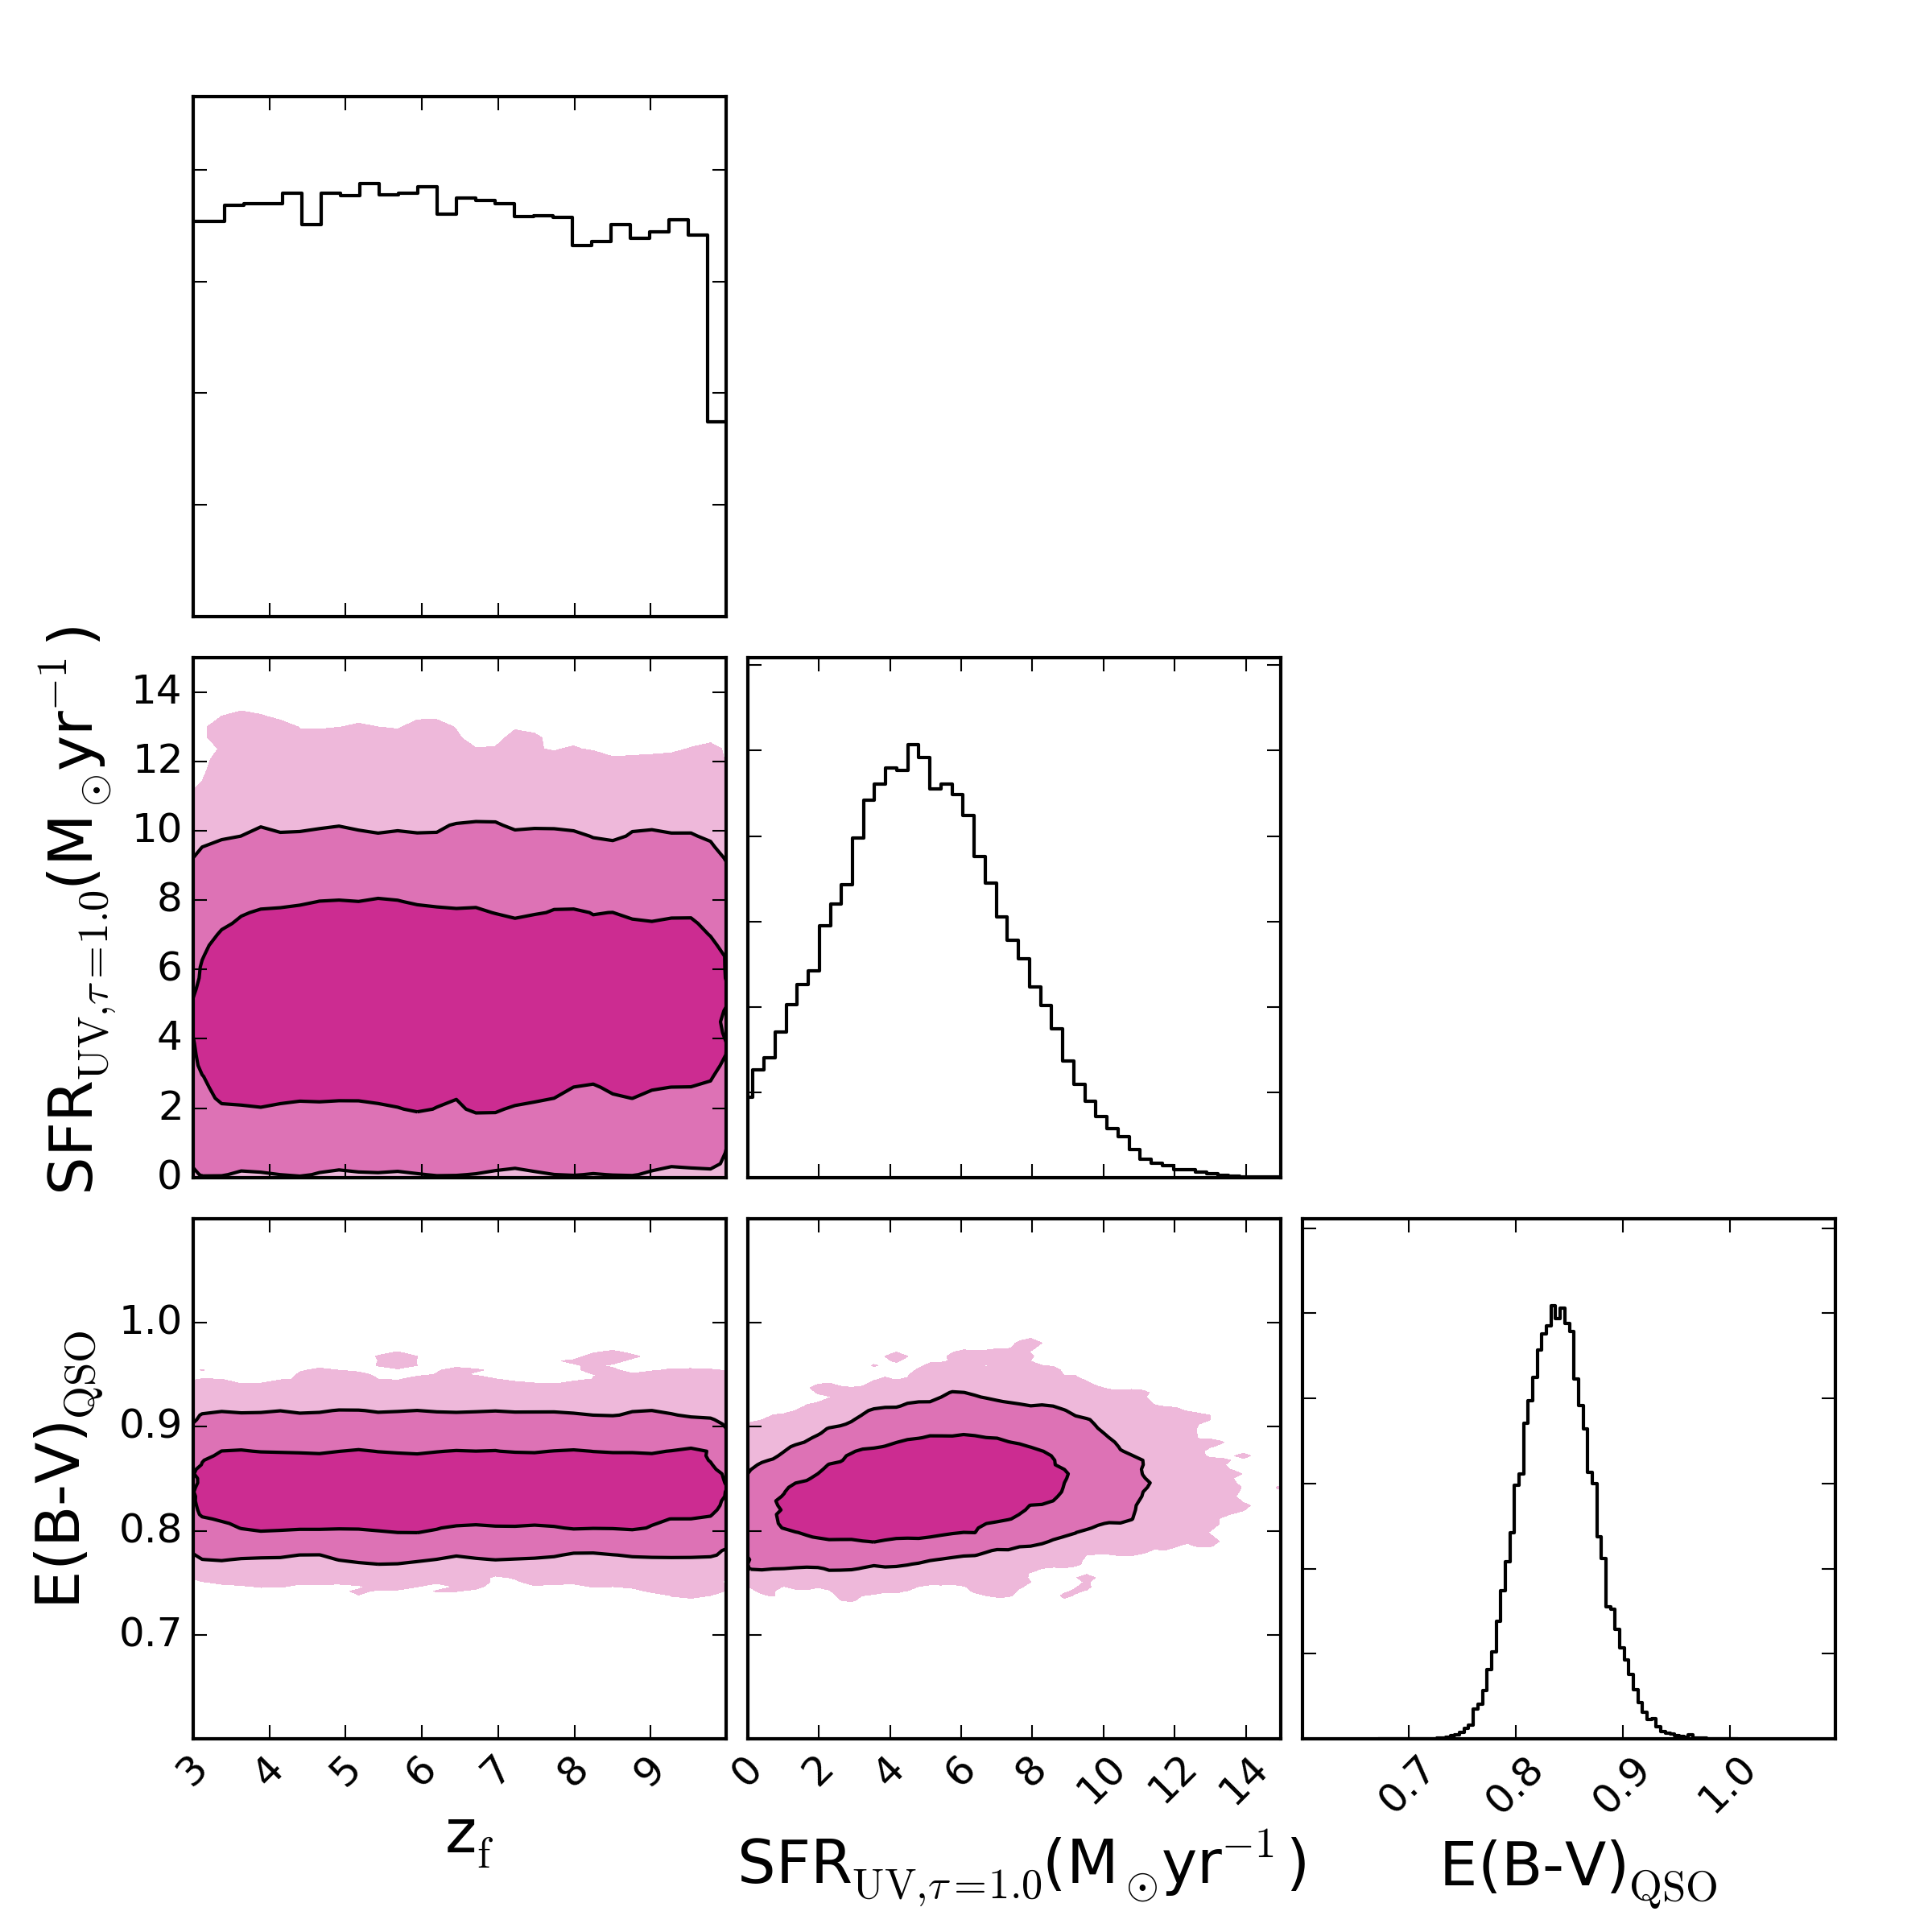
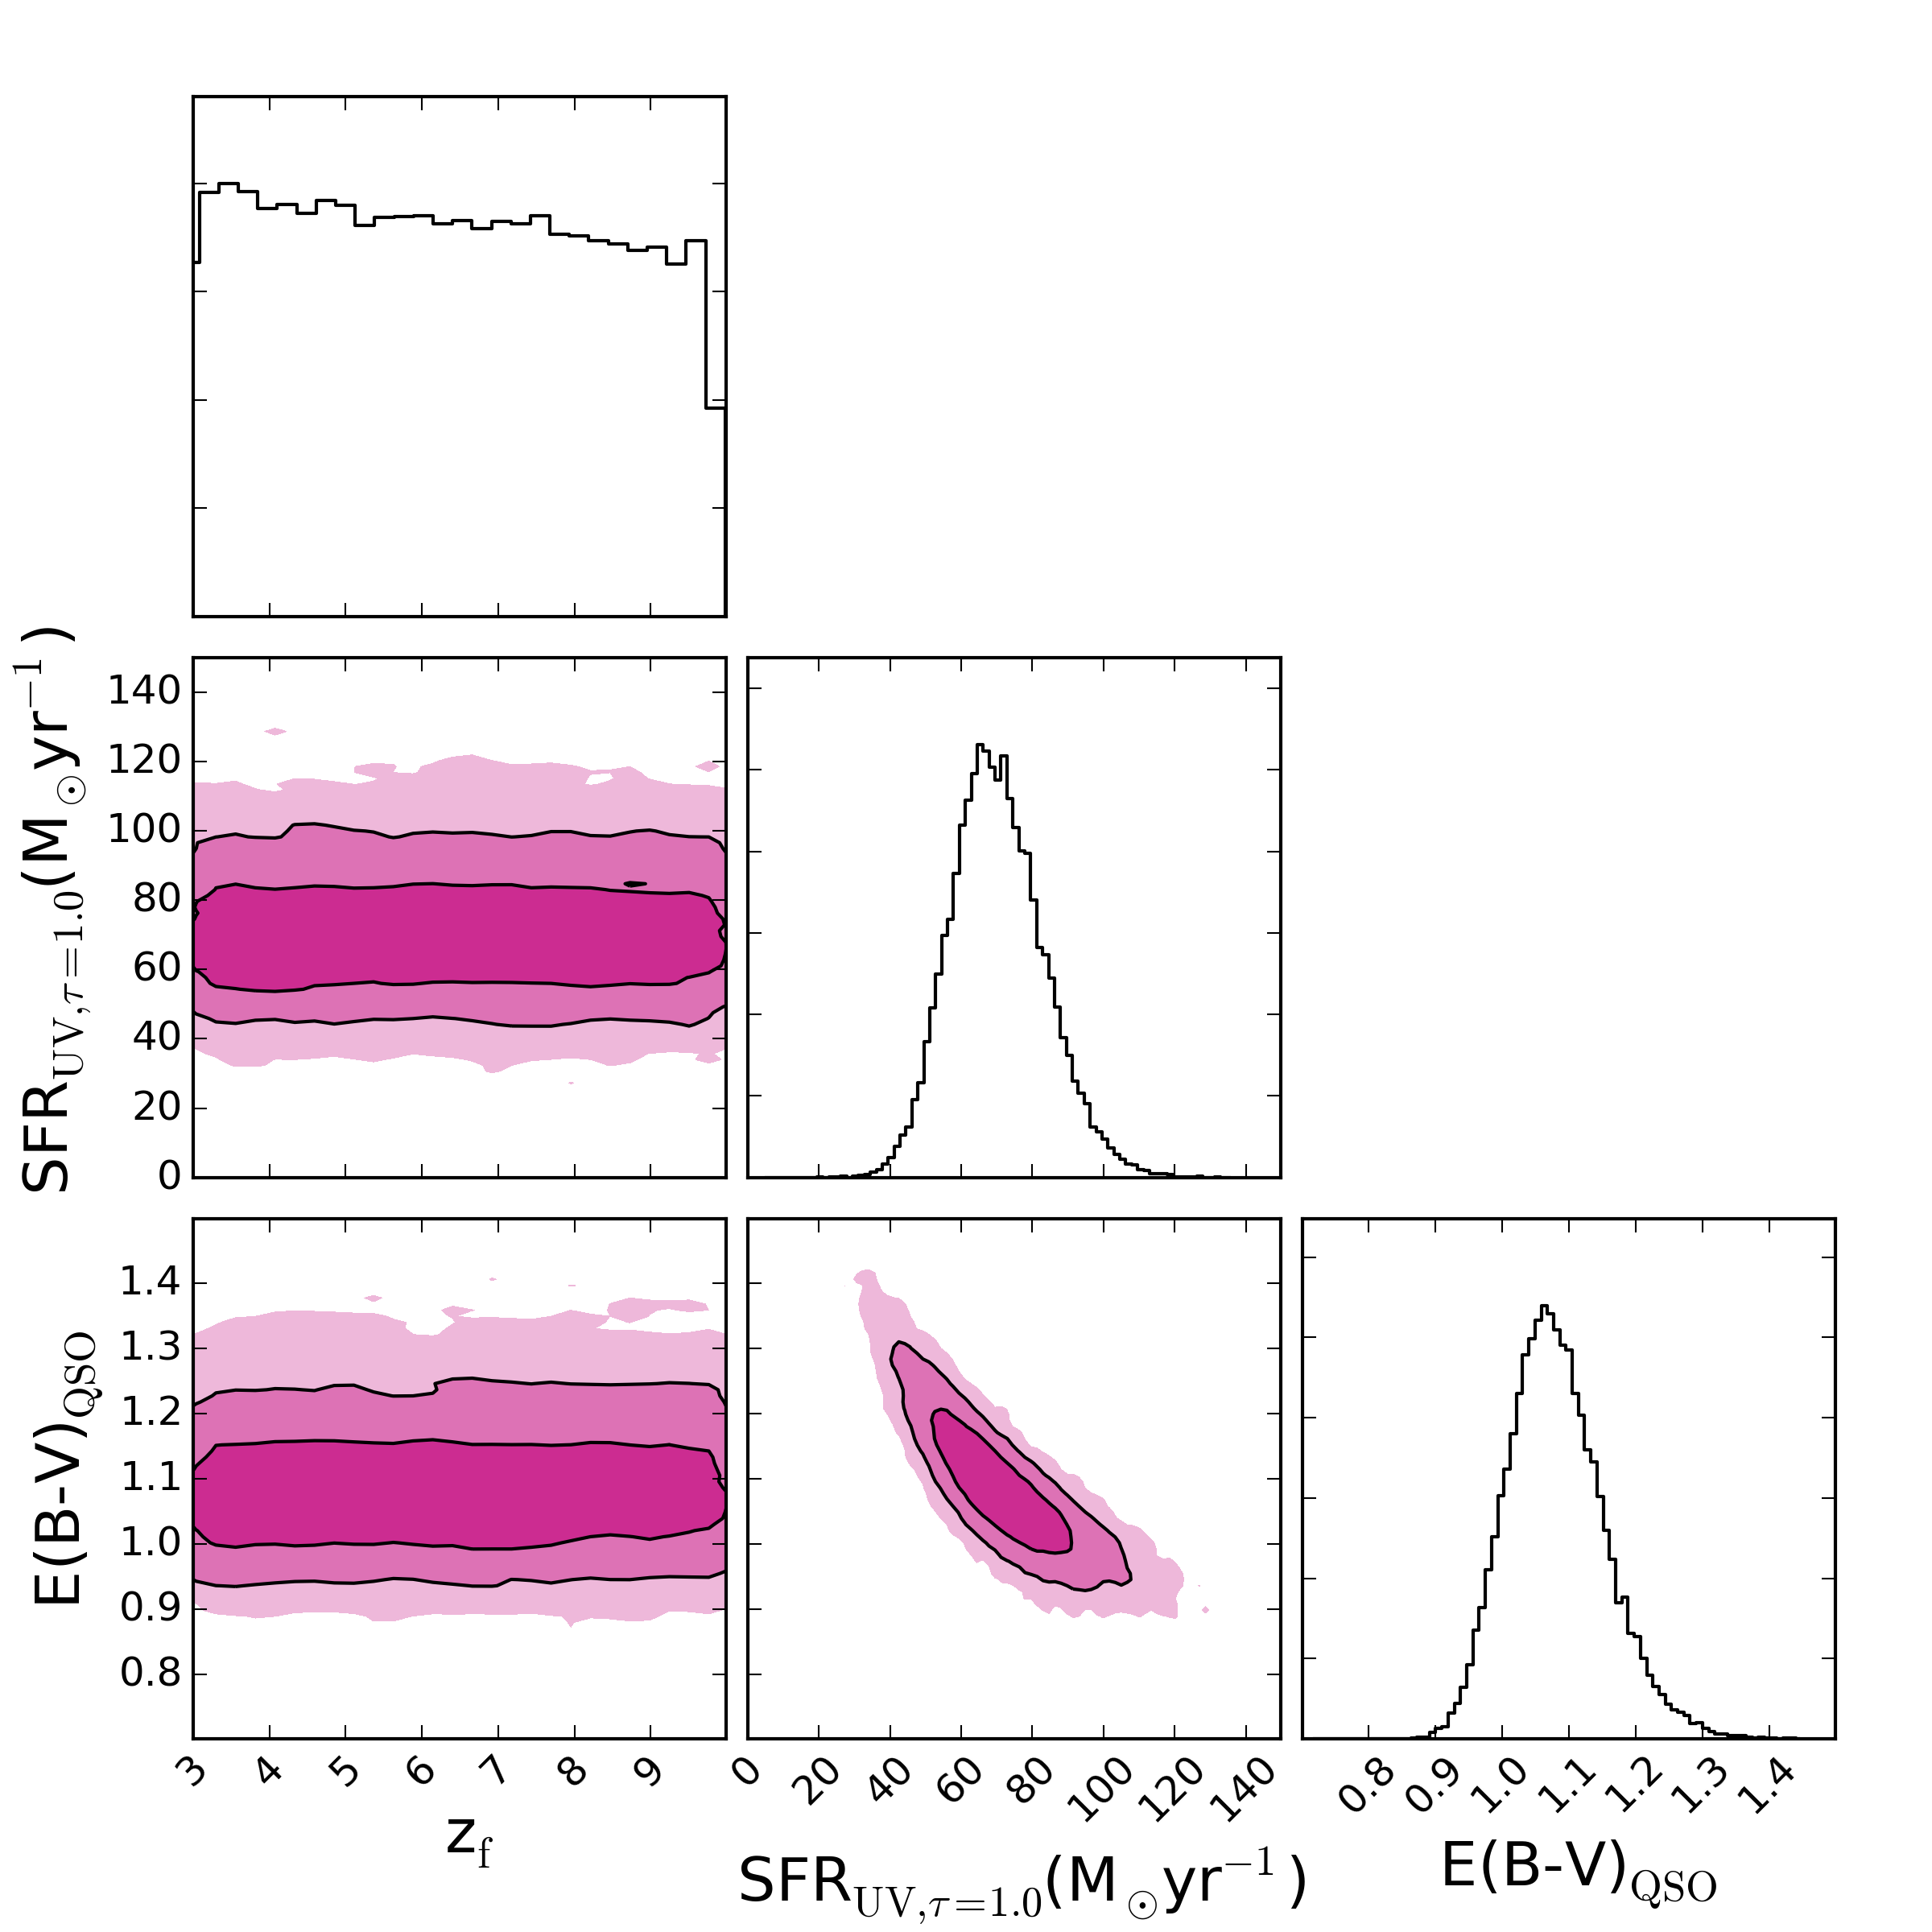
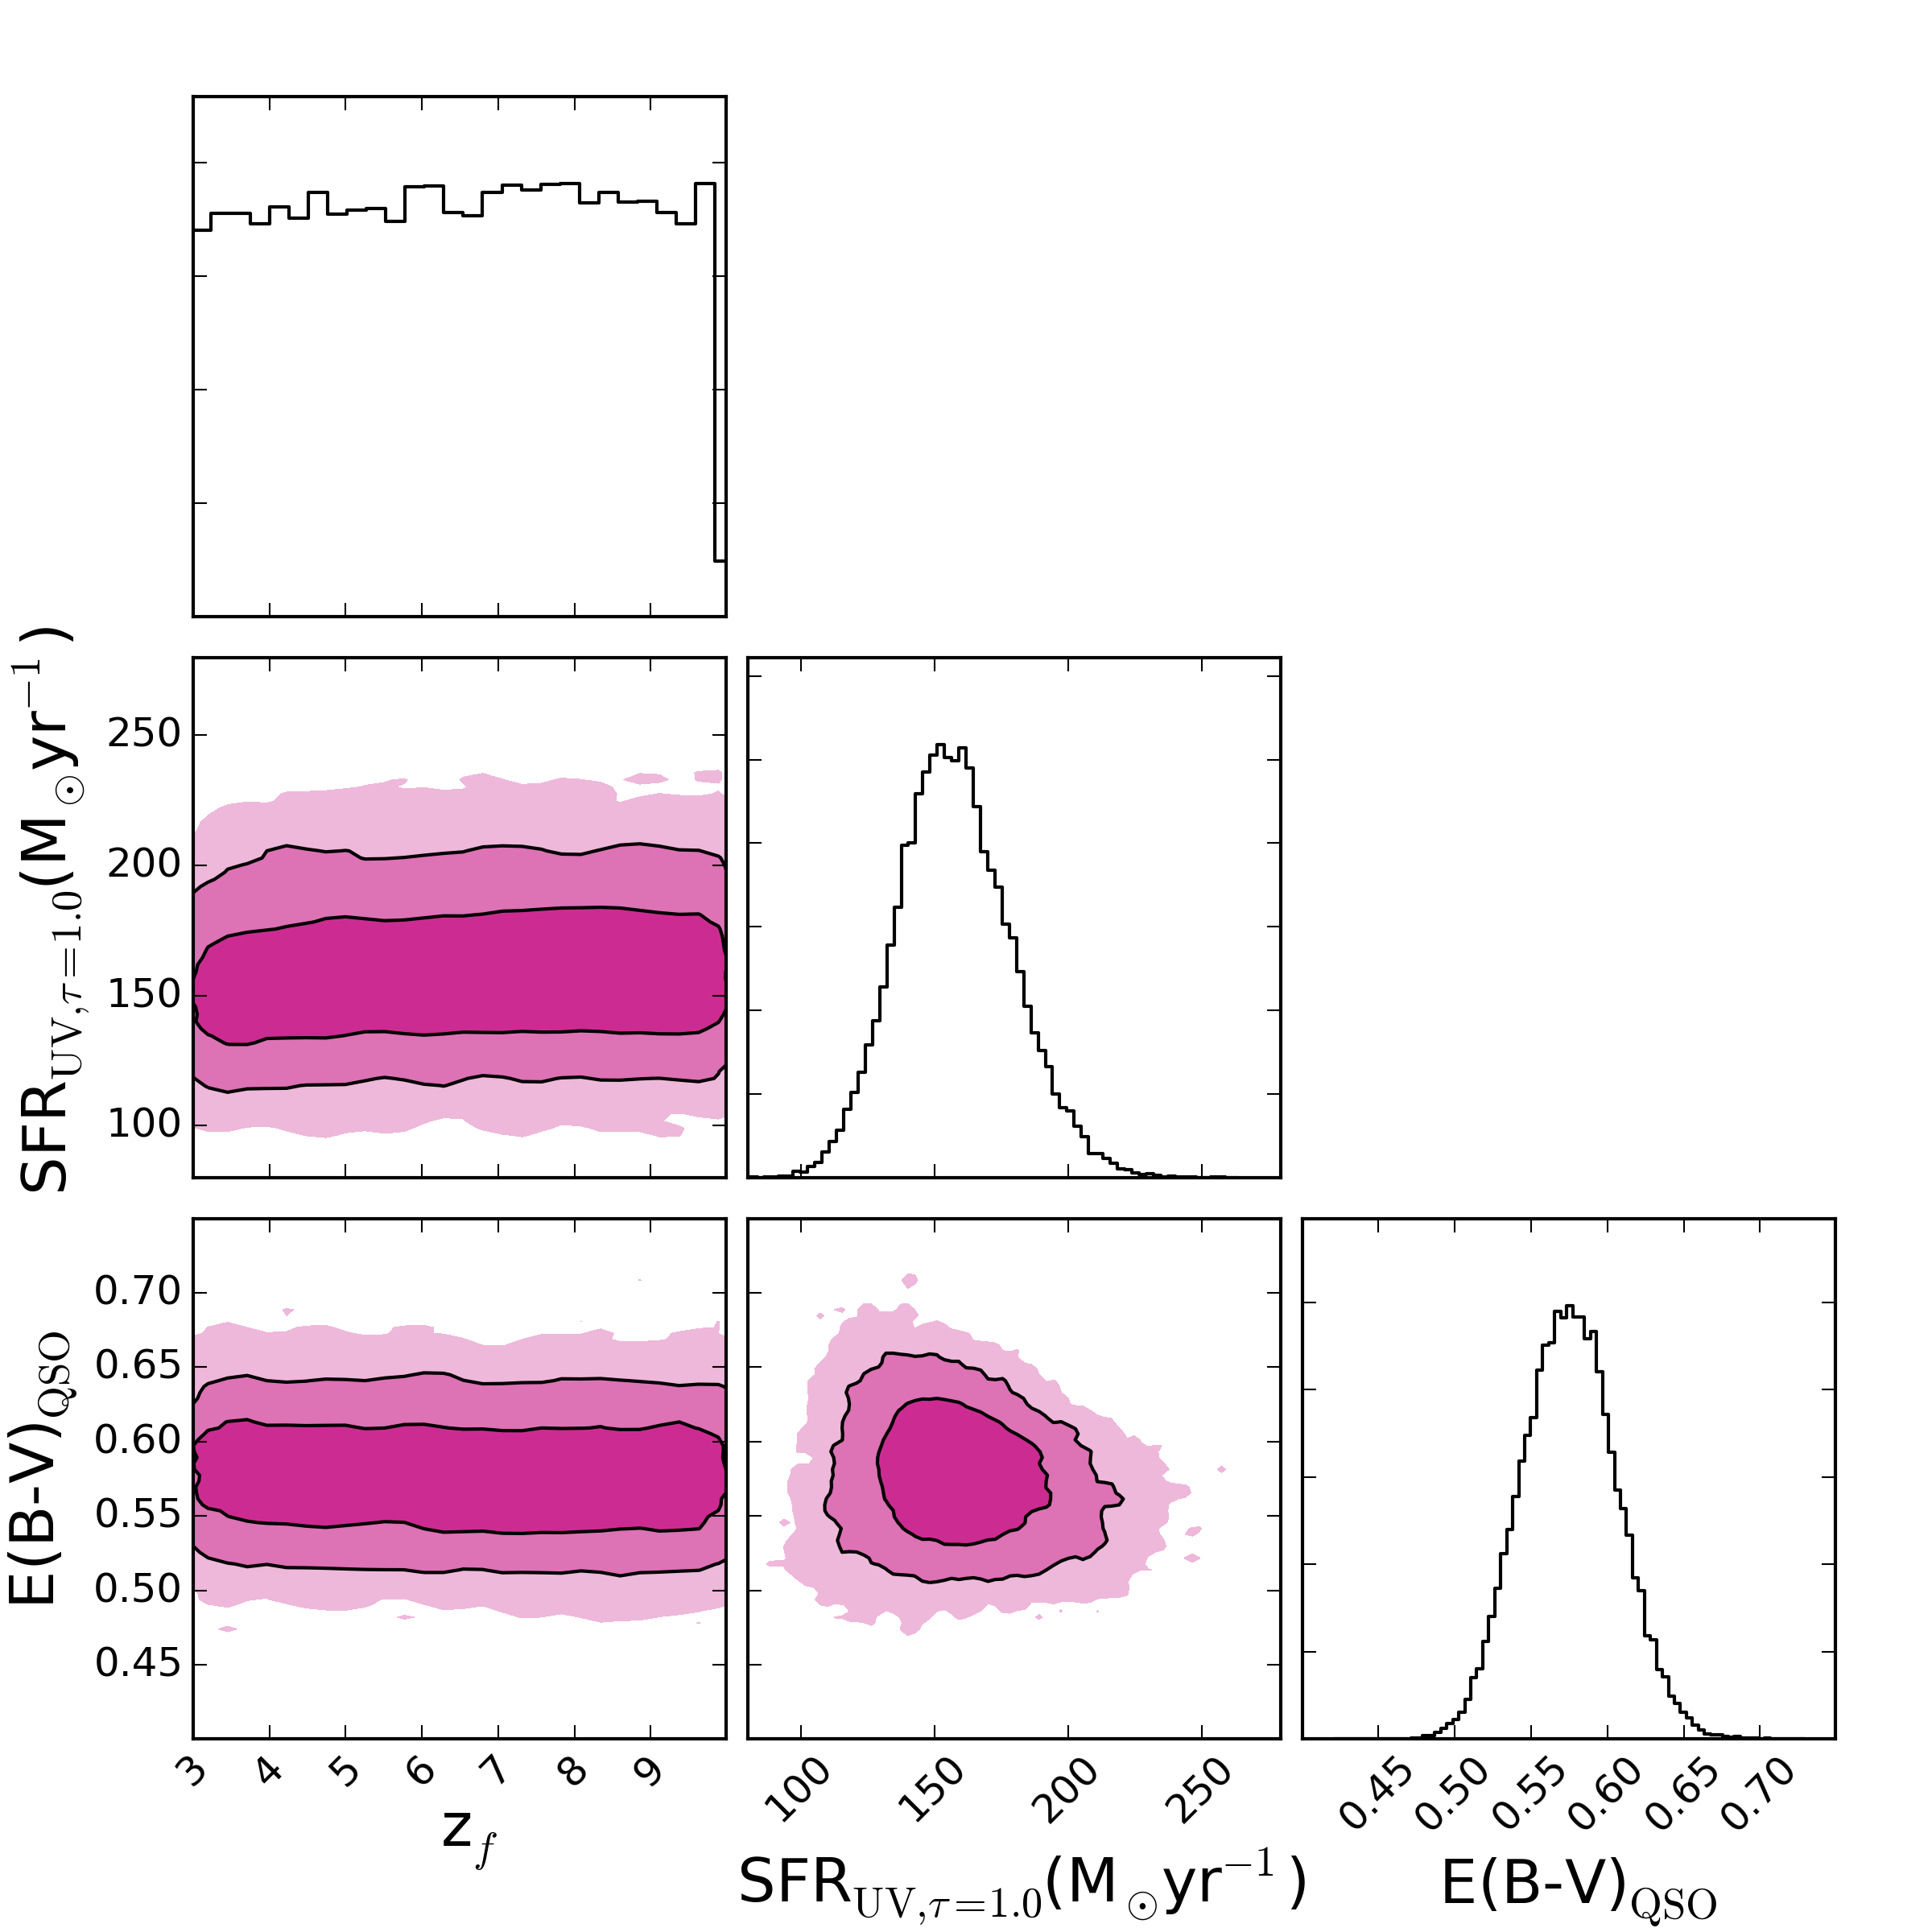
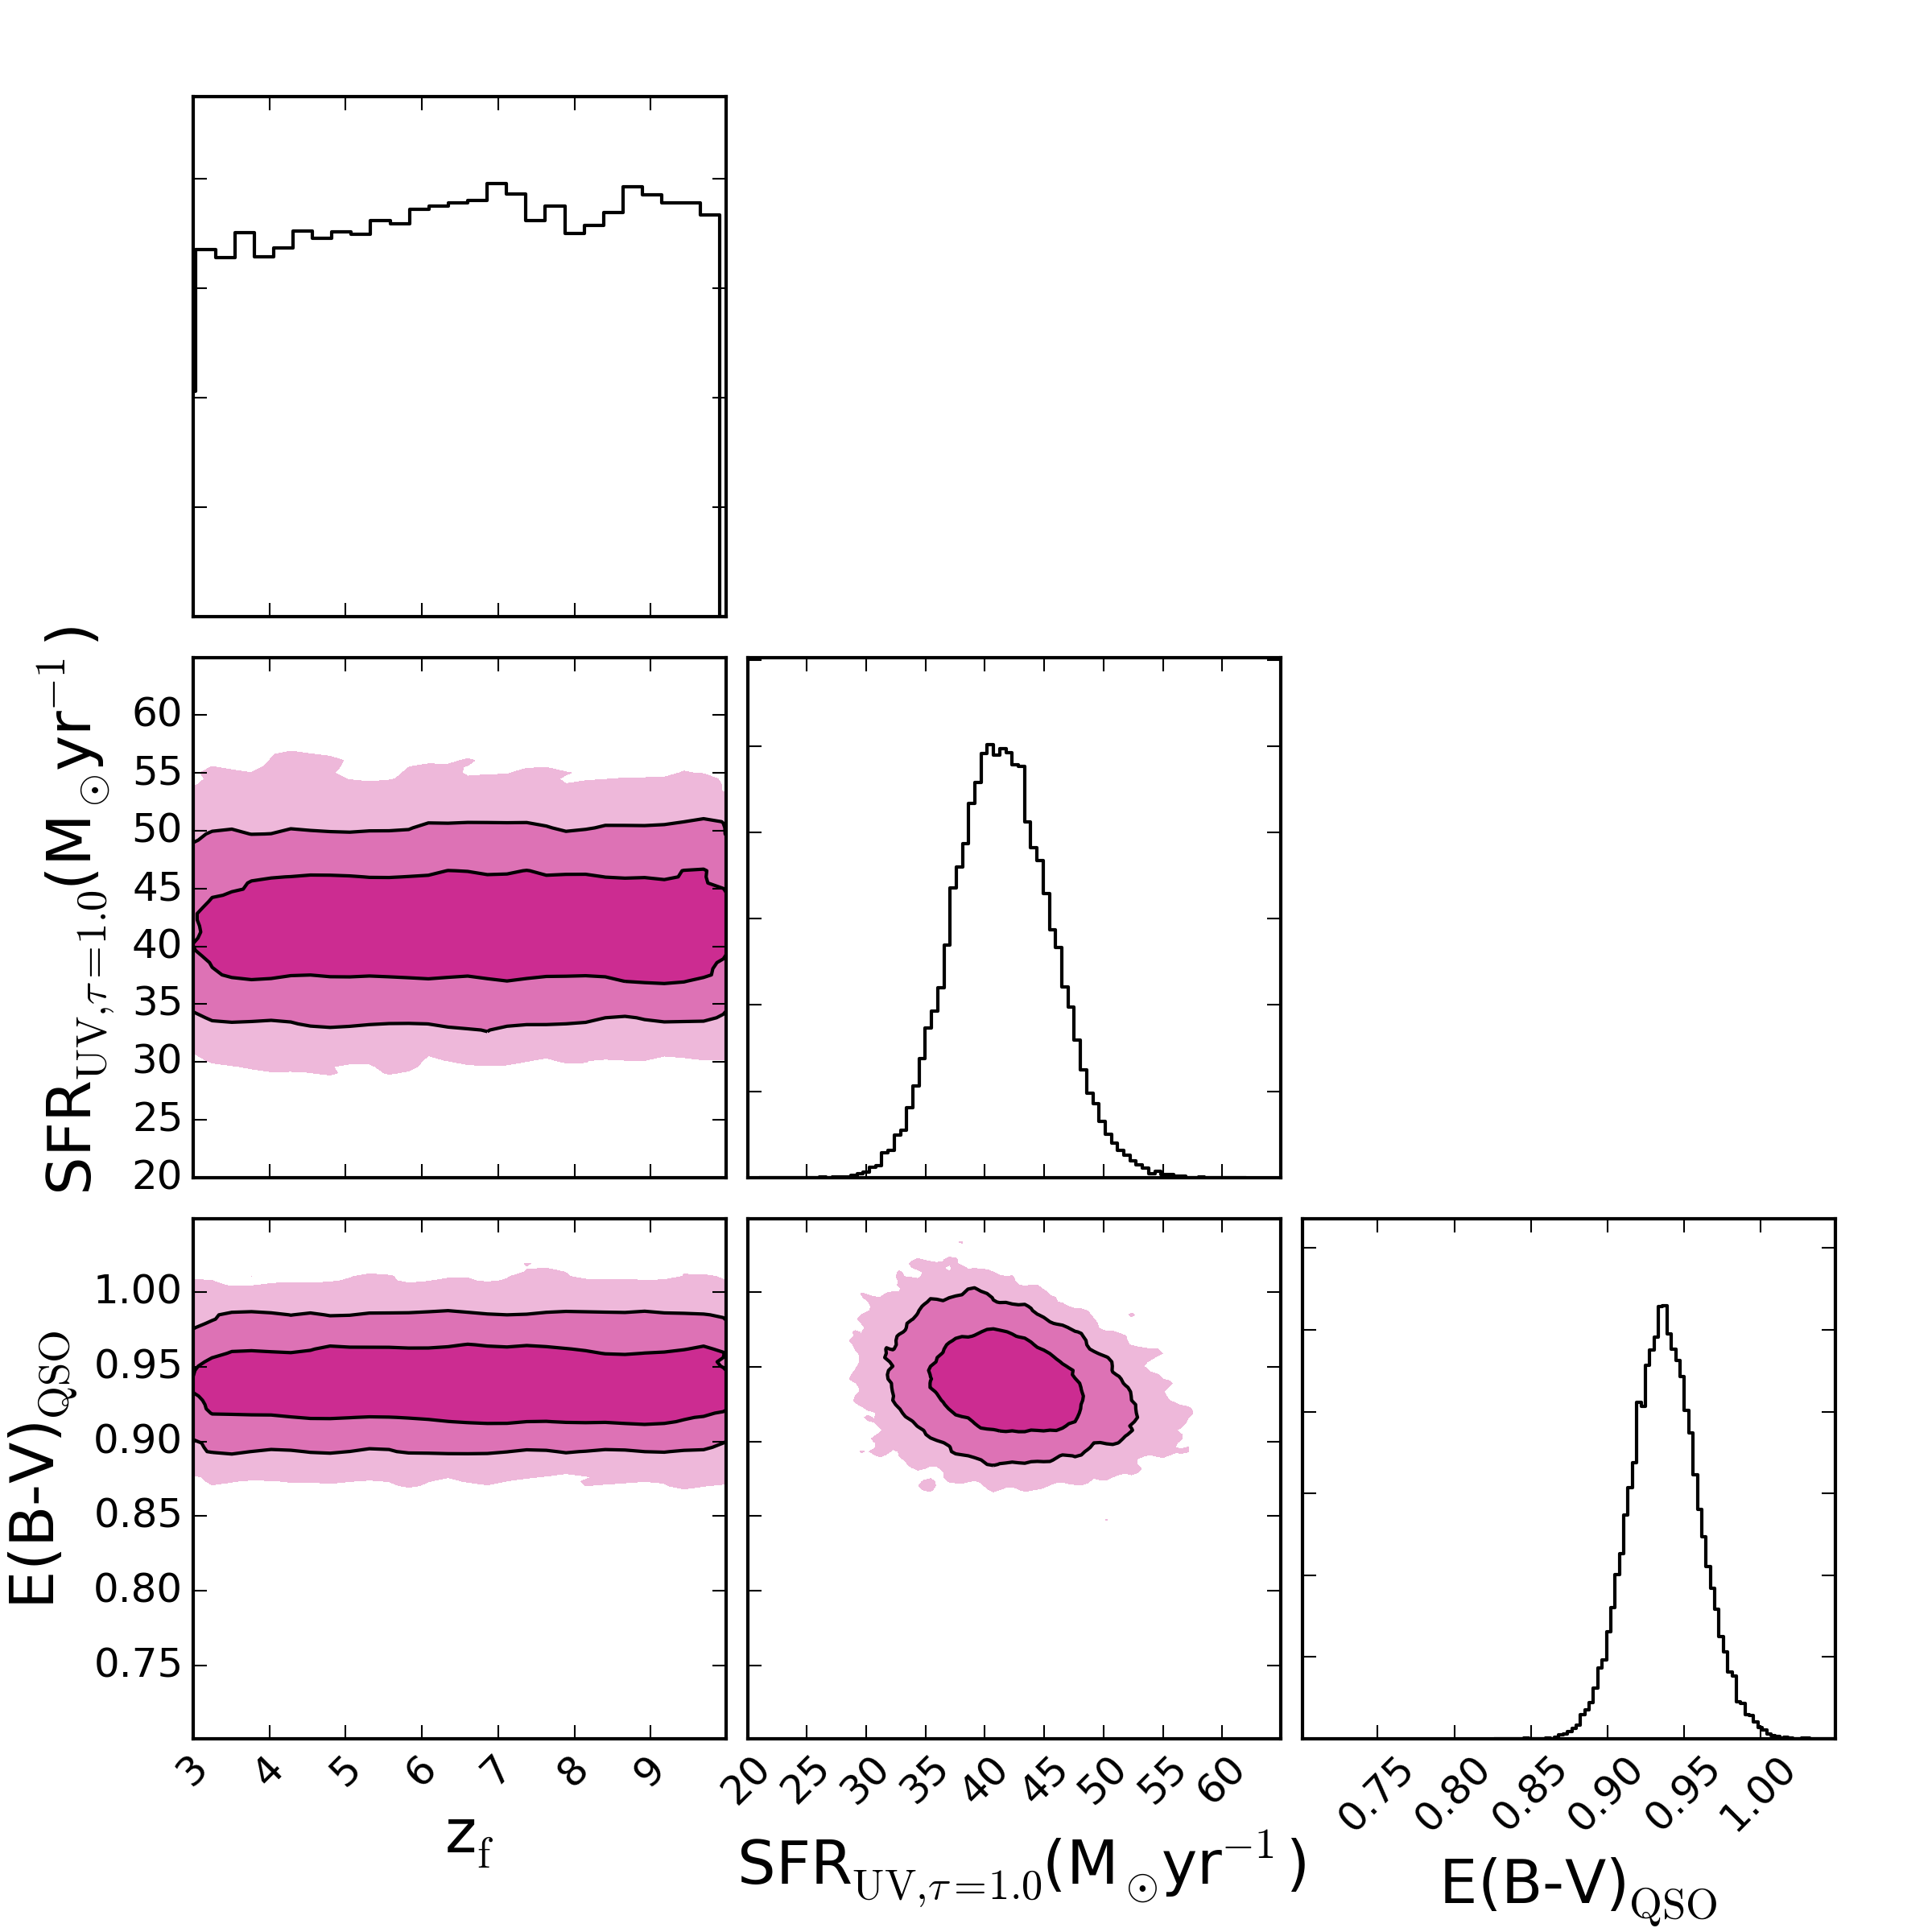
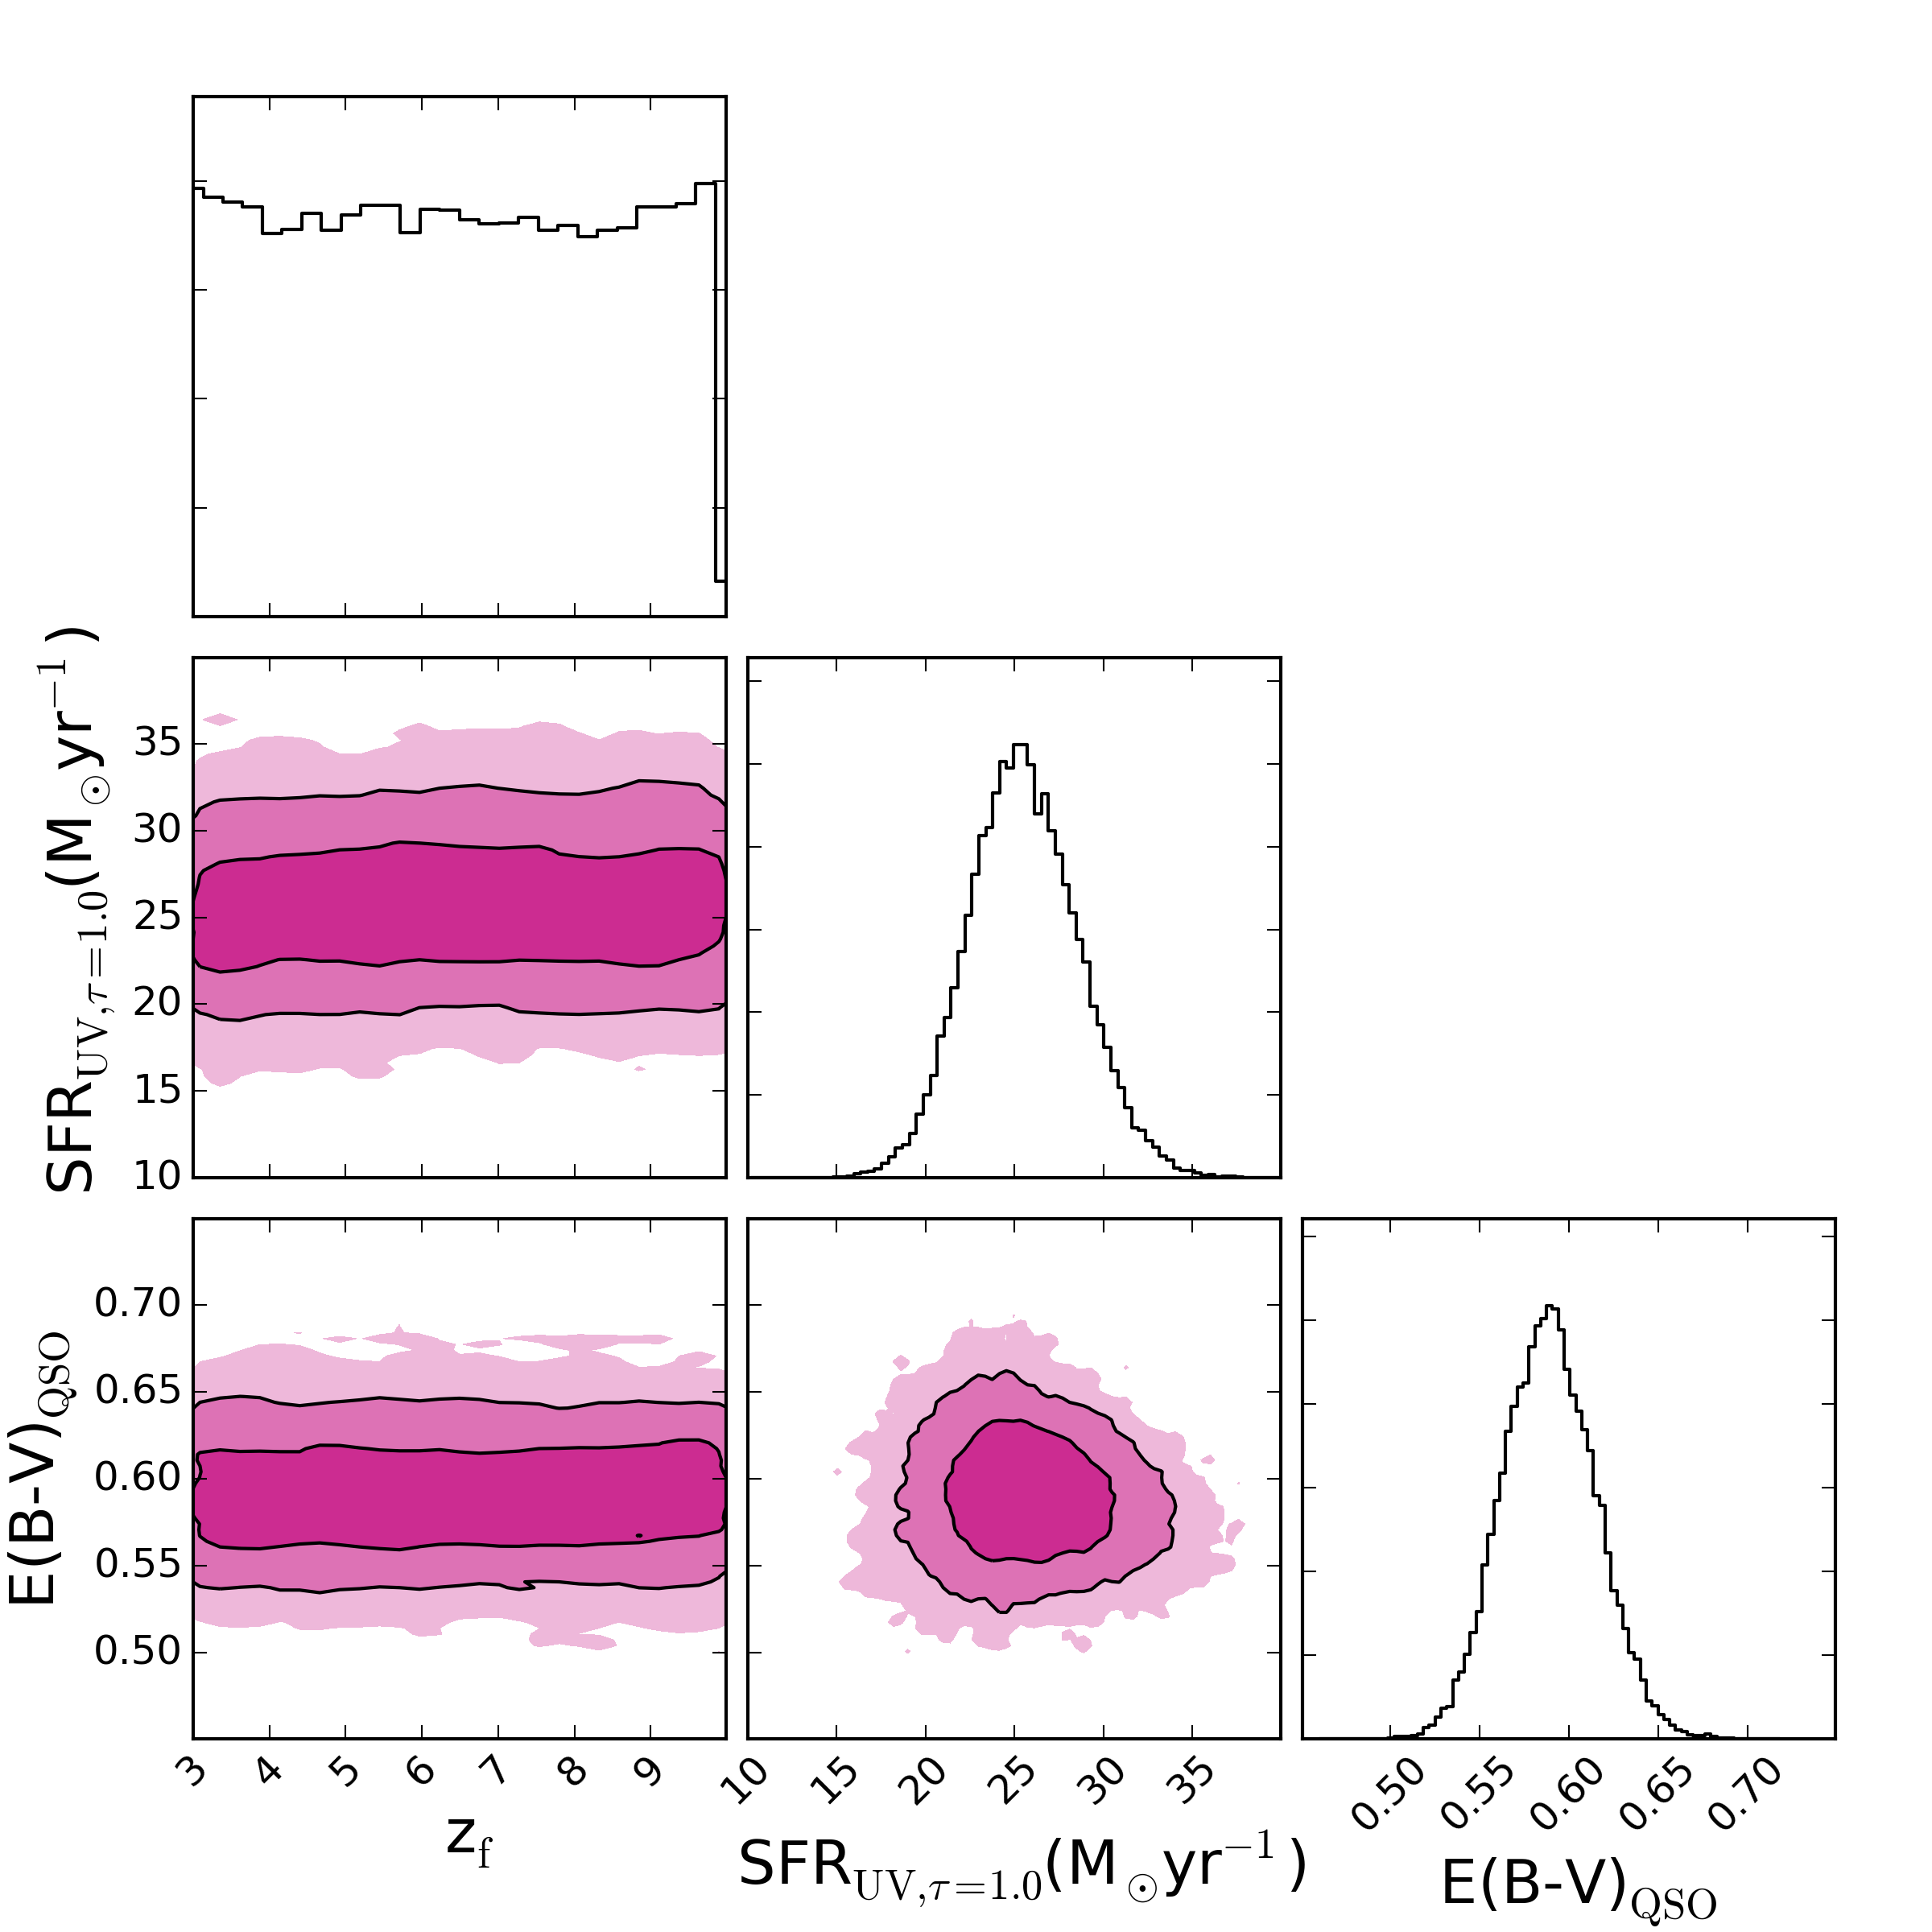
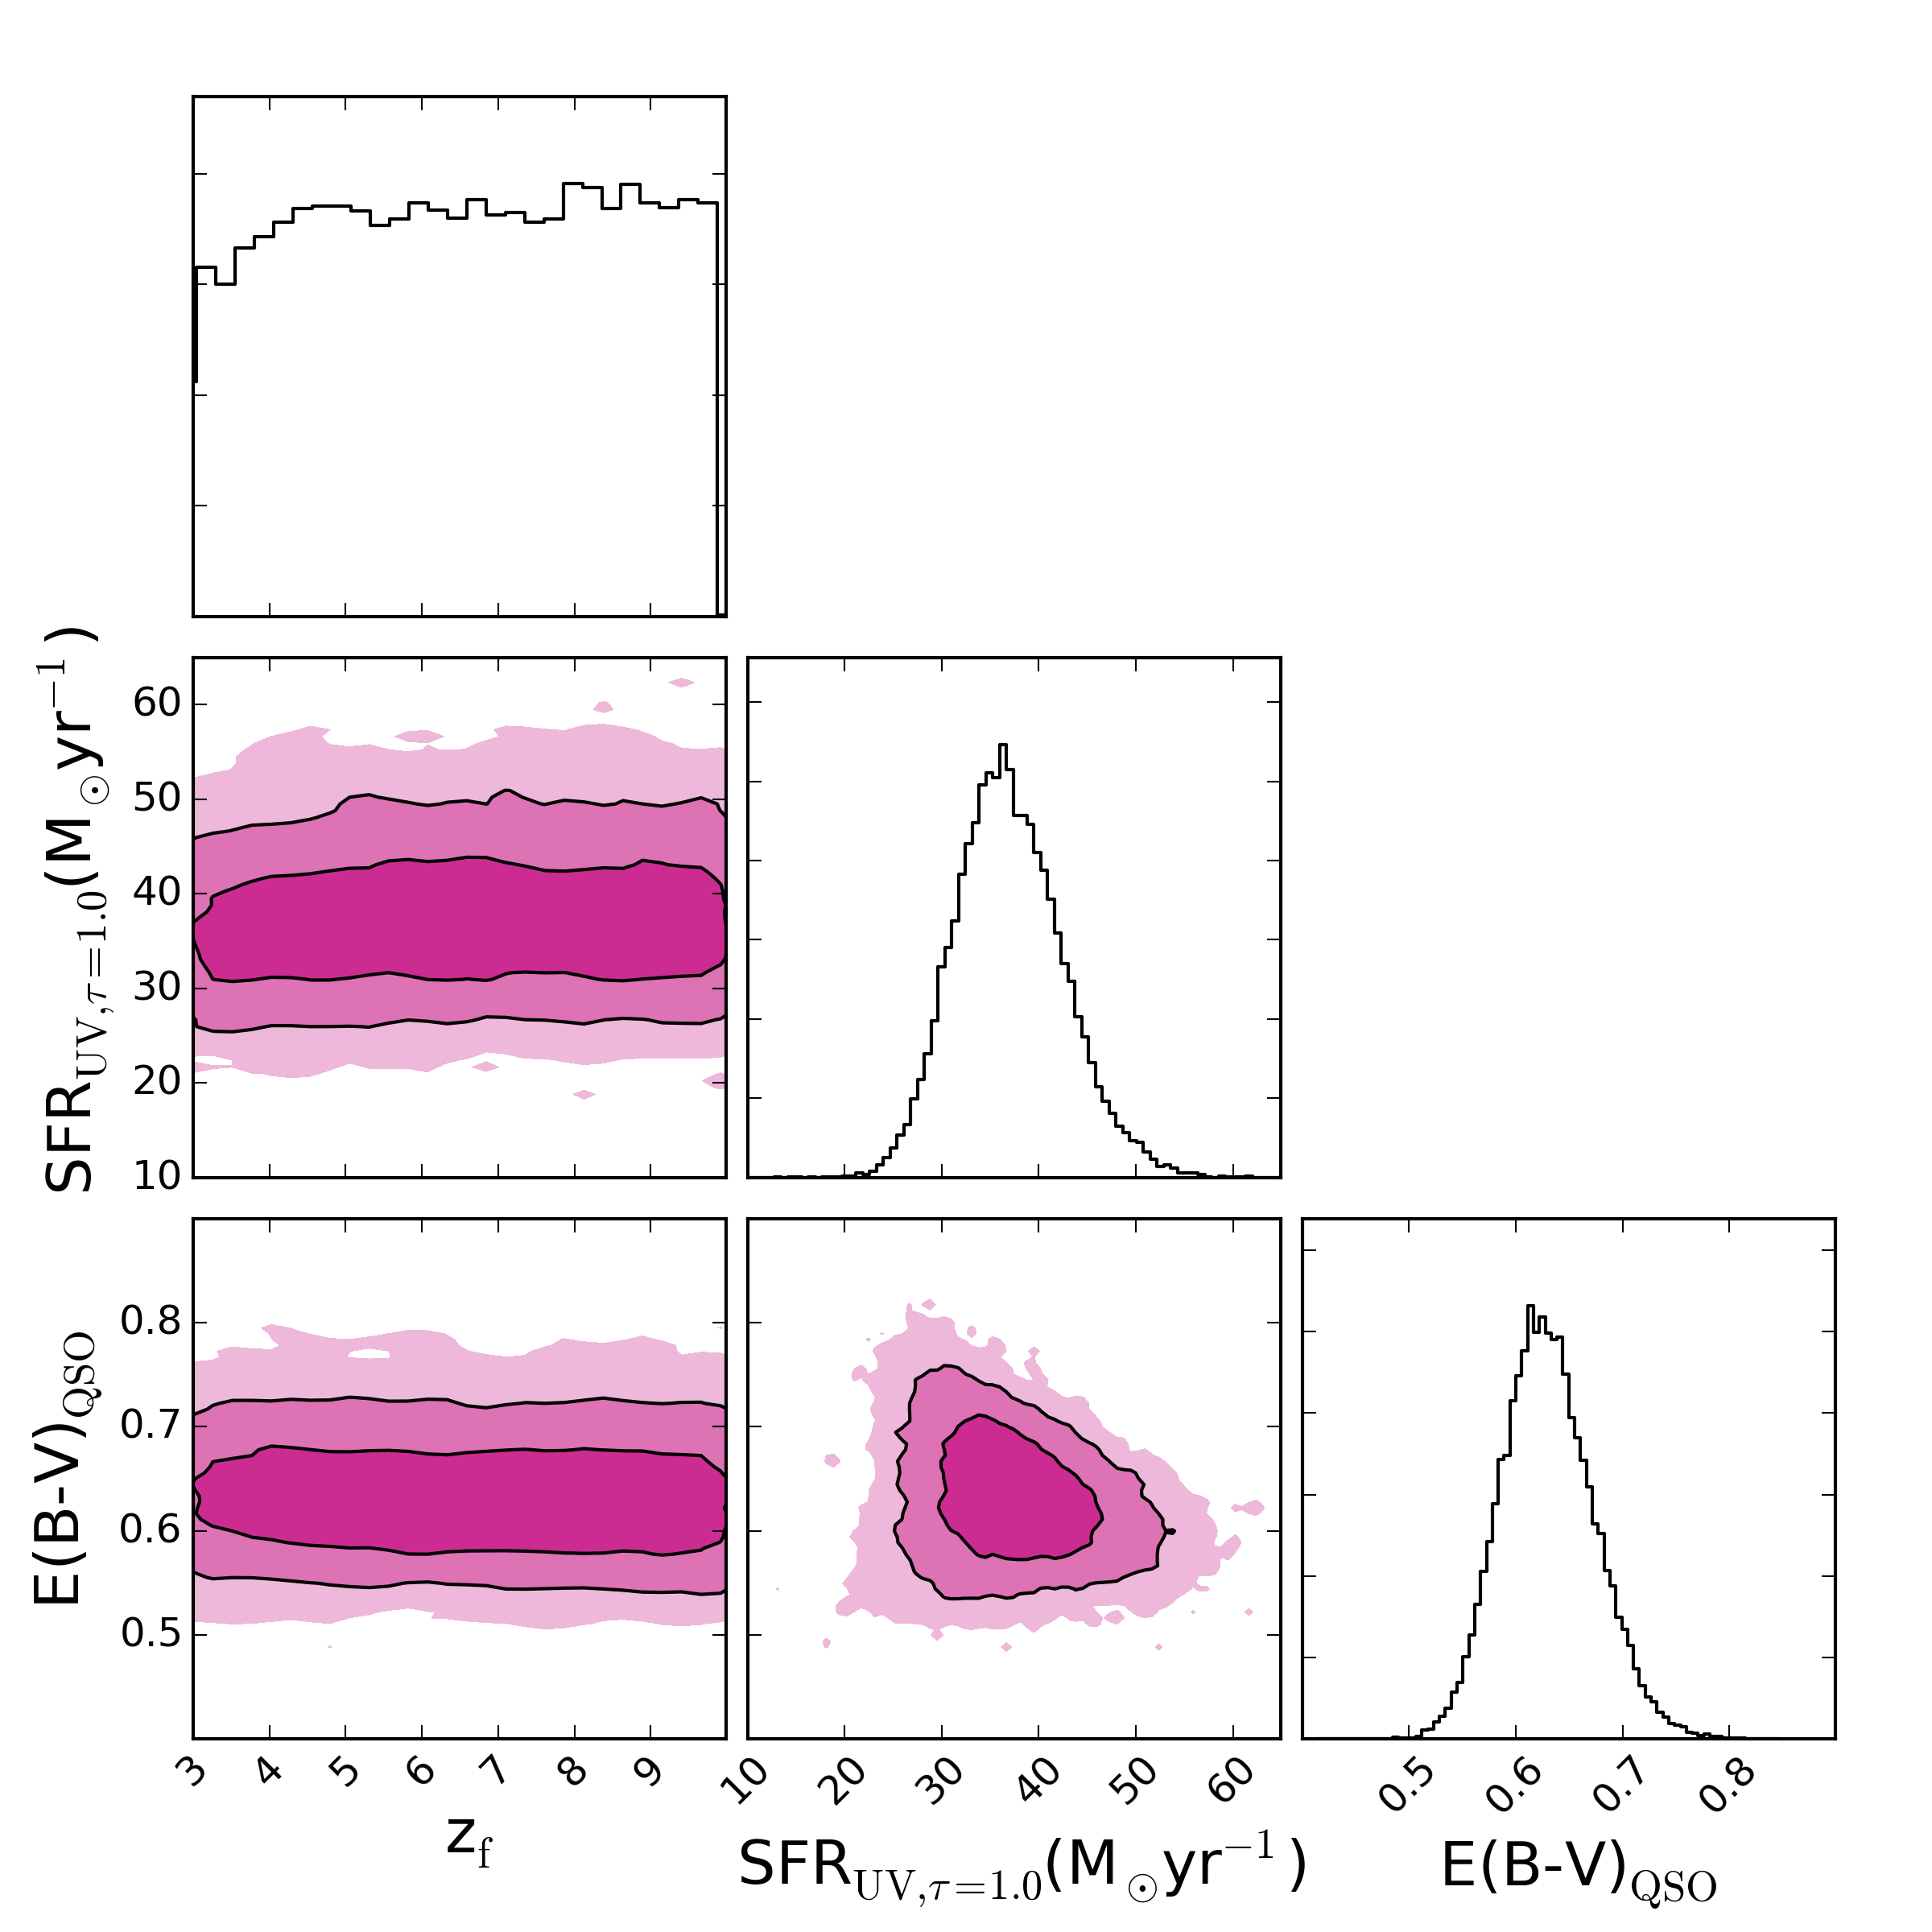
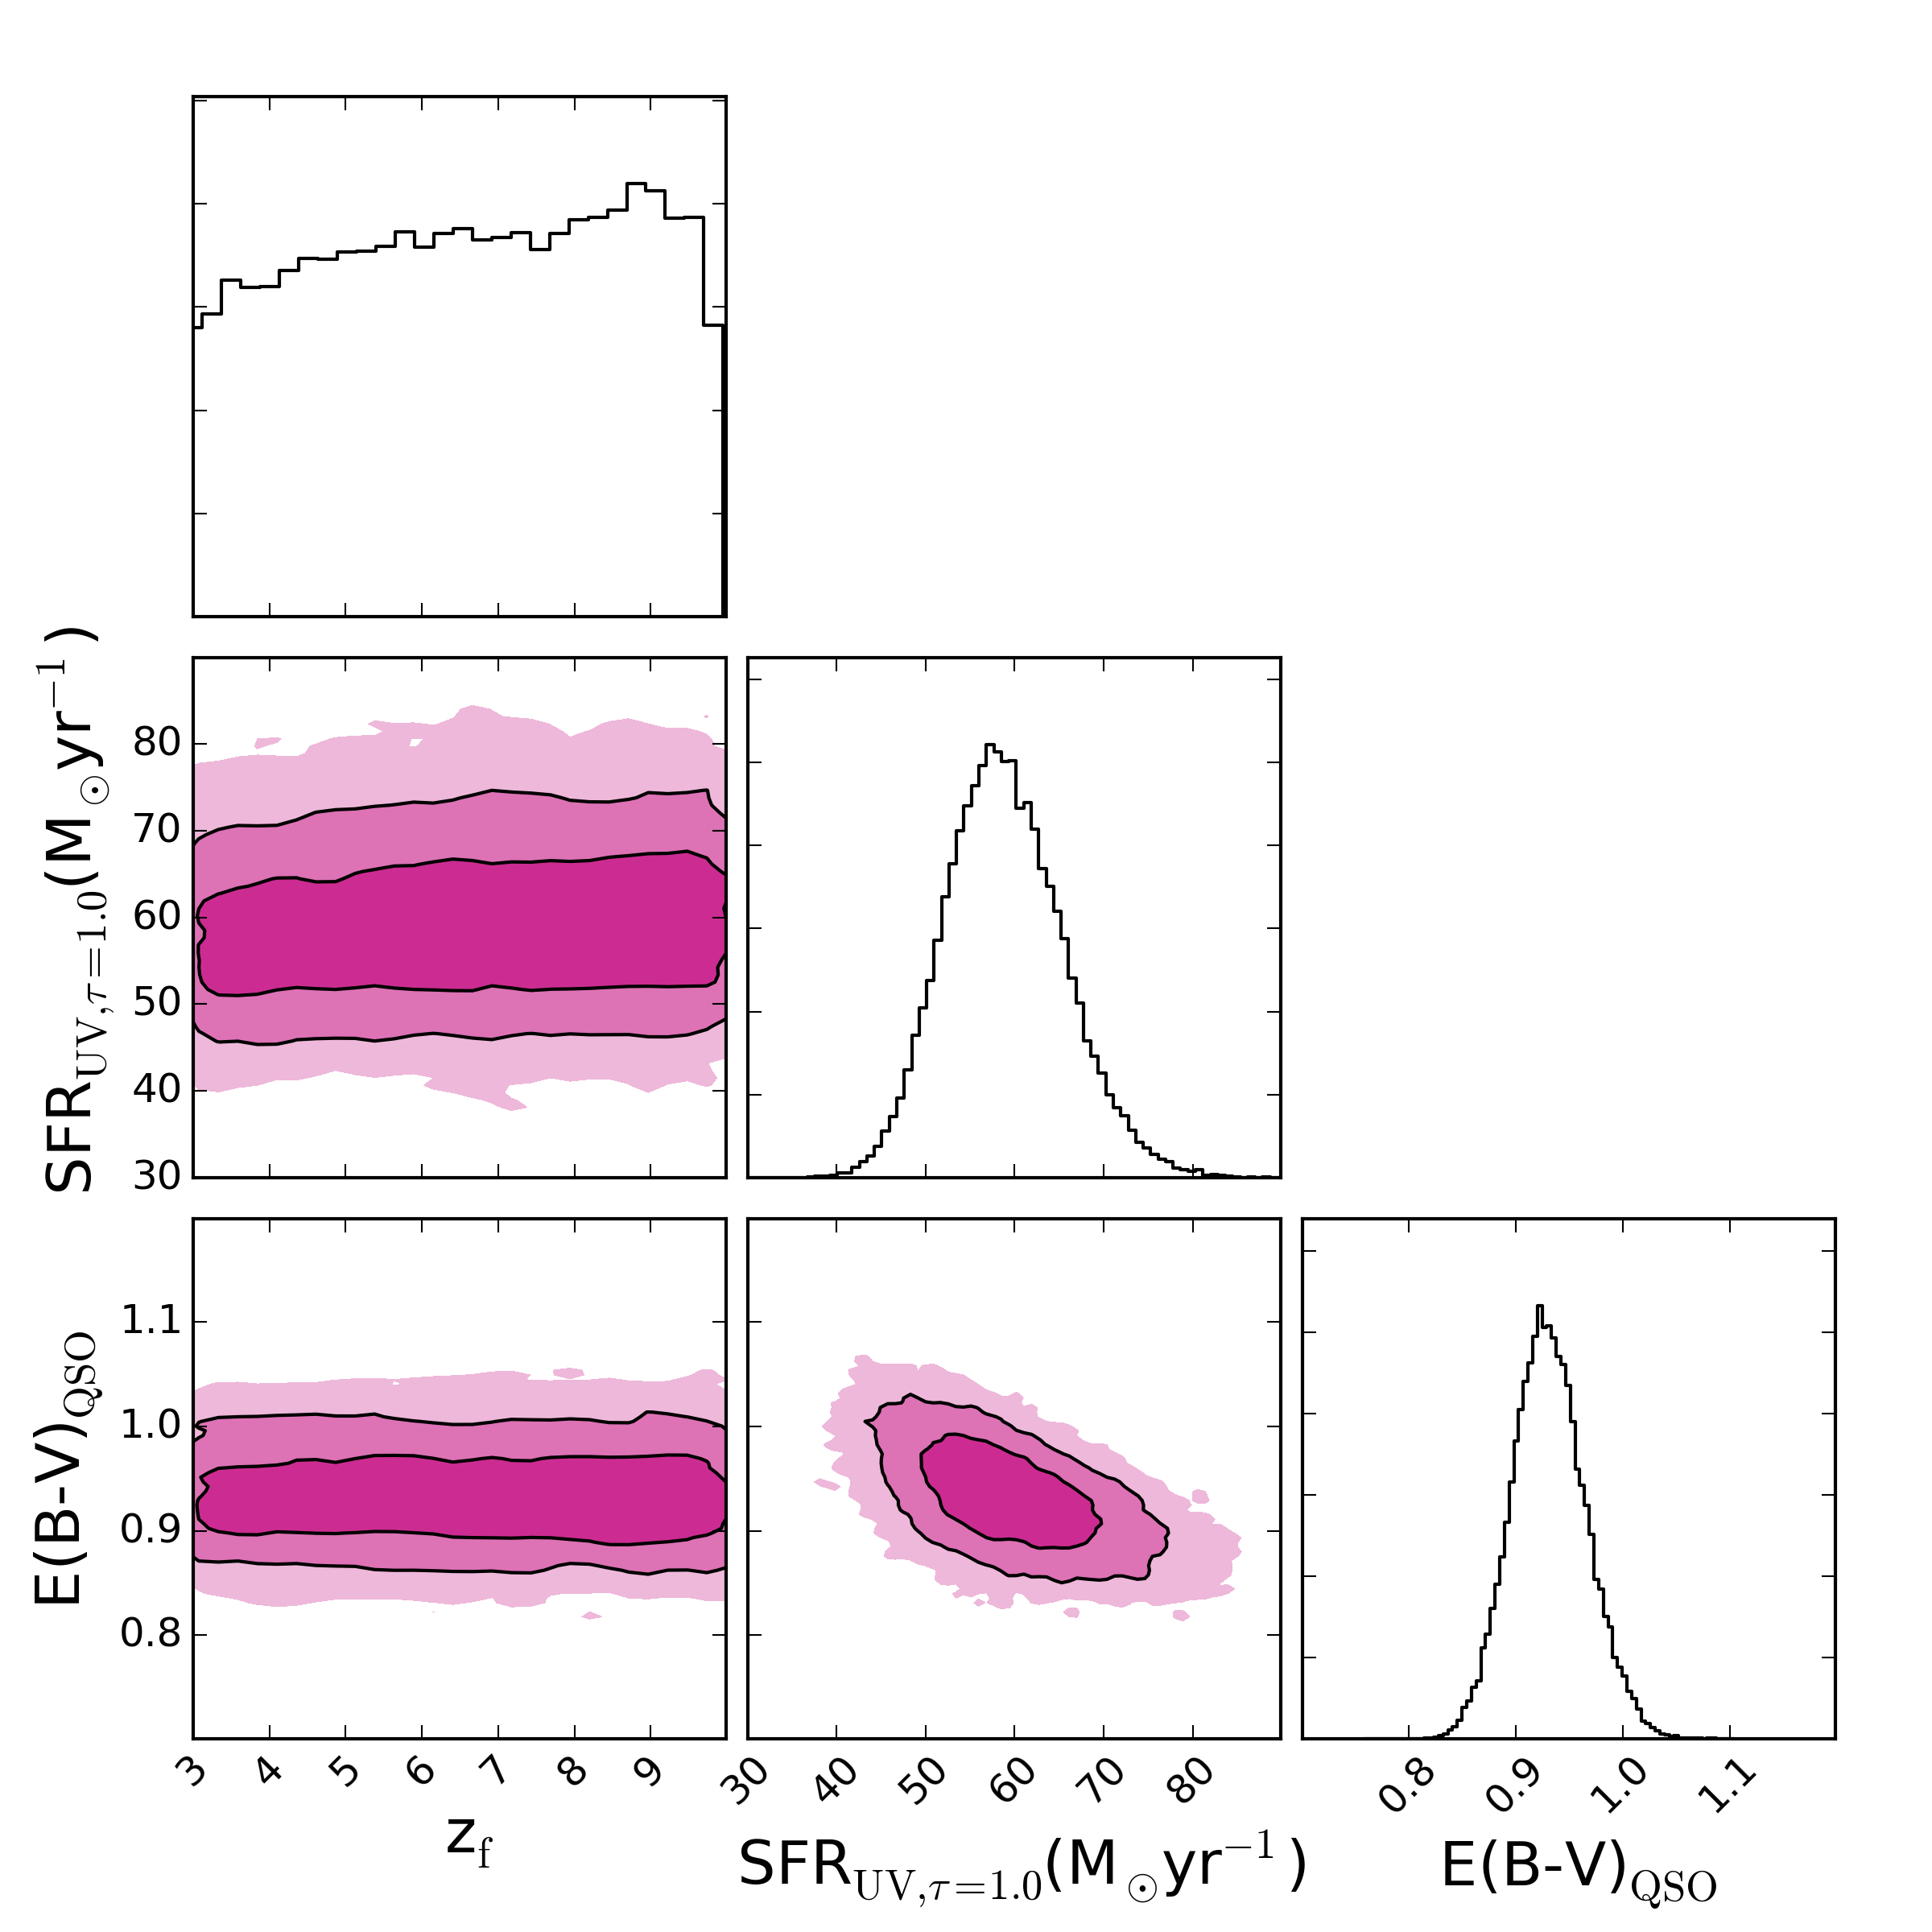
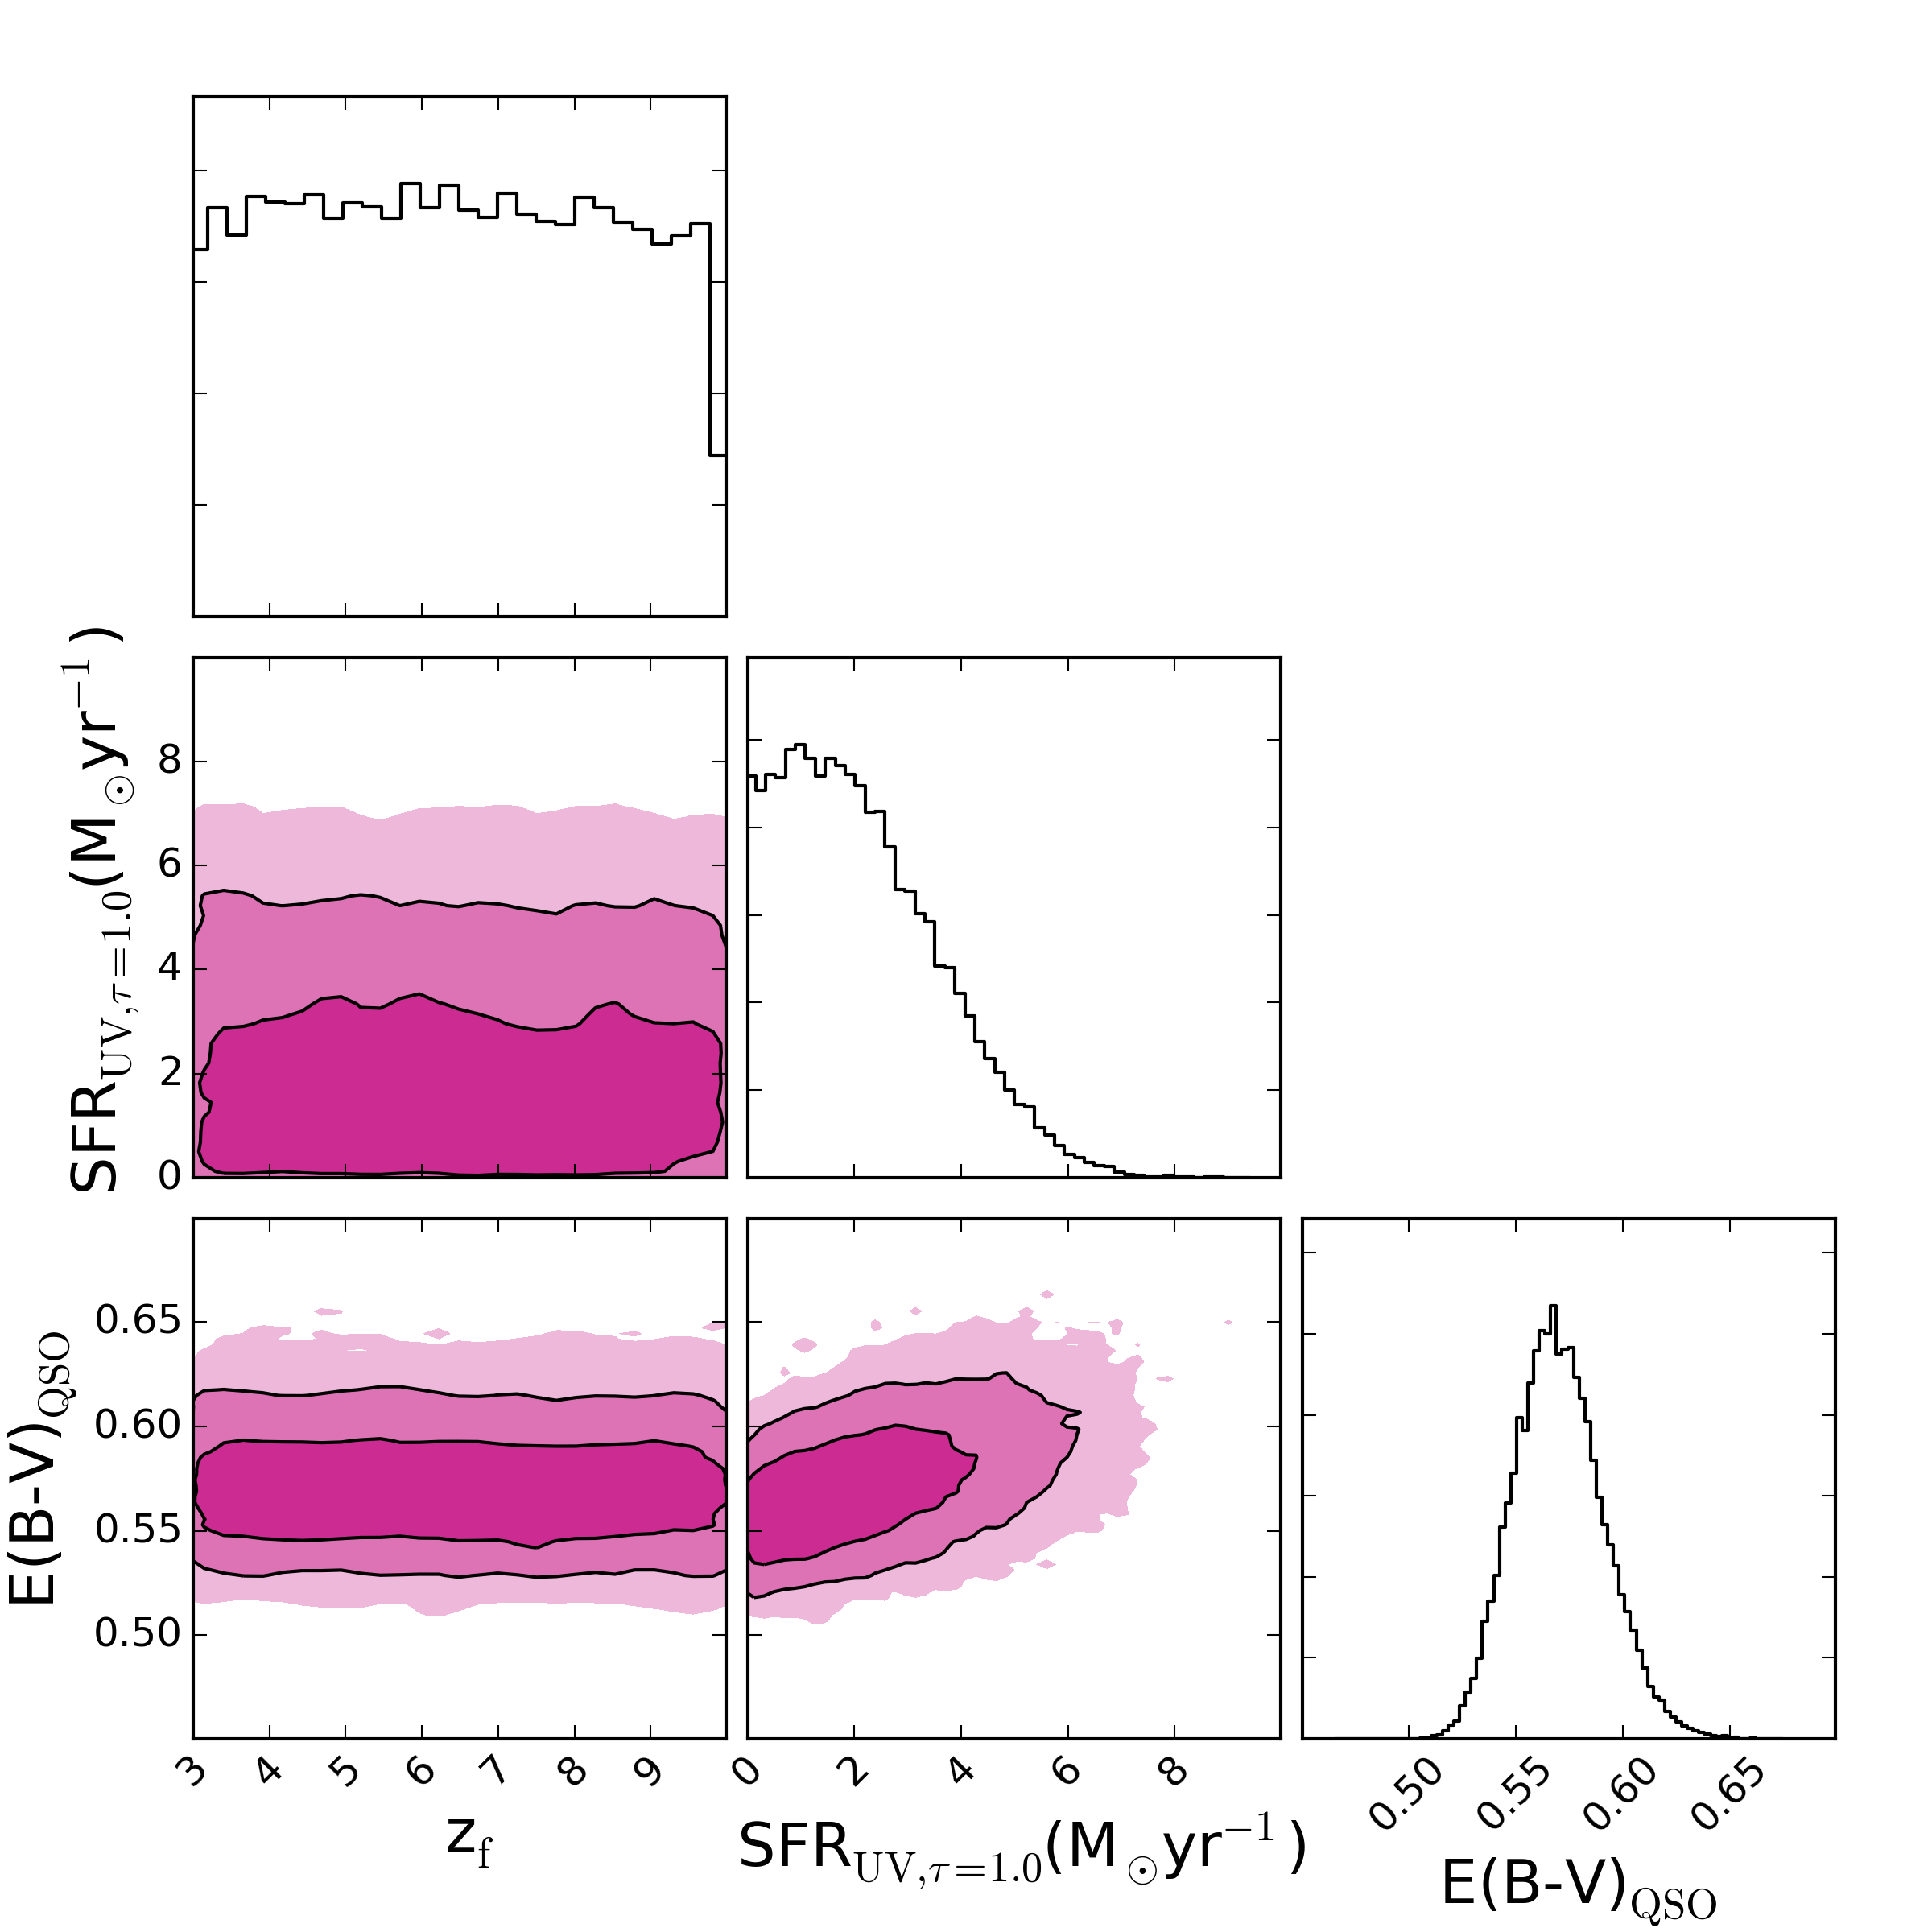
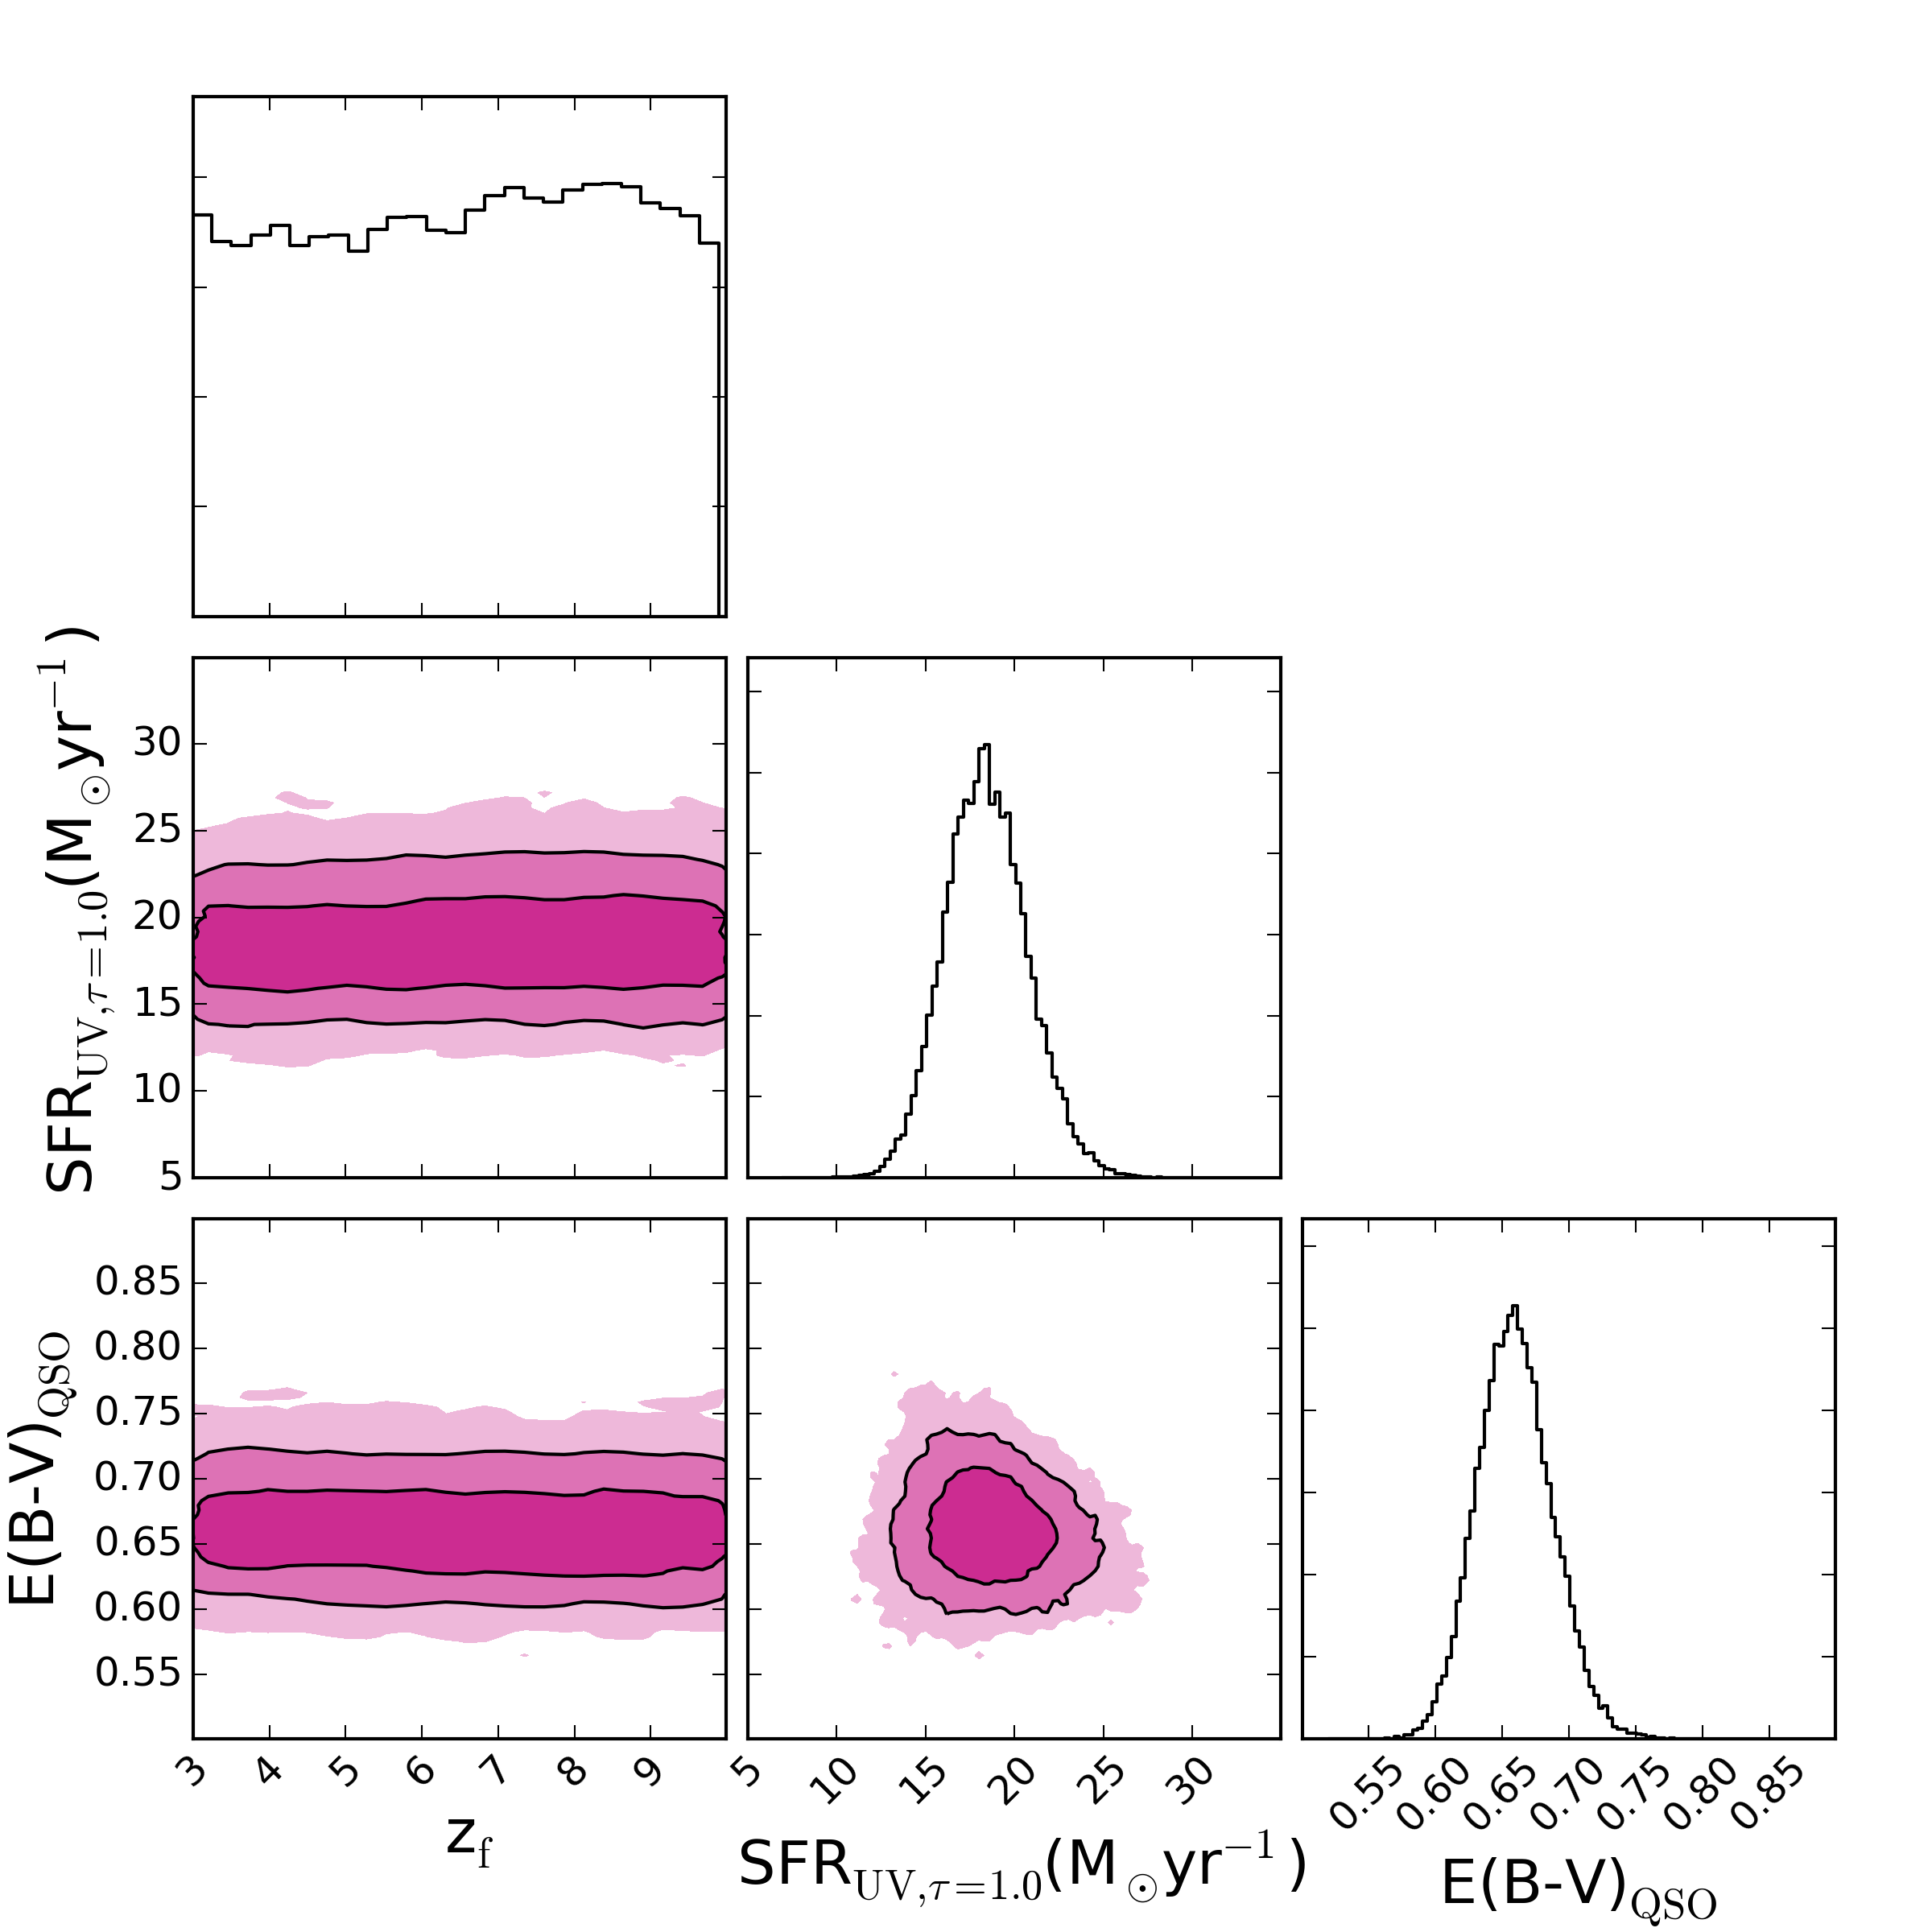
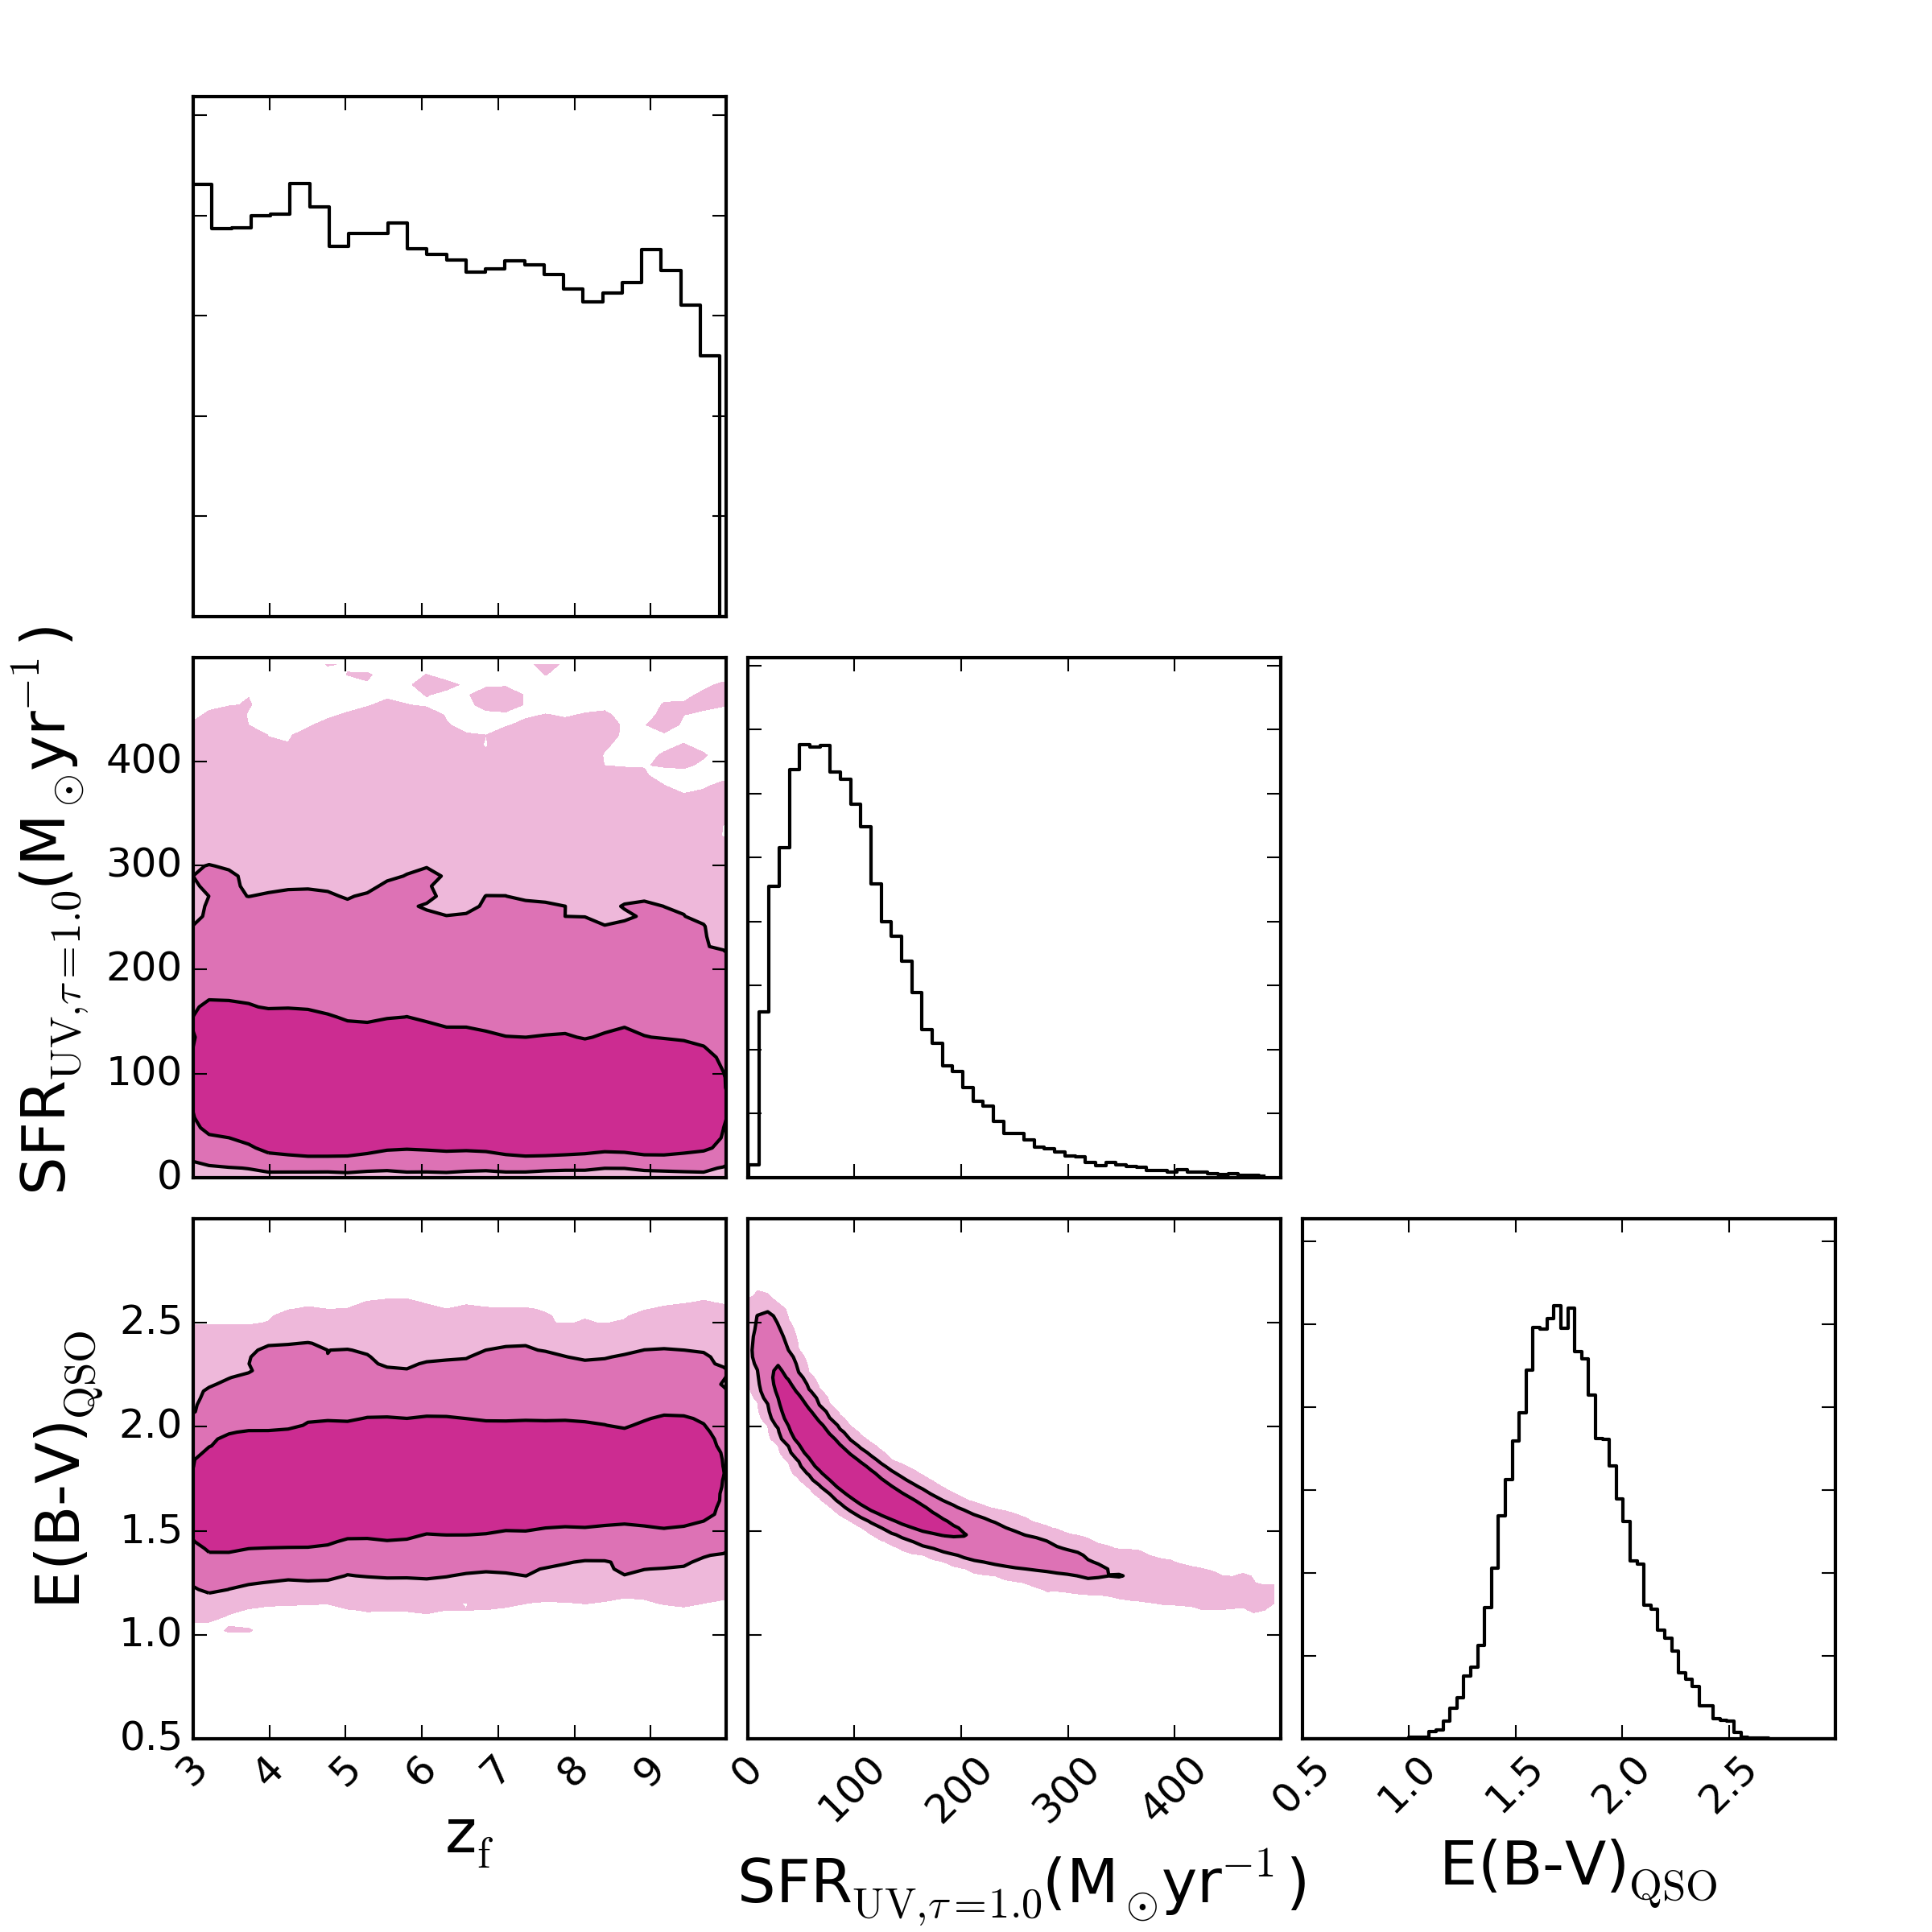
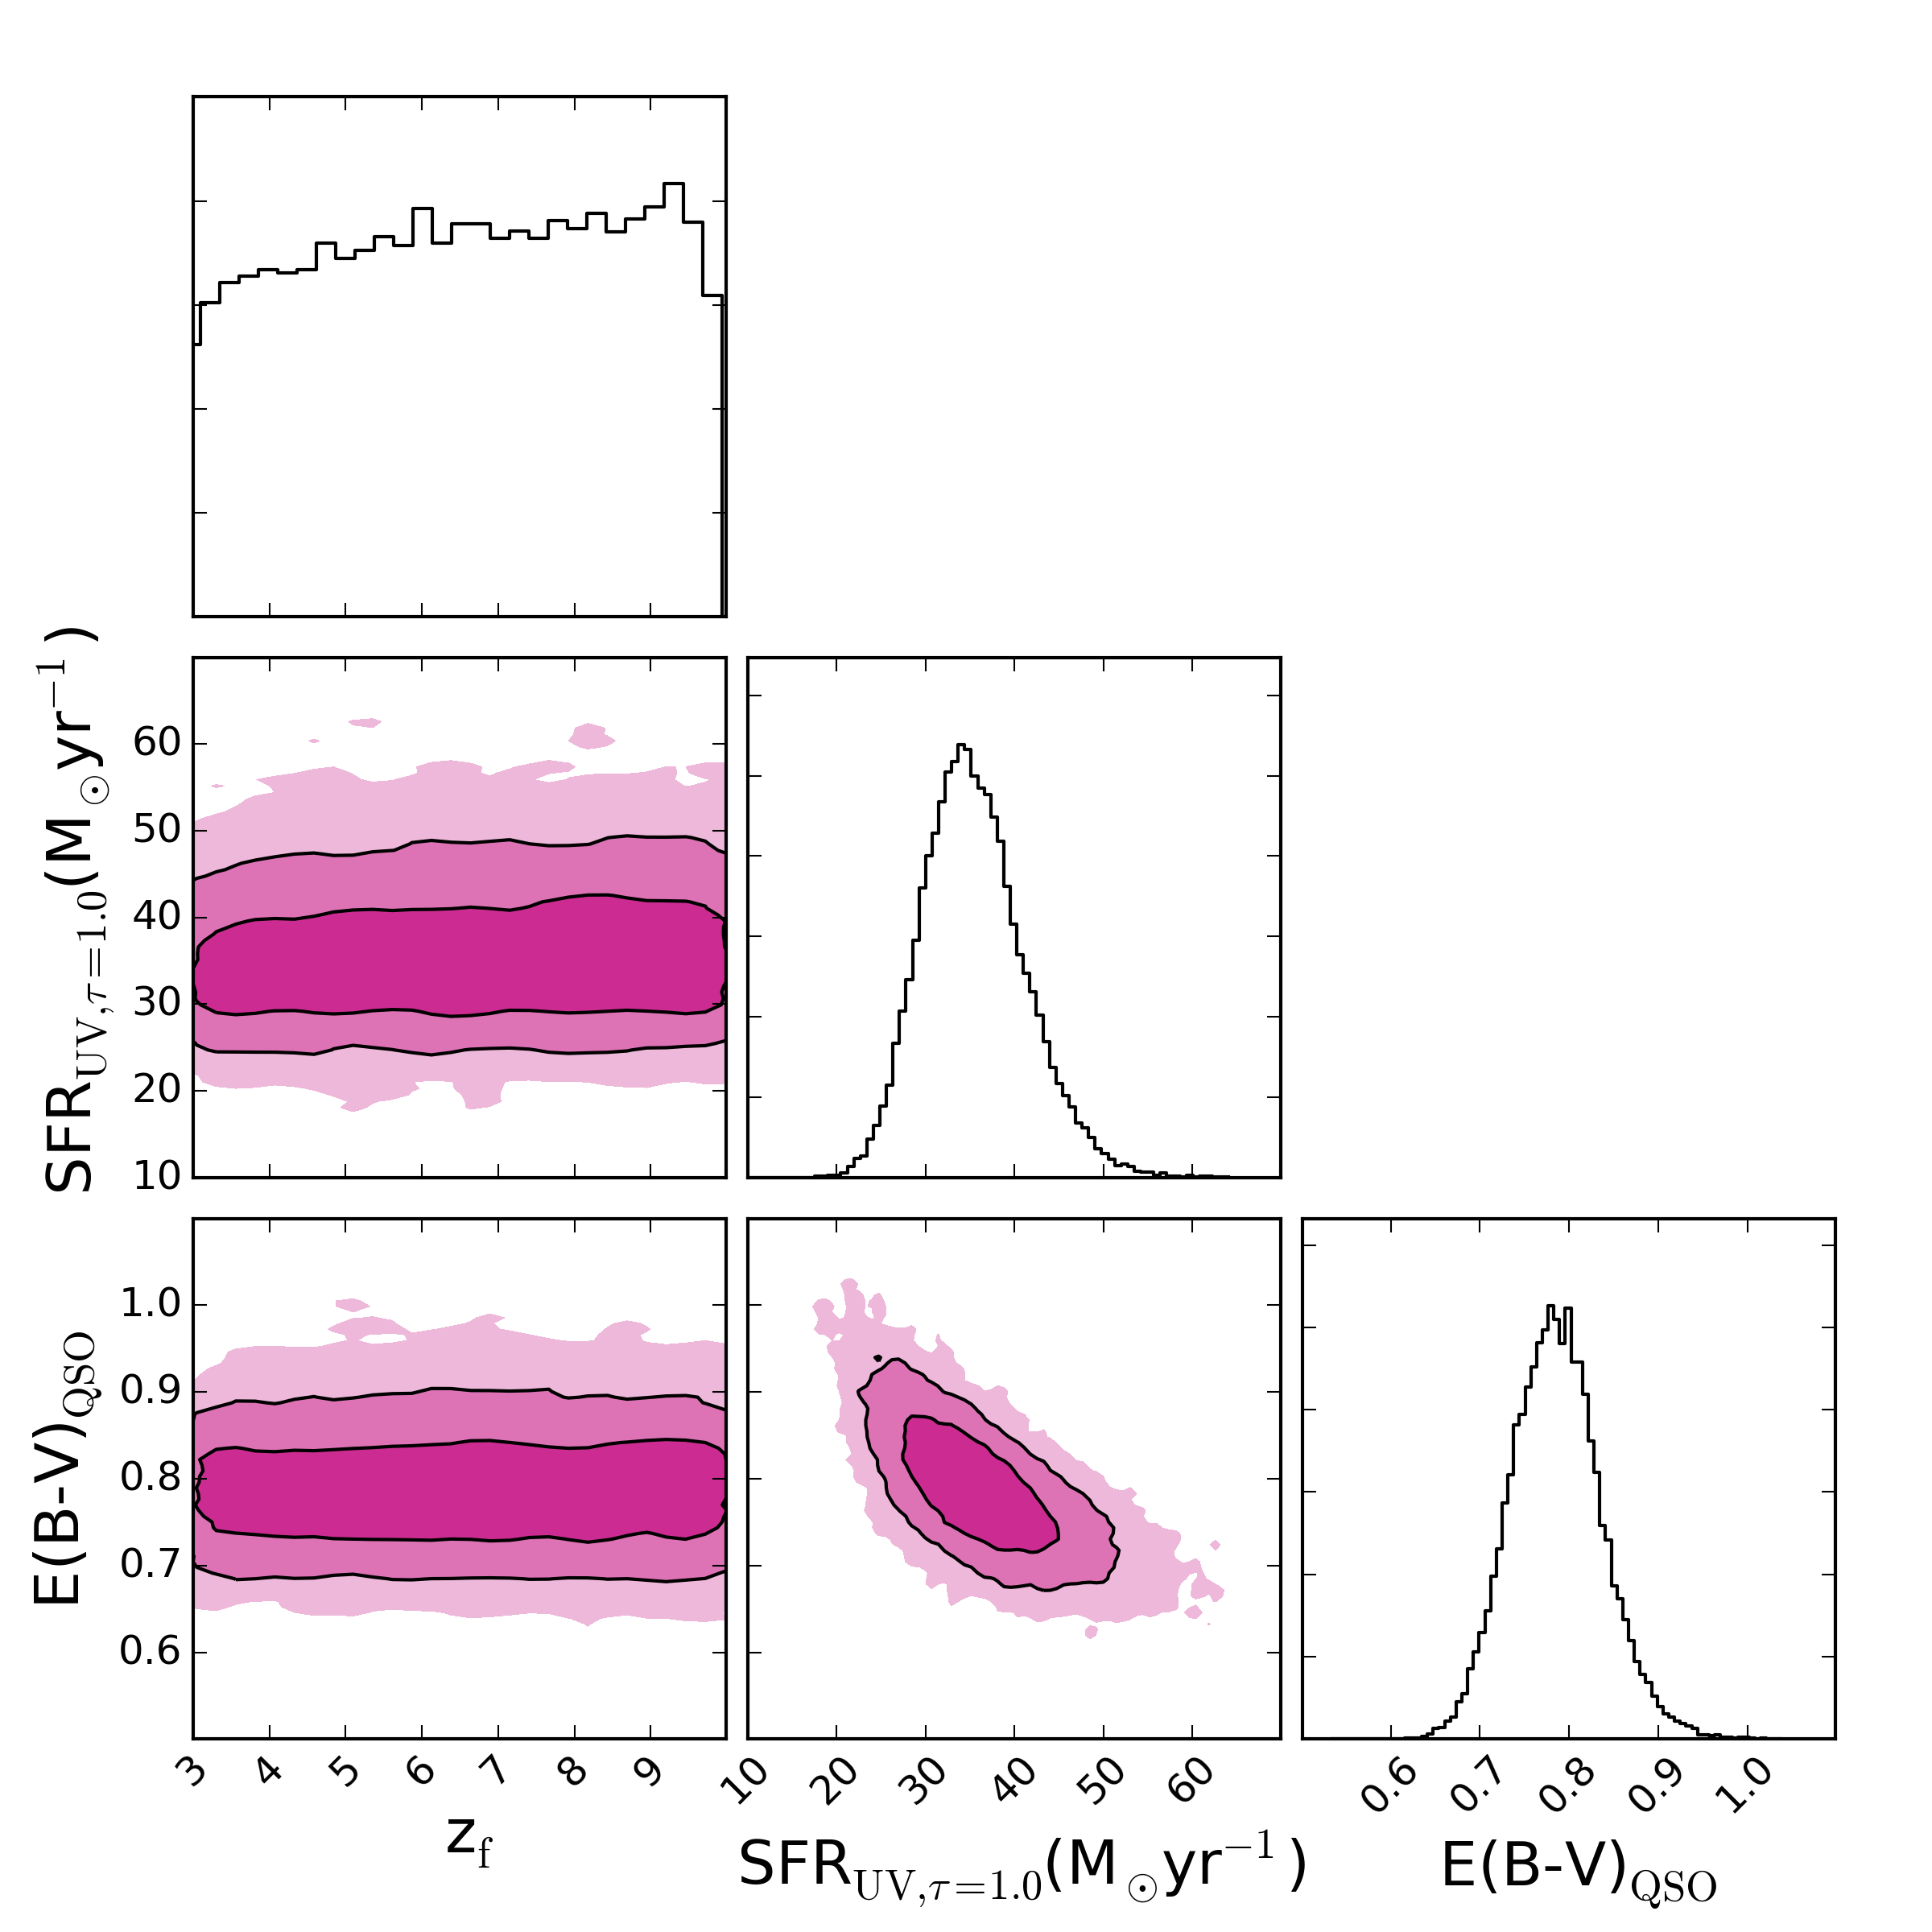
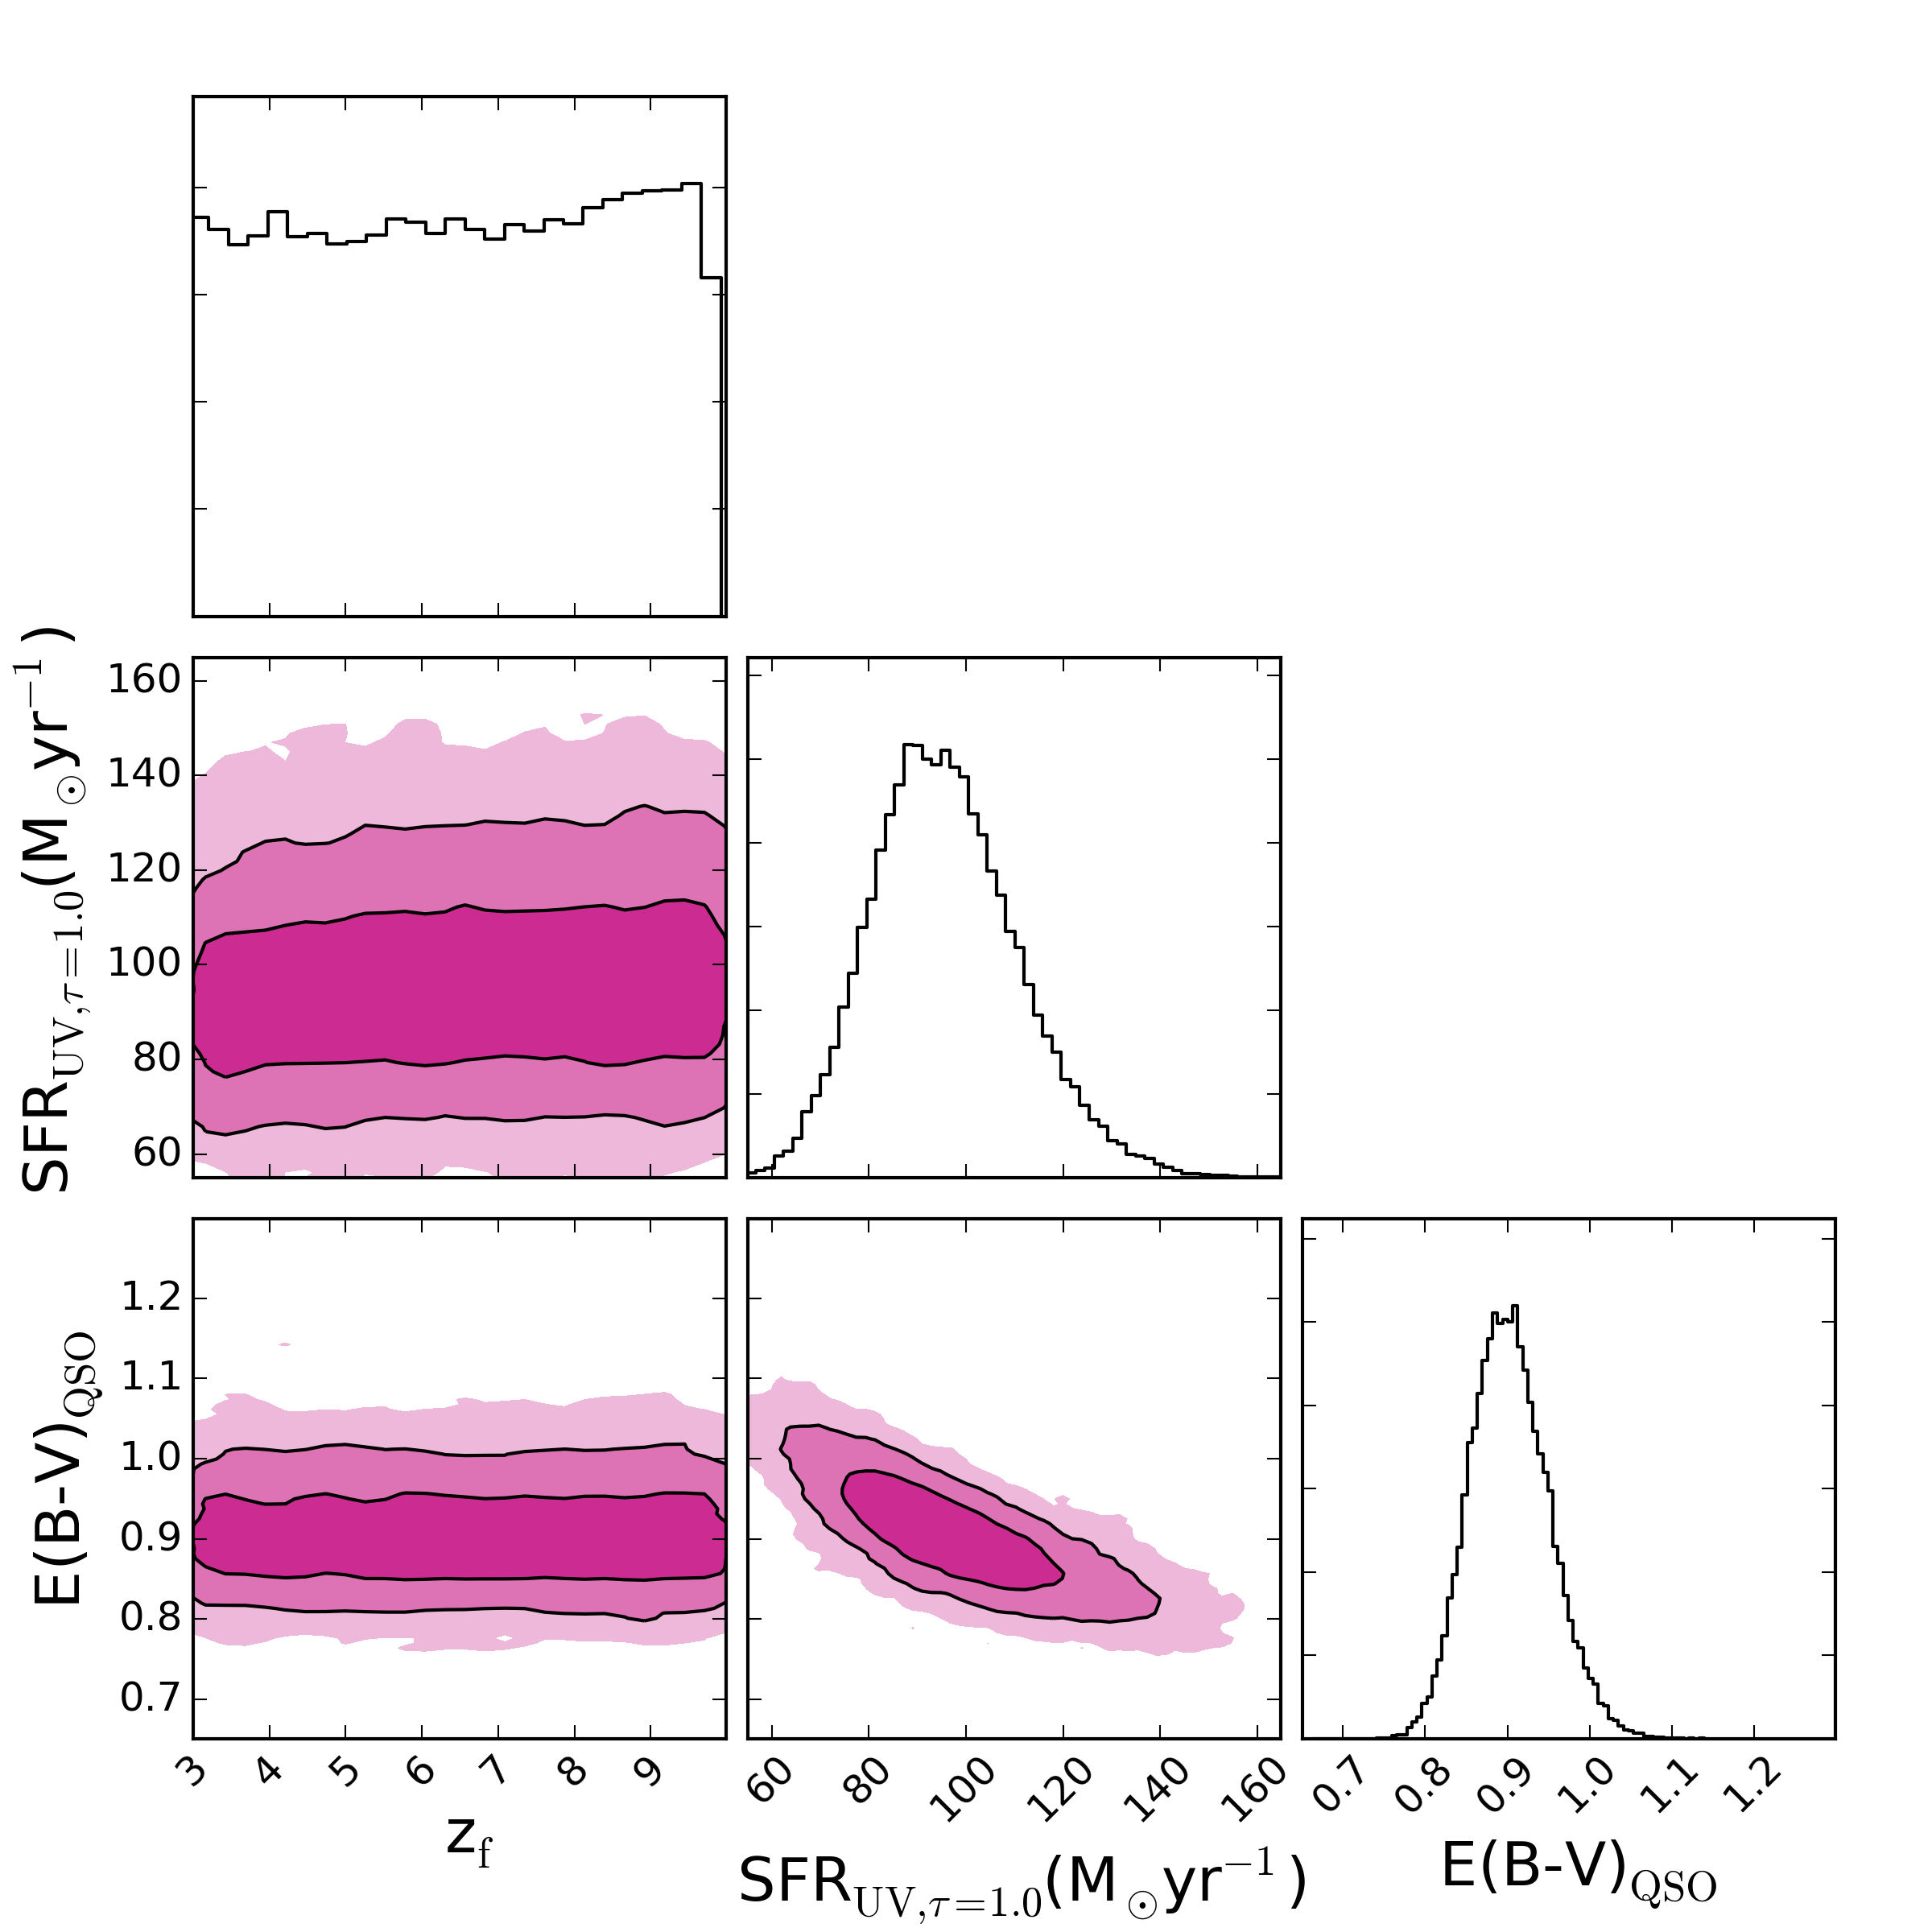
Throughout the fitting we consider three free parameters - , the formation redshift, , and the normalisation of the galaxy template, - set to take values 0.3 5.0, 3 10 and 0 1 respectively, where an = 1 denotes a galaxy flux equal to that of the quasar template in the rest-frame UV ( 900-3000Å) prior to any quasar dust reddening. We note that the value of is primarily constrained by the DES photometry tracing the rest-frame UV emission and therefore directly traces the UV flux from young stars. Although we are unable to constrain the total mass of the host galaxy, we use the mass of the fitted galaxy template444Masses we calculated using EzGal (www.baryons.org), assuming a constant SFH and a normalisation, , to derive instantaneous SFRs based on the rest-frame UV flux. In this way, can be directly converted to an instantaneous SFR (SFR). Figure 4 illustrates parameter solutions derived from the MCMC fitting routine for a typical quasar - VHSJ2235-5750 - where this conversion from to SFR has been made (solutions for all 17 quasars can be found in Fig. 9).
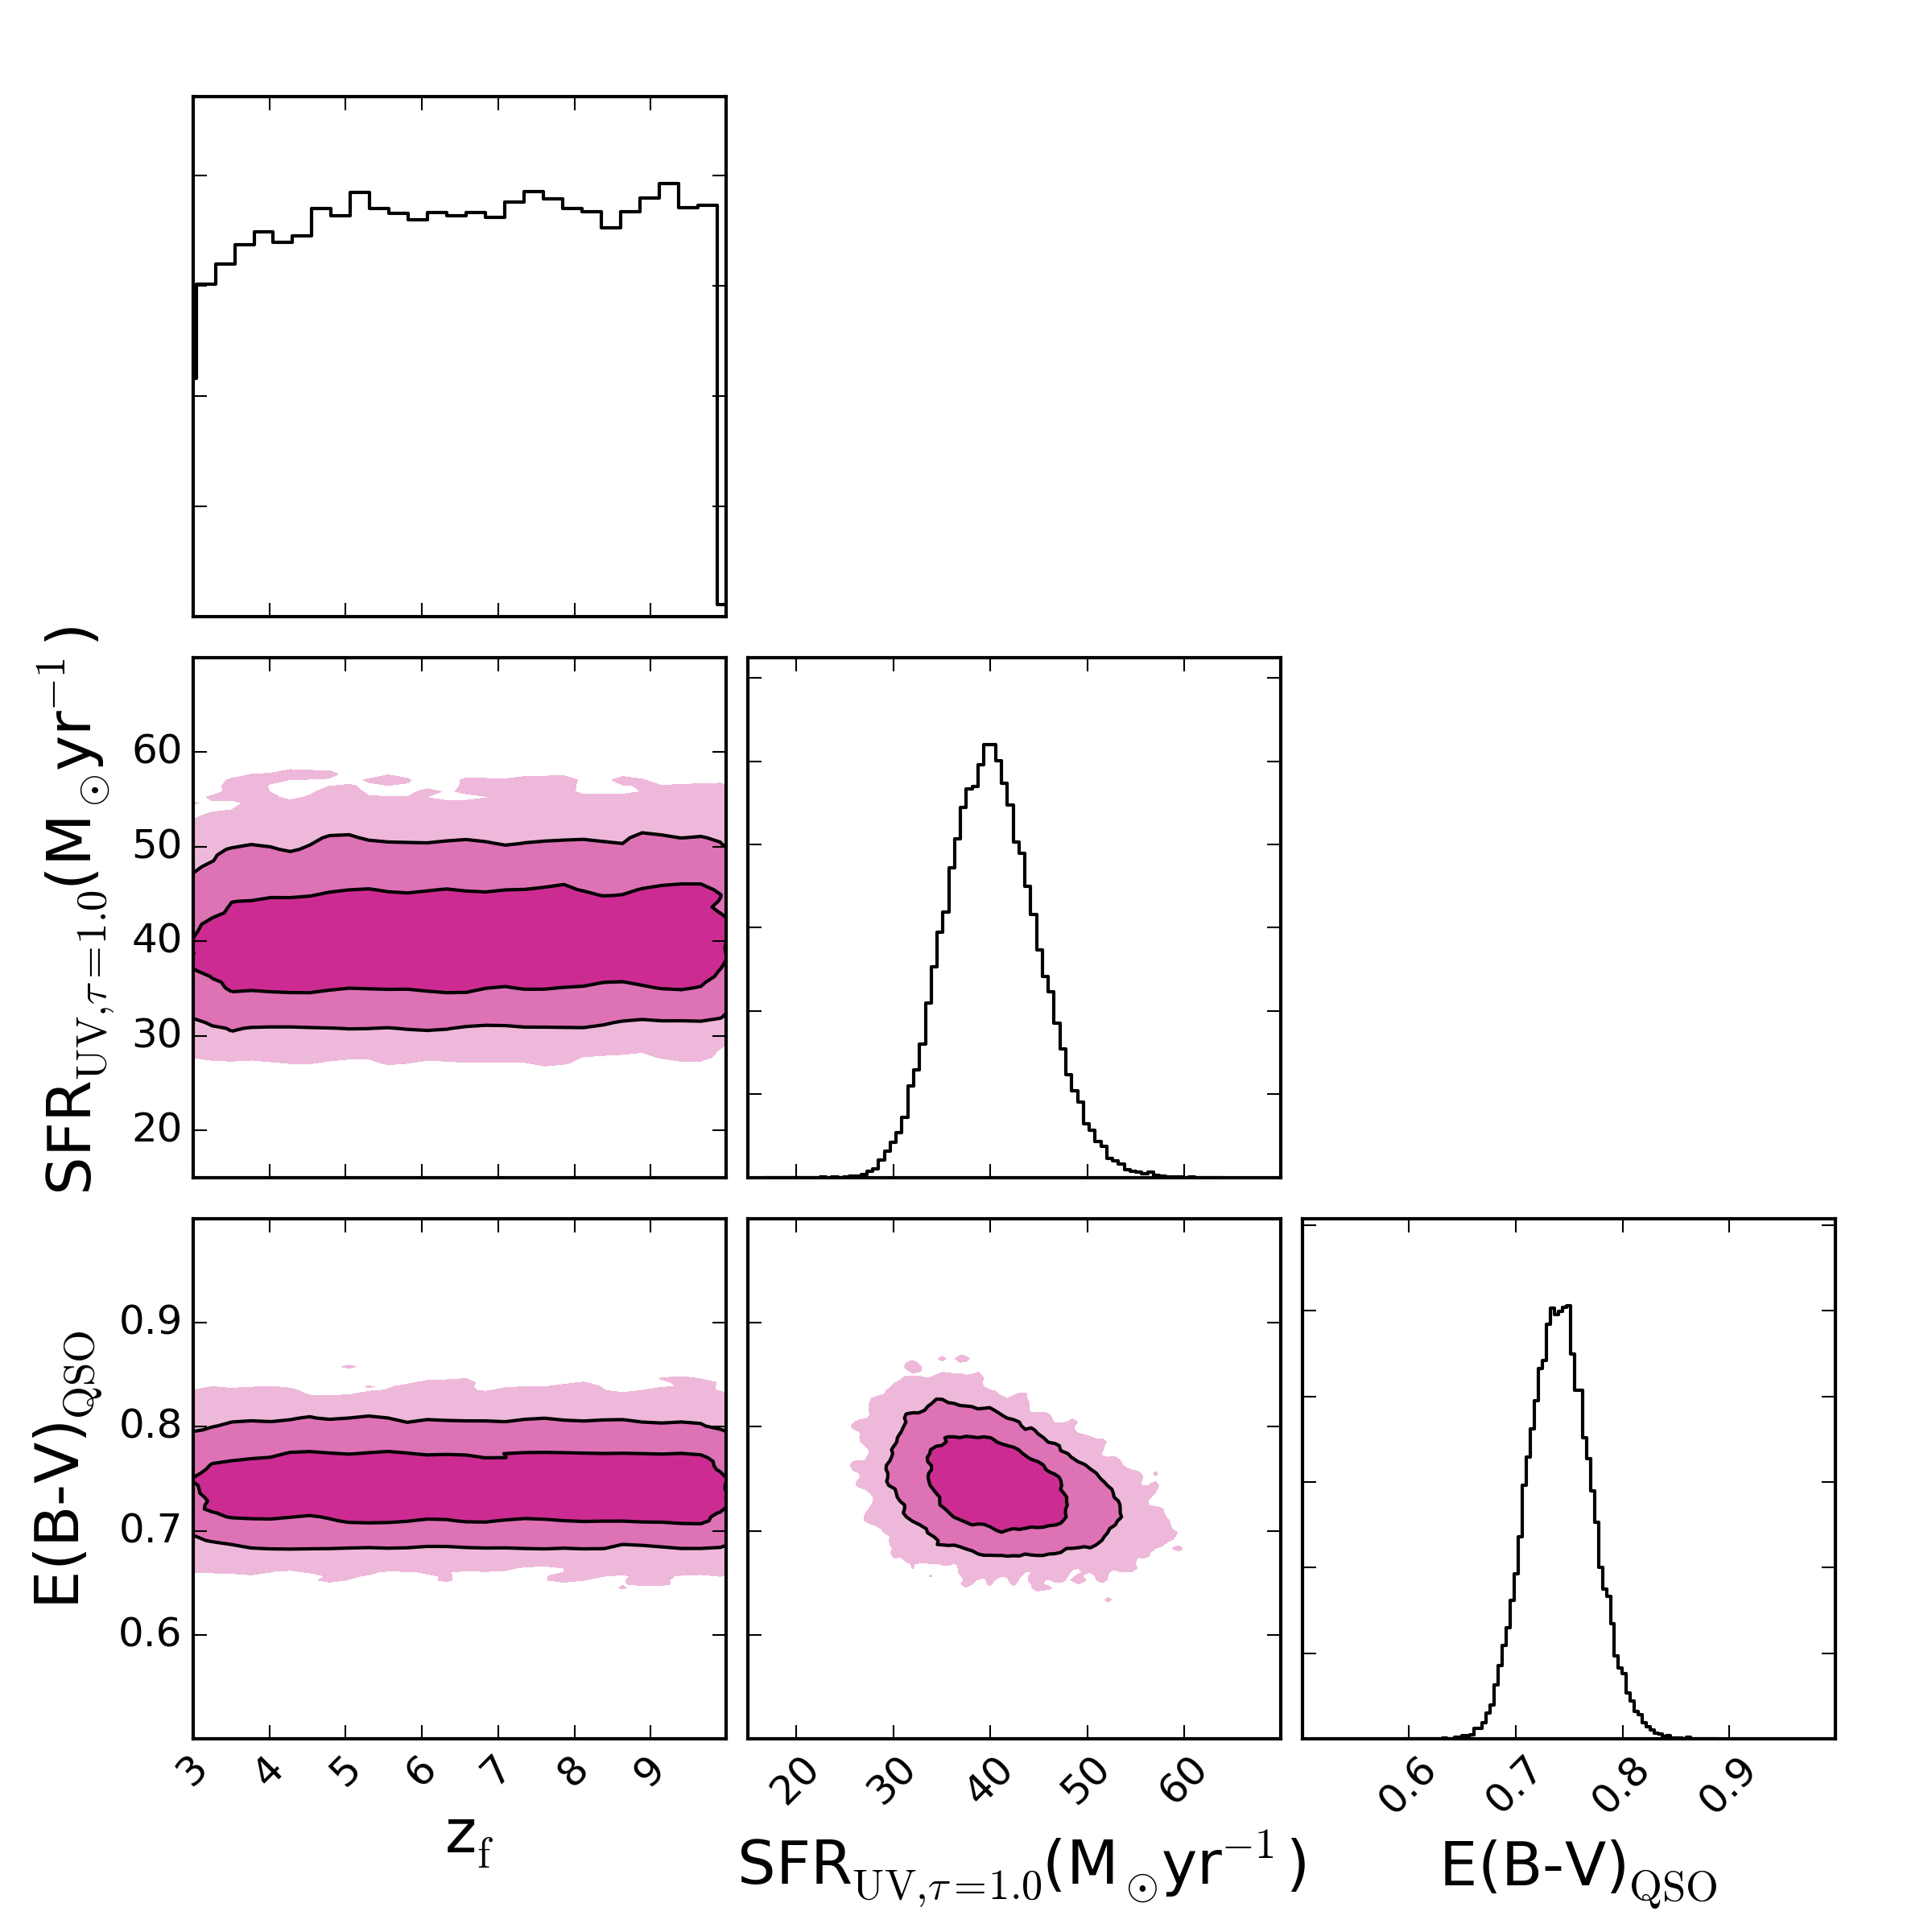
For every quasar in our sample, we recover well-constrained solutions for both and SFR, despite being unable to constrain the age of the system. This indicates that the inferred SFR is independent from . We therefore remove as a free parameter in the fitting, choosing instead to adopt a fixed value of = 6 and solve for the two remaining parameters. The resulting SED fits are presented in the upper panels of Fig. 5. The lower panels of Fig. 5 show the residuals of the fit, which are found to be small in all bands, typically returning () < 2. For nine of the 13 quasars in Fig. 5 we derive < 2.5, indicating the rest-frame UV flux in these objects is well fit by a galaxy template with = 1.0. Even in the remaining four quasars for which we derive > 2.5, we recover a much better fit than with a reddened quasar template alone (Section 4.1), finding ( - ) > 9 for 11 quasars and ( - ) > 3 for the remaining two. This shows that the addition of a host galaxy component to the model significantly improves the goodness of fit for all 13 quasars.


Table 4.3 presents instantaneous SFRs derived from the UV flux of the fitted galaxy SEDs in Fig. 5, where we have assumed and = 6.0. SFRs are given both before (SFR) and after (SFRUV) dust correction has been applied to the galaxy template. We note that although the charlot00 extinction curve used to correct for the dust is age-dependent, the assumptions made about have a minimal effect on the resulting SFRs, changing the SFR by 5-10 per cent for a change in 1.0. These variations lie below the 1 parameter uncertainties derived from the MCMC fitting, also given in Table 4.3, and so we do not discuss them further. For the four quasars that were well-fit by a single reddened-quasar SED (Section 4.1), we derive upper limits on their SFRs by repeating the above host galaxy fitting for these objects.
2Kavli Institute for Cosmology, University of Cambridge, Madingley Road, Cambridge, CB30HA, UK 3Department of Astronomy, University of Illinois at Urbana-Champaign, Urbana, IL 61801, USA 4National Center for Supercomputing Applications, University of Illinois at Urbana-Champaign, Urbana, IL 61801, USA 5Department of Physics & Astronomy, University College London, Gower Street, London, WC1E 6BT, UK 6Department of Physics and Electronics, Rhodes University, PO Box 94, Grahamstown, 6140, South Africa 7CNRS, UMR 7095, Institut d’Astrophysique de Paris, F-75014, Paris, France 8Sorbonne Universités, UPMC Univ Paris 06, UMR 7095, Institut d’Astrophysique de Paris, F-75014, Paris, France 9Fermi National Accelerator Laboratory, P. O. Box 500, Batavia, IL 60510, USA 10Institute of Cosmology & Gravitation, University of Portsmouth, Portsmouth, PO1 3FX, UK 11Laboratório Interinstitucional de e-Astronomia - LIneA, Rua Gal. José Cristino 77, Rio de Janeiro, RJ - 20921-400, Brazil 12Observatório Nacional, Rua Gal. José Cristino 77, Rio de Janeiro, RJ - 20921-400, Brazil 13Department of Astronomy, University of Illinois, 1002 W. Green Street, Urbana, IL 61801, USA 14National Center for Supercomputing Applications, 1205 West Clark St., Urbana, IL 61801, USA 15Institut de Física d’Altes Energies (IFAE), The Barcelona Institute of Science and Technology, Campus UAB, 08193 Bellaterra (Barcelona) Spain 16Kavli Institute for Particle Astrophysics & Cosmology, P. O. Box 2450, Stanford University, Stanford, CA 94305, USA 17Department of Physics and Astronomy, University of Pennsylvania, Philadelphia, PA 19104, USA 18George P. and Cynthia Woods Mitchell Institute for Fundamental Physics and Astronomy, and Department of Physics and Astronomy, Texas A&M University, College Station, TX 77843, USA 19Department of Physics, IIT Hyderabad, Kandi, Telangana 502285, India 20Institut de Ciències de l’Espai, IEEC-CSIC, Campus UAB, Carrer de Can Magrans, s/n, 08193 Bellaterra, Barcelona, Spain 21Kavli Institute for Cosmological Physics, University of Chicago, Chicago, IL 60637, USA 22Instituto de Fisica Teorica UAM/CSIC, Universidad Autonoma de Madrid, 28049 Madrid, Spain 23Department of Astronomy, University of Michigan, Ann Arbor, MI 48109, USA 24Department of Physics, University of Michigan, Ann Arbor, MI 48109, USA 25SLAC National Accelerator Laboratory, Menlo Park, CA 94025, USA 26Center for Cosmology and Astro-Particle Physics, The Ohio State University, Columbus, OH 43210, USA 27Department of Physics, The Ohio State University, Columbus, OH 43210, USA 28Astronomy Department, University of Washington, Box 351580, Seattle, WA 98195, USA 29Cerro Tololo Inter-American Observatory, National Optical Astronomy Observatory, Casilla 603, La Serena, Chile 30Santa Cruz Institute for Particle Physics, Santa Cruz, CA 95064, USA 31Australian Astronomical Observatory, North Ryde, NSW 2113, Australia 32Argonne National Laboratory, 9700 South Cass Avenue, Lemont, IL 60439, USA 33Departamento de Física Matemática, Instituto de Física, Universidade de São Paulo, CP 66318, São Paulo, SP, 05314-970, Brazil 34Department of Astronomy, The Ohio State University, Columbus, OH 43210, USA 35Institució Catalana de Recerca i Estudis Avançats, E-08010 Barcelona, Spain 36Jet Propulsion Laboratory, California Institute of Technology, 4800 Oak Grove Dr., Pasadena, CA 91109, USA 37Department of Physics and Astronomy, Pevensey Building, University of Sussex, Brighton, BN1 9QH, UK 38Centro de Investigaciones Energéticas, Medioambientales y Tecnológicas (CIEMAT), Madrid, Spain 39School of Physics and Astronomy, University of Southampton, Southampton, SO17 1BJ, UK 40Instituto de Física Gleb Wataghin, Universidade Estadual de Campinas, 13083-859, Campinas, SP, Brazil 41Computer Science and Mathematics Division, Oak Ridge National Laboratory, Oak Ridge, TN 37831
Appendix A MCMC FITTING
