Quantification of lubrication and particle size distribution effects on tensile strength and stiffness of tablets
Abstract
We adopt a Quality by Design (QbD) paradigm to better control the mechanical properties of tablets. To this end, the effect of particle size distribution, lubricant concentration, and mixing time on the tensile strength and elastic modulus of tablets is studied. Two grades of lactose, monohydrate and spray-dried, are selected. Tablets are compressed to different relative densities ranging from to using an instrumented compaction simulator. We propose a general model, which predicts the elastic modulus and tensile strength envelope that a specific powder can obtain based on its lubrication sensitivity for different particle size distributions. This is possible by introducing a new dimensionless parameter in the existing tensile strength and elastic modulus relationships with relative density. A wide range of lubrication conditions is explored and a predictable model is callibrated. The mechanical properties of lactose monohydrate tablets are noticeably dependent on particle size, unlike spray-dried lactose where little to almost no sensitivity to particle size is observed. The model is designed in a general fashion that can capture mechanical quality attributes in response to different lubrication conditions and particle size, and it can be extended to powders than undergo different deformation mechanisms, complex mixtures, and doubly convex tablets. Therefore, the model can be used to map the achievable design space of any given formulation.
Keywords: Tensile strength; Elastic modulus; Tablet compaction; Particle size distribution; Lubricant sensitivity
1 Introduction
Lubricants are one of the key ingredients in the pharmaceutical formulations to improve flowability, increase bulk powder density, and reduce die wall friction and ejection forces (Lachman et al., , 1976; Moody et al., , 1981; Hirai and Okada, , 1982; Dansereau and Peck, , 1987; Miller and York, , 1988; Sheskey et al., , 1995; Podczeck and Mia, , 1996; Faqih et al., , 2007). Magnesium stearate (MgSt) is the most frequently used lubricant (Shangraw and Demarest, , 1993); typically added to the formulation in small amounts ( (w/w)) (Lindberg, , 1972; Miller and York, , 1988). It has been shown that MgSt can adversely affect the physical and chemical properties of tablets (Johansson, , 1984; Wang et al., , 2010). Hypothetically, MgSt forms a layer on the host particles weakening the interparticle bonding (Bolhuis et al., , 1975; De Boer et al., , 1978; Hussain et al., , 1990). The lubricant type and concentration, type of mixer and its operation method, and mixing time are all important processing variables that affect the powder compactibility, interparticle bonding and thus, final mechanical properties of tablets (Asker et al., , 1975; Shah and Mlodozeniec, , 1977; Bossert and Stains, , 1980; Dansereau and Peck, , 1987; Otsuka et al., , 1993; Kikuta and Kitamori, , 1994; Otsuka et al., , 2004). However, the deformation mechanism of host particles also play a role (Bolhuis et al., , 1975). For example, brittle materials that undergo fragmentation are said to be unaffected by MgSt due to the creation of unexposed surfaces during compression (De Boer et al., , 1978; Jarosz and Parrott, , 1984). In contrast, plastically deformable powders are significantly impacted by lubricant mixing (Doelker et al., , 1987; Bolhuis and Chowhan, , 1995; Mitrevej et al., , 1996). Mollan and Çelik, (1996) ascribed the reduction in the total work of compaction by increasing the lubricant concentration to decreased particle cohesiveness. Zuurman et al., (1999) argued that the decrease in tablet strength of pharmaceutical powders such as microcrystalline cellulose mixed with MgSt is caused by a more extensive relaxation of the lubricated tablets corresponding to a weaker interparticle bonding.
Over the past decade there has been growing interest in quantifying what the powder experiences in mixing with lubricant to enable a more robust prediction of tablet quality attributes. The blender parameters were translated to a more relevant and fundamental variables, strain and shear rate, using a modified Couette shear cell to better quantify lubrication effect (Mehrotra et al., , 2007; Llusa et al., , 2010). Shear rate is proportional to the energy input rate per unit mass and total strain is proportional to the total energy input per unit mass. Narang et al., (2010) derived a dimensionless equation to quantify total shear imparted by the force feeder on the granulation in terms of a shear number, which provides guidance to the scale-up and interchangeability of tablet presses. Kushner and Moore, (2010) proposed an empirical model, which can describe the impact of both formulation and process parameters on the extent of lubrication in a pharmaceutical powder blend.
Particle size distribution (PSD) also plays an important role on the compaction and tablet properties (Roberts and Rowe, , 1986). A decrease in particle size of the powdered material has been shown to increase tablet porosity (McKenna and McCafferty, , 1982; De Boer et al., , 1986). Smaller particles are inclined to be more cohesive since the interparticle cohesive forces are comparable to the weight of the particles making them more compressible (Castellanos, , 2005; Faqih et al., , 2006). Reduction in particle size typically results in an increase in the mechanical strength of tablets (Shotton and Ganderton, , 1961; Hersey et al., , 1967; McKenna and McCafferty, , 1982; Ragnarsson and Sjögren, , 1985). This is attributed to a greater packing density after the particle rearrangement and an increase in the surface area available for interparticulate attractions (Rhines, , 1947; Vromans et al., , 1985; De Boer et al., , 1986). Attempts were made to correlate specific surface area to the mechanical strength of tablets and a linear relationship was found for different types of lactose (Vromans et al., , 1985; De Boer et al., , 1986). However, Nyström et al., (1993) suggested that the intermolecular forces are the dominating mechanism in the compactibility of powders and only in some cases the available surface area could be used to establish a model to correlate with mechanical strength of tablets. On the contrary, sodium chloride tablets have been reported to become stronger as their particle size increased associated to more bonding between particles through solid bridges (Alderborn and Nyström, , 1982).
Katikaneni et al., (1995) investigated the tableting properties and predominant consolidation mechanism of ethylcellulose as lubricant concentration and particle size varied individually. The concurrent effect of lubrication and particle size on mechanical properties of pharmaceutical tablets during and after compaction has also been explored. Van der Watt, (1987) was the first to show that tablet properties change after the same MgSt mixing time for different particle sizes of Avicel PH 102. In more recent years, Almaya and Aburub, (2008) examined the effect of particle size on lubricant sensitivity for different types of materials. They concluded that for MCC (a plastically deforming material) particle size impacts tablet strength only in the presence of lubricant. For starch (a viscoelastic material) tablet strength is affected by the particle size with or without added lubricant. Finally, for dibasic calcium phosphate dihydrate (a brittle material) particle size has no effect on tablet strength with or without the lubricant. Nevertheless, there is no previous work that goes beyond the qualitative predictions.
The primary goal of the present study is to adopt a Quality by Design (QbD) paradigm to better control the mechanical properties of tablets. We aim to quantify the lubrication effect combined with the particle size on the tensile strength and elastic modulus of tablets. To this end, the envelope of mechanical quality attributes of two grades of lactose, namely lactose -monohydrate (LM) and spray-dried lactose (SDL), caused by different PSD and lubrication conditions was explored. Tablets were compressed to different relative densities ranging from to using an instrumented compaction simulator. We propose a general model for predicting the elastic modulus and tensile strength spectrum that a specific powder can obtain based on its lubrication sensitivity for different PSDs. This was possible by introducing a new dimensionless parameter in the existing tensile strength and elastic modulus relationships that is a non-linear function of the PSD, lubricant concentration and its mixing time with the host particles. A wide range of lubrication conditions was explored and the model exhibited a good predictability. The mechanical properties of LM tablets were noticeably dependent on particle size, unlike SDL where little to almost no sensitivity to initial particle size was observed. The model is designed in a general fashion that can capture mechanical quality attributes in response to different lubrication conditions and initial particle size.
2 Material and methods
The materials used in this study include -lactose monohydrate (Foremost Farms, Wisconsin, USA), Spray-dried Fast-Flo lactose monohydrate N.F. (Foremost Farms, Wisconsin, USA) and magnesium stearate N.F. non-Bovine (Mallinckrodt, Missouri, USA) as lubricant.
The true density of lactose monohydrate (LM), spray-dried lactose (SDL), and magnesium stearate (MgSt) powders was measured using an AccuPyc Pycnometer (Accupyc II , Micromeritics) with helium as density medium. The powders were dried at for hours before the test.
Each powder was sieved through a vibrational sieve shaker (Octagon , Endecotts Ltd., England) into different particle size distributions. LM was divided into three particle size fractions -, -, and - m. SDL was divided into four particle size fractions -, -, -, and - m. The sieve shaker was operated at amplitude of . The as-received powder was poured in the top pan of the clamped sieve stack. The powders on the lower pan (corresponding to - m) were collected at an interval of approximately min. This procedure was repeated until the powder in the lower pan was a negligible amount.
The particle size distribution (PSD) was measured using a Beckman Coulter LS laser diffraction particle size analyzer to ensure if the desired distribution was achieved. MgSt was pre-sieved through a mesh ( m opening) prior to mixing with powders using a laboratory scale resonant acoustic mixer (labRAM) (Resodyn Acoustic Mixers, Butte, Montana, USA). The mixing intensity (%) is the parameter that can be controlled in the LabRAM, which determines the amplitude of the mechanical vibration, translating into acceleration values ( g’s) depending on the load mass (Osorio and Muzzio, , 2015). In all the experimental work presented here the acceleration of g was used. In other words, for each blending condition, based on the powder mass and powder properties, the mixing intensity was adjusted to give the same acceleration. Regardless, the variations in powder mass were kept minimal. Overall, MgSt concentration and mixing time varied from % to % and sec to sec, respectively, aiming to produce tablets with a wide range of mechanical properties. Samples were stored in airtight plastic bags until used.
The samples were compacted using a Presster tablet press simulator (The Metropolitan Computing Corporation of East Hanover, NJ) equipped with an mm flat round face, B-type tooling. A Fette tablet press with mm compaction roll diameter was emulated at a constant speed of rpm. A dwell time of ms, corresponding to a production speed of tablets per hour, was used. Compression force and punch displacement are measured via strain gauges placed on the compression roll pins and a linear variable displacement transducer connected to each punch, respectively. No pre-compression force was applied. The total number of tablets per case varied from to . All the compacted tablets were stored at ambient room temperature and inside a sealed plastic bag and kept for at least hours prior to any characterization.
The mass of tablets was measured with a precision balance ( g, Adventurer Ohaus). The thickness and diameter of tablets were measured using a MultiTest (MT) tablet hardness tester (Sotax, Allschwil, Switzerland). From these measurements, the relative density of the tablets was calculated
| (1) |
where , , and are the mass, diameter, and thickness of the tablet and is the true density of the blend determined by
| (2) |
and represent the concentration on a mass basis and true density of each ingredient.
Ultrasound (US) measurements were made using a pulser/receiver unit (Panametrics, PR), a pair of longitudinal wave contact transducers (Panametrics, V-RB) with a central frequency and diameter of MHz and mm, respectively, a digitizing oscilloscope (Tektronix TDS), and a computer controlling the data acquisition. Parafilm tape was used, suggested by Hakulinen et al., (2008), to improve the contact between transducers and tablets. From the acquired data, the time of flight (TOF) was obtained using the first peak of the received US signal. The speed of sound, SOS, was calculated as follows:
| (3) |
A delay time of s was measured for the US setup independent of the material used. In subsequent measurements this delay time was subtracted from the measured TOF.
The elastic modulus, E, of each tablet was then calculated from the SOS assuming the material is isotropic (Akseli et al., , 2009; Razavi et al., , 2016):
| (4) |
The tablets were diametrically compressed using an MT tablet hardness tester. The tensile strength of tablets, , was computed using Hertz solution (Fell and Newton, , 1970)
| (5) |
where is the breaking force.
3 Results and discussion
The average true density of LM, SDL, and MgSt was measured to be , , and gcm-3, respectively. According to (Yohannes et al., , 2015), the true density of lactose particles was found to be independent of the PSD. Thus, the density measurements were only conducted on the as-received samples and the changes in the true density of powders with different PSD were assumed negligible. A total of blends of LM and blends of SDL were prepared varying in MgSt concentration (), mixing time (), and PSD, listed in Table 1.
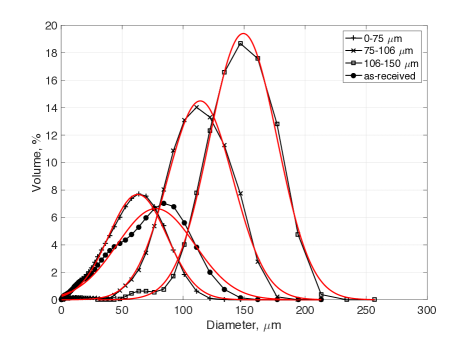
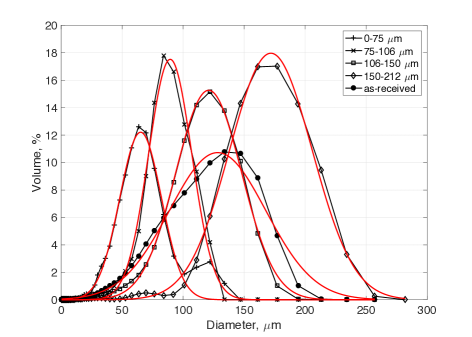
Figs. 1 and 1 show PSD measured for the sieved and as-received samples of LM and SDL, respectively. A Gaussian distribution was fitted to all the curves using Matlab 2016a (MATLAB, , 2016) and the mean () and standard deviation () for each PSD are reported in Table 1. There is a clear difference between the as-received powders. As-received LM contains mainly of fine particles, whereas as-received SDL has larger particles. This justfies the addition of the fourth PSD ( m) selected for SDL. For each PSD sample, there are particles smaller (except for m) and larger than the target PSD. Possible reasons were mentioned in (Yohannes et al., , 2015). Optical microscopy on samples with different PSD showed insignificant change in particle shape. Thus, particle shape was assumed to be a constant in this study.
Although PSD (in particular, ) was shown to be increased by the RAM mixing time (Osorio et al., , 2016), our goal is to be able to correlate the mechanical strength of tablets to the initial properties of the powder. Thus, the PSD measurement was only conducted on the unlubricated samples.
3.1 Effect of particle size on lubricant sensitivity on compaction properties
Compaction pressure is calculated by dividing the compaction force over the cross sectional area of the tooling used. The in-die relative density is determined by Eq. (1), but varies as the gap between the upper and lower punches changes during loading and unloading. During loading the punches get closer and the thickness of the powder bed decreases until it reaches its minimum, where the maximum compaction pressure is applied. When the force is released, the unloading stage starts, some of the energy is recovered and the tablet mostly expands axially. The total work input during the compaction process is the area under the loading curve of a force-displacement profile. In this study, instead of force-displacement, we used compaction pressure versus in-die relative density profiles, which allows for comparison between samples of different sizes.
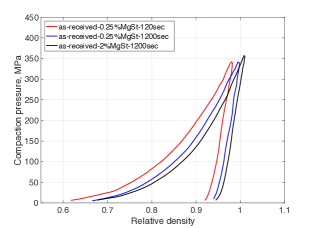
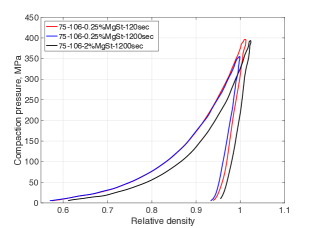
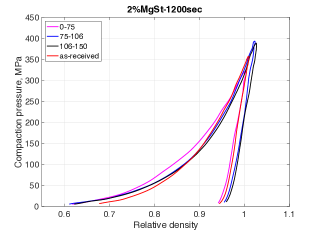
Fig. 2 compares the axial compaction pressure versus in-die relative density profiles of three similar lubrication conditions for as-received and sieved LM powders. It has been reported that better packing can be achieved during die filling, in particles exposed to higher shear strain levels causing higher initial relative densities (i.e., the die-fill relative density) (Mehrotra et al., , 2007; Pawar et al., , 2016). In this study, this phenomenon was noticeably observed in the as-received LM. For the sieved samples, by keeping the MgSt concentration constant, the mixing time did hardly affect the loading and unloading path as a function of relative density. On the other hand, in all the cases, the increase in MgSt concentration results in a different compaction profile, moving toward the right-hand side. This shift is partially caused by the decrease in the true density of the blend. Fig. 2 discernibly shows that the forces evolved during compression are slightly lower when more lubrication was used, i.e. less work was needed. It has been reported that with increase in lubricant level lower input work is expected attributing it to reduced particle cohesiveness and decreased frictional effects at the punch faces and die wall (Mollan and Çelik, , 1996; Velasco et al., , 1997).
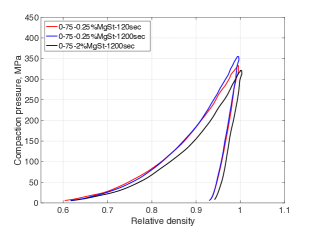
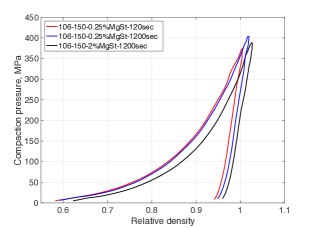
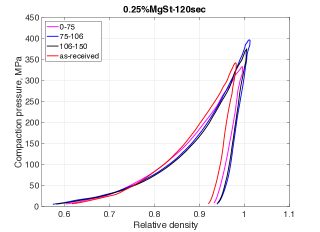
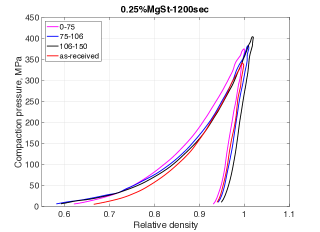
Fig. 3 was plotted to better compare the compaction profiles for different PSD with the same lubrication history. There is no significant difference among the compaction profiles for each condition, indicating that PSD does not affect the deformation behavior of LM with the presence of lubrication. The high initial relative density in the as-received sample compared to the sieved samples, may be explained by its relatively larger standard deviation in PSD (m) (Table 1). The fine particles fill the voids in between the large particles increasing the bulk density of the powder (Yohannes et al., , 2015).
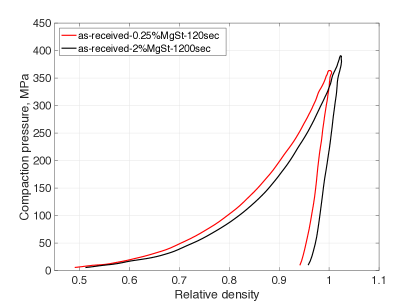
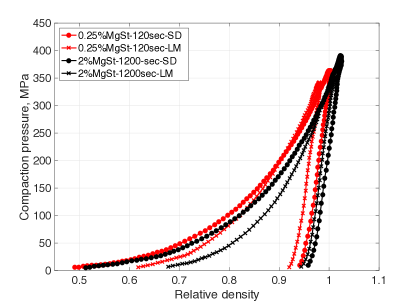
The compaction pressure- in-die relative density profiles of as-received SDL for two extreme lubrication conditions ascertained little lubricant sensitivity of SDL, as depicted in Fig. 4. Fig. 4 compares the compaction behavior between the two as-received powders. The total work input during the compaction process is higher for SDL. Mollan and Çelik, (1996) argued that as the total work input increases, the compacted powder is expected to be stronger as a result of higher energies used to form bonds between particles. If this hypothesis holds, we expect SDL tablets to be much stronger than LM tablets. However, we should be mindful that the energy of a tablet formation that affects the bond strength, according to the first law of thermodynamics, is associated with both the work done on the powder to form a tablet and the heat released by the system (Coffin-Beach and Hollenbeck, , 1983).
It is also interesting to mention that for the same lubrication condition the difference in the compaction profiles between the two powders almost disappears when it reaches its maximum. This happens at relative densities beyond , where the area of true contact between particles is large.
3.2 Effect of particle size on lubricant sensitivity on tensile strength and stiffness of tablets
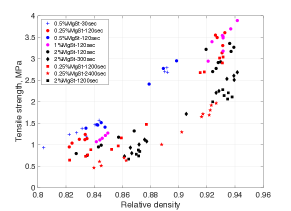
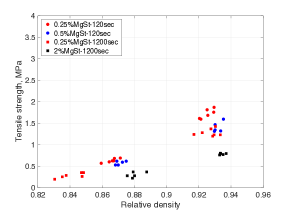
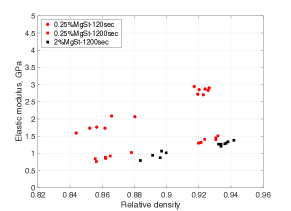
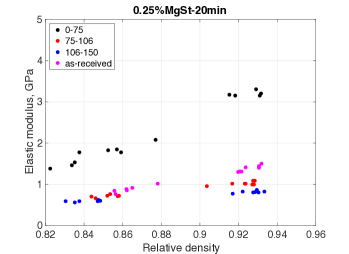
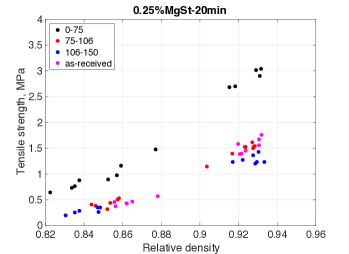
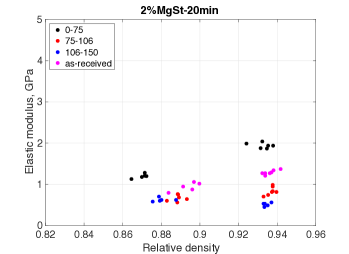
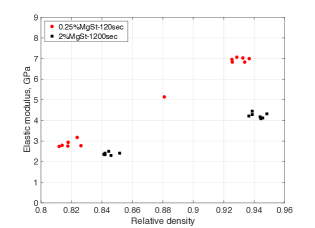
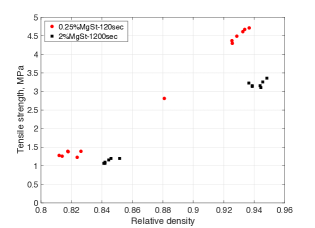
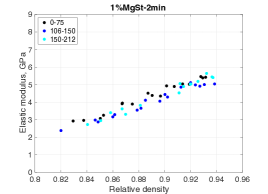
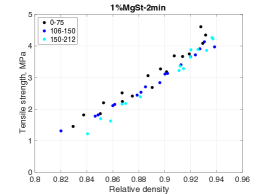
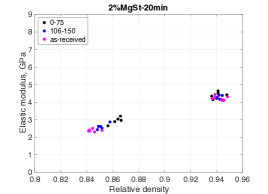
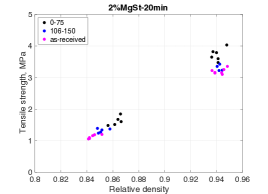
Elastic modulus and tensile strength versus out-of-die relative density for different PSDs of LM tablets are depicted in Fig. 5. As was expected, both the elastic modulus and tensile strength decreased by adding more lubricant and/or mixing time. Although, the effect is more significant in smaller PSD compared to large PSD. This can be attributed to smaller particles having more available surface area to be covered by MgSt coating for the same tablet weight. For all the PSD levels, the lubrication affects the strength and stiffness level until it reaches a saturation regime, where the powder would no longer be affected with the addition of lubricant concentration or mixing time, in accordance with (Kikuta and Kitamori, , 1994). It should be noted that the lubricant concentration and mixing time do not affect the tensile strength and elastic modulus of tablets by the same rate. The results demonstrate an envelope for tensile strength and elastic modulus obtainable for tablets with relative densities ranging between and considering different PSDs and lubricant conditions.
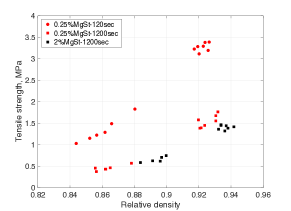
The initial particle size of LM affects the mechanical strength of tablets, as depicted in Fig. 6. Large mean particle sizes exhibited faster response to tablet strength saturation by increasing lubricant concentration and/or mixing time. The reduction in strength of large particles (- m), even for the least lubricated tablets (case ), was to a degree that hardly particles formed a solid and the tablets were extremely weak. Obviously, in practical purposes this level of strength is not desirable but since our goal is to have a model based on lubrication sensitivity we created a vast collection of data.
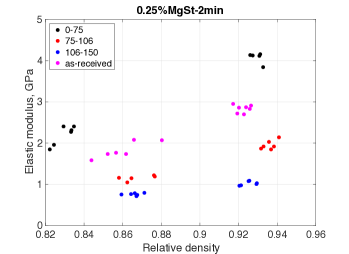
The difference between each PSD is noticeable for the low lubrication condition (i.e., 0.25%MgSt-2min). This may be due to the more available surface area in smaller particles requiring more mixing time to fully be coated by MgSt.
The as-received tablets in the low lubrication condition show high elastic modulus and tensile strength because of having a large population of small particles. However, as the shear strain increases, the larger particles are overlubricated causing a significant drop in the elastic modulus and tensile strength. Altogether, we have observed that the lubricant and PSD sensitivity of LM are more pronounced in the tablet properties than in its deformation behavior during compaction.
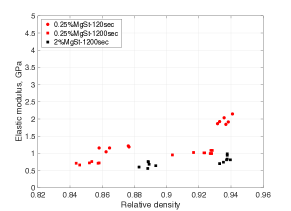
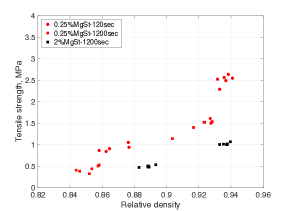
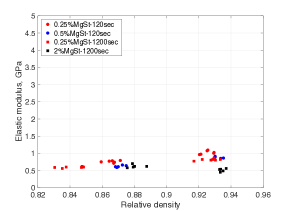
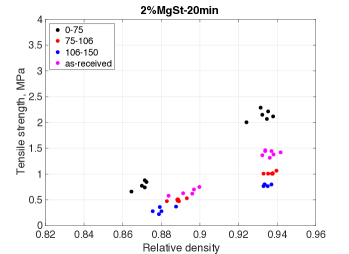
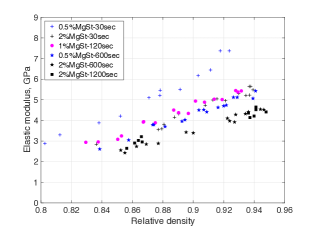
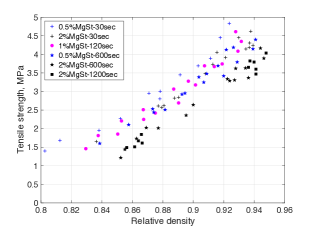
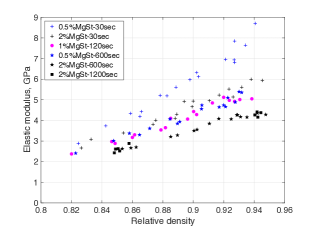
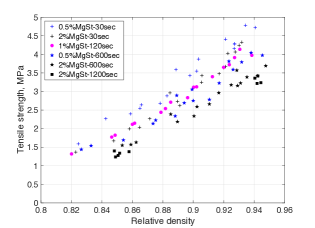
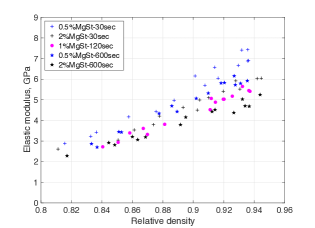
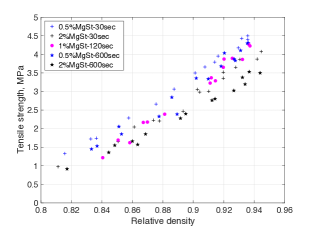
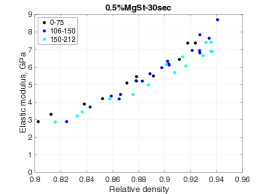
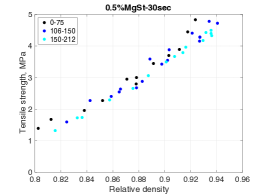
The elastic modulus and tensile strength of all the SDL tablets are plotted against their relative densities for different PSD levels in Fig. 7. SDL shows a non-negligible sensitivity to lubrication and higher values of elastic modulus and tensile strength compared to LM tablets. This difference is more remarkable between the stiffness of tablets compared to the their tensile strength.
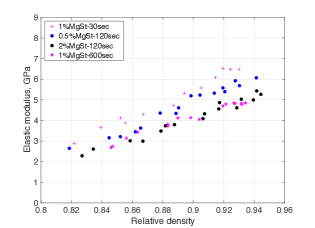
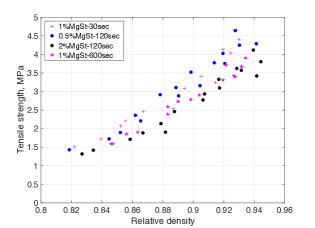
Four different lubrication conditions were selected to compare the PSD effect on the tensile strength and elastic modulus of SDL tablets. According to Fig. 8, unlike LM, particle size does not affect the tensile strength and elastic modulus of SDL tablets, taking into account different lubrication conditions.
All of the 42 cases (cf. Table 1) were individually fitted to Eqs. (6) (Rossi, , 1968) and (7) (Kuentz and Leuenberger, , 2000)
| (6) |
| (7) |
where and are the elastic modulus and tensile strength at zero-porosity, respectively and and are the relative density at which E and go to zero, respectively. Table 2 lists all the fitted parameters and values. A good fit was shown for all the cases ( ), except for the elastic modulus fitting of cases and , due to the implications of acquiring data from these tablets exhibiting low elasticity using the already selected settings on the ultrasound testing.
3.3 Quantitative model of lubrication and particle size distribution effects on tensile strength and stiffness of tablets
Toward quantifying the PSD and lubricant sensitivity effects on mechanical properties of tablets, we introduce a parameter into the tensile strength and elastic modulus relationships with relative density (Eqs. (6) and (7)). For the sake of simplicity and generality, we assume a form for that captures the leading order term of the variables, that is
| (8) |
where {, , , } are the fitting coefficients. The coefficient serves as a scaling parameter that, in addition, makes dimensionless. will depend on the response variable (i.e., tensile strength and elastic modulus) and material properties. Thus, we define four distinct parameters, referred to as and for lactose monohydrate and red and for spray-dried lactose.
In order to introduce into Eqs. (6) and (7), we need to find a relationship between and , , , and . Figs. 5 and 7 show that the data points converge as decreases, in agreement with what authors observed in (Razavi et al., , 2016). Thus, to keep the optimization problem simpler and mathematically less complex, we assume constant and for each powder, regardless of its PSD, lubricant concentration or/and mixing time. Thus, as a first order approximation only and are considered as functions of . We parameterize and as follows
| (9) |
| (10) |
where {, , , } and {, , , } are the fitting parameters presented in function for and , respectively. ( and ) and ( and ) correspond to properties for when and , respectively. Thus, and are the maximum and minimum values can obtain, which are determined by fitting the experimental data to the above equation. The same holds for . For most materials and lubricants, (or ) will go to zero because the lubricants prevent the formation of solid bridges. However, it has been reported that materials, which experience significant fracture may develop some tablet strength even if they are fully lubricated (Kikuta and Kitamori, , 1994). Therefore, the minimum values for and does not need to be zero for “infinite” lubrication. It is worth to emphasize that the functionality of and is in fact unknown. In this study, we parameterized these two functions only in the interest of simplicity and generality. Other functionalities may be explored, which falls outside the scope of this paper.
and were predicted from experimental results by solving the following general optimization problems
where and are a set of experimental points obtained from ultrasound and diametrical compression tests, respectively. In this study, and consisted of points for SDL and points for LM, respectively. It is noted that case (see Table 2) was removed from the optimization. Case from LM dataset and cases and from SDL dataset were randomly taken out and adopted later to validate the model.
The solution to the optimization problems forced and to go to zero for both materials. Thus, Eqs. (9) and (10) were reduced to
The optimal values together with the residual errors for the optimization problems are in Tables LABEL:Table:LM-C and LABEL:Table:SDL-C. For LM, and values indicate that changes in PSD result in more drastic changes in elastic modulus and tensile strength of tablets compared to the lubricant concentration and mixing time. On the other hand, seems to be the most influential variable on the mechanical properties of SDL (see, and values in Tables LABEL:Table:LM-C and LABEL:Table:SDL-C). of SDL resulted in an unrealistic prediction. Hence, we attempted to produce tablets of SDL with no lubrication, but the compaction was not successful due to extremely high frictional and ejection forces. Caution must be taken in interpreting and , since the proposed model does not consider other physical mechanisims that prevent the formation of a tablet.
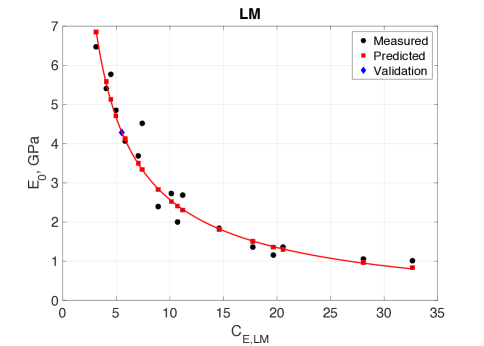
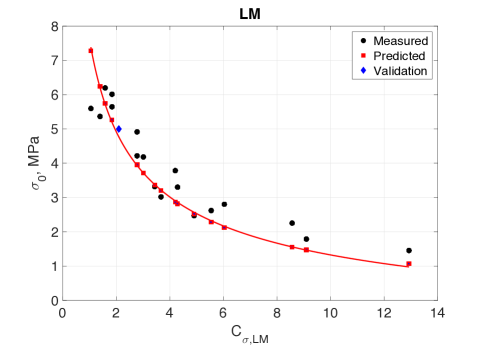
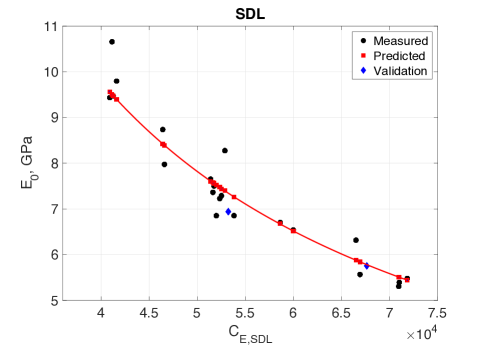
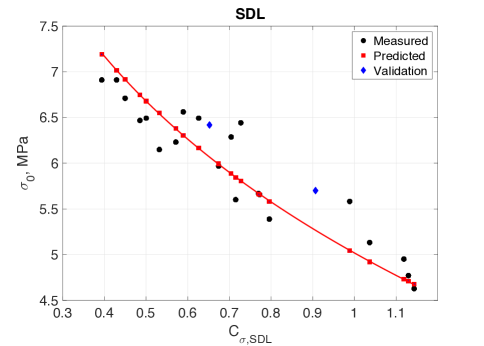
In summary, our proposed strategy shows that elastic modulus (or, tensile strength) is inversely proportional to a non-linear function of material and blending properties and can be presented as follows
| (11) |
| (12) |
The groundwork of our model was to relate the variables that contribute to parameter , to and . Figs. 9 and 10 demonstrate the functionality of the proposed relationship. The model fitted the data well for both materials. The validation points were in good agreement with the predicted curves. It should be noted that our optimization problems were constructed to minimize the sum of squared residuals between the experimental and predicted values of elastic modulus and tensile strength of tablets. Thereby, the fitting coefficients presented in Tables LABEL:Table:LM-C and LABEL:Table:SDL-C are not the optimal values for predicting and .
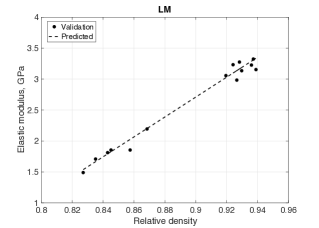
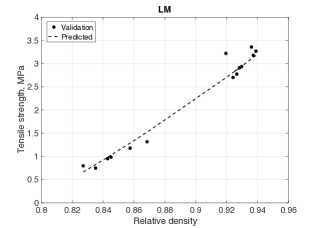
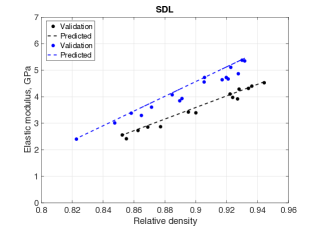
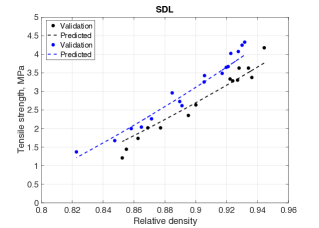
Figs. 11 and 12 compare the validation measurements with model predictions for elastic modulus and tensile strength of LM and SDL tablets, respectively (case for LM and cases and for SDL). The agreement between the validations and model predictions are very promising.
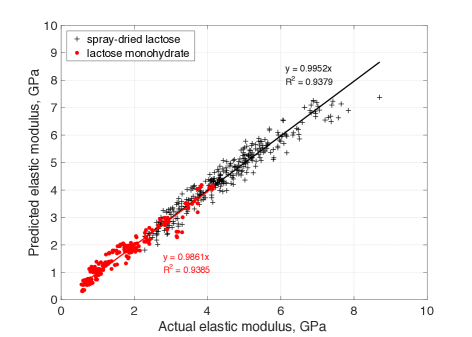
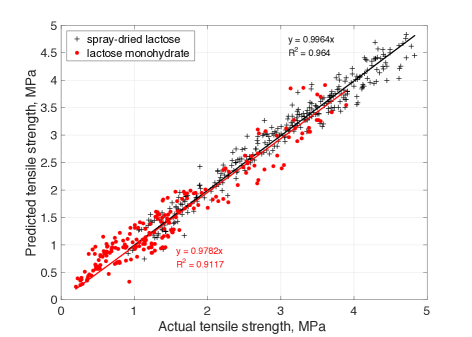
Figs. 13 and 13 show the relationship between actual (measured) and predicted elastic modulus and tensile strength for all the LM and SDL tablets. Good correlations were observed between the predicted and actual values. For elastic modulus predictions, of for both powders was found and for tensile strength predictions was and for SDL and LM, respectively.
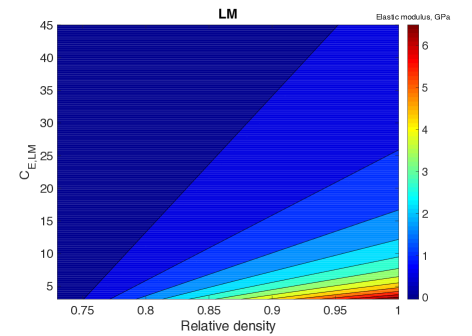
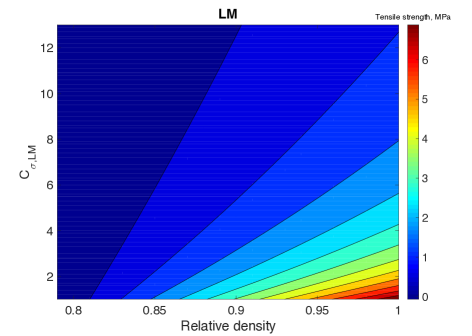
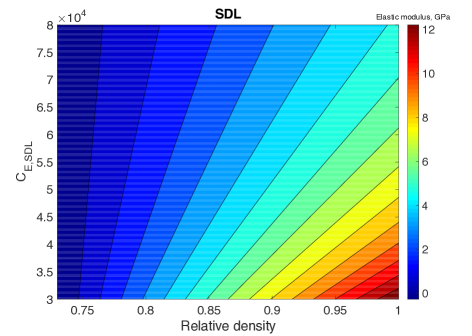
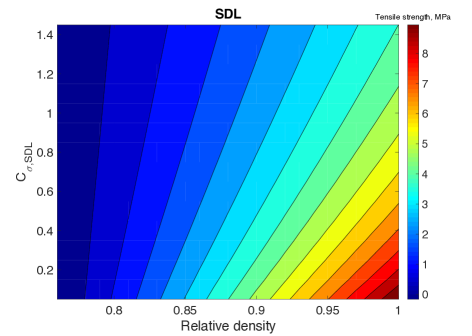
Overall, our proposed model can be successfully adopted to predict the mechanical strength of tablets capturing the lubricant sensitivity and PSD effects. Contour plots of elastic modulus and tensile strength as a function of and relative density for the materials studied are presented in Figs. 14 and 15. Establishing such plots assist to scan through the design space and systematically optimize the formulation and process. The model can be expanded to include other blend properties or processing parameters effects.
4 Summary and conclusion
We have proposed a general framework for predicting a wide range of elastic modulus and tensile strength that a specific powder can attain based on its lubricant sensitivity and considering different particle size distributions. This was possible by introducing a new dimensionless parameter in the existing tensile strength and elastic modulus models of porous materials. Specifically, we propose that the elastic modulus and tensile strength at zero-porosity are a function of MgSt concentration, mixing time and mean PSD, while the relative densities at zero tablet stiffness and strength are not. The model showed good predictability for two grades of lactose, namely monohydrate and spray-dried grades. Possible avenues for extension of the proposed model is studying the applicability to powders that undergo different deformation mechanisms, the generalization to ternary or more complex mixtures, and the integration with optimal relationships for tensile strength of doubly convex tablets (see, e.g., Razavi et al., (2015)). Establishing such predictive models helps drug formulators and manufacturers to optimize lubricant concentration and mixing conditions according to the desired mechanical strength and stiffness of tablets.
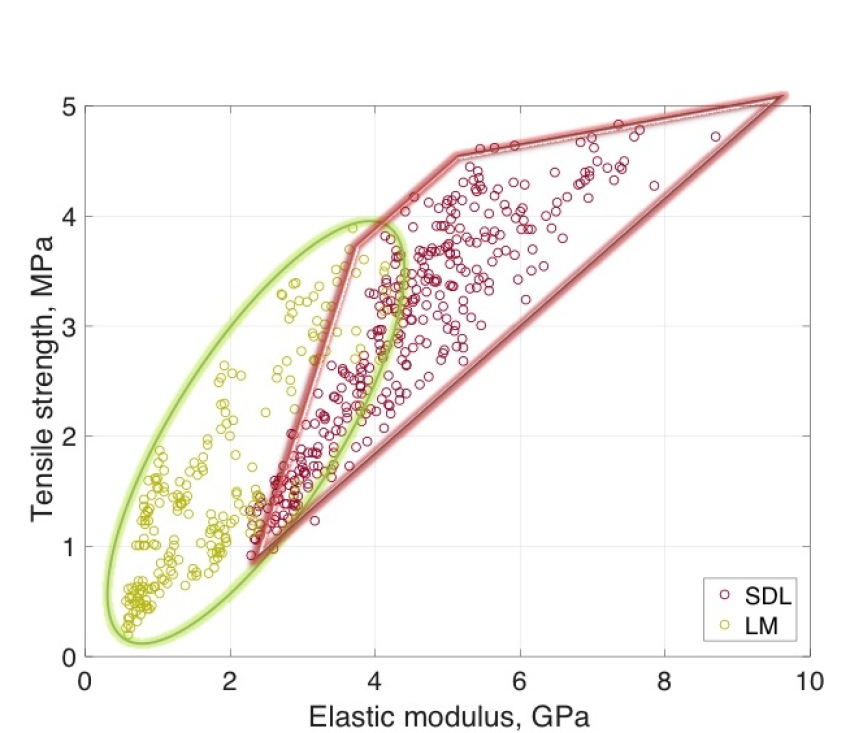
We have covered a wide, if not the widest reported in the literature, strength level of lactose monohydrate and spray-dried lactose tablets with respect to particle size distributions and lubrication conditions. Fig. 16 depicts the tensile strength as a function of elastic modulus of all the lactose monohydrate and spray-dried lactose tablets tested in this study. The data points show a pattern with identifiable zones which provide the achievable design space, i.e., an elliptic space for lactose monohydrate and a trapezoidal space for spray-dried lactose. For a certain formulation, mapping the achievable design space allows for optimizing the processing variables for the desirable table mechanical properties.
We close by discussing opportunities and future work. It is clear that the proposed nonlinear functions for the elastic modulus and tensile strength at zero-porosity are not the only functions of lubrication and particle size parameters that exhibit the experimentally observed behavior. The systematic investigation of these functions is worthwhile directions of future research. Furthermore, the elusidation of the mechanistic basis of these relationships and how lubrication conditions affect particle properties and solid brigde formation during compaction are desirable for fundamentaly understanding the achievable design space map. Thus, particle mechanics simulations capable of describing strength formation and evolution during the compaction process are desirable Gonzalez and Cuitiño, (2012, 2016); Yohannes et al., (2016, 2017); Gonzalez, (2017), if beyond the scope of this paper.
Acknowledgements
The authors gratefully acknowledge the support received from the NSF ERC grant number EEC-0540855, ERC for Structured Organic Particulate Systems. M.G. also acknowledges support from the NSF under grant number CMMI-1538861.
References
- Akseli et al., (2009) Akseli, I., Hancock, B., and Cetinkaya, C. (2009). Non-destructive determination of anisotropic mechanical properties of pharmaceutical solid dosage forms. International journal of pharmaceutics, 377(1):35–44.
- Alderborn and Nyström, (1982) Alderborn, G. and Nyström, C. (1982). Studies on direct compression of tablets. iv. the effect of particle size on the mechanical strength of tablets. Acta Pharmaceutica Suecica, 19(5):381.
- Almaya and Aburub, (2008) Almaya, A. and Aburub, A. (2008). Effect of particle size on compaction of materials with different deformation mechanisms with and without lubricants. AAPS PharmSciTech, 9(2):414–418.
- Asker et al., (1975) Asker, A., Saied, K., and Abdel-Khalek, M. (1975). Investigation of some materials as dry binders for direct compression in tablet manufacture. part 5: Effects of lubricants and flow conditions. Die Pharmazie, 30(6):378–382.
- Bolhuis et al., (1975) Bolhuis, G., Lerk, C., Zijlstra, H., and De Boer, A. (1975). Film formation by magnesium stearate during mixing and its effect on tabletting. Pharm. Weekbl, 110:317–325.
- Bolhuis and Chowhan, (1995) Bolhuis, G. K. and Chowhan, Z. T. (1995). Materials for direct compaction. In Pharmaceutical Powder ComPattion Technology, pages 419–500. CRC Press.
- Bossert and Stains, (1980) Bossert, J. and Stains, A. (1980). Effect of mixing on the lubrication of crystalline lactose by magnesium stearate. Drug Development and Industrial Pharmacy, 6(6):573–589.
- Castellanos, (2005) Castellanos, A. (2005). The relationship between attractive interparticle forces and bulk behaviour in dry and uncharged fine powders. Advances in Physics, 54(4):263–376.
- Coffin-Beach and Hollenbeck, (1983) Coffin-Beach, D. P. and Hollenbeck, R. G. (1983). Determination of the energy of tablet formation during compression of selected pharmaceutical powders. International journal of pharmaceutics, 17(2-3):313–324.
- Dansereau and Peck, (1987) Dansereau, R. and Peck, G. E. (1987). The effect of the variability in the physical and chemical properties of magnesium stearate on the properties of compressed tablets. Drug Development and Industrial Pharmacy, 13(6):975–999.
- De Boer et al., (1978) De Boer, A., Bolhuis, G., and Lerk, C. (1978). Bonding characteristics by scanning electron microscopy of powders mixed with magnesium stearate. Powder Technology, 20(1):75–82.
- De Boer et al., (1986) De Boer, A., Vromans, H., Leur, C., Bolhuis, G., Kussendrager, K., and Bosch, H. (1986). Studies on tableting properties of lactose. Pharmacy World & Science, 8(2):145–150.
- Doelker et al., (1987) Doelker, E., Mordier, D., Iten, H., and Humbert-Droz, P. (1987). Comparative tableting properties of sixteen microcrystalline celluloses. Drug Development and Industrial Pharmacy, 13(9-11):1847–1875.
- Faqih et al., (2006) Faqih, A., Chaudhuri, B., Alexander, A. W., Davies, C., Muzzio, F. J., and Tomassone, M. S. (2006). An experimental/computational approach for examining unconfined cohesive powder flow. International journal of pharmaceutics, 324(2):116–127.
- Faqih et al., (2007) Faqih, A. M. N., Mehrotra, A., Hammond, S. V., and Muzzio, F. J. (2007). Effect of moisture and magnesium stearate concentration on flow properties of cohesive granular materials. International journal of pharmaceutics, 336(2):338–345.
- Fell and Newton, (1970) Fell, J. and Newton, J. (1970). Determination of tablet strength by the diametral-compression test. Journal of Pharmaceutical Sciences, 59(5):688–691.
- Gonzalez, (2017) Gonzalez, M. (2017). Generalized loading-unloading contact laws for elasto-plastic spheres with bonding strength. to be submitted.
- Gonzalez and Cuitiño, (2012) Gonzalez, M. and Cuitiño, A. M. (2012). A nonlocal contact formulation for confined granular systems. Journal of the Mechanics and Physics of Solids, 60(2):333–350.
- Gonzalez and Cuitiño, (2016) Gonzalez, M. and Cuitiño, A. M. (2016). Microstructure evolution of compressible granular systems under large deformations. Journal of the Mechanics and Physics of Solids, 93:44–56.
- Hakulinen et al., (2008) Hakulinen, M., Pajander, J., Leskinen, J., Ketolainen, J., van Veen, B., Niinimäki, K., Pirskanen, K., Poso, A., and Lappalainen, R. (2008). Ultrasound transmission technique as a potential tool for physical evaluation of monolithic matrix tablets. AAPS PharmSciTech, 9(1):267–273.
- Hersey et al., (1967) Hersey, J. A., Bayraktar, G., and Shotton, E. (1967). The effect of particle size on the strength of sodium chloride tablets. The Journal of pharmacy and pharmacology, 19:Suppl–24S.
- Hirai and Okada, (1982) Hirai, Y. and Okada, J. (1982). Effect of lubricant on die wall friction during the compaction of pharmaceutical powders. Chemical and Pharmaceutical Bulletin, 30(2):684–694.
- Hussain et al., (1990) Hussain, M., York, P., Timmins, P., and Humphrey, P. (1990). Secondary ion mass spectrometry (sims) evaluation of magnesium stearate distribution and its effects on the physico-technical properties of sodium chloride tablets. Powder Technology, 60(1):39–45.
- Jarosz and Parrott, (1984) Jarosz, P. J. and Parrott, E. L. (1984). Effect of lubricants on tensile strengths of tablets. Drug Development and Industrial Pharmacy, 10(2):259–273.
- Johansson, (1984) Johansson, M. E. (1984). Granular magnesium stearate as a lubricant in tablet formulations. International journal of pharmaceutics, 21(3):307–315.
- Katikaneni et al., (1995) Katikaneni, P., Upadrashta, S., Rowlings, C., Neau, S., and Hileman, G. (1995). Consolidation of ethylcellulose: effect of particle size, press speed, and lubricants. International journal of pharmaceutics, 117(1):13–21.
- Kikuta and Kitamori, (1994) Kikuta, J.-I. and Kitamori, N. (1994). Effect of mixing time on the lubricating properties of magnesium stearate and the final characteristics of the compressed tablets. Drug development and industrial pharmacy, 20(3):343–355.
- Kuentz and Leuenberger, (2000) Kuentz, M. and Leuenberger, H. (2000). A new model for the hardness of a compacted particle system, applied to tablets of pharmaceutical polymers. Powder technology, 111(1):145–153.
- Kushner and Moore, (2010) Kushner, J. and Moore, F. (2010). Scale-up model describing the impact of lubrication on tablet tensile strength. International journal of pharmaceutics, 399(1):19–30.
- Lachman et al., (1976) Lachman, L., Lieberman, H. A., Kanig, J. L., et al. (1976). The theory and practice of industrial pharmacy. Lea & Febiger Philadelphia.
- Lindberg, (1972) Lindberg, N. (1972). Evaluation of some tablet lubricants. Acta Pharmaceutica Suecica, 9(3):207–214.
- Llusa et al., (2010) Llusa, M., Levin, M., Snee, R. D., and Muzzio, F. J. (2010). Measuring the hydrophobicity of lubricated blends of pharmaceutical excipients. Powder Technology, 198(1):101–107.
- MATLAB, (2016) MATLAB (2016). version 9.0.0.341360 (R2016a). The MathWorks Inc., Natick, Massachusetts.
- McKenna and McCafferty, (1982) McKenna, A. and McCafferty, D. (1982). Effect of particle size on the compaction mechanism and tensile strength of tablets. Journal of Pharmacy and Pharmacology, 34(6):347–351.
- Mehrotra et al., (2007) Mehrotra, A., Llusa, M., Faqih, A., Levin, M., and Muzzio, F. J. (2007). Influence of shear intensity and total shear on properties of blends and tablets of lactose and cellulose lubricated with magnesium stearate. International journal of pharmaceutics, 336(2):284–291.
- Miller and York, (1988) Miller, T. and York, P. (1988). Pharmaceutical tablet lubrication. International journal of pharmaceutics, 41(1-2):1–19.
- Mitrevej et al., (1996) Mitrevej, A., Sinchaipanid, N., and Faroongsarng, D. (1996). Spray-dried rice starch: comparative evaluation of direct compression fillers. Drug development and industrial pharmacy, 22(7):587–594.
- Mollan and Çelik, (1996) Mollan, M. J. and Çelik, M. (1996). The effects of lubrication on the compaction and post-compaction properties of directly compressible maltodextrins. International journal of pharmaceutics, 144(1):1–9.
- Moody et al., (1981) Moody, G., Rubinstein, M., and FitzSimmons, R. (1981). Tablet lubricants I. theory and modes of action. International Journal of Pharmaceutics, 9(2):75–80.
- Narang et al., (2010) Narang, A. S., Rao, V. M., Guo, H., Lu, J., and Desai, D. S. (2010). Effect of force feeder on tablet strength during compression. International journal of pharmaceutics, 401(1):7–15.
- Nyström et al., (1993) Nyström, C., Alderborn, G., Duberg, M., and Karehill, P.-G. (1993). Bonding surface area and bonding mechanism-two important factors fir the understanding of powder comparability. Drug development and industrial pharmacy, 19(17-18):2143–2196.
- Osorio and Muzzio, (2015) Osorio, J. G. and Muzzio, F. J. (2015). Evaluation of resonant acoustic mixing performance. Powder Technology.
- Osorio et al., (2016) Osorio, J. G., Sowrirajan, K., and Muzzio, F. J. (2016). Effect of resonant acoustic mixing on pharmaceutical powder blends and tablets. Advanced Powder Technology, 27(4):1141–1148.
- Otsuka et al., (1993) Otsuka, M., Gao, J. I., and Matsuda, Y. (1993). Effects of mixer and mixing time on the pharmaceutical properties of theophylline tablets containing various kinds of lactose as diluents. Drug development and industrial pharmacy, 19(3):333–348.
- Otsuka et al., (2004) Otsuka, M., Yamane, I., and Matsuda, Y. (2004). Effects of lubricant mixing on compression properties of various kinds of direct compression excipients and physical properties of the tablets. Advanced Powder Technology, 15(4):477–493.
- Pawar et al., (2016) Pawar, P., Joo, H., Callegari, G., Drazer, G., Cuitino, A. M., and Muzzio, F. J. (2016). The effect of mechanical strain on properties of lubricated tablets compacted at different pressures. Powder Technology, 301:657–664.
- Podczeck and Mia, (1996) Podczeck, F. and Mia, Y. (1996). The influence of particle size and shape on the angle of internal friction and the flow factor of unlubricated and lubricated powders. International Journal of Pharmaceutics, 144(2):187–194.
- Ragnarsson and Sjögren, (1985) Ragnarsson, G. and Sjögren, J. (1985). Force-displacement measurements in tableting. Journal of pharmacy and pharmacology, 37(3):145–150.
- Razavi et al., (2016) Razavi, S. M., Callegari, G., Drazer, G., and Cuitiño, A. M. (2016). Toward predicting tensile strength of pharmaceutical tablets by ultrasound measurement in continuous manufacturing. International journal of pharmaceutics, 507(1):83–89.
- Razavi et al., (2015) Razavi, S. M., Gonzalez, M., and Cuitino, A. M. (2015). General and mechanistic optimal relationships for tensile strength of doubly convex tablets under diametrical compression. International Journal of Pharmaceutics.
- Rhines, (1947) Rhines, F. (1947). Seminar on pressing of metal powders. AIME Trans., 171:518–534.
- Roberts and Rowe, (1986) Roberts, R. and Rowe, R. (1986). The effect of the relationship between punch velocity and particle size on the compaction behaviour of materials with varying deformation mechanisms. Journal of pharmacy and pharmacology, 38(8):567–571.
- Rossi, (1968) Rossi, R. (1968). Prediction of the elastic moduli of composites. Journal of the American Ceramic Society, 51(8):433–440.
- Shah and Mlodozeniec, (1977) Shah, A. and Mlodozeniec, A. (1977). Mechanism of surface lubrication: Influence of duration of lubricant-excipient mixing on processing characteristics of powders and properties of compressed tablets. Journal of pharmaceutical sciences, 66(10):1377–1382.
- Shangraw and Demarest, (1993) Shangraw, R. and Demarest, D. (1993). A survey of current industrial practices in the formulation and manufacture of tablets and capsules. Pharmaceutical technology, 17(1):32–32.
- Sheskey et al., (1995) Sheskey, P. J., Robb, R. T., Moore, R. D., and Boyce, B. M. (1995). Effects of lubricant level, method of mixing, and duration of mixing on a controlled-release matrix tablet containing hydroxypropyl methylcellulose. Drug development and industrial pharmacy, 21(19):2151–2165.
- Shotton and Ganderton, (1961) Shotton, E. and Ganderton, D. (1961). The strength of compressed tablets. Journal of Pharmacy and Pharmacology, 13(S1):144T–152T.
- Van der Watt, (1987) Van der Watt, J. (1987). The effect of the particle size of microcrystalline cellulose on tablet properties in mixtures with magnesium stearate. International journal of pharmaceutics, 36(1):51–54.
- Velasco et al., (1997) Velasco, V., Muñoz-Ruiz, A., Monedero, C., and Jiménez-Castellanos, R. (1997). Force-displacement parameters of maltodextrins after the addition of lubricants. International journal of pharmaceutics, 152(1):111–120.
- Vromans et al., (1985) Vromans, H., De Boer, A., Bolhuis, G., Lerk, C., Kussendrager, K., and Bosch, H. (1985). Studies on tableting properties of lactose. Pharmacy World Science, 7(5):186–193.
- Wang et al., (2010) Wang, J., Wen, H., and Desai, D. (2010). Lubrication in tablet formulations. European Journal of Pharmaceutics and Biopharmaceutics, 75(1):1–15.
- Yohannes et al., (2015) Yohannes, B., Gonzalez, M., Abebe, A., Sprockel, O., Nikfar, F., Kang, S., and Cuitino, A. (2015). The role of fine particles on compaction and tensile strength of pharmaceutical powders. Powder Technology, 274:372–378.
- Yohannes et al., (2016) Yohannes, B., Gonzalez, M., Abebe, A., Sprockel, O., Nikfar, F., Kiang, S., and Cuitiño, A. (2016). Evolution of the microstructure during the process of consolidation and bonding in soft granular solids. International journal of pharmaceutics, 503(1):68–77.
- Yohannes et al., (2017) Yohannes, B., Gonzalez, M., Abebe, A., Sprockel, O., Nikfar, F., Kiang, S., and Cuitiño, A. (2017). Discrete particle modeling and micromechanical characterization of bilayer tablet compaction. International journal of pharmaceutics, 529(1-2):597–607.
- Zuurman et al., (1999) Zuurman, K., Van der Voort Maarschalk, K., and Bolhuis, G. (1999). Effect of magnesium stearate on bonding and porosity expansion of tablets produced from materials with different consolidation properties. International journal of pharmaceutics, 179(1):107–115.

| Powder | Cases | PSD (m) | (m) | (m) | (%) | (sec) |
|---|---|---|---|---|---|---|
| Lactose monohydrate | 1 | 0-75 | 62.83 | 22.87 | 0.5 | 30 |
| 2 | 0-75 | 62.83 | 22.87 | 0.25 | 120 | |
| 3 | 0-75 | 62.83 | 22.87 | 0.5 | 120 | |
| 4 | 0-75 | 62.83 | 22.87 | 1 | 120 | |
| 5 | 0-75 | 62.83 | 22.87 | 2 | 120 | |
| 6 | 0-75 | 62.83 | 22.87 | 2 | 300 | |
| 7 | 0-75 | 62.83 | 22.87 | 0.25 | 1200 | |
| 8 | 0-75 | 62.83 | 22.87 | 0.25 | 2400 | |
| 9 | 0-75 | 62.83 | 22.87 | 2 | 1200 | |
| 10 | 75-106 | 114 | 26.89 | 0.25 | 120 | |
| 11 | 75-106 | 114 | 26.89 | 0.25 | 1200 | |
| 12 | 75-106 | 114 | 26.89 | 2 | 1200 | |
| 13 | 106-150 | 149.3 | 25.6 | 0.25 | 120 | |
| 14 | 106-150 | 149.3 | 25.6 | 0.5 | 120 | |
| 15 | 106-150 | 149.3 | 25.6 | 0.25 | 1200 | |
| 16 | 106-150 | 149.3 | 25.6 | 2 | 1200 | |
| 17 | as-received | 77.72 | 31.85 | 0.25 | 120 | |
| 18 | as-received | 77.72 | 31.85 | 0.25 | 1200 | |
| 19 | as-received | 77.72 | 31.85 | 2 | 1200 | |
| Spray-dried lactose | 20 | 0-75 | 65.14 | 17.15 | 0.5 | 30 |
| 21 | 0-75 | 65.14 | 17.15 | 2 | 30 | |
| 22 | 0-75 | 65.14 | 17.15 | 1 | 120 | |
| 23 | 0-75 | 65.14 | 17.15 | 0.5 | 600 | |
| 24 | 0-75 | 65.14 | 17.15 | 2 | 600 | |
| 25 | 0-75 | 65.14 | 17.15 | 2 | 1200 | |
| 26 | 75-106 | 89.39 | 17.74 | 1 | 30 | |
| 27 | 75-106 | 89.39 | 17.74 | 0.5 | 120 | |
| 28 | 75-106 | 89.39 | 17.74 | 2 | 120 | |
| 29 | 75-106 | 89.39 | 17.74 | 1 | 600 | |
| 30 | 106-150 | 120.9 | 27.04 | 0.5 | 30 | |
| 31 | 106-150 | 120.9 | 27.04 | 2 | 30 | |
| 32 | 106-150 | 120.9 | 27.04 | 1 | 120 | |
| 33 | 106-150 | 120.9 | 27.04 | 0.5 | 600 | |
| 34 | 106-150 | 120.9 | 27.04 | 2 | 600 | |
| 35 | 106-150 | 120.9 | 27.04 | 2 | 1200 | |
| 36 | 150-212 | 171.9 | 33.91 | 0.5 | 30 | |
| 37 | 150-212 | 171.9 | 33.91 | 2 | 30 | |
| 38 | 150-212 | 171.9 | 33.91 | 1 | 120 | |
| 39 | 150-212 | 171.9 | 33.91 | 0.5 | 600 | |
| 40 | 150-212 | 171.9 | 33.91 | 2 | 600 | |
| 41 | as-received | 128.3 | 39.5 | 0.25 | 120 | |
| 42 | as-received | 128.3 | 39.5 | 2 | 1200 |
| Powder | Cases | (MPa) | (%) | (GPa) | (%) | ||
|---|---|---|---|---|---|---|---|
| Lactose monohydrate | 1 | 5.6 | 76.16 | 98.07 | 6.47 | 72.93 | 96.30 |
| 2 | 5.36 | 77.27 | 98.57 | 5.4 | 71.29 | 97.62 | |
| 3 | 6.19 | 78.07 | 98.18 | 5.77 | 73.7 | 94.70 | |
| 4 | 5.64 | 79.61 | 98.90 | 4.86 | 74.42 | 98.63 | |
| 5 | 4.99 | 79.7 | 97.34 | 4.28 | 73.14 | 98.14 | |
| 6 | 4.21 | 82.47 | 99.47 | 3.69 | 75.3 | 95.32 | |
| 7 | 4.92 | 80.08 | 98.28 | 4.52 | 75.12 | 97.18 | |
| 8 | 3.31 | 81.26 | 96.98 | 2.4 | 75.68 | 98.37 | |
| 9 | 3.79 | 82.9 | 98.45 | 2.73 | 76.68 | 96.3 | |
| 10 | 4.18 | 82.13 | 98.40 | 2.69 | 76.82 | 96.38 | |
| 11 | 2.81 | 81.9 | 99.11 | 1.36 | 68.71 | 96.26 | |
| 12 | 1.78 | 83.72 | 99.42 | 1.06 | 70.27 | 52.66 | |
| 13 | 3.3 | 82.78 | 99.35 | 1.36 | 69.58 | 93.13 | |
| 14 | 2.47 | 82.34 | 97.24 | 1.16 | 72.02 | 96.73 | |
| 15 | 2.26 | 81.22 | 97.83 | 1.01 | 61.14 | 97.31 | |
| 16 | 1.45 | 84.28 | 98.03 | - | - | - | |
| 17 | 6.01 | 81.05 | 99.03 | 4.07 | 74.52 | 96.60 | |
| 18 | 3.02 | 83.38 | 97.84 | 2 | 75.6 | 98.05 | |
| 19 | 2.62 | 85.1 | 96.90 | 1.84 | 78.37 | 93.57 | |
| Spray-dried lactose | 20 | 6.91 | 74.65 | 96.21 | 9.8 | 72.78 | 96.51 |
| 21 | 6.49 | 77.13 | 96.37 | 7.23 | 74.09 | 95.87 | |
| 22 | 6.56 | 76.89 | 95.70 | 7.29 | 72.45 | 97.21 | |
| 23 | 6.23 | 76.76 | 95.84 | 6.85 | 73.55 | 96.97 | |
| 24 | 5.7 | 79.32 | 97.42 | 5.76 | 74.42 | 98.33 | |
| 25 | 5.58 | 79.22 | 98.46 | 5.48 | 70.42 | 96.24 | |
| 26 | 6.15 | 75.09 | 95.24 | 8.74 | 72.71 | 97.45 | |
| 27 | 6.49 | 76.39 | 94.93 | 7.98 | 74.2 | 97.03 | |
| 28 | 5.39 | 76.86 | 94.93 | 6.7 | 74.06 | 97.19 | |
| 29 | 5.67 | 76.87 | 97.79 | 6.54 | 72.75 | 97.32 | |
| 30 | 6.71 | 75.2 | 96.60 | 10.66 | 76.53 | 96.18 | |
| 31 | 5.6 | 76.17 | 94.68 | 7.5 | 72.96 | 96.67 | |
| 32 | 5.97 | 76.19 | 98.73 | 6.85 | 73.25 | 96.76 | |
| 33 | 6.42 | 77.87 | 96.75 | 6.94 | 73.27 | 96.15 | |
| 34 | 5.13 | 77.73 | 96.52 | 5.57 | 72.62 | 97.07 | |
| 35 | 4.77 | 77.87 | 99.22 | 5.39 | 71.23 | 98.72 | |
| 36 | 6.47 | 75.51 | 99.62 | 9.43 | 74.48 | 96.44 | |
| 37 | 5.66 | 76.74 | 98.25 | 7.65 | 73.37 | 96.33 | |
| 38 | 6.44 | 79.05 | 98.52 | 7.37 | 74.81 | 97.50 | |
| 39 | 6.29 | 77.22 | 96.61 | 8.27 | 74.77 | 97.77 | |
| 40 | 4.95 | 76.83 | 98.84 | 6.31 | 71.99 | 96.65 | |
| 41 | 6.91 | 76.36 | 99.54 | 9.47 | 73.97 | 99.30 | |
| 42 | 4.63 | 78.08 | 99.53 | 5.3 | 71.68 | 98.06 |
| Powder | (GPa) | E-norm | |||||
|---|---|---|---|---|---|---|---|
| Lactose monohydrate | 28.1221 | 0.1491 | 0.2645 | 1.7082 | 841.377 | 0.7316 | 3.31 |
| Spray-dried lactose | 390932.897 | 0.1654 | 0.0859 | -0.0179 | 0.0000266 | 0.7354 | 5.529 |
| Powder | (MPa) | -norm | |||||
|---|---|---|---|---|---|---|---|
| Lactose monohydrate | 14.9186 | 0.1982 | 0.301 | 1.2984 | 498.924 | 0.7924 | 3.739 |
| Spray-dried lactose | 10.0276 | 0.3342 | 0.1237 | 0.2154 | 7.5374 | 0.7653 | 3.31 |