Direct observation of double exchange in ferromagnetic La0.7Sr0.3CoO3 by broadband ellipsometry
Abstract
We present results of our broadband ellipsometry measurements of the optical response of ferromagnetic La0.7Sr0.3CoO3. Our data show that the ferromagnetic transition is accompanied by a transfer of optical spectral weight from an absorption band centered at 1.5 eV to a narrow component of the Drude-like peak. The associated reduction of the intraband kinetic energy is significantly larger than , confirming that the double exchange plays a major role in the ferromagnetism of doped cobaltites. In conjunction with results of recent theoretical studies, the temperature dependence of the Drude-like peak suggests that the double exchange is mediated by orbitals.
pacs:
xxxTransition metal oxides with the perovskite structure are well known for their spectacular electronic and magnetic properties such as superconductivity in cuprates and colossal magnetoresistance associated with the ferromagnetic transition in hole doped manganites Tokura (2006). While consensus has been reached that the ferromagnetism in the manganites is caused by the double exchange (DE) mechanism mediated by electrons, the origin of ferromagnetism in related pseudocubic cobaltites La1-xSrxCoO3 (), with comparable values of the Curie temperature () reaching up to 250 K, is still being debated Merz et al. (2010); Samal and Kumar (2011); Fuchs et al. (2013); Othmen et al. (2014); Lazuta et al. (2015); Smith et al. (2016); Li et al. (2016). The physics of the cobaltites is considerably complicated by a quasidegeneracy between several spin states of a Co ion. This is caused by a competition between the Hund’s rule coupling and the crystal field splitting Maekawa et al. (2004). In this context, it is of high importance to find out whether the cobaltites exhibit optical signatures of the DE comparable to those observed in the manganites. Recall that the hallmark of the DE mechanism in the manganites is a lowering of the effective kinetic energy of charge carriers occurring upon the transition from the paramagnetic (PM) to the ferromagnetic (FM) state Blundell (2001). It manifests itself in the optical conductivity as a transfer of spectral weight (SW) from a band at a finite energy in the PM state to the Drude-like peak in the FM state Okimoto et al. (1995). The band is due to the so-called wrong spin transition (WST) Quijada et al. (1998); Takenaka et al. (2000, 2002) arising from hopping of carriers between sites with misaligned spins Okimoto et al. (1995); Furukawa (1995); Quijada et al. (1998); Takenaka et al. (2000, 2002); Chattopadhyay et al. (2000); Michaelis and Millis (2003).
In order to explore possible optical signatures of DE and contribute to the clarification of the mechanism of ferromagnetism in hole doped cobaltites, we have measured their optical response as a function of temperature () using broadband ellipsometry. The early optical study of doped cobaltites by Tokura et al. Tokura et al. (1998) is limited to room temperature. We observed the SW transfer between a WST band and the Drude-like peak similar to the one reported in manganites. The fact, that the associated reduction of the intraband kinetic energy is significantly larger than , demonstrates that ferromagnetism in cobaltites is indeed driven by a DE mechanism.
30 nm thin film of La0.7Sr0.3CoO3 (LSCO) was grown by pulsed laser deposition (PLD) on 10 10 mm2 substrates (La0.7Sr0.3) (Al0.65Ta0.35)O3 (LSAT) Ali . The samples were annealed at the deposition temperature of 650 ∘C under 10 Torr oxygen pressure to decrease oxygen vacancy concentration Ali . X-ray diffraction measurements confirmed that the film is epitaxial, see Supplemental Material (SM) SOM . Broadband ellipsometry measurements were performed using three ellipsometers: Woollam VASE ellipsometer (0.6–6.5 eV), Woollam IR-VASE ellipsometer (0.08–0.65 eV) and an in-house built ellipsometer for the far-infrared range (0.01–0.08 eV) Friš and Dubroka (2017). For each measured photon energy value, the optical conductivity of the film was obtained from the ellipsometric angles and using the model of coherent interferences in a layer on a substrate. The optical response of the substrate was measured on a bare substrate. In this way, the optical response was obtained without extrapolations needed for a Kramers-Kronig analysis used, e.g. in reflectivity data analysis. The film thickness was determined using ellipsometry and X-ray diffraction. The magnetic moments were measured using a vibrating sample magnetometer.
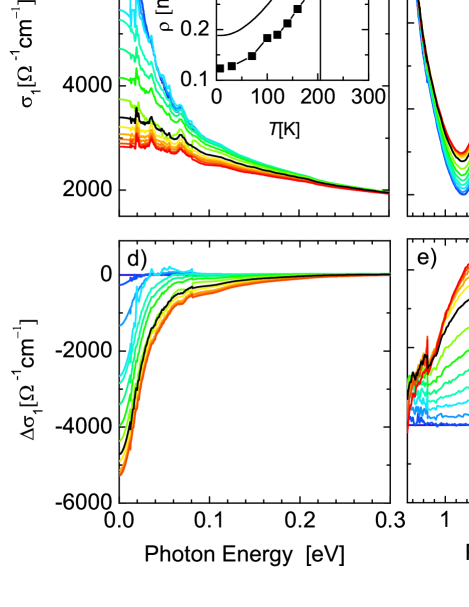
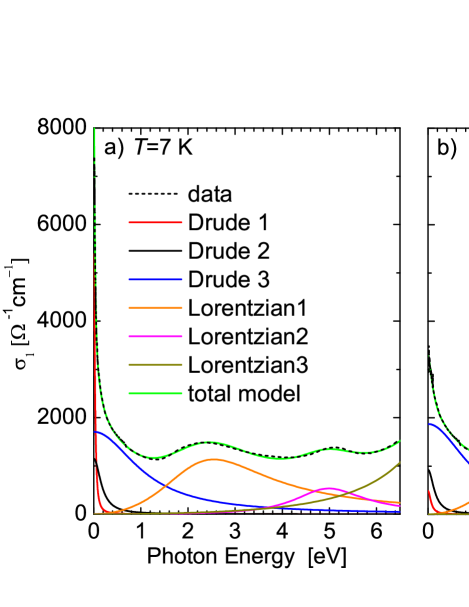
The resulting spectra of the real part of the optical conductivity, , of LSCO deposited on LSAT are shown in Fig. 1a) for K close to K and for the lowest of our measurements (7 K). Figures 1b) and 1c) show all measured spectra on a magnified scale. The values of for energies lower than 0.01 eV were obtained using extrapolations based on a Kramers-Kronig consistent model introduced below. The corresponding spectra of the PLD target were found to be very similar SOM . The spectra of exhibit a Drude-like peak at low energies and two absorption bands centred around 2.3 eV and 5.1 eV, see Fig. 1a). Based on the results of Ref. Jeong et al. (2014), we assign the absorption band centred at 2.3 eV to the O to Co charge transfer transition. At low , exhibits metallic behaviour with fairly high values of reaching cm-1 for [see Fig. 1(b)], but even above K, the low frequency response is still very metallic with high values of of cm-1. The spectra do not exhibit any signatures of Jahn-Teller localization (for details, see SM SOM ), in agreement with results of Ref. Sundaram et al. (2009). The inset of Fig. 1(b) displays the dependencies of and the directly measured DC resistivity . The values of agree within 30% with the resistivity measured on a single crystal Aarbogh et al. (2006), which demonstrates that our thin film is of high quality and indicates that its optical properties are fairly close to the bulk ones. The magnitude of is by a factor of about 1.4 larger than that of which is an effect typically observed on thin films due to linear defects Quijada et al. (1998). The dependencies of and display a clear anomaly at K similar to that of the single crystal Aarbogh et al. (2006), indicating that double exchange should be considered as a plausible mechanism for the magnetic ordering.
Next, we address in detail the dependence of . Figures 1d) and 1e) show differential spectra: . With increasing temperature, strongly decreases below 0.1 eV and, on the contrary, a band is formed with the maximum at ca 1.5 eV. This is analogous to the DE related SW redistribution occuring in manganites, where the FMPM transition is associated with a SW transfer from the Drude peak to a band centered at 3.2 eV Quijada et al. (1998); Takenaka et al. (2000).
We quantified the frequency and dependence of the optical SW in terms of the effective number of charge carriers per unit cell, , defined as
| (1) |
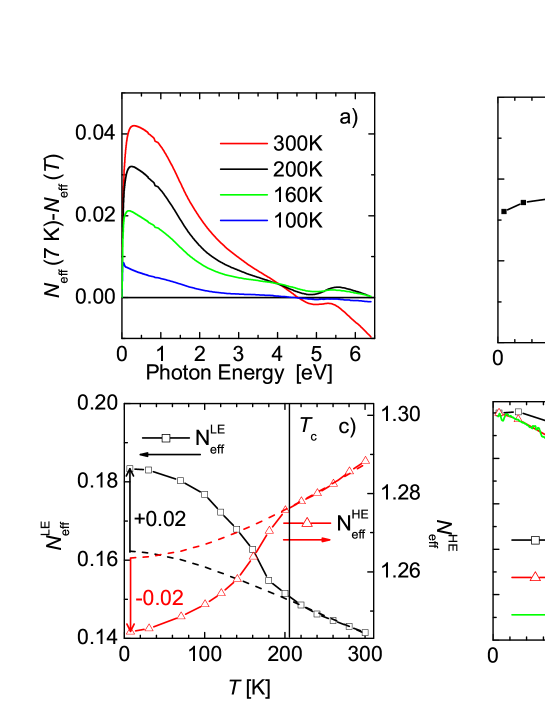
where is the electron mass, is unit cell volume and is the electron charge. The quantity represents an estimate for the number of charge carriers per unit cell responsible for absorption between and . Figure 2a) displays the energy dependence of the difference demonstrating that the SW between 0 and eV is essentially temperature independent. Figure 2b) confirms that the dependence of is very weak. Figures 1b) and 1c) show that the data exhibit an isosbestic point (a point where is almost independent) at =0.3 eV. Motivated by this finding, we plot in Fig. 2c) the dependence of the low energy SW, , defined as eV) and that of the high energy SW, , defined as . Both quantities display a pronounced anomaly at 200 K . This finding demonstrates that a part of the SW transfer between high and low energies is due to the FM transition and implies that the onset of the FM order is associated with a kinetic energy saving characteristic of the DE mechanism.
The dependences of the SWs in Fig. 2c) are, in addition to the DE, influenced by a common narrowing of the Drude peak due to the increase of the quasi-particle lifetime with decreasing . We attempted to separate the two contributions by approximating the “normal” components of the dependences with extrapolations based on fits of the high temperature segments using a background function SOM . In Fig. 2c) they are represented by the dashed lines. The estimated magnitude of the DE related contribution, [see the vertical arrows in Fig. 2c)], is approximately . Figure 2d) displays the dependences of , (the SWs with the background contributions subtracted) together with the dependence of , where is the measured magnetisation. The dependences are very similar which indicates that the observed FM related SW changes are connected to the energetics of the FM transition Blundell (2001).
In order to obtain additional insight into the optical response, we modeled the complex conductivity using the Drude-Lorentz model of the dielectric function
| (2) |
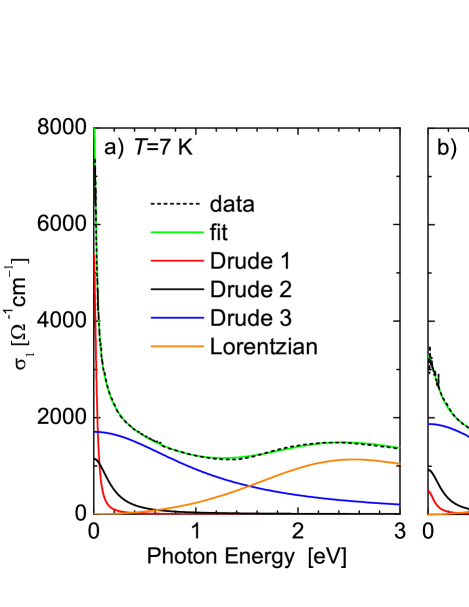
where the second and the third terms on the right side represent the Drude and the Lorentz contributions, respectively, parameters and are plasma frequencies, and broadening parameters, and frequencies of the Lorentz terms. Figures 3a) and 3b) show the experimental data and fits for K and on a magnified scale. The complete set of obtained parameter values can be found in SM SOM . It turns out that the interband transitions at 2.3 eV and 5.1 eV can be represented by only one Lorentz term per transition. However, in order to obtain a reasonable fit of the free carrier response, three Drude terms are required with , 0.17 and 1 eV at 7 K (0.07, 0.15 and 1 eV at 220 K) and with the corresponding SWs proportional to , 1.5 and 14 eV2 at 7 K (0.25, 1.0 and 14 eV2 at 220 K), respectively. It appears that only the two narrower Drude terms change significantly with whereas the broadest Drude term is almost independent.
This behaviour can be qualitatively understood based on results of a recent LDA+DMFT study Augustinský et al. (2013), which indicates that both and bands cross the chemical potential. The band has a large bandwidth and its quasiparticles are strongly damped by correlations and the corresponding broadening of the spectral function is about 0.6 eV. In contrast, the band has a relatively small bandwidth and its quasiparticles are much less damped, with the broadening of about 0.04 eV. In view of these results we suggest that the broadest Drude term mainly corresponds to the response of the bands and the two narrower Drude terms correspond to the response of the bands. The SW of the broadest Drude term is about 5 times higher than the sum of the SWs of the two narrower Drude terms, which correlates with the large difference between the predicted (e.g. in Ref. Augustinský et al. (2013)) bandwidths of the two channels.
Note that in manganites at low temperature, the Drude peak is also composed of a narrow and a broad component Takenaka et al. (2002). However, the components exhibit a similar and pronounced temperature dependence, which suggests that they originate from the same band. Relatively, the sum of the SWs of the two narrower Drude terms increases by a factor of two when going from to the lowest temperature, which is comparable to the two-fold increase of the intraband SW occuring in manganites Quijada et al. (1998). The magnitude of the total SW transfer upon the FM transition, , is approximately 7 times lower than the one observed in manganites Quijada et al. (1998); Takenaka et al. (2000, 2002), for details see SM SOM . This difference is presumably due to the narrow bandwidth of the bands compared to the bands in manganites. The fact, that below spectral weight is transferred only to the narrow component of the Drude peak, is consistent with the DE mediated by electrons, as recently suggested Merz et al. (2010); Fuchs et al. (2013). The associated saving of the intraband kinetic energy, Basov and Timusk (2005); SOM , where Å is the pseudocubic lattice parameter, is about 30 meV. Albeit smaller than in manganites, this value is larger than meV, which shows that the kinetic energy reduction plays an important role in the mechanism of ferromagnetism in doped cobaltites.
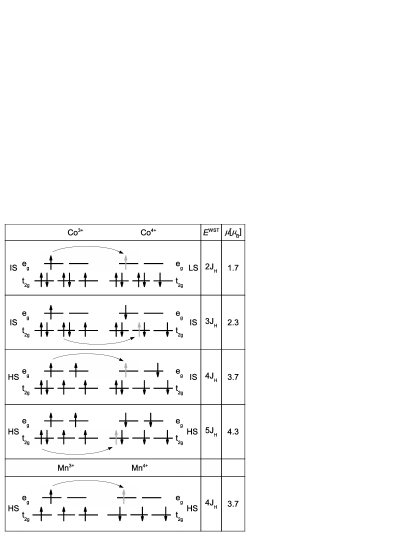
Next, we address the origin and the properties of the 1.5 eV band in Fig. 1e). As discussed above, the dependence of its SW correlates with that of the narrow Drude peak, in a way remarkably similar to that of the WST feature in manganites. Based on this observation we suggest that the 1.5 eV band is also a result of a WST. To clarify the nature of this WST, we first consider, for the sake of simplicity, weakly coupled pairs of Co sites with well defined spin states Lee . Examples of corresponding WST from a Co3+ ion to a Co4+ ion are shown in Fig. 4. The abbreviations IS and HS in the Co3+ column [LS, IS, HS in the Co4+ column] stand for the intermediate ( ) and high spin ( ) configurations of Co3+ [low ( ), intermediate ( ) and high spin ( ) configurations of Co4+]. The WSTs, indicated by the long arrows, result in excited states with one unpaired electron whose spin is oriented antiparallel to those of other unpaired electrons at the same site. Note that the optical process preserves the electron spin. For comparison, the bottom panel of Fig. 4 shows the WST between Mn3+ and Mn4+ occurring in manganites. Finally, the energies of the WST and the average values of the magnetic moment per transition metal site are given in the second and the third columns, respectively. The energies have been obtained using the Hund’s rule coupling Hamiltonian Ham
| (3) |
where the sum runs over all pairs of 3d orbitals, is the coupling constant and is the spin operator for the orbital . Clearly, the WST appear due to the presence of pairs of transition metal sites with misaligned spins. In the FM phase, the complete alignment of spins allows for the coherent transport of charge carriers. The WST is absent and the spectral weight it had in the PM state is transferred to the Drude peak. The corresponding lowering of the effective kinetic energy is the essence of the DE mechanism. Note that the value of can be reduced with respect to that expected within the ionic limit due to a partially itinerant character of charge carriers. For manganites, this has been suggested to reduce the value of from to ca Furukawa (1995); Chattopadhyay et al. (2000); Michaelis and Millis (2003); Lin and Millis (2008).
Importantly, in Fig. 4 is approximately proportional to . Provided the values of (Co) and (Mn) are approximately the same, the values of for LSCO and LCMO can be expected to be similar. Indeed, for LSCO the experimental values, eV and Samal and Kumar (2011); SOM , yield eV/, which is comparable to the value of eV/ for LSMO. The latter has been obtained using eV Quijada et al. (1998) and Martin et al. (1996). In the most simple picture, the facts that is about one half of and that would point to the first row of Fig. 4. Results of a recent X-ray study Merz et al. (2010), however, indicate that the Co ions are partially in the LS and partially in the HS configuration, rather than in the IS one. This point of view is supported by the LDA+DMFT study Augustinský et al. (2013), which argues that the average occupations of HS-related and LS-related states are approximately 30% and 70%, respectively Augustinský et al. (2013). This offers the following qualitative picture of the DE in cobaltites: the DE is connected to the HS states and meditated by the electrons. As a consequence of the admixture of low spin states, can be expected to be considerably lower than of the extreme HS-HS case (shown in the fourth row in Fig. 4).
In summary, we have observed that the ferromagnetic transition in La0.7Sr0.3CoO3 is associated with a transfer of spectral weight from an absorption band centered at 1.5 eV to a narrow component of the Drude peak.
Similarly to the manganites, the band can be interpreted in terms of a wrong spin transition involving Co sites with misaligned spins. Its energy is lower than that of the corresponding band in manganites which is consistent with a lower value of the ordered magnetic moment. The fact that the FM influences only the narrow and relatively weak component of the Drude peak, in conjunction with results of a recent theoretical study Augustinský et al. (2013), suggests that the double exchange is mediated by orbitals. The associated reduction of the intraband kinetic energy is significantly larger than , confirming that the double exchange is indeed at the heart of ferromagnetism in doped cobaltites.
Acknowledgements.
We acknowledge helpful discussions with J. Chaloupka, D. Fuchs, G. Khaliullin and K. Knížek and magnetic measurements at IPM ASCR supervised by M. Hapla. This work was financially supported by the MEYS of the Czech Republic under the project CEITEC 2020 (LQ1601) and carried out with the support of CEITEC Nano Research Infrastructure (MEYS CR, 2016–2019).Supplemental material for “Direct observation of double exchange in ferromagnetic La0.7Sr0.3CoO3 by broadband ellipsometry”
.1 X-ray diffraction data on La0.7Sr0.3CoO3 thin film
a)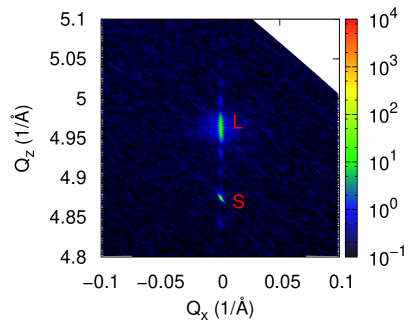 b)
b)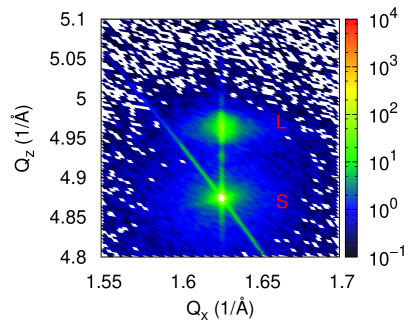
The structure of the La0.7Sr0.3CoO3 thin film deposited on LSAT substrate has been characterized using high resolution x-ray diffraction. We have used Rigaku SmartLab diffractometer equipped with a copper x-ray tube, parabolic multilayer mirror, 2-bounce Ge(220) monochromator and Dtex solid state detector. The resulting reciprocal space maps measured in the vicinity of 003 and 103 reciprocal lattice points at room temperature, are shown in Fig. S5a) and b) respectively. The layer peak, L, and the substrate peak, S, are in the same position in both reciprocal space maps indicating perfect pseudomorphic growth of the layer. The value of the lattice parameter of the substrate has been determined as Å and that of the out-of-plane lattice parameter of the layer is Å. Using the value of the pseudocubic lattice parameter of polycrystalline LSCO of Å, we have obtained the in-plane strain component and the out-of-plane strain component .
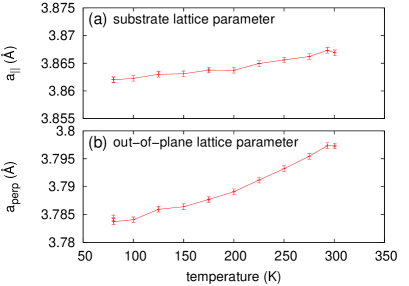
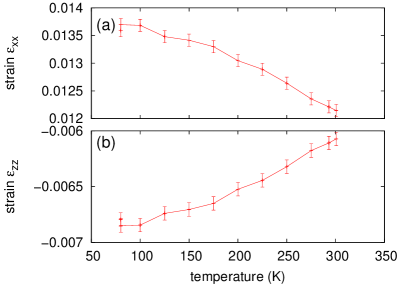
Furthermore, we have measured the positions of 002, 003 and 103 x-ray diffraction peaks as a function of temperature in order to determine the temperature dependence of the strain. The measurements were performed using Anton Paar TTK450 liquid nitrogen cooled x-ray cryostat. The resulting temperature dependences of the substrate lattice parameter and of the out-of-plane thin film lattice parameter are shown in Fig. S6a) and S6b), respectively. Since the thin film is laterally lattice matched to the LSAT substrate, their in-plane lattice parameters are equal. Using the Poisson ratio value of 0.25, we have determined the temperature dependences of the thin film in-plain and out-of-plain strain components and shown in Fig. S7a) and S7b), respectively. The thermal expansion coefficient of the layer is higher than the substrate one which leads to about 10% increase of the elastic strain with cooling from 300 K to 77 K.
.2 Discussion of Jahn-Teller localisation
At low temperatures, of the thin film exhibits metallic behaviour with fairly high values of reaching cm-1 for K, see Fig. 1b) of the main text. This value is comparable to the value of approximately 9000 cm-1 reported for La0.7Sr0.3MnO3 (LSMO) Okimoto et al. (1997); Quijada et al. (1998). Above K, the low frequency response is still very metallic with high values of of cm-1. These values are significantly higher than the corresponding value for LSMO at of approximately 300 cm-1, see Ref. Okimoto et al. (1997). The low conductivity in the PM state of manganites is caused by a partial charge localization due to the Jahn-Teller (JT) distortion which also produces a strong band at approximately 1 eV Quijada et al. (1998); Takenaka et al. (2002). Since our PM state spectra are very metallic and do not exhibit any pronounced band below 1 eV, we conclude that in LSCO the charge localization due to the JT effect is absent or not significant, which is in agreement with results obtained using local structure techniques Sundaram et al. (2009).
.3 Saturated magnetic moment

Figure S8 displays the magnetic moment per Co site of the La0.7Sr0.3CoO3 thin film at 4 K obtained using vibrating sample magnetometer as a function of the field applied along the sample surface. A diamagnetic response from the LSAT substrate was subtracted. The saturated magnetic moment is about 1.5 , which is a typical value for bulk La0.7Sr0.3CoO3 Samal and Kumar (2011). This indicates that the magnetic state of our thin film is close to that of the magnetic state of bulk La0.7Sr0.3CoO3. The hysteresis loop exhibits two steps that are likely due to differences in the coercive fields Prieto-Ruiz et al. (2015) between the material close to the substrate–thin film boundary and close to the surface.
.4 Spectral weight considerations
The “normal” components of the dependent spectral weights shown in Fig. 2c) of the main text and in Fig. S11 have been obtained by extrapolations based on fits of the segments above , using the background function . This function allows one to approximate both the high temperature quasi-linear trend and the quadratic dependence occurring at low temperatures, expected in case of an electron-electron scattering.
Several values of in manganites can be found in the literature: 0.22 for La0.7Sr0.3MnO3 (LSMO) thin film (the value has been determined from the data at 2.7 eV in Fig. 3 of Ref. Quijada et al. (1998)), 0.145 for La0.825Sr0.175MnO3 bulk (the value has been determined as the sum of and of Fig. 3b) of Ref. Takenaka et al. (2000)) and 0.13 for La0.6Sr0.4MnO3 bulk (the value determined from the data at 2.7 eV in the inset of Fig. 3 in Ref. Takenaka et al. (2002)). Note, however, that these estimates have not been corrected for the “normal” narrowing of the Drude-like peak. Based on our analysis of the data of the LSCO film contained in the main text, we expect that also in the manganites, the normal contribution to is not larger than 30%. It implies that the corrected FM related SW change in manganites is in the range from ca 0.1 to ca 0.2, where the scatter is due to the scatter in the literature data. This gives . Alternatively, one could compare the values before the correction procedure, which yields a very similar outcome.
Concerning the effective kinetic energy: note that Refs. Quijada et al. (1998); Lin and Millis (2008) contain discussions of the kinetic energy along a particular direction, that is given by (see, e.g. Ref. Basov and Timusk (2005))
| (4) |
The total kinetic energy of an isotropic material is three times higher, i.e.,
| (5) |
.5 Values of the fitting parameters obtained by fitting the thin film data presented in the main text
| Drude terms | 7 K | 220 K |
|---|---|---|
| 1.04 0.01 | 0.5 0.5 | |
| 0.027 0.001 | 0.07 0.02 | |
| 1.23 0.02 | 1.0 0.1 | |
| 0.177 0.006 | 0.15 0.03 | |
| 3.73 0.04 | 3.72 0.02 | |
| 1.09 0.03 | 0.99 0.02 | |
| Lorenz terms | 7 K | 220 K |
| 4.9 0.4 | 5.3 0.3 | |
| 2.55 0.04 | 2.48 0.04 | |
| 2.8 0.2 | 3.2 0.2 | |
| 2.7 0.5 | 2.5 0.3 | |
| 4.99 0.07 | 5.00 0.05 | |
| 1.8 0.4 | 1.8 0.2 | |
| 9.93 0.08 | 9.92 0.08 | |
| 8.66 | 8.66 | |
| 2.6 0.2 | 2.5 0.2 |
.6 Data from polycrystalline La0.7Sr0.3CoO3 PLD target
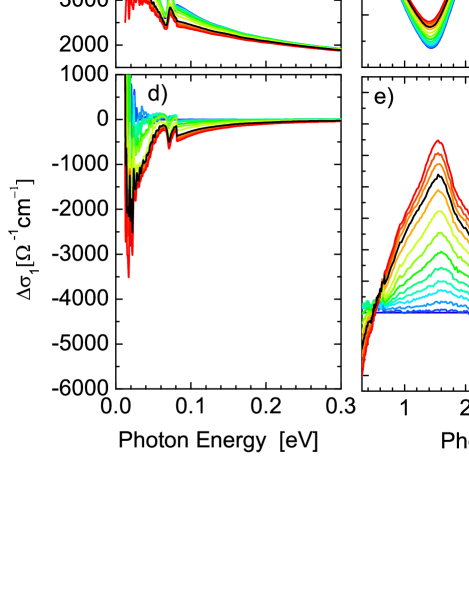
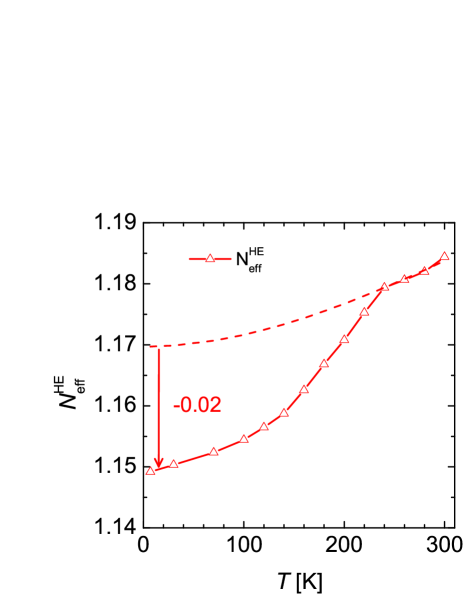
Figure S10 shows optical data of the polished polycrystalline La0.7Sr0.3CoO3 PLD target with K used for the deposition. Overall, the data are very similar to those of the thin film presented in the main text. There are minor differences, particularly in the far-infrared range, where the phonon near 0.07 eV has an anomalous line shape and an enhanced SW because of the effective medium effects due to grain boundaries. Nevertheless, the WST band visible in the differential spectra in Fig. S10e) is very similar to that of the thin film: the band maximum occurs at the same energy of about 1.5 eV and the temperature dependence of the SW between 0.5 eV (i.e. the energy of the isosbestic point) and 5 eV shows the same 0.02 difference with respect to the background [see Fig. S11]. This suggests that the epitaxial strain, induced by the relatively small lattice mismatch between LSAT and the thin film (1.2%), does not significantly alter magnetic and electronic properties of doped La0.7Sr0.3CoO3, in agreement with the observation of Ref. Fuchs et al. (2013).
References
- Tokura (2006) Y. Tokura, Rep. Prog. Phys. 69, 797 (2006).
- Merz et al. (2010) M. Merz, P. Nagel, C. Pinta, A. Samartsev, H. v Löhneysen, M. Wissinger, S. Uebe, A. Assmann, D. Fuchs, and S. Schuppler, Phys. Rev. B 82, 174416 (2010).
- Samal and Kumar (2011) D. Samal and P. S. A. Kumar, J. Phys. Cond. Matter 23, 016001 (2011).
- Fuchs et al. (2013) D. Fuchs, M. Merz, P. Nagel, R. Schneider, S. Schuppler, and H. von Löhneysen, Phys. Rev. Lett. 111, 257203 (2013).
- Othmen et al. (2014) Z. Othmen, A. Schulman, K. Daoudi, M. Boudard, C. Acha, H. Roussel, M. Oueslati, and T. Tsuchiya, Appl. Surf. Sci. 306, 60 (2014).
- Lazuta et al. (2015) A. V. Lazuta, V. A. Ryzhov, V. V. Runov, V. P. Khavronin, and V. V. Deriglazov, Phys. Rev. B 92, 014404 (2015).
- Smith et al. (2016) R. X. Smith, M. J. R. Hoch, W. G. Moulton, P. L. Kuhns, A. P. Reyes, G. S. Boebinger, H. Zheng, and J. F. Mitchell, Phys. Rev. B 93, 024204 (2016).
- Li et al. (2016) B. Li, R. V. Chopdekar, A. T. N’Diaye, A. Mehta, J. P. Byers, N. D. Browning, E. Arenholz, and Y. Takamura, Appl. Phys. Lett. 109, 152401 (2016).
- Maekawa et al. (2004) S. Maekawa, T. Tohyama, S. E. Barnes, S. Ishihara, W. Koshibae, and G. Khaliullin, Physics of Transition Metal Oxides (Springer, Berlin, 2004).
- Blundell (2001) S. Blundell, Magnetism in Condesed Matter (Oxford University Press, Inc. New York, 2001).
- Okimoto et al. (1995) Y. Okimoto, T. Katsufuji, T. Ishikawa, A. Urushibara, T. Arima, and Y. Tokura, Phys. Rev. Lett. 75, 109 (1995).
- Quijada et al. (1998) M. Quijada, J. Cerne, J. R. Simpson, H. D. Drew, K. H. Ahn, A. J. Millis, R. Shreekala, R. Ramesh, M. Rajeswari, and T. Venkatesan, Phys. Rev. B 58, 16093 (1998).
- Takenaka et al. (2000) K. Takenaka, Y. Sawaki, R. Shiozaki, and S. Sugai, Phys. Rev. B 62, 13864 (2000).
- Takenaka et al. (2002) K. Takenaka, R. Shiozaki, and S. Sugai, Phys. Rev. B 65, 184436 (2002).
- Furukawa (1995) N. Furukawa, J. Phys. Soc. Japan 64, 3164 (1995).
- Chattopadhyay et al. (2000) A. Chattopadhyay, A. J. Millis, and S. Das Sarma, Phys. Rev. B 61, 10738 (2000).
- Michaelis and Millis (2003) B. Michaelis and A. J. Millis, Phys. Rev. B 68, 115111 (2003).
- Tokura et al. (1998) Y. Tokura, Y. Okimoto, S. Yamaguchi, H. Taniguchi, T. Kimura, and H. Takagi, Phys. Rev. B 58, R1699 (1998).
- (19) By Alineason Materials Technology GmbH, Germany.
- (20) See Supplemental Material which includes detailed information about analysis and includes Refs. Okimoto et al. (1997); Prieto-Ruiz et al. (2015) .
- Friš and Dubroka (2017) P. Friš and A. Dubroka, Appl. Surf. Sci. 421, 430 (2017).
- Jeong et al. (2014) D. W. Jeong, W. S. Choi, S. Okamoto, J.-Y. Kim, K. W. Kim, S. J. Moon, D.-Y. Cho, H. N. Lee, and T. W. Noh, Scientific Reports 4, 06124 (2014).
- Sundaram et al. (2009) N. Sundaram, Y. Jiang, I. E. Anderson, D. P. Belanger, C. H. Booth, F. Bridges, J. F. Mitchell, T. Proffen, and H. Zheng, Phys. Rev. Lett. 102, 026401 (2009).
- Aarbogh et al. (2006) H. M. Aarbogh, J. Wu, L. Wang, H. Zheng, J. F. Mitchell, and C. Leighton, Phys. Rev. B 74, 134408 (2006).
- Augustinský et al. (2013) P. Augustinský, V. Křápek, and J. Kuneš, Phys. Rev. Lett. 110, 267204 (2013).
- Basov and Timusk (2005) D. N. Basov and T. Timusk, Rev. Mod. Phys. 77, 721 (2005).
- (27) For a related analysis of intersite excitations in systems (), see J. Lee, M. Kim, and T. Noh, New J. Phys. 7 , 147 (2005).
- (28) By Hund’s rule coupling Hamiltonian we mean the spin-spin coupling term of the five band Hubbard Hamiltonian given, e.g., in A. M. Oleś, Phys. Rev. B 28, 327 (1983).
- Lin and Millis (2008) C. Lin and A. J. Millis, Phys. Rev. B 78, 174419 (2008).
- Martin et al. (1996) M. C. Martin, G. Shirane, Y. Endoh, K. Hirota, Y. Moritomo, and Y. Tokura, Phys. Rev. B 53, 14285 (1996).
- Okimoto et al. (1997) Y. Okimoto, T. Katsufuji, T. Ishikawa, T. Arima, and Y. Tokura, Phys. Rev. B 55, 4206 (1997).
- Prieto-Ruiz et al. (2015) J. P. Prieto-Ruiz, F. M. Romero, H. Prima-Garcia, and E. Coronado, J. Mater. Chem. C 3, 11122 (2015).