Measurements of the top quark properties at decay with CMS
Abstract:
CMS measurements of properties related to top quark decays are discussed. The results presented regard the measurement of the W boson helicity, the investigation of anomalous couplings in the Wtb vertex, and the search for very rare decays, such as and , which are associated to flavor-changing neutral currents.
1 Introduction
Because of its large mass and short lifetime, the top quark plays a special role in the standard model (SM) of particle physics. For this reason, measurements of top quark properties are important to assess the consistency of the SM, and to look for deviations from it which would be hints of physics beyond the SM (BSM). The top quark decays before hadronizing, so certain of its properties, such as spin or polarization, pass to its decay products characterizing the associated Wtb vertex.
In this report, these properties ”at decay” are measured using data from pp collisions at the LHC collected by the CMS detector [1] in 2012 at TeV, and corresponding to fb-1. The properties discussed here refer to the W boson helicity, the investigation of anomalous couplings in the Wtb vertex, and the search for very rare decays, namely and , which are associated to flavor-changing neutral currents (FCNC). Results are compared with the SM predictions probing for physics BSM, and when deviations are not found exclusion limits are set.
2 Measurement of the W helicity fractions
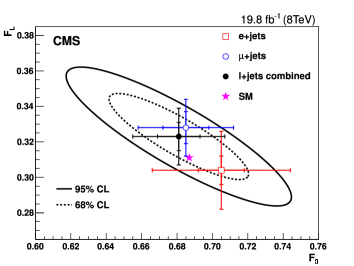
The W boson from the top quark decay can be produced with a left-, right- or longitudinal polarization, with the corresponding helicity fractions , and defined as the ratio of the individual widths to the total width, . These helicity fractions are sensitive to the Wtb vertex structure, and in the SM assume the values , and [2], at next-to-next-to-leading order, for a top quark mass of GeV. These fractions are measured recurring to the distributions of the helicity angle which is defined as the angle between the charged lepton (or down-type quark) and the reversed direction of the top quark, both measured in the W boson rest frame.
This measurement is conducted on events decaying to lepton + jets final states [3], and on single top quark events with one electron or muon plus jets [4]. The event selection in the case requires one isolated electron or muon, together with at least four jets, two of which identified as coming from b quark fragmentation. For single top quark events, one isolated electron or muon is requested, along with exactly two jets, one of which associated to a b quark; such a selection is intended to favor the so-called -channel production of single top quarks. The distributions of the selected events are compared to those expected from Monte Carlo top quark events weighted as to reproduce different values for the helicity fractions, plus those from background events. The W boson helicity fractions are measured maximising a binned Poisson likelihood function derived from such distributions. For events, only the leptonic branch (i.e. the one including the W boson which decays leptonically) is considered, because the hadronic branch (i.e. the one including the W boson which decays into quarks) carries an ambiguity associated to the inability to distinguish up-type from down-type initiated jets. Different channels (with an electron or muon) are first fit separately to obtain the helicity fractions and imposing the unitarity constraint , then the results are combined (using the BLUE method [5]) to account for correlations. The results of the fits for the two channels are , , and , , respectively. Figure 1-left shows the helicity measurements for the channel as contour plots. A similar plot has been obtained for single top quark events. For both channels the measured helicities and agree with SM expectations.
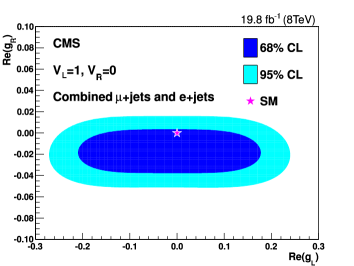
The structure of the Wtb vertex can be expressed with a Lagrangian function containing anomalous vector-right () and tensor couplings ( and ), for which the SM expectation is . Values different from zero are then an indication of deviations from the SM. By fixing the two vector couplings to their SM expectation (, ), limits are derived on the tensor couplings, using the theoretical relations between the helicity fractions and the couplings [6]. The values allowed for and are shown as contour plots in Fig. 1-right for events. A similar plot has been obtained for single top quark events. For both channels the measurements are consistent with the SM prediction .
|
|
3 Search for anomalous couplings
While the V–A structure of the charged current involving light quarks is well established, the structure of the Wtb vertex is less constrained. Furthermore, FCNC interactions associated to tcg and tug vertices are predicted to be very small in the SM, but can be strongly enhanced in extensions of the SM.
Anomalous couplings in the Wtb vertex and FCNC interactions regarding tug and tcg vertices, have been searched for by CMS in single top quark events with one muon plus jets [7], including also data collected at and corresponding to fb-1. The selection requires one isolated muon, one jet in the forward region, one b-tagged jet and an additional softer b-jet, and aims at selecting events in the so–called -channel single top quark production.
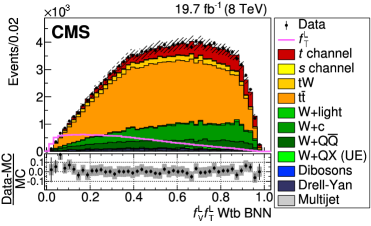
To distinguish the -channel single top quark production processes from multijet background and other SM processes, two Bayesian neural networks (BNNs) are trained and utilized. Then, three additional Wtb BNNs are used to separate separate the individual contributions of right-handed vector , left-handed and right-handed tensor couplings from the left-handed vector coupling as expected in the SM. In addition, the tcg and tug contribution are distinguished from SM processes with the help of two BNNs trained specifically for this purpose. From the simultaneous fit of the distributions for the SM BNN and for the additional BNNs associated to the anomalous couplings, exclusion limits are set as two-dimensional contours. Fig. 2-left shows the distribution of the Wtb BNN discriminant for the scenario . No contribution is seen, and exclusion limits are set, as shown in the two-dimensional contour plot of Fig. 2-right. Similar plots and limits are obtained for the other possible scenarios and .
|
|
Deviations from the SM expectations can be associated to FCNC processes, whose production cross section depends on the strengths of these strong interactions, i.e. and , being the scale of new physics ( TeV). New BNNs are trained to discriminate each FCNC process from SM events. Individual 95% confidence level (CL) observed (expected) exclusion limits on are obtained by integrating over , and vice versa, yielding TeV-1 and TeV-1. From these individual limits, upper limits on the branching fractions and are derived, that is and .
4 Search for rare decays
The FCNC decay of a top quark is forbidden at tree level in SM and strongly suppressed by the GIM mechanism at higher orders. For this reason the branching fraction of the decays of a top quark to a Z boson or a Higgs boson plus an up-type quark is expected to be . However, in BSM models these fractions can become as high as and become within reach.
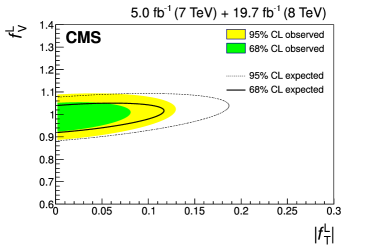
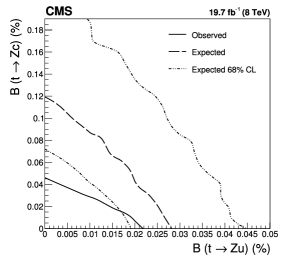
The rare decays or are searched for in final states with three leptons (e or ), as described in Ref. [8]. These events need to be disentangled from SM production and the FCNC production of tZ events. The separation of the three classes of events is performed recurring to boosted decision tree (BDT) discriminants specifically trained. Distributions of these three discriminants are fitted to the data. In the case of the tZ-FCNC discriminant, the fit is consistent with the SM-only hypothesis, and limits are derived on the branching fractions and , as shown in Fig. 3-left.
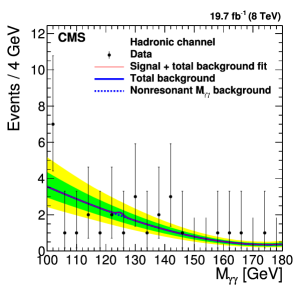
The rare decays or are searched in events [9], where the W boson can decay either leptonically or hadronically, while the Higgs boson can decay to two photons (very clean signal but with low yield), or to two W/Z bosons, or even to , producing different final states. Three independent analyses/selections are then combined: 1. multilepton analysis, requiring two same-sign leptons, or 3 leptons (e or ), aimed for ; 2. diphoton + W (leptonic or hadronic) + b-tagged jet, for ; 3. 3 b-tagged jets + leptonic W + additional jet, for . The diphoton selection is the most sensitive, and the decays are searched for by looking at the diphoton invariant mass which is fitted to look for a diphoton resonant signal in excess of the non-resonant diphoton background (plus the SM resonant background). No signal is seen, neither in the leptonic channel nor in the hadronic one, see Fig. 3-right. No signal is observed also in the other two selections, yielding observed (expected) upper limits on the branching fractions for these rare decays, namely and .
5 Conclusions
Several properties of the top quark decay have been discussed here, in order to confirm the consistency of the SM or to look for deviations from it. The W boson helicity fractions have been measured and found consistent with the SM, with no indication of anomalous couplings for the top quark. Rare decays of the top quark into Zq or Hq have been searched for with a null result. For what concerns top quark properties, the standard model is once again confirmed.
References
- [1] CMS Collaboration, JINST 3 (2008) S08004
- [2] A. Czarneci, J.G. Körner and J.H. Piclum, Phys. Rev. D 81 (2010) 111503(R).
- [3] CMS Collaboration, Phys. Lett. B 762 (2016) 512.
- [4] CMS Collaboration, JHEP 01 (2015) 053.
- [5] L. Lyons, D. Gibaut and P. Clifford, Nucl. Instrum. Meth. A 270 (1998) 110.
- [6] J.A. Aguilar-Saavedra and J. Bernabeu, Nucl. Phys. B 840 (2010) 349.
- [7] CMS Collaboration, JHEP 02 (2017) 028.
- [8] CMS Collaboration, JHEP 07 (2017) 003.
- [9] CMS Collaboration, JHEP 02 (2017) 079.