Measurement of with KEDR detector
Abstract
The product of the electronic width of the meson and the branching fractions of its decay to hadrons and electrons has been measured using the KEDR detector at the VEPP-4M collider. The obtained values are
The uncertainties shown are statistical and systematic, respectively. Using the result presented and the world-average value of the electronic branching fraction, one obtains the total width of the meson:
These results are consistent with the previous experiments.
1 Introduction
The resonance, a bound state of quarks, was discovered more than forty years ago but its investigation is still actual. Fundamental properties of this meson including the branching fractions of leptonic and hadronic decays are important for understanding the quarkonium decay dynamics. The leptonic width of the meson is used in calculations of c-quark mass mc1 ; mc2 and the hadronic contribution to the muon gm2 . It is also used for various calculations of radiative corrections due to the vacuum polarization and the initial-state radiation. The current precision of in the potential models and in the lattice calculations laticeQCD ; etmccharm is compatible with that of the world-average value pdg2014 and increase of the experimental precision for this value can be crucial for further development of the LQCD calculation techniques.
Measurements of the widths have a long history. They were studied at MarkI mark1 and ADONE frascati , and later at BES bes95 , BaBar babar04 , CLEO cleo06 , KEDR KEDR:2010 ; KEDR:2014 and BESIII bes16 . Usually is measured in decays to hadrons, or final states and the obtained value is the product of to the corresponding branching fraction. At present the best accuracy in the determination of has been obtained by the BESIII collaboration bes16 based on the measurement in the initial-state radiation process and branching fraction pdg2014 . The best accuracy of the value has been reached by combining the result on pdg2014 with from BES bes95 .
This work continues a series of experiments on measuring properties of charmonium resonances performed by the KEDR collaboration KEDR:2010 ; KEDR:2014 ; KEDR:2003 ; KEDR:2012 ; KEDR:2015 . In 2010 partial widths and were measured with high accuracy of 2.4% and 2.5%, respectively KEDR:2010 . In this article we present new results on and obtained by measuring the cross sections of and as a function of the centre-of-mass (c.m.) energy in the vicinity of the resonance with the KEDR detector at the VEPP-4M collider.
2 Experiment and data sample

A detailed description of the VEPP-4M collider and the KEDR detector can be found in Refs. vepp ; kedr . Our analysis is based on the same data set, with an integrated luminosity of , as that used in the KEDR analysis of the leptonic channels KEDR:2010 . The data sample corresponds to 250 thousands of produced mesons. During the scan the data were collected at 11 energy points as shown in Fig. 1 that allows a fit of the resonance shape and determination of the nonresonant background contributions to be performed. The beam energy was measured by the resonant depolarization method rdm:Bukin . 26 calibrations were carried out during the scan, before and after data taking at each energy point. Between the calibrations the beam energy was interpolated with the accuracy better than 15 keV.
3 cross section in vicinity of a narrow resonance
The cross section for the annihilation process in the vicinity of a narrow resonance can be presented in the form KEDR:2012 :
| (1) |
where is the c.m. energy, is the mass of the resonance, is its total width, is the fine structure constant and is the ratio outside of the resonance region. The truncated vacuum-polarization operator does not include a contribution of the resonance itself.
The radiative correction can be obtained from the structure-function approach of Ref. KF :
| (2) |
| (3) |
where is the electron mass. The function is defined as
| (4) |
The parameter in Eq. (1) characterizes the strength of the interference effect in the inclusive hadronic cross section. According to Ref. KEDR:2012 the expression for can be written as
| (5) |
The summation is performed over all exclusive hadronic modes.
Here and below and are the cosine and sine of the relative phase of the strong and electromagnetic amplitudes for the mode averaged over the phase space of the products, is the branching fraction of the corresponding continuum process, is a probability of the decay to an pair, is the total decay probability to hadrons and , where is the contribution of the strong interaction to the partial width for the mode .
Due to the resonance – continuum interference the effective hadronic width can differ from the true hadronic partial width :
| (6) |
In this analysis it was assumed that the relative phases of the strong and electromagnetic amplitudes in different decay modes are not correlated. Consequences and experimental verification of this assumption are discussed in detail in Refs.KEDR:2012 ; KEDR:2015 .
The differential cross section is calculated with
| (7) |
where and are the c.m. energy squared and momentum transfer squared, is the electron scattering angle. The first term in Eq. (7) represents the QED cross section obtained with the Monte Carlo technique bhwide ; mcgpj . The second term is responsible for the resonance contribution and the third one for the interference. The accuracy of the formulae (7) about 0.1% is sufficient for this work and is confirmed with more precise expressions given in chee .
4 Data analysis
4.1 MC simulation
We used MC samples of inclusive decays and the continuum multihadron events to obtain the detector efficiency. The samples were generated with the tuned version of the BES generator besgen based on JETSET 7.4 jetset . The procedure of the parameter tuning is discussed in detail in Sec. 5.2. The generated events were reweighted to ensure that the branching fractions of the most probable decay modes correspond to the results of the PDG fit pdg2014 . MC samples of Bhabha events required for the luminosity determination were simulated using the BHWIDE bhwide and MCGPJ mcgpj generators. Generated MC events were then processed with the detector simulation package based on GEANT, version 3.21 geant , and reconstructed with the same conditions as experimental data.
During the data taking in 2005 there was an additional online condition – the number of hits in the vertex detector (VD) should not exceed 60 which corresponded to 10 charged tracks. Due to substantial crosstalk in VD electronics, there was some loss of signal events. The effect of crosstalk was carefully simulated.
To take into account the signal and background coincidences, a trigger from arbitrary beam crossings was implemented. The events recorded with this ”random trigger” were superimposed with simulated events.
4.2 Trigger requirements
The trigger consists of two hardware levels: the primary trigger (PT) and the secondary trigger (ST) TALYSHEV . The primary trigger required signals from two or more non-adjacent scintillation counters or an energy deposition in the endcap calorimeter of at least 100 MeV. A veto from CsI calorimeter crystals closest to the beam line was used to suppress the machine background. The conditions of the secondary trigger were rather complicated, and were satisfied by events with two tracks in the vertex detector and the drift chamber or with a single track which deposited more the 70 MeV in the barrel calorimeter.
During the offline analysis all events (both recorded in experiment and simulated) were required to pass through the software event filter. It used a digitized response from detector subsystems and applied tighter conditions on its input in order to decrease the effect of calorimeter energy threshold and possible hardware-trigger instability.
4.3 Luminosity determination
For the absolute luminosity determination, events in the barrel LKr calorimeter kedr were used taking into account the contribution of decays into (see Eq. (7)).
The final-state radiation (FSR) effects are considered using the PHOTOS package photos . The cross section is shown in Fig. 1b obtained by subtracting the contribution of Bhabha events from the total cross section.
The event selection includes the following criteria in addition to trigger requirements:
-
•
two clusters within the polar angle range and the energy larger than 700 MeV each;
-
•
the energy deposition outside of those two clusters smaller than of the total energy deposited in the calorimeter ;
-
•
acollinearities of the polar and azimuthal angles smaller than 15∘;
-
•
event sphericity calculated with charged particles smaller than 0.05;
-
•
two or three tracks in the drift chamber coming from the interaction point: the impact parameter with respect to the beam axis , the coordinate of the point of closest approach and the transverse momentum .
Cosmic background was additionally suppressed with the muon system by veto signals from opposite or adjacent to opposite octants or more than three layers fired in one octant. Alternatively, cosmic events were suppressed with the time-of-flight condition.
Figure 2 shows comparison between data and MC simulation. The distribution in the electron scattering angle for selected events is shown in Fig. 3. The angular distributions of events from Bhabha scattering and from decay are different which allows us to separate those contributions at each data point.


4.4 Selection of hadronic events
In our analysis the following selection requirements are applied:
-
•
total energy deposition in the calorimeter MeV;
-
•
more than 15% of total energy deposited in the barel LKr calorimeter ;
-
•
at least one track with , and ;
-
•
at least three particles in the detector, including tracks in the drift chamber and calorimeter clusters, which are not associated with any track;
-
•
the ratio of the Fox-Wolfram moments fox .
The requirements on energy deposition separate hadronic events from backgrounds: the upper requirement reduces a fraction of events and the lower one suppresses and machine backgrounds. The requirement on the ratio of the Fox-Wolfram moments is significant in reducing background from quasi-collinear events with additional particles from radiation and interaction with detector material. Cosmic events were additionally suppressed as in selection of events.


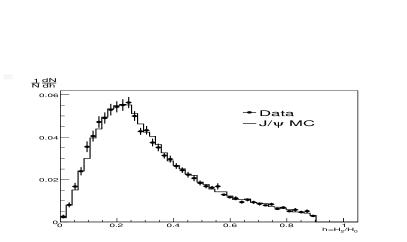
Figure 4 shows comparison between the most important event characteristics obtained in the experiment and in the simulation.
4.5 Fitting of the data
We performed a combined fit of the data on hadron and production in the energy range of the resonance.
Experimental runs were grouped into points according to run energy. The collision energy at each point was determined by interpolating the beam energy measurements and assuming the beam energy symmetry . A sample of events was subdivided into 10 equal angular intervals in the range from 40∘ to 140∘.
The numbers of hadronic and leptonic events observed at each energy point and each angular interval were fitted simultaneously as a function of collision energy and electron scattering angle using a minimizing function
| (8) |
where and are experimentally measured and theoretically calculated numbers of hadronic and Bhabha events, respectively. Theoretically calculated event numbers were obtained as follows:
| (10) |
| (11) |
where the cross section of the annihilation process near the resonance is convolved with the Gaussian distribution with the energy spread :
| (12) |
The pre-exponential factor differs from unity due to some accelerator-related effects. Its impact on the results of the measurements is considered in Sec. 5.4. The continuum cross section is almost constant in the vicinity of a narrow resonance and can be parametrised with
| (13) |
In Eqs. (10) and (11), and are detection efficiencies and their dependence on beam energy can be neglected.
Luminosity at -th energy point was determined as:
| (14) |
where is the integrated luminosity measured by the bremsstrahlung luminosity monitor at the -th energy point and is an absolute luminosity calibration factor.
The statistical uncertainties of parameters , , are strongly correlated. To determine these uncertainties accurately, the fit was performed with two sets of free parameters. In the first set the parameters and were floating. In the second set the parameters and were floating. Both sets contained auxiliary free parameters: absolute luminosity calibration factor , resonance mass , beam energy spread and continuum contribution . To relate the values of , and the ratio was fixed from the KEDR result KEDR:2014 and the variation of the ratio inside its uncertainties introduces negligible systematic uncertainty to the measured values. The results obtained from the fits are listed in Table 1. The mass value is in good agreement with that published earlier by the KEDR collaboration KEDR:2015 .
| Free parameter | Fit 1 | Fit 2 |
|---|---|---|
| – | ||
| – | ||
5 Study of systematic uncertainties
Main contributions of systematic uncertainties to the , and values discussed in detail in this section were merged into five categories: absolute luminosity measurement, hadron decay simulation, detector and accelerator effects, theoretical uncertainties.
5.1 Luminosity uncertainties
Systematic effects related to luminosity were evaluated by using variation of the selection requirements. The requirement on the polar angle was varied in the broad range, and the corresponding change in the number of selected Bhabha events reached 50%. All variations are summarized in Table 2 and their contribution to the total error does not exceed a 0.8% uncertainty.
| Variable | Range variation | Uncertainty,% |
| and | 0.5 | |
| MeV | 0.3 | |
| definition | , | 0.3 |
| cm and | ||
| MeV | ||
| 0.3 | ||
| acollinearity | 0.2 | |
| acollinearity | 0.2 | |
| 0.2 | ||
| Total | 0.8 | |
In addition, we studied more carefully the following effects. The LKr calorimeter was aligned to the drift chamber using DC-reconstructed tracks from cosmic events. The position of the interaction point and the beam-line direction in the coordinate system of the detector were found using the primary-vertex distribution of hadronic events.
The luminosity uncertainty due to inaccuracy of the alignment was evaluated by applying the one-sigma shift during the reconstruction. The obtained uncertainty is less than 0.2%. The uncertainty due to the imperfect simulation of the calorimeter response was estimated by varying sensitivity to the energy loss fluctuations between LKr calorimeter electrodes and appears to be less than 0.3%.
The detection efficiency function for electrons, , was calculated with simulation, with the angle measured in the drift chamber or LKr calorimeter, the result difference does not exceed 0.3%. A MC statistical uncertainty corresponds to 0.15%. To estimate the uncertainty of the scattering cross section, calculated from Eq. (7) two event generators - BHWIDE and MCGPJ were used. The difference in the value was 0.37%.
The luminosity spread was estimated as a difference of the results from two independent luminosity monitors and was about 0.4%. This effect was studied with toy MC and the corresponding and width uncertainties were about 0.04% and uncertainty was about 0.06%.
Sources of the absolute luminosity determination uncertainties are summarized in Table 3.
| Source | Uncertainty, % |
|---|---|
| Criterion variation | 0.8 |
| Calorimeter alignment | 0.2 |
| Calorimeter response | 0.3 |
| Detection efficiency | 0.3 |
| MC statistics | 0.2 |
| Cross section | 0.4 |
| Relative luminosity | 0.1 |
| Total | 1.0 |
5.2 Uncertainty due to imperfect simulation of decays
The next important source of uncertainties on the value is the imperfect simulation of decays. To tune the simulation procedure and obtain a reliable estimate of the systematic uncertainty, we follow the method used in Ref. KEDR:2012 .
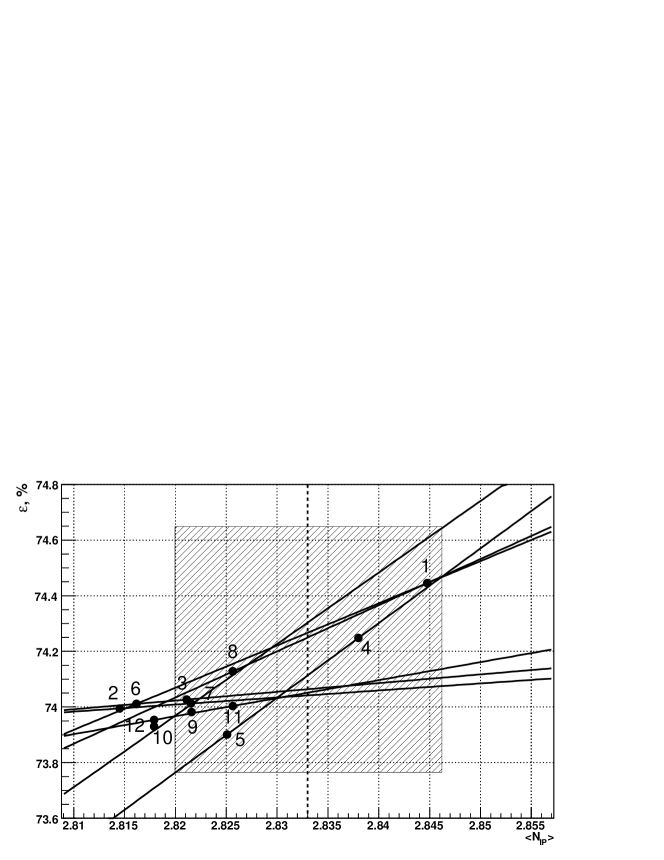
Let us discuss the idea of the method in brief. Assume that we have a perfect simulation procedure capable of reproducing all event characteristics and correlations between them, but it has a set of internal parameters to be tuned. By varying one of the parameters, one should trace the change of the mean value of some observable, for example the mean multiplicity , and the detection efficiency . The simulated value of the observable coincides with the measured one at the optimal setting of the parameter. For small variations the detection efficiency linearly depends on the mean multiplicity, therefore the accuracy of the efficiency determination , where is the uncertainty of the experimental value of the multiplicity. In case of several simulation parameters to vary, one should get the set of trajectories crossing together at the point which corresponds to an experimental observable. In practice, the simulation procedure is not perfect, thus instead of one intersection point we have the situation depicted in Fig. 5. The uncertainty of the detection efficiency grows due to difference in trajectory slopes obtained with variations of simulation parameters. The estimate of the uncertainty interval corresponds to the vertical size of the shadow box in Fig. 5 while the horizontal size is determined by the track multiplicity uncertainty in the experiment.
To obtain the results presented in Fig. 5, we iterated as follows: vary one of the JETSET parameters and then modify some complementary parameter to achieve good agreement in observed charged multiplicity. The values of the mean multiplicity and the detection efficiencies obtained for various settings of parameters are summarized in Table 4.
The main JETSET parameters to vary are PARJ(21), PARJ(33), PARJ(37), PARJ(41) and PAR(42) referred to , , and two parameters and for the Lund fragmentation function, respectively. The parameter is responsible for a width in the Gaussian transverse-momentum distributions of primary particles appearing during fragmentation, while is the energy of the jet system below which a final hadron pair is produced. This energy is smeared with a relative width . Beside variations of fragmentation function parameters, we tried the fragmentation with parton showers switched off.
The charged multiplicity was selected for tuning as the most sensitive event characteristic. In addition to it, simulated distributions of charged tracks sphericity, Fox-Wolfram moments, energy deposited in the calorimeter, the inclusive event characteristics such as momentum, azimuthal and polar angles, were checked for agreement with experimental data. Histogram shapes were compared using a Kolmogorov test and simulated samples that gave the values of the Kolmogorov test lower than 0.6 were rejected.
The multihadron efficiency was averaged over efficiencies corresponding to an experimentally measured charged multiplicity in Fig. 5 and equals %.
| Version | JETSET modifications | , % | ||||
| and varied | ||||||
| , GeV | ||||||
| 1 | 0.55 | 0.2 | 2.845 | 74.445 | 0.950 | 5.924/7 |
| 2 | 0.7 | 0.2 | 2.816 | 74.010 | 0.806 | 9.596/7 |
| 3 | 0.7 | 0.17 | 2.821 | 74.027 | 0.933 | 7.282/7 |
| Switching parton showers | ||||||
| 4 | 0.6 | 0.2 | 2.838 | 74.248 | 0.996 | 4.387/7 |
| 5∗ | 0.6 | 0.2 | 2.825 | 73.901 | 0.999 | 6.697/7 |
| varied | ||||||
| , GeV | , GeV | |||||
| 6 | 0.65 | 0.56 | 2.815 | 73.995 | 0.663 | 8.497/7 |
| 7 | 0.65 | 0.52 | 2.822 | 74.013 | 0.903 | 4.761/7 |
| Fragmentation function with =0.2, =0.58 | ||||||
| , GeV | , GeV | |||||
| 8 | 0.65 | 0.2 | 2.826 | 74.128 | 0.954 | 8.574/7 |
| 9 | 0.65 | 0.17 | 2.822 | 73.982 | 0.839 | 13.288/7 |
| 10 | 0.7 | 0.2 | 2.818 | 73.930 | 0.685 | 11.234/7 |
| Parameters of fragmentation function varied | ||||||
| 11 | 1.0 | 0.7 | 2.826 | 74.004 | 0.979 | 10.483/7 |
| 12 | 0.5 | 0.65 | 2.818 | 73.954 | 0.986 | 9.514/7 |
| ∗ Switched-off parton shower | ||||||
For the calculation of the mean multiplicity some track selection criteria are required. Their choice leads to an additional uncertainty on the detection efficiency which is smaller than 0.3%. The track reconstruction efficiency is not exactly the same for the experimental data and simulation. The difference was studied using Bhabha events and cosmic tracks and the appropriate correction was introduced in the detector simulation with an uncertainty smaller than 0.1%.
For reweighting we used significant and well-measured decay branching fractions. To check a systematic uncertainty, the remaining branching fractions were added to the list and corresponding MC event weights were recalculated. This leads to uncertainty of less than on the measured and values.
All systematic uncertainties due to imperfect simulation are summarized in Table 5.
| Source | Uncertainty, % |
|---|---|
| Generator | 0.6 |
| Track selection | 0.3 |
| MC statistics | 0.3 |
| Tracking efficiency | 0.1 |
| PDG branchings | 0.1 |
| Total | 0.7 |
5.3 Detector-related uncertainties
The major sources of the detector-related systematic uncertainties in the width are listed in Table 6.
| Source | Uncertainty, % |
|---|---|
| Criterion variation | 0.5 |
| Cosmic suppression | 0.3 |
| Nuclear interaction | 0.2 |
| Tracking resolution | 0.2 |
| Trigger efficiency | 0.5 |
| Total | 0.8 |
The effects of possible sources of the detector-related uncertainties were evaluated by varying the event selection requirements. Minimum and maximum total energies deposited in the calorimeter were varied to 500 and 2700 MeV, respectively. A requirement on the Fox-Wolfram moments was removed from selection. A requirement on the number of tracks from interaction points was tightened to have and track selections on , and were varied and the obtained difference did not exceed 0.2%. The results are presented in Table 7 giving in total about 0.5%.
| Variable | Range variation | Uncertainty, % |
| and | 0.3 | |
| MeV | ||
| / | 0.3 | |
| , , | 0.2 | |
| , | ||
| 0.1 | ||
| Total | 0.5 | |
To estimate the uncertainty related to the cosmic background, the condition on the muon system veto was replaced with a condition on the average ToF time with the number of hits in the muon system not larger than two. The difference was found to be about 0.3% for and and 0.1% for .
In addition, we used two models of nuclear interaction during simulation - with the GHEISHA gheisha and FLUKA fluka packages as they are implemented in GEANT 3.21. The variation of the resulting value was about 0.2%.
The two methods to achieve data and MC agreement in the momentum resolution and the angular resolution were used: we scale either the assumed systematic uncertainties of x(t) determination or the spatial resolution of the drift chamber. That gives a 0.2% systematic uncertainty.
The trigger inefficiency includes three contributions. The inefficiency of time-of-flight counters used in the primary trigger was determined with especially selected and cosmic events and equals . A systematic uncertainty due to crosstalk in VD electronics was evaluated as a difference of results with two sets of VD simulation parameters obtained by using cosmic and Bhabha events. It was about 0.2%. And the last effect is a veto from CsI crystals near the beam line, which was estimated by varying corresponding trigger thresholds and equals 0.3%.
5.4 Accelerator uncertainties
The influence of the machine background was estimated by using a data set collected with separated beams. The number of hadronic events selected from this data set was rescaled to the full data sample proportionally to the integrals of the beam currents. The contribution of background events to the observed cross section is about 6-12 nb. The number of selected hadron events was corrected for the number of estimated background events and the data were refitted. The relative uncertainty does not exceed 0.2%.
The non-Gaussian effects in the total collision energy distribution contribute about 0.2% to the uncertainty. To estimate this contribution, we added a pre-exponential factor while convolving the cross section with a Gaussian function in Eq. (12) (details are discussed in KEDR:2015 ):
| (15) |
To check the uncertainty related to the beam energy determination, the values of energy assigned to the data points were corrected within their errors using the known shape of the resonance cross section. For that, eleven free parameters were introduced in the fit function (8) and the compensating term,
| (16) |
was added, where is the energy obtained from interpolation of the resonance depolarization data and is its estimated accuracy. For the cross section calculations, the values were used. The variation of the fitted value was about 0.3%.
The list of accelerator uncertainties is presented in Table 8.
| Source | Uncertainty, % |
|---|---|
| Collider background | 0.2 |
| Non-Gaussian energy | 0.2 |
| Beam energy | 0.3 |
| Total | 0.4 |
5.5 Other uncertainties
The interference parameter in the fit was fixed at the value of 0.39 assuming that the sum in (5) vanishes. To verify the uncertainty related to this parameter, we left floating resulting in a shift of 0.2% on the and values and about 0.1% on the value.
Deviation of from a sum of partial hadronic widths due to interference effects was estimated in the Bayesian approach under the assumption that all phases in Eq. (5) have equal probability as discussed in KEDR:2012 . At the fitted value , the effect does not exceed 0.3%.
The accuracy of the analytic expression (1) is about 0.1%. In addition, the 0.1% accuracy of the radiative-correction calculation KF should be taken into account. The inaccuracy of simulation of FSR effects with PHOTOS is negligible in our analysis.
The sum in quadrature of all contributions listed in this subsection is about 0.4%.
6 Summary
The parameters of the meson have been measured by using the data collected with the KEDR detector at the VEPP-4M collider. Two data fits were performed, the first one was used to obtain partial lepton widths and . Their errors are strongly correlated, therefore to obtain the total leptonic width a separate fit was introduced. Our results are
The first and second uncertainties are statistical and systematic, respectively. The major sources of the systematic uncertainties for the and values are summarized in Table 9 and the total systematic uncertainty equals 1.6%. For the product, the total systematic uncertainty equals 1.2%.
| Source | Uncertainty, % | ||
|---|---|---|---|
| Luminosity | 1.0 | 1.0 | 1.0 |
| Simulation of decays | 0.7 | 0.7 | – |
| Detector response | 0.8 | 0.8 | 0.4 |
| Accelerator-related effects | 0.4 | 0.4 | 0.4 |
| Theoretical uncertainties | 0.4 | 0.4 | 0.2 |
| Total | 1.6 | 1.6 | 1.2 |

∗ Direct measurement
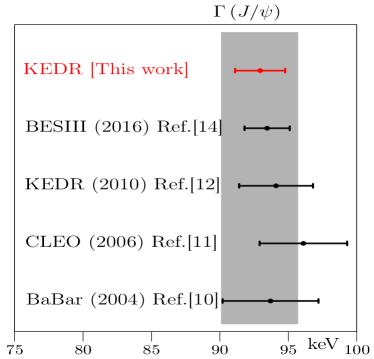
Our result for the value is consistent with and four times more precise than the previous direct measurement in the hadronic channel bes95 . The obtained value is in good agreement with our previous measurement KEDR:2010 and supersedes it.
Taking into account from pdg2014 we determined the total width of the meson:
Acknowledgments
We greatly appreciate the efforts of the staff of VEPP-4M to provide good operation of the accelerator complex.
This work was supported by Russian Science Foundation under project N 14-50-00080. Work related to Monte Carlo generator tuning was partially supported by Russian Foundation for Basic Research under grant 12-02-01076-a.
References
- (1) J. H. Kuhn, M. Steinhauser and C. Sturm, Heavy Quark Masses from Sum Rules in Four-Loop Approximation, Nucl. Phys. B. 778 (2007) 192.
- (2) J. H. Kuhn, Precise heavy quark masses, Mod. Phys. Lett. A. 28 (2013) 1360019.
- (3) F. Jegerlehner, Leading-order hadronic contribution to the electron and muon g - 2, EPJ Web of Conferences. 118 (2016) 01016.
- (4) G. C. Donald et al., HPQCD Collaboration, Precision tests of the from full lattice QCD: Mass, leptonic width, and radiative decay rate to , Phys. Rev. D. 86 (2012) 094501.
- (5) D. Becirevic and F. Sanfilippo, Lattice QCD study of the radiative decays and J. High Energ. Phys. 01 (2013) 28.
- (6) C. Patrignani et al., Particle Data Group, Chin. Phys. C. 38 (2016) 100001.
- (7) A. M. Boyarski et al., The Quantum Numbers and Decay Widths of the , Phys. Rev. Lett. 34 (1975) 1357.
- (8) R. Baldini-Celio et al., Multihadronic decays and partial widths of the resonance produced in annihilation at ADONE, Phys. Lett. B. 58 (1975) 471.
- (9) J. Z Bai et al., BES Collaboration, A measurement of decay widths, Phys. Lett. B. 355 (1995) 374.
- (10) B. Aubert et al., BaBar Collaboration, production via initial state radiation in at an center-of-mass energy near 10.6 GeV, Phys. Rev. D. 69 (2004) 011103.
- (11) G. S. Adams et al., CLEO Collaboration, Measurement of , , and , Phys. Rev. D. 73 (2006) 051103.
- (12) V. V. Anashin et al., KEDR Collaboration, Measurement of and , Phys. Lett. B. 685 (2010) 134.
- (13) V. M. Aulchenko et al., KEDR Collaboration, Measurement of the ratio of the leptonic widths for the meson, Phys. Lett. B. 731 (2014) 227.
- (14) M. Ablikim et al., BES Collaboration, Measurement of the leptonic decay width of using initial state radiation, Phys. Lett. B. 761 (2016) 98.
- (15) V. M. Aulchenko et al., KEDR Collaboration, New precision measurement of the and meson masses, Phys. Lett. B. 573 (2003) 63.
- (16) V. V. Anashin et al., KEDR Collaboration, Measurement of main parameters of the resonance , Phys. Lett. B. 711 (2012) 280.
- (17) V. V. Anashin et al., KEDR Collaboration, Final analysis of KEDR data on and masses, Phys. Lett. B. 749 (2015) 50.
- (18) V. V. Anashin et al., VEPP-4M Collider: Status and Plans, Proc. of EPAC 98*, Stockholm (1998) 400.
- (19) V. V. Anashin et al., KEDR collaboration, The KEDR detector, Phys. of Part. and Nucl. 44 (2013) 657.
- (20) A. D. Bukin et al., Absolute calibration of beam energy in the storage ring, -meson mass measurement, Preprint IYF-75-64, 1975.
- (21) E. A. Kuraev and V. S. Fadin, Radiative corrections to the cross section for single-photon annihilation of an pair at high energy, Sov. J. Nucl. Phys. 41 (1985) 466.
- (22) S. Jadach, W. Placzek, B. F. L. Ward, BHWIDE 1.00: YFS exponentiated Monte Carlo for Bhabha scattering at wide angles for LEP1/SLC and LEP2, Phys. Lett. B. 390 (1997) 298.
- (23) A. B. Arbuzov et al., Monte-Carlo generator for annihilation into lepton and hadron pairs with precise radiative corrections, Eur. Phys. J. C. 46 (2006) 689.
- (24) X. Y. Zhou,Y. D. Wang,L. G. Xia. Analytic forms for cross sections of di-lepton production from collision around the resonance Chin. Phys. C. 41 (2017) 083001.
- (25) J. C. Chen et al., Event generator for and decay, Phys. Rev. D. 62 (2000) 034003.
- (26) T. Sjostrand, PYTHIA 5.7 and JETSET 7.4, Physics and Manual Computer Physics Commun. 82 (1994) 74.
- (27) GEANT - Detector Description and Simulation Tool, CERN Program Library Long, Writeup W5013.
- (28) S. E. Baru et al., Trigger of the KEDR detector,Instrum. Exp. Tech. 54 (2011) 335.
- (29) E. Barberio, Z. Was. PHOTOS Monte Carlo: a precision tool for QED correctionsin Z and W decays, Comput. Phys. Commun. 79, 291 (1994).
- (30) G. C. Fox and S. Wolfram, Event shapes in annihilation, Nucl. Phys. B 149 (1979) 413.
- (31) H. C. Fesefeldt, GHEISHA The Simulation of Hadronic Showers, RWTH/PITHA 8502 (1985)
- (32) A. Fasso et al., The FLUKA code: present applications and future developments, arxiv:physics/0306162.