The 105 Month Swift-BAT All-Sky Hard X-ray Survey
Abstract
We present a catalog of hard X-ray sources detected in the first 105 months of observations with the Burst Alert Telescope (BAT) coded mask imager on board the Swift observatory. The 105 month Swift-BAT survey is a uniform hard X-ray all-sky survey with a sensitivity of over 90% of the sky and over 50% of the sky in the keV band. The Swift-BAT 105 month catalog provides 1632 (422 new detections) hard X-ray sources in the keV band above the significance level. Adding to the previously known hard X-ray sources, 34% (144/422) of the new detections are identified as Seyfert AGN in nearby galaxies (). The majority of the remaining identified sources are X-ray binaries (7%, 31) and blazars/BL Lac objects (10%, 43). As part of this new edition of the Swift-BAT catalog, we release eight-channel spectra and monthly sampled light curves for each object in the online journal and at the Swift-BAT 105 month Web site.
Subject headings:
catalogs — surveys — X-rays:generalI. Introduction
Since the first X-ray satellite (Uhuru, Giacconi et al. 1971) launched on 1970, a large number of surveys has been made in both the soft and hard X-ray bands with extensive follow-up analysis. Forman et al. (1978) presented 339 X-ray sources observed with the Uhuru X-ray observatory in the keV energy band. Later, HEAO-A4, the X-ray and gamma-ray instrument onboard the HEAO 1 satellite, conducted all-sky survey in the keV range from 1977 to 1979 detecting 77 sources in its catalog (Levine et al., 1984).
Compared to the soft X-ray energy band, a hard X-ray all-sky survey ( keV) provides an important way of studying astrophysical objects since such energetic hard X-ray photons can pass through large columns of gas and dust detecting even Compton-thick sources (, Ricci et al. 2015; Koss et al. 2016).
The Swift gamma-ray burst (GRB) observatory (Gehrels et al., 2004), which was launched in 2004 November, and is successfully carrying on a all-sky hard X-ray survey at keV with the Burst Alert Telescope (BAT). The Swift GRB observatory is primarily designed to detect transient GRBs with a coded-mask telescope (Barthelmy et al., 2005) which has a very wide field of view (). When the BAT discovers a new GRB, two narrow field instruments, the X-ray Telescope (XRT; Burrows et al. 2005) and the Ultraviolet/optical Telescope (UVOT; Roming et al. 2005), observe the GRB candidate (Sakamoto et al., 2008, 2011; Lien et al., 2016). Based on the stacking of these and other observations, Swift has been successfully carrying out an all-sky survey.

The first Swift-BAT survey catalog used the initial 3 months of observations to study high Galactic latitude sources (Markwardt et al., 2005). Tueller et al. (2008) focused on active galactic nuclei (AGN) observed from the first 9 months of data, and later Tueller et al. (2010) provided a catalog of the first 22 months of data. Baumgartner et al. (2013) published the eight-channel spectra as well as monthly light curves from the first 70 months of data with improved data processing. Independent efforts have also been made on the analysis of 39 month (Cusumano et al., 2010a), 54 month (Cusumano et al., 2010b), 66 month, and 100 month Swift-BAT data by the Palermo BAT survey111http://www.ifc.inaf.it/.
In the past decades, the International Gamma-Ray Astrophysics Laboratory (INTEGRAL, Winkler et al. 2003) has monitored hard X-ray sources using the Imager on Board the INTEGRAL Satellite (IBIS, Ubertini et al. 2003). Bird et al. (2010) and Krivonos et al. (2010) published soft Gamma-ray catalogs and 7-year all-sky hard X-ray source lists. The INTEGRAL mission-based hard X-ray catalogs, which covers energy range between 17 keV and 100 keV, provides a better angular resolution ( arcmin of FWHM, IBIS coded-aperture instrument) than Swift-BAT survey catalogs which have 19.5 arcmin of FWHM. However, INTEGRAL-IBIS observations are concentrated on the galactic plane and the net average exposures are considerably shorter than those of Swift-BAT at high galactic latitudes (figure 1). Outside of the Galactic plane the Swift-BAT survey detects more sources of primarily extragalactic nature, such as AGN and clusters. The INTEGRAL-IBIS found secure counterparts to 369 AGN from the first 1000 orbits (2002-2010, Bird et al. 2016) while the Swift-BAT 70 month survey catalog identified 872 AGN to BAT-detected sources (Ricci et al., 2017a).
Following the most recent data release of the Swift-BAT catalog (70 month222http://swift.gsfc.nasa.gov/results/bs70mon/, Baumgartner et al. 2013), this work extends the Swift-BAT survey to 105 months, including observations carried out between 2004 December and 2013 August. This catalog presents the 422 new detections of hard X-ray sources along with detailed source type classifications.
In Section 2, we briefly introduce procedures adopted for the catalog generation and identification of counterpart along with comparisons with other catalogs. Section 3 introduces structure of the catalog and describes flux measurements, spectral fit, and monthly light curves. In Section 4, we present the survey sensitivity and discuss the uncertainties on the position of the matched counterparts. Finally, we summarize our results in Section 5.
II. Procedure
The data reduction, analysis, and catalog generation of the Swift-BAT 105 month survey are conducted following the same procedures as in the Swift-BAT 70 month survey (Baumgartner et al., 2013). First, the data are extracted in the eight channel energy bands ( keV, keV, keV, keV, keV, keV, keV, and keV) from a single snapshot image. After combining the data into all-sky mosaic images, a total band map images are made from the eight channel bands mosaic images. A blind search for detected sources in the 14-195 keV band images is done based on detection threshold using batcelldetect333http://heasarc.gsfc.nasa.gov/lheasoft/ftools/ftools_menu.html. The task batcelldetect is run assuming a PSF FWHM of 19.5 arcmin, a source radius of 15 pixels, a background radius of 100 pixels, and a partial coding threshold of 1%, following previous Swift-BAT publications (Tueller et al., 2010; Baumgartner et al., 2013). An initial run of batcelldetect is done for source detection. A separate second run of batcelldetect performs position fitting with a search area of 12 arcmin around the source. For significant detections above a detection threshold, we identified their optical counterparts by searching the NED and SIMBAD databases as well as archival X-ray data (e.g., Swift-XRT, Chandra, ASCA, ROSAT, XMM-Newton, and NuSTAR).
Figure 1 illustrates the sky coverage in the 105 month Swift-BAT all-sky hard X-ray survey. Swift-BAT observed over 50% of the sky with more than 15.3 Ms of exposure time, while 90% of the sky is covered with 11.4 Ms. The left panel in Figure 1 shows the distribution of exposure times in the survey, and the right panel shows the fraction of the sky covered as a function of exposure time. The middle panel shows an all-sky exposure map in galactic coordinates. By comparison, the 90% sky coverage of INTEGRAL from Bird et al. (2016) used is 100 ks and the 50% is 600 ks.
Baumgartner et al. (2013) corrected the gain shift in the Swift mission using the peak offset from 59.5 keV calibration line to determine a gain correction factor. The gain shift has stabilized after the end of 2008, with changes less than throughout the period of this survey analysis (private communication, BAT team). Therefore, for analysis beyond 2009, we adopt the same value of gain shift as the last gain correction in 2008.
II.1. Counterpart identification
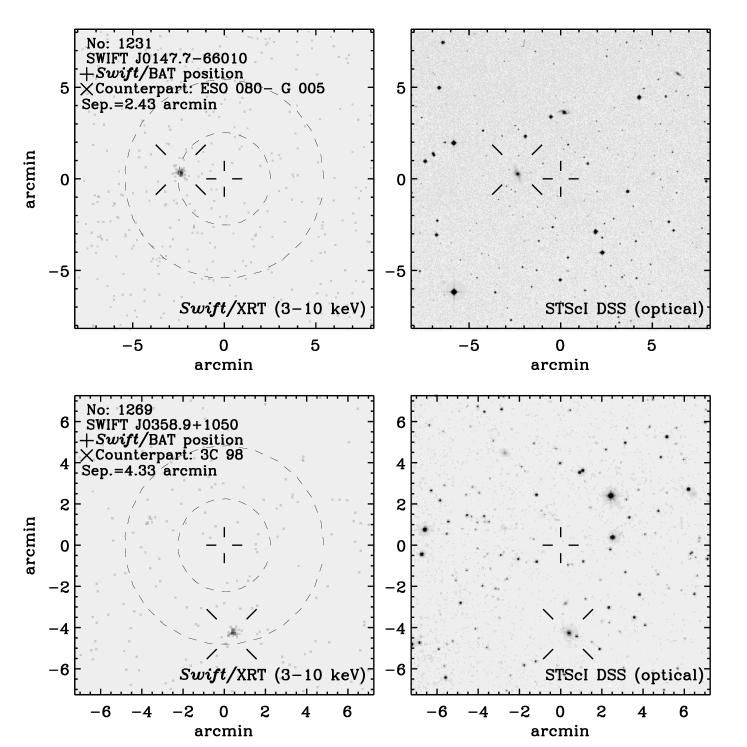
We inspected soft X-ray images provided by Swift-XRT ( keV), Chandra ( keV), ASCA ( keV) and XMM-Newton ( keV) for the newly detected sources when available using 15 arcmin of matching radius. Then we compared the soft X-ray images which provide well-defined X-ray coordinates (SNR threshold3) with optical images produced by the STScI Digitized Sky Survey444https://stdatu.stsci.edu/cgi-bin/dss_form/, the Panoramic Survey Telescope and Rapid Response System Data Release 1 (Pan-STARRS DR1555http://panstarrs.stsci.edu, Chambers et al. 2016), the Sloan Digital Sky Survey Data Release 12 (SDSS DR12666http://www.sdss.org/dr12/, Alam et al. 2015) to confirm their optical counterparts (Figure 2). When there are multiple detections in the X-ray images of sources bright enough with the same SNR threshold to be considered as possible counterparts, we assigned ‘multiple’ class, given that the Swift-BAT observation has a position uncertainty up to 13.8 arcmin, which depends on the signal-to-noise ratio (see III.3). Based on these procedures, we identified 328 new hard X-ray sources. The remaining 94 unidentified sources, together with the 35 still unidentified sources listed in the 70 month catalog, are further classified into three categories depending on the presence of soft X-ray observations ( keV) and source detections. Sources that have archival soft X-ray observations (e.g., Swift-XRT, Chandra, and XMM-Newton) are assigned to either ‘Unknown class I’ (N=36) or ‘Unknown class II’ (N=55, Table 1). When the observed soft X-ray images do not show well-defined X-ray point source, ‘Unknown class I’ is assigned, and further investigation is required for identification. When there is a soft X-ray detection from archival soft X-ray observation, we assigned ‘Unknown class II’. We matched these sources whose optical counterpart is not known with Two Micron All Sky Survey (2MASS777http://irsa.ipac.caltech.edu/Missions/2mass.html, Skrutskie et al. 2006) All-Sky Point Source Catalog (PSC) and report the closest counterpart within 5 arcsec of matching radius in Table 2. For the rest ‘Unknown class III’ sources (N=38) for which archival X-ray data are not available, we submitted coordinates to the Swift-XRT observation with a request of 10 ks of exposure time for a follow-up investigation. Note that we cross-matched all unidentified sources with the archival NuSTAR X-ray data and we detected no additional counterparts.
| Class | Source Type | Number |
|---|---|---|
| 10 | Unknown class IaaUnknown class indicates that we do not know source type of the optical counterpart. In particular, ‘Unknown class I’ is used when there is no soft X-ray (3-10 keV) detection despite its archival soft X-ray observation. | 36 |
| 11 | Unknown class IIbb‘Unknown class II’ indicates sources for which there is a soft X-ray detection with SNR threshold greater than 3 from archival soft X-ray observation. When available, we list their 2MASS counterpart source matched within 5 arcsec of angular distance in Table 2. | 55 |
| 12 | Unknown class IIIcc‘Unknown class III’ includes sources without archival soft X-ray observations. | 38 |
| 15 | Multipledd‘Multiple’ class indicates the case where there are more than one soft X-ray detection. | 10 |
| 20 | Galactic centeree‘Galactic center’ indicates Sagittarius A*. | 1 |
| 30 | Galaxy Cluster | 26 |
| 40 | Seyfert I (Sy 1.0-1.8)ff‘Seyfert I’ includes high-z broad-line AGN (N=2). | 379 |
| 50 | Seyfert II (Sy 1.9-2.0)gg‘Seyfert II’ includes Sy2 candidates (N=10) which present narrow emission lines in their optical spectral energy distribution. | 448 |
| 60 | LINER | 6 |
| 70 | Unknown AGNhh‘Unknown AGN’ indicates X-ray sources associated with galaxies whose optical spectra and type classifications are not known. | 114 |
| 80 | Beamed AGN (Blazar/FSRQ) | 158 |
| 90 | Cataclysmic Variable star (CV) | 75 |
| 100 | Symbiotic star | 4 |
| 110 | Other star | 12 |
| 120 | Open star cluster | 1 |
| 130 | Starburst galaxyii‘Starburst galaxy’ indicates M82. | 1 |
| 140 | Compact group of galaxiesjj‘Compact group of galaxies’ indicates Arp 318. | 1 |
| 150 | Pulsar | 25 |
| 160 | Supernova remnant (SNR) | 7 |
| 170 | Nova | 6 |
| 180 | High mass X-ray binary (HMXB) | 108 |
| 190 | Low mass X-ray binary (LMXB) | 109 |
| 200 | Other X-ray binary (XRB) | 8 |
| 210 | Globular Cluster (GC) | 1 |
| 220 | Molecular cloud | 2 |
| 230 | Gamma-ray source | 1 |
| Total | 1632 |
II.2. Source type
Since we have reclassified source types (Table 1) compared to that of the previous Swift-BAT 70 month survey catalog, we reviewed the classification of sources reported by the 70 month survey catalog to properly assign their source types following the current scheme. The main changes in counterpart source types compared to that of 70 month survey catalog are in the AGN (including ‘Unknown AGN’, ‘LINER’, ‘Other AGN’, and ‘Seyfert’ classes) ‘Galaxy’, ‘QSO’, and ‘Unknown’ classes. We assigned ‘Unknown AGN’ when a source is associated with an extended galaxy in the optical image but lacks firm evidence of AGN optical emission diagnostics. ‘QSO’ type is replaced with either one of sub-classes of ‘Seyfert’ or ‘Beamed AGN (Blazar/FSRQ)’ based on the presence and shape of optical emission lines in the literature.
In order to provide reliable classification of source type, we searched public optical spectroscopic surveys (Sloan Digital Sky Survey and 6dF Galaxy Survey; Abazajian et al. 2009; Jones et al. 2009; Alam et al. 2015), the follow-up improved spectral line measurement database of SDSS DR7 galaxies (the OSSY catalog, Oh et al. 2011888http://gem.yonsei.ac.kr/ossy/), the 13th edition of quasars and AGN catalogues (Véron-Cetty & Véron 2010999http://cdsweb.u-strasbg.fr/cgi-bin/qcat?J/A+A/518/A10/) as well as recent investigation from the Swift-BAT AGN Spectroscopic Survey (Koss et al., 2017; Ricci et al., 2017a) and INTEGRAL mission based X-ray catalogues (INTEGRAL General Reference catalog101010v40, http://www.isdc.unige.ch/integral/science/catalogue#Reference, INTEGRAL IBIS/ISGRI catalog, Beckmann et al. 2009; Malizia et al. 2016) to determine detailed source types that listed in Table 1. We also used the Roma blazar catalogue (BZCAT) v5.0111111http://www.asdc.asi.it/bzcat/ (Massaro et al., 2009) for reference to beamed AGN.
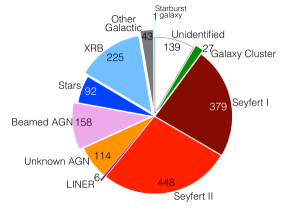
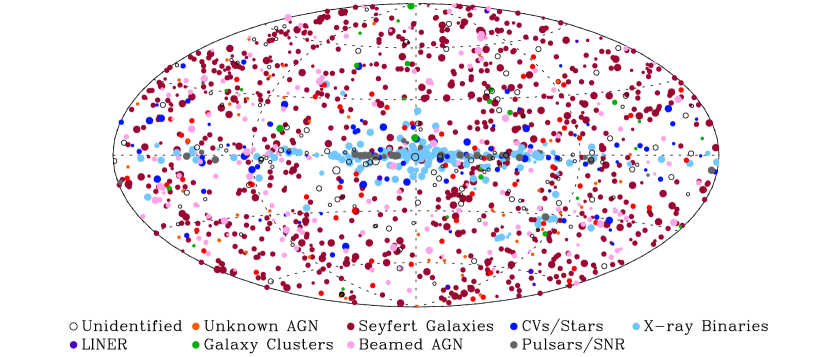
Table 1 and Figure 3 give a summary of counterpart identifications for the Swift-BAT 105 month catalog. Figure 4 presents the distribution of sources in a Galactic coordinates with a Hammer-Aitoff projection. The colors indicate the different types of sources and the size of the symbol corresponds to the source flux in the keV band.
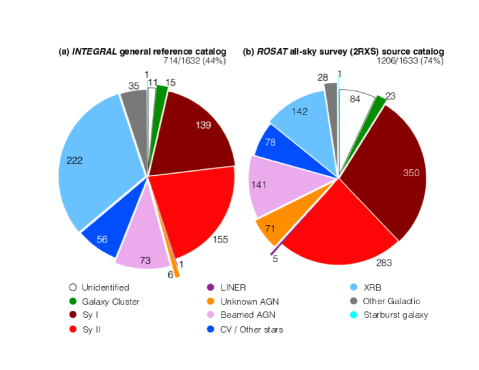
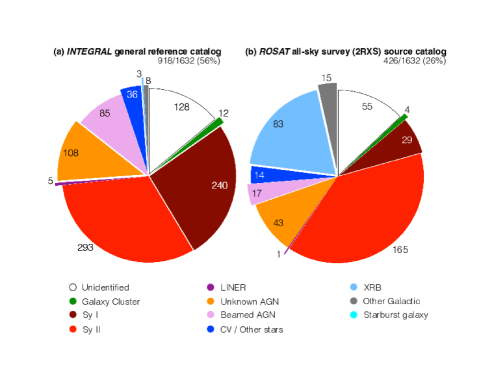
Figure 5 shows the counterpart types of the Swift-BAT 105 month sources in common with the INTEGRAL general reference catalog (left) and the ROSAT all-sky survey (2RXS) source catalog (right, Boller et al. 2016). As the ROSAT all-sky survey scanned the whole sky in the keV band (Truemper, 1982), a large fraction of the overlap with BAT and ROSAT is found for sources identified as Seyfert I due to absence of absorption in these objects. On the other hand, the INTEGRAL catalog has a large overlap with the BAT for galactic sources, such as X-ray binaries, due to its deep galactic plane exposures. In Figure 6, we present the number of each sources of the various types that are not detected in the INTEGRAL general reference catalog (left) and the ROSAT all-sky survey (2RXS) source catalog (right). It is clearly seen that Swift-BAT detects a large number of extragalactic sources, primarily AGN, that are not detected by either ROSAT or INTEGRAL.
The Palermo Swift-BAT hard X-ray catalog identified 1286 hard X-ray sources in their latest publication (Cusumano et al., 2010b) using data acquired in the 54 months of the Swift-BAT operation. The catalog adopted a of significance threshold from at least one of the three energy bands ( keV, keV, and keV). The total number of spurious detections varies between 15 and 45 depending on detection in each energy band, compared to one spurious detection in the entire sky at the same threshold level achieved by the BAT catalogs as Tueller et al. (2010) described.
We measure the overlap between the Palermo 54 month BAT catalog and this work using a 15 arcmin matching radius to test whether the BAT detection maps agree between the two processing routines. Since the 54 month catalog was released in 2010 before much of the soft X-ray data was available, 30 out of 1286 sources have multiple counterparts listed for a single BAT detection, which we exclude. We confirmed that 68% of the sources identified in this work (1125/1632) are in overlap with the 54 month Palermo Swift-BAT catalog. Of the 1125 sources common in both catalogs, the 105 month catalog presents 102 new detections with respect to the 70 month catalog. The majority of the common sources (969/1125) are AGN (N=777) or X-ray binaries (N=192). Meanwhile, 507 sources are found in the Swift-BAT 105 month catalog but not in the Palermo 54 month catalog. Among those sources not detected in the Palermo 54 catalog, bulk populations are AGN (N=347) or unknown type of sources (N=109). It is also noteworthy to mention that the 159 sources are detected in the 54 month Palermo Swift-BAT catalog but not in this work. Of the 159 sources detected in Palermo but not detected in the 105 month catalog at keV, the majority are detected at softer energies either in the or keV band (65%, 104/159). The 159 sources that are only detected in the 54 month Palermo Swift-BAT catalog will be investigated further in future catalogs that use alternate detection strategies with many energy bands, time variability, or are optimized for sources like heavily obscured AGN (e.g. Koss et al. 2016). Future catalog papers will compare sources in the Palermo 100 month catalog (Segreto et al. in prep).
III. The Swift-BAT 105 month catalog
Table Acknowledgments presents the catalog of the Swift-BAT 105 month data. The 105 month catalog in its full extent can be found in the online version of the journal, and on the Swift-BAT 105 month survey Web site121212http://swift.gsfc.nasa.gov/docs/swift/results/bs105mon/. Future multiwavelength counterpart data for the Swift-BAT 105 month sources will also be available131313www.bass-survey.com. In Table Acknowledgments we present the source number in the first column, which has a consistent order with the previous Swift-BAT 70 month survey catalog. We listed the sources reported from the Swift-BAT 70 month survey catalog first (), and then we assigned following numbers () for the newly detected sources in the order of increasing right ascension.
We provide the BAT name in the second column, which is created by the BAT source position along with the Swift-BAT detection in equatorial coordinates for epoch J2000.0 in the third and the fourth columns. For the sources which has been previously published (i.e., the 70 month Swift-BAT catalog), we have used the corresponding BAT name.
The significance of the BAT source detection which is the ratio between the highest pixel value of the source from the total-band mosaic flux map and the local noise is listed in the fifth column. As discussed in Tueller et al. (2010), we chose significance level as a detection threshold since one can expect 1.54 sources at the level from independent pixels.
We also provide the name of the counterpart in the sixth column, identified as described in Section II.1. The name of the counterpart can be a well-known optical source, or it can be a wavelength dependent. Often these names come from the soft band X-ray archival data such as Swift-XRT, Chandra, and XMM-Newton. For the firmly identified counterpart sources, we provide their equatorial coordinates (J2000.0) in the seventh and eighth columns.
Table Acknowledgments includes keV flux of the Swift-BAT sources in units of , with its 90% confidence level in the ninth and tenth columns. The Swift-BAT flux of each counterpart is extracted from the hard X-ray map at the location of the identified counterpart given in the seventh and eighth columns. In order to measure flux and photon spectral index (), a power-law model is applied.
The Swift-BAT luminosity of the counterpart is also provided in Table Acknowledgments for sources classified as AGN. We assumed a cosmology with , , and for computing the source luminosity in a unit of erg s-1 in the keV band using the redshift and flux listed in the table.
| Num | BAT Name | R.A.aaThe Swift-BAT XRT soft X-ray (3-10 keV) source position in J2000 coordinates. | Decl.aaThe Swift-BAT XRT soft X-ray (3-10 keV) source position in J2000 coordinates. | Source TypebbU2 indicates ‘Unknown class II’ which is listed in the Table. 1. | 2MASS designation | R.A.ccThe 2MASS source position in J2000 coordinates. | Decl.ccThe 2MASS source position in J2000 coordinates. | Sep.ddAngular separation between the Swift-XRT soft X-ray source position and 2MASS catalog in unit of arcsecond. |
|---|---|---|---|---|---|---|---|---|
| 1293 | SWIFT J | 97.4441667 | U2 | 97.452801 | 3.40 | |||
| 1340 | SWIFT J | 132.6658333 | U2 | 132.667015 | 3.20 | |||
| 1362 | SWIFT J | 149.6466667 | U2 | 149.645688 | 4.90 | |||
| 1454 | SWIFT J | 226.0675000 | U2 | 226.067125 | 1.38 | |||
| 1479 | SWIFT J | 244.5320833 | U2 | 244.532140 | 1.07 | |||
| 1525 | SWIFT J | 270.1758333 | U2 | 270.176973 | 4.35 | |||
| 1554 | SWIFT J | 284.3962500 | U2 | 284.397176 | 3.77 | |||
| 1583 | SWIFT J | 308.4137500 | U2 | 308.414420 | 2.38 | |||
| 1591 | SWIFT J | 311.6637500 | U2 | 311.665153 | 4.59 | |||
| 1592 | SWIFT J | 313.7841667 | U2 | 313.784820 | 2.78 |
Lastly, Source type class shown in Table 1 in integer is provided with detailed source type in the last two columns.
III.1. BAT Fluxes and Spectra
The fluxes listed in the Table Acknowledgments were measured from the eight BAT bands ( keV, keV, keV, keV, keV, keV, keV, and keV) of the mosaicked maps at the position of the identified counterpart. For the case of BAT sources whose counterparts are not known, we measured the flux from the detected BAT source position using the same eight BAT bands.
We measured the fluxes of the Swift-BAT sources by fitting the eight-channel spectra with the pegpwrlw model (power-law with pegged normalization) provided by the XSPEC141414http://heasarc.nasa.gov/xanadu/xspec/ software (Arnaud, 1996) over the keV range as Tueller et al. (2010) and Baumgartner et al. (2013) presented in previous Swift-BAT catalogs. However, the applied pegpwrlw model does not always yields a good fit for the 1632 Swift-BAT sources, since a simple power-law model cannot explain the wide range of physical properties of the different objects. For such reason, we also provide the reduced value for each source in Table Acknowledgments as an indicator of goodness of fit.
We also used the error function provided by XSPEC in order to estimate error values of the overall flux and the spectral photon index with the 90% confidence interval.
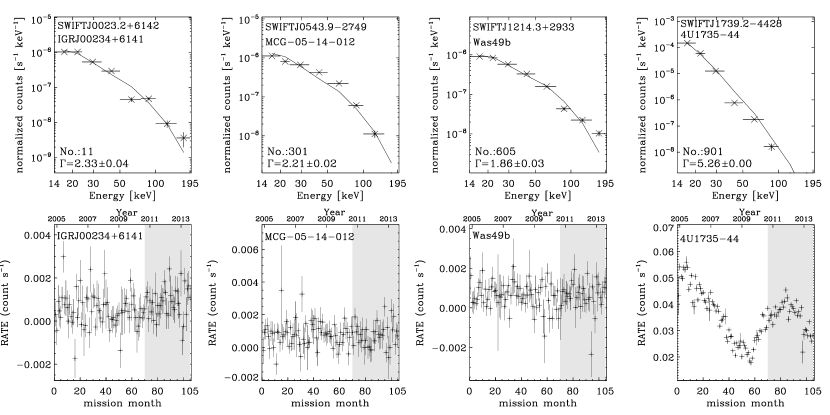
We provide the eight-channel spectra of the Swift-BAT 105 month survey sources in a format of standard fits file on our Web site12 and in the online journal. Examples of the spectra and their fits are shown in the Figure 7 (top panels).

III.2. Light Curves
Similarly to what was done in the Swift-BAT 70 month catalog (Baumgartner et al., 2013), we provide monthly light curves of the Swift-BAT sources that span the 105 month period between December 2004 and August 2013. For each month of Swift-BAT data, we generated all-sky total-band mosaic images. Then we extracted the monthly mosaic fluxes for each hard X-ray detection that identified over the whole period of observation. Figure 7 shows four example light curves from the Swift-BAT 105 month survey in the bottom panels.
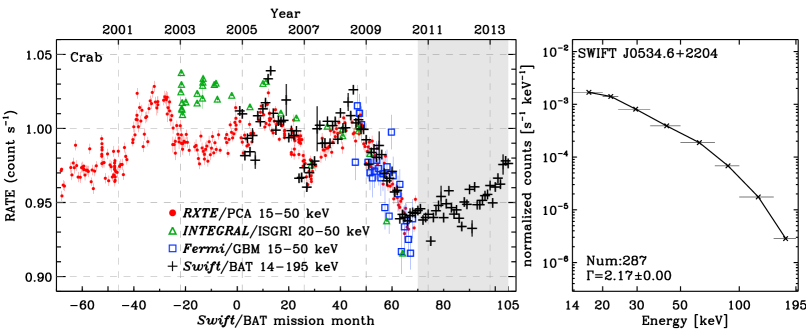
The Crab nebula is of particular importance as it has been used as a standard candle by X-ray and gamma-ray studies. Our results for the Crab nebula are consistent with those reported Wilson-Hodge et al. (2011) with a decline in the keV band from the observation of the Fermi Gamma-ray Burst Monitor (Meegan et al., 2009). Figure 8 shows composite light curves of the Crab nebula from RXTE, INTEGRAL, Fermi, and Swift. The Swift-BAT 70 month data (Swift/BAT mission month from 1 to 70 in the left panel of Figure 8) confirmed the variations of 10% in a long-term scales up to the first 70 month of observations, i.e., September 2010. As illustrated in the left panel of Figure 8, the monthly light curve of the Crab nebula increases since September 2010 ().
We provide the light curves of the Swift-BAT 105 month survey sources on the Swift-BAT Web site12 and in the online journal along with the eight-channel spectra.
III.3. Confused Sources
As mentioned in the Section II.1 and Table 1, 10 sources are classified as ‘multiple’ in our catalog when there are at least two detections in Swift-XRT soft X-ray image. In these cases, it is possible that the detected Swift-BAT source has multiple X-ray counterparts significantly contributing to the observed keV flux. We explicitly differentiate those sources in Table 1 and Table Acknowledgments using distinctive source class () and type (‘Multiple’).
In the previous 70 month catalog multiple bright soft X-ray counterparts were found and they were all listed because of the inability of the low quality Swift XRT to enable detailed spectral modeling to find the likely sources. However, subsequent work found that the BAT emission was often dominated by a single AGN except in a few unusual cases (e.g. Ricci et al. 2017a). For instance the typical luminosity ratio for dual AGN is large (1/11, Koss et al. 2012). In this catalog version we report only one entry for each BAT source with the ‘multiple’ counterpart flag and will discuss the likely counterparts in future papers when better X-ray data is available.
IV. Survey Characteristics
IV.1. Source Positions and Uncertainties
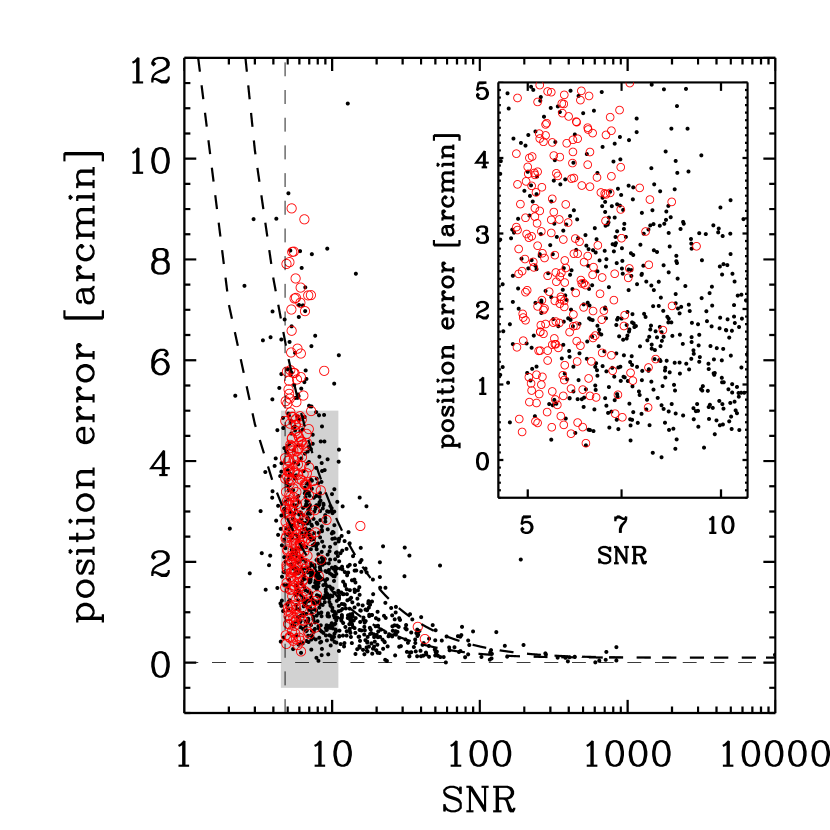
We show the angular separation between the Swift-BAT position and the position of identified counterpart as a function of the level of the significance of the Swift-BAT source detection in Figure 9. As one can expect, the angular separation (i.e., the positional accuracy of the Swift-BAT detection) decreases as the level of the detection significance becomes larger.
For the identified counterparts which are not located in the Galactic plane (Galactic latitude or degree), the estimate of the error radius (in arcminutes) can be represented as follows
| (1) |
where SNR is the level of the significance of the Swift-BAT detection. This empirical function explains the position error radius for the 90% of the Swift-BAT sources that are not in the galactic plane. The systematic error of 0.1 arcmin is deduced from the positional error of high SNR sources ().
IV.2. Measured Sensitivity and Noise
Figure 10 presents the distribution of sensitivity in units of mCrab measured from the all-sky mosaicked map. The achieved median sensitivity in the 105 month survey is 0.31 mCrab, which corresponds to in the keV band, while 90% of the sky is covered with a sensitivity of 0.36 mCrab ()151515A total Crab flux in the keV band is erg cm-2 s-1.
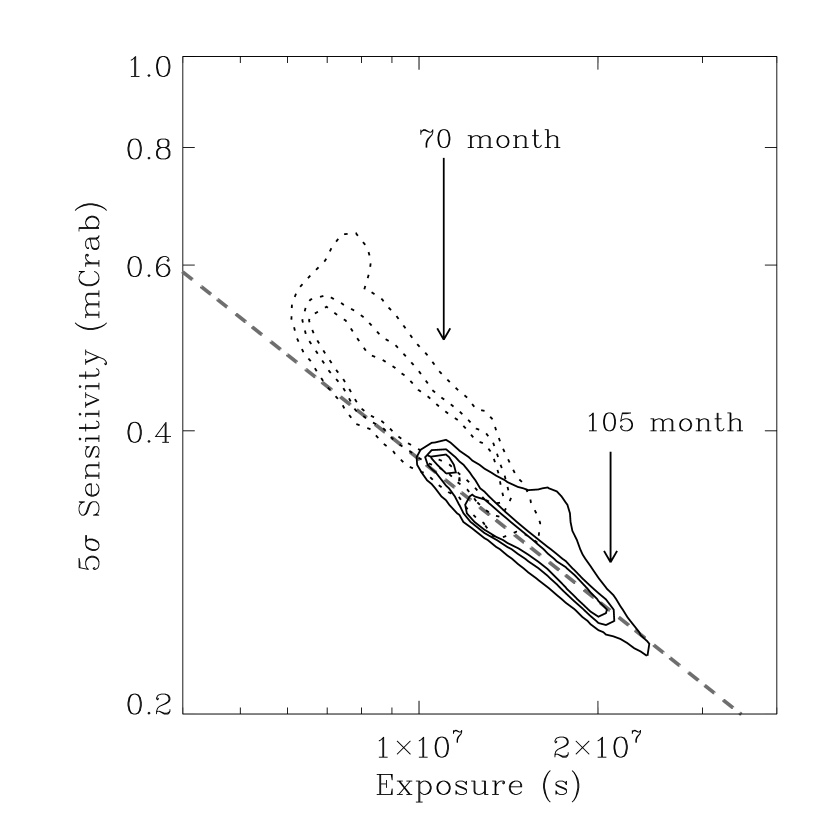
Figure 11 shows the measured sensitivity in unit of mCrab as a function of exposure time. The solid contours are from the 105 month survey while the dotted contours are from the 70 month survey as a comparison. As Baumgartner et al. (2013) described, the curved tails shown in the 70 month survey in the short exposure and high sensitivity regime arise from observations near galactic center with high systematic noise. The 105 month data are consistent with a sensitivity that scales with the square root of the exposure time, indicating that systematic limits to the BAT sensitivity have not yet been reached.
V. Conclusions
The Swift-BAT 105 month catalog is the fifth and the most recent catalog of the Swift-BAT all-sky hard X-ray survey. The catalog includes 1632 hard X-ray sources detected across the entire sky. Out of these 1632 sources, 422 are new detections with respect to the 70 month catalog, and 320 are reported as hard X-ray sources for the first time. The Swift-BAT 105 month survey catalog contains 947 non-beamed AGN detected in the hard X-ray band. Given the fact that most of the 129 unidentified sources are not located near the galactic plane, the total number of AGN is likely be more than the current report. Furthermore, the catalog includes list of beamed AGN (blazars/FSRQ), cataclysmic variable star (CV), pulsar, supernova remnant, high mass X-ray binary (HMXB) as well as low mass X-ray binary (LMXB) which are important references for many scientific studies.
Follow-up observations and studies of the Swift-BAT sources are being actively pushed forward. Berney et al. (2015) showed correlations between X-ray continuum emission and optical narrow emission lines based on the optical spectroscopic follow-up project (the BAT AGN Spectroscopic Survey, Koss et al. 2017). The relationship between optical narrow-line emission line ratios and Eddington accretion rate was investigated by Oh et al. (2017). Lamperti et al. (2017) also explored near-Infrared (NIR, ) spectroscopic properties of 102 Swift-BAT selected AGN. Detailed studies of X-ray properties such as spectral photon index (Trakhtenbrot et al., 2017) and obscuration (Ricci et al., 2017b) have been made, and the correlation between merger stage of interacting systems and their Eddington accretion rate (Koss et al., in prep.) is currently in preparation. Meanwhile, Swift-XRT observations are currently being carried with 10 ksec of exposure time as part of a filler program for all the sources detected by Swift-BAT without soft X-ray observations.
Time variability, soft and hard bands studies of the Swift-BAT sources will be explored in future catalogs. Furthermore, while we selected sources based on a 4.8 detection threshold using a Crab like spectra, more sources can be detected using the spectral curvature or harder/softer (Koss et al., 2013, 2016) which we also plan to publish in future catalogs. As a final remark, we address that we are currently working on the 148 months catalog as of time of this writing.
Acknowledgments
KO and KS acknowledge support from the Swiss National Science Foundation (SNSF) through Project grants 200021_157021. KO is an International Research Fellow of the Japan Society for the Promotion of Science (JSPS) (ID: P17321). MK acknowledges support from the SNSF through the Ambizione fellowship grant PZ00P2_154799/1, SNSF grant PP00P2 138979/1, and support from NASA through ADAP award NNH16CT03C. KS acknowledges support from Swiss National Science Foundation Grants PP00P2_138979 and PP00P2_166159.
This research has made use of data and/or software provided by the High Energy Astrophysics Science Archive Research Center (HEASARC), which is a service of the Astrophysics Science Division at NASA/GSFC and the High Energy Astrophysics Division of the Smithsonian Astrophysical Observatory.
This research has made use of data supplied by the UK Swift Science Data Centre at the University of Leicester.
The scientific results reported in this article are based on observations made by the Chandra X-ray Observatory, data obtained from the Chandra Data Archive, observations made by the Chandra X-ray Observatory and published previously in cited articles.
This research has made use of observations obtained with XMM-Newton, an ESA science mission with instruments and contributions directly funded by ESA Member States and NASA.
This research has made use of observations with INTEGRAL, an ESA project with instruments and science data centre funded by ESA member states (especially the PI countries: Denmark, France, Germany, Italy, Switzerland, Spain), and Poland, and with the participation of Russia and the USA.
This research has made use of the NASA/IPAC Extragalactic Database (NED) which is operated by the Jet Propulsion Laboratory, California Institute of Technology, under contract with the National Aeronautics and Space Administration.
This research has made use of the SIMBAD database, operated at CDS, Strasbourg, France.
Funding for the SDSS and SDSS-II has been provided by the Alfred P. Sloan Foundation, the Participating Institutions, the National Science Foundation, the U.S. Department of Energy, the National Aeronautics and Space Administration, the Japanese Monbukagakusho, the Max Planck Society, and the Higher Education Funding Council for England. The SDSS Web Site is http://www.sdss.org/. The SDSS is managed by the Astrophysical Research Consortium for the Participating Institutions. The Participating Institutions are the American Museum of Natural History, Astrophysical Institute Potsdam, University of Basel, University of Cambridge, Case Western Reserve University, University of Chicago, Drexel University, Fermilab, the Institute for Advanced Study, the Japan Participation Group, Johns Hopkins University, the Joint Institute for Nuclear Astrophysics, the Kavli Institute for Particle Astrophysics and Cosmology, the Korean Scientist Group, the Chinese Academy of Sciences (LAMOST), Los Alamos National Laboratory, the Max-Planck-Institute for Astronomy (MPIA), the Max-Planck-Institute for Astrophysics (MPA), New Mexico State University, Ohio State University, University of Pittsburgh, University of Portsmouth, Princeton University, the United States Naval Observatory, and the University of Washington.
Funding for SDSS-III has been provided by the Alfred P. Sloan Foundation, the Participating Institutions, the National Science Foundation, and the U.S. Department of Energy Office of Science. The SDSS-III web site is http://www.sdss3.org/. SDSS-III is managed by the Astrophysical Research Consortium for the Participating Institutions of the SDSS-III Collaboration including the University of Arizona, the Brazilian Participation Group, Brookhaven National Laboratory, University of Cambridge, Carnegie Mellon University, University of Florida, the French Participation Group, the German Participation Group, Harvard University, the Instituto de Astrofisica de Canarias, the Michigan State/Notre Dame/JINA Participation Group, Johns Hopkins University, Lawrence Berkeley National Laboratory, Max Planck Institute for Astrophysics, Max Planck Institute for Extraterrestrial Physics, New Mexico State University, New York University, Ohio State University, Pennsylvania State University, University of Portsmouth, Princeton University, the Spanish Participation Group, University of Tokyo, University of Utah, Vanderbilt University, University of Virginia, University of Washington, and Yale University.
The Digitized Sky Surveys were produced at the Space Telescope Science Institute under U.S. Government grant NAG W-2166. The images of these surveys are based on photographic data obtained using the Oschin Schmidt Telescope on Palomar Mountain and the UK Schmidt Telescope. The plates were processed into the present compressed digital form with the permission of these institutions.
The National Geographic Society - Palomar Observatory Sky Atlas (POSS-I) was made by the California Institute of Technology with grants from the National Geographic Society.
The Second Palomar Observatory Sky Survey (POSS-II) was made by the California Institute of Technology with funds from the National Science Foundation, the National Geographic Society, the Sloan Foundation, the Samuel Oschin Foundation, and the Eastman Kodak Corporation.
The Oschin Schmidt Telescope is operated by the California Institute of Technology and Palomar Observatory.
The UK Schmidt Telescope was operated by the Royal Observatory Edinburgh, with funding from the UK Science and Engineering Research Council (later the UK Particle Physics and Astronomy Research Council), until 1988 June, and thereafter by the Anglo-Australian Observatory. The blue plates of the southern Sky Atlas and its Equatorial Extension (together known as the SERC-J), as well as the Equatorial Red (ER), and the Second Epoch [red] Survey (SES) were all taken with the UK Schmidt.
We acknowledge the efforts of the staff of the Australian Astronomical Observatory (AAO), who developed the 6dF instrument and carried out the observations for the survey.
This publication makes use of data products from the Two Micron All Sky Survey, which is a joint project of the University of Massachusetts and the Infrared Processing and Analysis Center/California Institute of Technology, funded by the National Aeronautics and Space Administration and the National Science Foundation.
This research has made use of NASA’s Astrophysics Data System.
| No.aaBAT number. The provided index is same with that of the 70 month catalog. For the new detections, the index is assigned in the order of increasing right ascension which is given in the third column. | BAT NamebbBAT Name. | R.A.ccJ2000 coordinates. | Decl.ccJ2000 coordinates. | S/N | Counterpart Name | R.A.c,dc,dfootnotemark: | Decl.c,dc,dfootnotemark: | FluxeeThe flux is extracted from the BAT maps at the position listed for the counterpart, is in units of , and is computed for the 14-195 keV band. | ffThe error range is the 90% confidence interval. | ggThe spectral index is computed from a power-law fit to the eight-band BAT data. | ffThe error range is the 90% confidence interval. | hhThe redshifts are taken from the online databases NED and SIMBAD or in a few cases from our own analysis of the optical data. | logiiThe luminosity is computed from the flux and redshift in this table, with units of erg in the 14-195 keV band. | CljjSource class. | Type | |
|---|---|---|---|---|---|---|---|---|---|---|---|---|---|---|---|---|
| 1 | SWIFT J0001.0-0708 | 7.73 | 2MASX J00004876-0709117 | 13.49 | 1.3 | 43.64 | 50 | Sy1.9 | ||||||||
| 2 | SWIFT J0001.6-7701 | 6.32 | Fairall 1203 | 13.23 | 2.2 | 44.03 | 50 | Sy1.9 | ||||||||
| 3 | SWIFT J0002.5+0323 | 5.50 | NGC 7811 | 10.79 | 0.7 | 43.20 | 40 | Sy1.5 | ||||||||
| 4 | SWIFT J0003.3+2737 | 5.98 | 2MASX J00032742+2739173 | 10.29 | 0.4 | 43.58 | 50 | Sy2 | ||||||||
| 5 | SWIFT J0005.0+7021 | 8.52 | 2MASX J00040192+7019185 | 13.41 | 1.0 | 44.49 | 50 | Sy1.9 | ||||||||
| 6 | SWIFT J0006.2+2012 | 10.42 | Mrk 335 | 15.97 | 0.6 | 43.38 | 40 | Sy1.2 | ||||||||
| 7 | SWIFT J0009.4-0037 | 4.26 | 2MASX J00091156-0036551 | 10.17 | 0.3 | 44.13 | 50 | Sy2 | ||||||||
| 8 | SWIFT J0010.5+1057 | 14.02 | Mrk 1501 | 30.34 | 0.6 | 44.78 | 80 | Beamed AGN | ||||||||
| 9 | SWIFT J0017.1+8134 | 8.57 | [HB89] 0014+813 | 11.39 | 0.7 | 48.06 | 80 | Beamed AGN | ||||||||
| 10 | SWIFT J0021.2-1909 | 10.37 | 2MASX J00210753-1910056 | 19.60 | 0.7 | 44.65 | 50 | Sy2 | ||||||||
| 1211 | SWIFT J0000.5+3251 | 5.00 | IC 5373 | 8.75 | 0.4 | 43.33 | 70 | Unknown AGN | ||||||||
| 1212 | SWIFT J0005.3-7443 | 5.69 | 2MASX J00052036-7426403 | 13.38 | 0.5 | 44.79 | 40 | Sy1 | ||||||||
| 1213 | SWIFT J0007.6+0048 | 6.14 | SWIFT J0007.6+0048 | 4.62 | 1.0 | 15 | multiple | |||||||||
| 1214 | SWIFT J0007.8-4133 | 5.02 | SWIFT J0007.8-4133 | 7.95 | 0.9 | 12 | U3 | |||||||||
| 1215 | SWIFT J0029.1+5937 | 13.02 | V* V1037 Cas | 9.07 | 1.7 | 190 | LMXB | |||||||||
| 1216 | SWIFT J0043.9-5009 | 4.85 | NGC 238 | 5.09 | 0.5 | 42.98 | 70 | Unknown AGN | ||||||||
| 1217 | SWIFT J0046.1-4214 | 5.73 | PKS 0043-42 | 10.94 | 0.3 | 44.58 | 60 | LINER | ||||||||
| 1218 | SWIFT J0047.3+1445 | 5.18 | UGC 00488 | 11.28 | 0.6 | 43.61 | 40 | Sy1 | ||||||||
| 1219 | SWIFT J0048.9+8229 | 5.90 | 2MASX J00502684+8229000 | 10.34 | 0.7 | 70 | Unknown AGN | |||||||||
| 1220 | SWIFT J0052.9+6630 | 5.18 | 2MASX J00531665+6630336 | 10.69 | 1.4 | 11 | U2 | |||||||||
Note. — (This table is available in its entirety in a machine-readable form in the online journal. A portion is shown here for guidance regarding its form and content.)
References. — Abazajian et al. 2009; Acero et al. 2015; Ajello et al. 2012, 2016; Alam et al. 2015; Baumgartner et al. 2013; Beckmann et al. 2009; Berton et al. 2015; Bird et al. 2010; Buttiglione et al. 2011; Chavushyan et al. 2002; Chen et al. 2015; Coleiro et al. 2013; Courtois et al. 2009; Cowperthwaite et al. 2013; Cusumano et al. 2010a, b; D’Abrusco et al. 2014; de Ruiter et al. 1998; Edelson & Malkan 2012; Grebenev et al. 2013; Haakonsen & Rutledge 2009; Hakobyan et al. 2012; Hau et al. 1995; Healey et al. 2008; Hiroi et al. 2013; Huchra et al. 2012; Jones et al. 2009; Karachentseva et al. 2010; Karasev et al. 2012; Kuraszkiewicz et al. 2009; Landi et al. 2017; Loveday 1996; Malizia et al. 2012, 2016; Mahony et al. 2010, 2011; Maiorano et al. 2011; Makarov et al. 2014; Maselli et al. 2013; Massaro et al. 2009, 2012; Meléndez et al. 2014; Molina et al. 2012; Momcheva et al. 2015; Oh et al. 2011, 2015; Parisi et al. 2014; Paturel et al. 2003; Raimann et al. 2005; Ratti et al. 2010; Rojas et al. 2017; Roman et al. 1996; Rousseau et al. 2000; Straal et al. 2016; Sweet et al. 2014; Tomsick et al. 2009, 2012, 2016; Tzanavaris et al. 2014; Uzpen et al. 2007; Vasudevan et al. 2013; Véron-Cetty & Véron 2001, 2010; Warwick et al. 2012; Xiong et al. 2015
References
- Abazajian et al. (2009) Abazajian, K. N., Adelman-McCarthy, J. K., Agüeros, M. A., et al. 2009, ApJS, 182, 543
- Acero et al. (2015) Acero, F., Ackermann, M., Ajello, M., et al. 2015, ApJS, 218, 23
- Ajello et al. (2012) Ajello, M., Alexander, D. M., Greiner, J., et al. 2012, ApJ, 749, 21
- Ajello et al. (2016) Ajello, M., Ghisellini, G., Paliya, V. S., et al. 2016, ApJ, 826, 76
- Alam et al. (2015) Alam, S., Albareti, F. D., Allende Prieto, C., et al. 2015, ApJS, 219, 12
- Arnaud (1996) Arnaud, K. A. 1996, in Astronomical Society of the Pacific Conference Series, Vol. 101, Astronomical Data Analysis Software and Systems V, ed. G. H. Jacoby & J. Barnes, 17
- Barthelmy et al. (2005) Barthelmy, S. D., Barbier, L. M., Cummings, J. R., et al. 2005, Space Sci. Rev., 120, 143
- Baumgartner et al. (2013) Baumgartner, W. H., Tueller, J., Markwardt, C. B., et al. 2013, ApJS, 207, 19
- Beckmann et al. (2009) Beckmann, V., Soldi, S., Ricci, C., et al. 2009, A&A, 505, 417
- Berney et al. (2015) Berney, S., Koss, M., Trakhtenbrot, B., et al. 2015, MNRAS, 454, 3622
- Berton et al. (2015) Berton, M., Foschini, L., Ciroi, S., et al. 2015, A&A, 578, A28
- Bird et al. (2010) Bird, A. J., Bazzano, A., Bassani, L., et al. 2010, ApJS, 186, 1
- Bird et al. (2016) Bird, A. J., Bazzano, A., Malizia, A., et al. 2016, ApJS, 223, 15
- Boller et al. (2016) Boller, T., Freyberg, M. J., Trümper, J., et al. 2016, A&A, 588, A103
- Burrows et al. (2005) Burrows, D. N., Hill, J. E., Nousek, J. A., et al. 2005, Space Sci. Rev., 120, 165
- Buttiglione et al. (2011) Buttiglione, S., Capetti, A., Celotti, A., et al. 2011, A&A, 525, A28
- Chambers et al. (2016) Chambers, K. C., Magnier, E. A., Metcalfe, N., et al. 2016, ArXiv e-prints, arXiv:1612.05560 [astro-ph.IM]
- Chavushyan et al. (2002) Chavushyan, V., Mujica, R., Valdes, J. R., et al. 2002, Astronomy Reports, 46, 697
- Chen et al. (2015) Chen, Z.-F., Gu, Q.-S., & Chen, Y.-M. 2015, ApJS, 221, 32
- Coleiro et al. (2013) Coleiro, A., Chaty, S., Zurita Heras, J. A., Rahoui, F., & Tomsick, J. A. 2013, A&A, 560, A108
- Courtois et al. (2009) Courtois, H. M., Tully, R. B., Fisher, J. R., et al. 2009, AJ, 138, 1938
- Cowperthwaite et al. (2013) Cowperthwaite, P. S., Massaro, F., D’Abrusco, R., et al. 2013, AJ, 146, 110
- Cusumano et al. (2010a) Cusumano, G., La Parola, V., Segreto, A., et al. 2010a, A&A, 510, A48
- Cusumano et al. (2010b) —. 2010b, A&A, 524, A64
- D’Abrusco et al. (2014) D’Abrusco, R., Massaro, F., Paggi, A., et al. 2014, ApJS, 215, 14
- de Ruiter et al. (1998) de Ruiter, H. R., Parma, P., Stirpe, G. M., et al. 1998, A&A, 339, 34
- Edelson & Malkan (2012) Edelson, R., & Malkan, M. 2012, ApJ, 751, 52
- Forman et al. (1978) Forman, W., Jones, C., Cominsky, L., et al. 1978, ApJS, 38, 357
- Gehrels et al. (2004) Gehrels, N., Chincarini, G., Giommi, P., et al. 2004, ApJ, 611, 1005
- Giacconi et al. (1971) Giacconi, R., Kellogg, E., Gorenstein, P., Gursky, H., & Tananbaum, H. 1971, ApJ, 165, L27
- Grebenev et al. (2013) Grebenev, S. A., Lutovinov, A. A., Tsygankov, S. S., & Mereminskiy, I. A. 2013, MNRAS, 428, 50
- Haakonsen & Rutledge (2009) Haakonsen, C. B., & Rutledge, R. E. 2009, ApJS, 184, 138
- Hakobyan et al. (2012) Hakobyan, A. A., Adibekyan, V. Z., Aramyan, L. S., et al. 2012, A&A, 544, A81
- Hau et al. (1995) Hau, G. K. T., Ferguson, H. C., Lahav, O., & Lynden-Bell, D. 1995, MNRAS, 277, 125
- Healey et al. (2008) Healey, S. E., Romani, R. W., Cotter, G., et al. 2008, ApJS, 175, 97
- Hiroi et al. (2013) Hiroi, K., Ueda, Y., Hayashida, M., et al. 2013, ApJS, 207, 36
- Huchra et al. (2012) Huchra, J. P., Macri, L. M., Masters, K. L., et al. 2012, ApJS, 199, 26
- Jones et al. (2009) Jones, D. H., Read, M. A., Saunders, W., et al. 2009, MNRAS, 399, 683
- Karachentseva et al. (2010) Karachentseva, V. E., Mitronova, S. N., Melnyk, O. V., & Karachentsev, I. D. 2010, Astrophysical Bulletin, 65, 1
- Karasev et al. (2012) Karasev, D. I., Lutovinov, A. A., Revnivtsev, M. G., & Krivonos, R. A. 2012, Astronomy Letters, 38, 629
- Koss et al. (2013) Koss, M., Mushotzky, R., Baumgartner, W., et al. 2013, ApJ, 765, L26
- Koss et al. (2012) Koss, M., Mushotzky, R., Treister, E., et al. 2012, ApJ, 746, L22
- Koss et al. (2017) Koss, M., Trakhtenbrot, B., Ricci, C., et al. 2017, ArXiv e-prints, arXiv:1707.08123 [astro-ph.HE]
- Koss et al. (2016) Koss, M. J., Assef, R., Baloković, M., et al. 2016, ApJ, 825, 85
- Krivonos et al. (2010) Krivonos, R., Tsygankov, S., Revnivtsev, M., et al. 2010, A&A, 523, A61
- Kuraszkiewicz et al. (2009) Kuraszkiewicz, J., Wilkes, B. J., Schmidt, G., et al. 2009, ApJ, 692, 1143
- Lamperti et al. (2017) Lamperti, I., Koss, M., Trakhtenbrot, B., et al. 2017, MNRAS, 467, 540
- Landi et al. (2017) Landi, R., Bassani, L., Bazzano, A., et al. 2017, ArXiv e-prints, arXiv:1704.03872 [astro-ph.HE]
- Levine et al. (1984) Levine, A. M., Lang, F. L., Lewin, W. H. G., et al. 1984, ApJS, 54, 581
- Lien et al. (2016) Lien, A., Sakamoto, T., Barthelmy, S. D., et al. 2016, ApJ, 829, 7
- Loveday (1996) Loveday, J. 1996, MNRAS, 278, 1025
- Mahony et al. (2010) Mahony, E. K., Croom, S. M., Boyle, B. J., et al. 2010, MNRAS, 401, 1151
- Mahony et al. (2011) Mahony, E. K., Sadler, E. M., Croom, S. M., et al. 2011, MNRAS, 417, 2651
- Maiorano et al. (2011) Maiorano, E., Landi, R., Stephen, J. B., et al. 2011, MNRAS, 416, 531
- Makarov et al. (2014) Makarov, D., Prugniel, P., Terekhova, N., Courtois, H., & Vauglin, I. 2014, A&A, 570, A13
- Malizia et al. (2012) Malizia, A., Bassani, L., Bazzano, A., et al. 2012, MNRAS, 426, 1750
- Malizia et al. (2016) Malizia, A., Landi, R., Molina, M., et al. 2016, MNRAS, 460, 19
- Markwardt et al. (2005) Markwardt, C. B., Tueller, J., Skinner, G. K., et al. 2005, ApJ, 633, L77
- Maselli et al. (2013) Maselli, A., Massaro, F., Cusumano, G., et al. 2013, ApJS, 206, 17
- Massaro et al. (2009) Massaro, E., Giommi, P., Leto, C., et al. 2009, A&A, 495, 691
- Massaro et al. (2012) Massaro, F., Paggi, A., D’Abrusco, R., & Tosti, G. 2012, ApJ, 750, L35
- Meegan et al. (2009) Meegan, C., Lichti, G., Bhat, P. N., et al. 2009, ApJ, 702, 791
- Meléndez et al. (2014) Meléndez, M., Mushotzky, R. F., Shimizu, T. T., Barger, A. J., & Cowie, L. L. 2014, ApJ, 794, 152
- Molina et al. (2012) Molina, M., Landi, R., Bassani, L., et al. 2012, The Astronomer’s Telegram, 4250
- Momcheva et al. (2015) Momcheva, I. G., Williams, K. A., Cool, R. J., Keeton, C. R., & Zabludoff, A. I. 2015, ApJS, 219, 29
- Oh et al. (2011) Oh, K., Sarzi, M., Schawinski, K., & Yi, S. K. 2011, ApJS, 195, 13
- Oh et al. (2015) Oh, K., Yi, S. K., Schawinski, K., et al. 2015, ApJS, 219, 1
- Oh et al. (2017) Oh, K., Schawinski, K., Koss, M., et al. 2017, MNRAS, 464, 1466
- Parisi et al. (2014) Parisi, P., Masetti, N., Rojas, A. F., et al. 2014, A&A, 561, A67
- Paturel et al. (2003) Paturel, G., Petit, C., Prugniel, P., et al. 2003, A&A, 412, 45
- Raimann et al. (2005) Raimann, D., Storchi-Bergmann, T., Quintana, H., Hunstead, R., & Wisotzki, L. 2005, MNRAS, 364, 1239
- Ratti et al. (2010) Ratti, E. M., Bassa, C. G., Torres, M. A. P., et al. 2010, MNRAS, 408, 1866
- Ricci et al. (2015) Ricci, C., Ueda, Y., Koss, M. J., et al. 2015, ApJ, 815, L13
- Ricci et al. (2017a) Ricci, C., Trakhtenbrot, B., Koss, M. J., et al. 2017a, ArXiv e-prints, arXiv:1709.03989 [astro-ph.HE]
- Ricci et al. (2017b) —. 2017b, Nature, 549, 488
- Rojas et al. (2017) Rojas, A. F., Masetti, N., Minniti, D., et al. 2017, A&A, 602, A124
- Roman et al. (1996) Roman, A. T., Nakanishi, K., Tomita, A., & Saito, M. 1996, PASJ, 48, 679
- Roming et al. (2005) Roming, P. W. A., Kennedy, T. E., Mason, K. O., et al. 2005, Space Sci. Rev., 120, 95
- Rousseau et al. (2000) Rousseau, J., Paturel, G., Vauglin, I., et al. 2000, A&A, 363, 62
- Sakamoto et al. (2008) Sakamoto, T., Barthelmy, S. D., Barbier, L., et al. 2008, ApJS, 175, 179
- Sakamoto et al. (2011) Sakamoto, T., Barthelmy, S. D., Baumgartner, W. H., et al. 2011, ApJS, 195, 2
- Skrutskie et al. (2006) Skrutskie, M. F., Cutri, R. M., Stiening, R., et al. 2006, AJ, 131, 1163
- Straal et al. (2016) Straal, S. M., Gabányi, K. É., van Leeuwen, J., et al. 2016, ApJ, 822, 117
- Sweet et al. (2014) Sweet, S. M., Drinkwater, M. J., Meurer, G., et al. 2014, ApJ, 782, 35
- Tomsick et al. (2012) Tomsick, J. A., Bodaghee, A., Chaty, S., et al. 2012, ApJ, 754, 145
- Tomsick et al. (2009) Tomsick, J. A., Chaty, S., Rodriguez, J., Walter, R., & Kaaret, P. 2009, ApJ, 701, 811
- Tomsick et al. (2016) Tomsick, J. A., Krivonos, R., Wang, Q., et al. 2016, ApJ, 816, 38
- Trakhtenbrot et al. (2017) Trakhtenbrot, B., Ricci, C., Koss, M. J., et al. 2017, MNRAS, 470, 800
- Truemper (1982) Truemper, J. 1982, Advances in Space Research, 2, 241
- Tueller et al. (2008) Tueller, J., Mushotzky, R. F., Barthelmy, S., et al. 2008, ApJ, 681, 113
- Tueller et al. (2010) Tueller, J., Baumgartner, W. H., Markwardt, C. B., et al. 2010, ApJS, 186, 378
- Tzanavaris et al. (2014) Tzanavaris, P., Gallagher, S. C., Hornschemeier, A. E., et al. 2014, ApJS, 212, 9
- Ubertini et al. (2003) Ubertini, P., Lebrun, F., Di Cocco, G., et al. 2003, A&A, 411, L131
- Uzpen et al. (2007) Uzpen, B., Kobulnicky, H. A., Monson, A. J., et al. 2007, ApJ, 658, 1264
- Vasudevan et al. (2013) Vasudevan, R. V., Brandt, W. N., Mushotzky, R. F., et al. 2013, ApJ, 763, 111
- Véron-Cetty & Véron (2001) Véron-Cetty, M.-P., & Véron, P. 2001, A&A, 374, 92
- Véron-Cetty & Véron (2010) —. 2010, A&A, 518, A10
- Warwick et al. (2012) Warwick, R. S., Saxton, R. D., & Read, A. M. 2012, A&A, 548, A99
- Wilson-Hodge et al. (2011) Wilson-Hodge, C. A., Cherry, M. L., Case, G. L., et al. 2011, ApJ, 727, L40
- Winkler et al. (2003) Winkler, C., Courvoisier, T. J.-L., Di Cocco, G., et al. 2003, A&A, 411, L1
- Xiong et al. (2015) Xiong, D., Zhang, X., Bai, J., & Zhang, H. 2015, MNRAS, 450, 3568