A closer look at the quadruply lensed quasar PSOJ0147: spectroscopic redshifts and microlensing effect
Abstract
I present timely spectroscopic follow-up of the newly discovered, quadruply lensed quasar PSOJ0147 from the Pan-STARRS 1 survey. The newly acquired optical spectra with GMOS onboard the Gemini north telescope allow us to pin down the redshifts of both the foreground lensing galaxy and the background lensed quasar to be z=0.572 and 2.341, providing firm basis for cosmography with future high cadence photometric monitoring. I also inspect difference spectra from two of the quasar images, revealing the microlensing effect. Long-term spectroscopic follow-ups will shed lights on the structure of the AGN and its environment.
keywords:
gravitational lensing: strong – quasars: general – cosmology: observation1 Introduction
In the context of precision cosmology, determine local value of H0 to percent level and compare it with CMB results provide tremendous leverage on the dark energy, neutrino physics, and the geometry of the Universe. Taking advantage of the distance ladder, the SH0ES team obtained a local measurement of H0 to 2.4% (Riess et al., 2016) that is in tension (at 3.4 level) with the Planck CMB results. Before claiming such tension is due to systematics in the Planck measurement, or hints to new physics, it is important to have independent local H0 measurements with comparable precision.
In this regard, the gravitational lensing time-delay method is an ideal alternative. This is because in strong lensing, lights from a multiply images source will go through different paths (geodesics). Since light travel times (or time-delays) differ proportionally to the space-time curvature, we can thus estimate the H0. Refsdal (1964) originally suggested to use standard candles such as supernovae to measure the time-delay. Supernovae, especially SNe Ia, have several advantages in time-delay measurement (see e.g. Lee, 2017). First of all, SNe Ia have a distinct light curve shape, so we can measure the time-delay accurately if they are discovered and followed-up well before the light maximum. Secondly, from the empirical light curve template, we know the intrinsic brightness of the SNe, which provides the magnification factor that breaks the mass-sheet degeneracy and yields a direct measurement of H0 (Oguri & Kawano, 2003). However, due to the lack of all-sky transient surveys, the first multiply-lensed SN Ia, iPTF16geu, was only reported very recently (Goobar et al., 2017). The discovery of iPTF16geu demonstrated that it is very difficult to establish the lensing nature before the supernova light maximum, making it difficult to measure time-delay. To make it worse, lensed SNe Ia will also suffer from microlensing effects (More et al., 2017), further hampers accurate determination of the time delay. In this regard, instead of SNe Ia, time-delay measurements were carried out with quasars as background source. For example, the most recent time-delay measurements from the H0LiCOW team (Suyu et al., 2017) demonstrated that it is possible to measure time-delays with 3 multiply-lensed quasars, enabling an H0 estimate at 3.8% level (Bonvin et al., 2017). This is possible because they also constrained the mass-sheet effect with spectroscopic observations (Rusu et al., 2017), thus were able to break the constrain the effect of external masses along the line of sight.
While the current time-delay method provides an consistent H0 estimate as the distance ladder method, we still need to obtain H0 to 1% level, both to understand the tension with the CMB results from the Planck satellite, as well as to shed lights on the dark energy. However, at present there are only a handful of suitable multiply-lensed systems, hence we need to increase the sample of suitable lensed quasars. Recently, Berghea et al. (2017) have identified a new quadruply lensed quasar candidates from the Pan-STARRS archive data. This system is of particular interests because the four lensed quasar images are bright and provide a potentially suitable case for accurate time-delay measurement. This is especially the case when we consider to adopt the new high-cadence monitoring method proposed by Courbin et al. (2017).
In this work I present timely follow-up spectra of this new candidate, with the aim to provide accurate redshifts of both the foreground lensing galaxy and the background quasar for cosmography. This paper is organized as follows: the observation is documented in section 2. The analysis and results are presented in section 3. I give the conclusion in section 4.
2 Observation
PSOJ0147 was first reported by Berghea et al. (2017), but was invisible for immediate follow-up at that time, and Berghea et al. (2017) only derived the redshifts of the foreground lens and the background quasar photometrically.
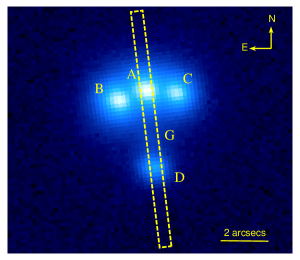
While the lensed images are rather bright, with i=15.40-17.74 mag, the foreground lens is rather faint, with i=19.5 mag. Though Rubin et al. (2017) carried out spectroscopic observations of the lensed quasars with the Keck Cosmic Web Imager (KWCI) onboard the Keck II telescope, they only obtained a total integration time of 1200 seconds, not deep enough to detect the foreground lensing galaxy. Further more, Rubin et al. (2017) only covered the blue side of the optical spectrum, hence their redshift estimate of z=2.377 is heavily influenced by the BAL feature. Indeed, broader wavelength coverage from the 2.5m Nordic Optical Telescope (Lee, 2017) provides more accurate redshift estimate using the cleaner forbidden line [C III], results in a smaller quasar redshift at z=2.3410.001. However, neither Rubin et al. (2017) nor Lee (2017) were able to detect the foreground lens spectroscopically. In this regard, I thus made use of the fast turnaround program of the 8-m Gemini North Telescope at Maunakea, with its Gemini Multi Object Spectrograph (GMOS-N). To reveal the spectral feature of the faint foreground lensing galaxy, I obtain 4 1200-sec exposures with 0.5-arcsec slit to cover the foreground lensing galaxy, as well as the brightest and faintest quasar image (see Fig. 1). The observations were carried out with the B600 grating to cover a wide wavelength range in the optical. Given the photometric redshift of the foreground lens at z=0.57, I expect to cover Ca H and K, as well as the G-band absorption features. In addition, with the background quasar at z=2.341, I expect to cover the [C III] 1908.734 Angstrom forbidden line, to verify the redshift of the quasar as reported by Lee (2017).
The observations were carried out on September 2nd, 2017 with GMOS-N mounted on Gemini north telescope (program ID: GN-2017B-FT-4). To avoid bad pixels and remove cosmic rays, the observations were performed using an A-B-B-A sequence, with a 1 arcsec dithering. We took 1200-sec exposures at each dithering position, resulting in a total integration time of 80 minutes.
Data reductions were carried out in a standard fashion using IRAF111IRAF is distributed by the National Optical Astronomy Observatory, which is operated by the Association of Universities for Research in Astronomy (AURA) under a cooperative agreement with the National Science Foundation. and Gemini IRAF package222http://www.gemini.edu/node/11823, including subtraction of bias, flat fielding, calibrating the wavelength using a Thorium-Argon lamp, and calibrating the flux using a spectroscopic standard star EG 131.
3 Results
.
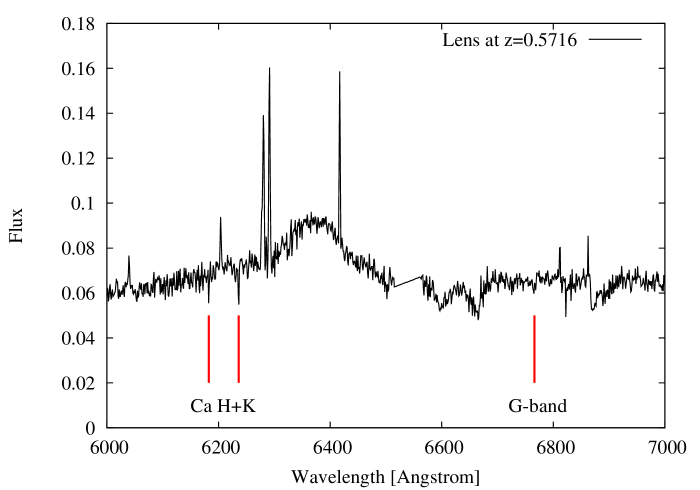
After data reduction, I can see traces of absorption lines from the foreground lensing galaxy, e.g. Calcium H and K () and G-band (). The reduced lens spectrum, as well as these absorption features, as shown in Fig. 2. From these absorption features, I am able to obtain the lens redshift; I use the splot task in IRAF, and perform a Gaussian fitting to the Ca H+K and G-band features. After measuring the Gaussian centroids from each images I use their mean to determine the redshift, and the standard deviation as the redshift uncertainty, resulting in a redshift z=0.57160.0004. The values of the Gaussian centroid from each of the absorption features are shown in Table 1.
| Lines | [Angstrom] | z |
|---|---|---|
| Ca H | 6182.68 | 0.5716 |
| Ca K | 6236.02 | 0.5712 |
| G-band | 6766.1 | 0.5720 |
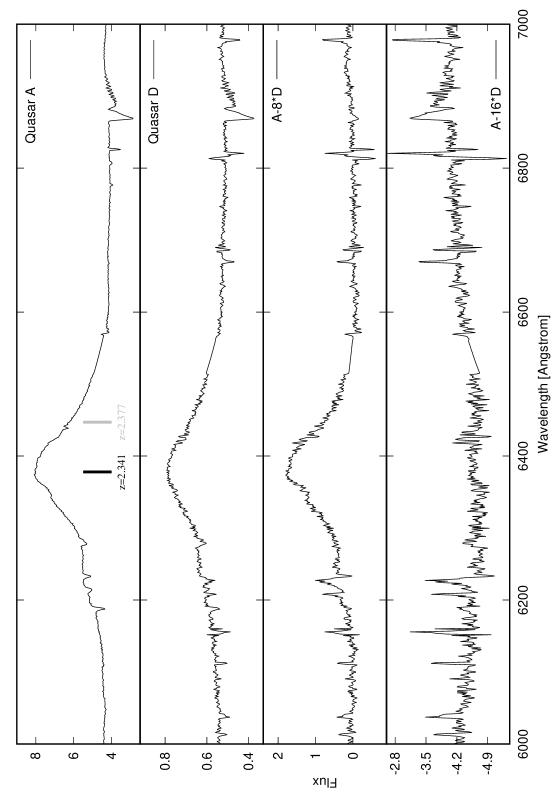
In addition to the lens, I also obtained spectra of the brightest and the faintest quasar images (A and D). After reduction, I clearly see the [C III] forbidden emission line, as shown in Fig. 3. As [C III] is clean from BAL, it is ideal to be used to estimate redshifts. Indeed, Lee (2017) reported a quasar redshift of 2.3410.001, contrasting to earlier results from Rubin et al. (2017). As discussed in Lee (2017), the differences may originate from the shorter wavelength coverage, as well as contaminations from BALs in Rubin et al. (2017). Here with the new Gemini/GMOS-N spectra, I again confirm [C III] of the background quasar peaks at 6380 Angstrom, suggesting the background quasar is at z=2.341, in agreement with the results from Lee (2017) and smaller than the results from Rubin et al. (2017).
With the spectra from quasar image A and D in hand, I can also investigate the microlensing effect spectroscopically using difference spectrum. This has been done, for example, Wisotzki et al. (1993) and Lidman et al. (2000) have investigated the difference spectra of the doubly lensed system HE1104-1805, and revealed the microlensing effects from spectra. Furthermore, Sluse et al. (2012) presented spectroscopic microlensing for 17 lensed quasars. If microlensing affects the spectra, there will exist a factor where spectrum A - times spectrum D will cancel out the continuum and I can only see the emission line. In addition, there will also exist another value where the emission lines will be canceled out and leaves only blue residual continuum since microlensing affects most the central parts of the accretion disk. By experimenting different values of , with = 8 I am able to null the continuum and leave only the emission features. With = 16, I can cancel out the emission feature, leaving a blue residual continuum. The difference spectra are shown in Fig. 2 as well. These suggest we can see trace of the microlensing effects in PSOJ0147. The continuum is more susceptible to microlensing effect. Taking the flux ratio between the continuum of image A and D, I obtain a magnitude difference of 2.26 mag, close to the value of the observed quasar image magnitudes relative to image A, in particular r-band around 2.3 mag for image D vs. image A as shown in Fig. 7 of Berghea et al. (2017). On the other hand, the emission line flux ratio of image A and D suggests a magnitude difference of 3.01 mag, in the same direction (larger magnitude difference) as predicted by the lens modeling of Berghea et al. (2017).
4 Conclusions
PSOJ0147 is the first quadruply lensed quasar candidates identified in the Pan-STARRS archive data. In this paper, I present follow-up spectra of PSOJ0147 using GMOS-N onboard the Gemini North Telescope. The results can be summarized as follows:
-
1.
I provide the first spectrum of the foreground lensing galaxy. As the foreground lensing galaxy is very faint (i=19.5 mag), previous spectroscopic follow-up by Rubin et al. (2017) could not reveal the spectral signature of the foreground lens. With the power of the 8-m Gemini telescopes, and with a total integration time of 80 minutes, I was able to obtain spectrum of the foreground lensing galaxy for the first time. Using Ca H+K and G-band, I was able to determine the lens redshift to be z=0.5716, close to the photo-z prediction by Berghea et al. (2017).
-
2.
I confirm the background quasar at a redshift of z=2.341 For cosmography studies, it is crucial to obtain accurate spectroscopic redshifts of both the foreground lens and the background quasar. Contrasting to the results of Lee (2017), previous study by Rubin et al. (2017) reported a larger redshift of the background quasar at z=2.377, which is likely to be affected by the BAL nature of the background quasar, and the narrow wavelength coverage (up to C IV at observers frame) in Rubin et al. (2017). Here with the prominent [C III] emission line peaks at 6380 Angstrom, I confirm the background quasar at z=2.341.
-
3.
I demonstrate the microlensing effect in difference spectra. As microlensing affects most the central parts of the accretion disk, the continuum and the emission component of the background quasar will experience different lensing factor. I investigate the difference spectra between quasar image A and D, and show that with A - 8D we can null the continuum, while with A - 16D we can cancel out the emission line feature. Further epochs of spectroscopic monitoring will be crucial to study the environment around AGN of the background quasar.
Acknowledgements
I am indebted to the referee, whose comments greatly improved the manuscript.
Based on observations (GN-2017B-FT-4) obtained at the Gemini Observatory and processed using the Gemini IRAF package, which is operated by the Association of Universities for Research in Astronomy, Inc., under a cooperative agreement with the NSF on behalf of the Gemini partnership: the National Science Foundation (United States), the National Research Council (Canada), CONICYT (Chile), Ministerio de Ciencia, Tecnología e Innovación Productiva (Argentina), and Ministério da Ciência, Tecnologia e Inovação (Brazil).
The author wish to recognize and acknowledge the very significant cultural role and reverence that the summit of Maunakea has always had within the indigenous Hawaiian community. I am most fortunate to have the opportunity to conduct observations from this mountain.
References
- Berghea et al. (2017) Berghea, C. T., Nelson, G. J., Rusu, C. E., Keeton, C. R., & Dudik, R. P. 2017, ApJ, 844, 90
- Bonvin et al. (2017) Bonvin, V., Courbin, F., Suyu, S. H., et al. 2017, MNRAS, 465, 4914
- Chambers et al. (2016) Chambers, K. C., Magnier, E. A., Metcalfe, N., et al. 2016, arXiv:1612.05560
- Courbin et al. (2017) Courbin, F., Bonvin, V., Buckley-Geer, E., et al. 2017, arXiv:1706.09424
- Goobar et al. (2017) Goobar, A., Amanullah, R., Kulkarni, S. R., et al. 2017, Science, 356, 291
- Lee (2017) Lee, C.-H. 2017, Nature Astronomy, 1, 0155
- Lee (2017) Lee, C.-H. 2017, A&A, 605, L8
- Lidman et al. (2000) Lidman, C., Courbin, F., Kneib, J.-P., et al. 2000, A&A, 364, L62
- Lin et al. (2017) Lin, H., Buckley-Geer, E., Agnello, A., et al. 2017, ApJ, 838, L15
- More et al. (2017) More, A., Suyu, S. H., Oguri, M., More, S., & Lee, C.-H. 2017, ApJ, 835, L25
- Oguri & Kawano (2003) Oguri, M., & Kawano, Y. 2003, MNRAS, 338, L25
- Refsdal (1964) Refsdal, S. 1964, MNRAS, 128, 307
- Riess et al. (2016) Riess, A. G., Macri, L. M., Hoffmann, S. L., et al. 2016, ApJ, 826, 56
- Rubin et al. (2017) Rubin, K. H. R., O’Meara, J. M., Cooksey, K. L., et al. 2017, arXiv:1707.05873
- Rusu et al. (2017) Rusu, C. E., Fassnacht, C. D., Sluse, D., et al. 2017, MNRAS, 467, 4220
- Sluse et al. (2012) Sluse, D., Hutsemékers, D., Courbin, F., Meylan, G., & Wambsganss, J. 2012, A&A, 544, A62
- Suyu et al. (2017) Suyu, S. H., Bonvin, V., Courbin, F., et al. 2017, MNRAS, 468, 2590
- Wisotzki et al. (1993) Wisotzki, L., Koehler, T., Kayser, R., & Reimers, D. 1993, A&A, 278, L15