Bulk Properties of the Matter Produced at Energies of the Beam Energy Scan Program
Abstract
Recent STAR data on the bulk observables in the energy range of the Beam-Energy Scan Program at the Relativistic Heavy-Ion Collider are analyzed within the model of the three-fluid dynamics (3FD). The simulations are performed with different equations of state (EoS). The purely hadronic EoS fails to reproduce the data. A good, though imperfect, overall reproduction of the data is found within the deconfinement scenarios. The crossover EoS turns out to be slightly preferable. For this reproduction a fairly strong baryon stopping in the quark-gluon phase is required. The 3FD model does not need two separate freeze-outs (i.e. kinetic and chemical ones) to describe the STAR data. A unified freeze-out is applied at all energies.
pacs:
25.75.-q, 25.75.Nq, 24.10.NzI Introduction
Searching for the critical point and phase boundary in the QCD phase diagram is the main motivation for the Beam-Energy Scan (BES) Program at the Relativistic Heavy-Ion Collider (RHIC). Recently, experimental results from the systematic study of bulk properties of the matter produced in Au+Au collisions at BES RHIC energies were published by the STAR collaboration Adamczyk:2017iwn . These bulk properties can hardly indicate the presence or absence of the critical point, because the latter are expected to be manifested in enhanced fluctuations in multiplicity distributions of conserved quantities Stephanov:2008qz ; Karsch:2010ck . The systematic study of these bulk properties may reveal the evolution and change in behavior of the system formed in heavy-ion collisions as a function of collision energy. In particular, these bulk observables may indicate if the quark confinement and chiral symmetry breaking at finite baryon densities occur simultaneously or they are separated in the phase diagram as argued in Ref. Suganuma:2017syi .
In the present paper the bulk observables in the BES-RHIC energy range are analyzed within the model of three-fluid dynamics (3FD) 3FD . The 3FD model is quite successful in reproduction of the major part of bulk observables at energies of the Alternating Gradient Synchrotron (AGS) at BNL and the Super Proton Synchrotron (SPS) at CERN: the baryon stopping Ivanov:2013wha ; Ivanov:2012bh , yields of different hadrons, their rapidity Ivanov:2013yqa and transverse momentum Ivanov:2013yla distributions. It is also applicable to the description of the elliptic Ivanov:2014zqa and directed Konchakovski:2014gda ; Ivanov:2016sqy flow in the AGS-SPS-BES/RHIC energy range. Predictions of the 3FD model for some of the bulk observables at BES-RHIC energies have been already reported in Refs. Ivanov:2012bh ; Ivanov:2013yla ; Ivanov:2016sqy and fragmentarily compared with preliminary STAR data. The present paper is devoted to the systematic analysis of the final STAR data on the bulk observables.
II 3FD model
A specific feature of high-energy heavy-ion collisions is a finite stopping power resulting in a counterstreaming regime of baryon-rich matter of the projectile and target rather then their instantaneous stopping. Within the 3FD description 3FD this generally nonequilibrium regime of the baryon-rich matter is modeled by two interpenetrating baryon-rich fluids initially associated with constituent nucleons of the projectile (p) and target (t) nuclei. In addition, newly produced particles, predominantly populating the midrapidity region, are associated with a fireball (f) fluid. Each of these fluids is governed by conventional hydrodynamic equations coupled by friction terms in the right-hand sides of the Euler equations. The hydrodynamic equations do not include viscosity because the dissipation is provided by the friction terms. These friction terms describe energy–momentum loss of the baryon-rich fluids. A part of this loss is transformed into thermal excitation of these fluids, while another part gives rise to particle production into the fireball fluid.
Friction forces between fluids are the key constituents of the model that determine dynamics of the nuclear collision. The friction forces in the hadronic phase were estimated in Ref. Sat90 . There are no theoretical estimates of the friction in the quark-gluon phase (QGP) so far. Therefore, the friction in the QGP is purely phenomenological. It was fitted to reproduce the baryon stopping at high incident energies within the deconfinement scenarios as described in Ref. Ivanov:2013wha in detail.
The physical input of the present 3FD calculations is described in Ref. Ivanov:2013wha . The simulations in Ivanov:2013wha ; Ivanov:2012bh ; Ivanov:2013yqa ; Ivanov:2013yla ; Ivanov:2014zqa ; Konchakovski:2014gda ; Ivanov:2016sqy were performed with different equations of state (EoS’s)—a purely hadronic EoS gasEOS and two versions of the EoS involving the deconfinement transition Toneev06 , i.e. a first-order phase transition (1st-order-tr.) and a smooth crossover one. It was demonstrated that the purely hadronic EoS fails to reproduce data at high collision energies ( 5 GeV). Therefore, in the present paper we demonstrate results with only these deconfinement EoS’s as the most successful in reproduction of various bulk observables at high collision energies and only occasionally present results of the purely hadronic EoS.
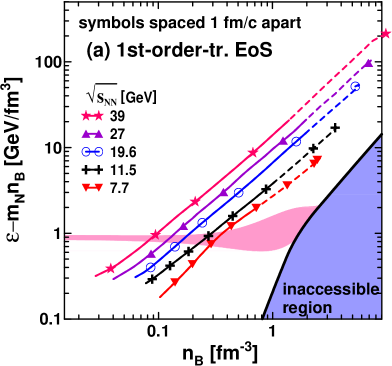
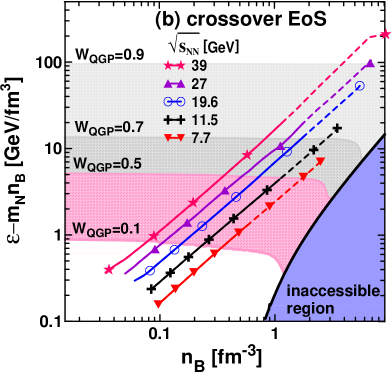
Figure 1 illustrates the dynamics of nuclear collisions at BES-RHIC energies. Similarly to Ref. Randrup07 , the figure displays dynamical trajectories of the matter in the central box placed around the origin in the frame of equal velocities of colliding nuclei: 2 fm, 2 fm and fm, where is the Lorentz factor associated with the initial nuclear motion in the c.m. frame. Initially, the colliding nuclei are placed symmetrically with respect to the origin ; is the direction of the beam. The size of the box was chosen to be large enough that the amount of matter in it can be representative to conclude on the onset of deconfinement and to be small enough to consider the matter in it as a homogeneous medium. Nevertheless, the matter in the box still amounts to a minor part of the total matter of colliding nuclei.
Only expansion stages of the evolution are displayed. Evolution proceeds from the top point of the trajectory downwards. Symbols mark the time intervals along the trajectory. Subtraction of the term from the energy density is done for the sake of suitable representation of the plot. The - representation is chosen because these densities are dynamical quantities and, therefore, are suitable to compare calculations with different EoS’s. At a given density , the zero-temperature compressional energy, , provides a lower bound on the energy density , so the accessible region is correspondingly limited.
The non-equilibrium stage of the expansion is displayed by dashed lines in Fig. 1. The criterion of the thermalization is equality of longitudinal () and transverse () pressures111 Note that the spatial components of the collective four-velocity of the composed matter in the considered central box are zero due to symmetry reasons. in the box with accuracy better than 10%. Here
| (1) |
is the energy–momentum tensor of the composed matter being the sum of conventional hydrodynamical energy–momentum tensors of separate fluids. In similar figures of Ref. Ivanov:2013wha , the onset of equilibration was indicated at earlier stages. The reason is that the condition indeed is first reached at earlier times as compared with those indicated in Fig. 1. However, after that the difference between and remains at the 10% level for some time or even slightly exceeds this 10% level. Therefore, in the present Fig. 1 we mark the thermalization instant as that after which the difference between and rapidly drops below the 10% level.
The trajectories for the first-order-transition and crossover EoS’s are very similar, as seen from Fig. 1. Note that this similarity is not due to similarity of these two EoS’s. This similarity takes place because of the friction forces in the QGP phase that were independently fitted for each EoS Ivanov:2013wha in order to reproduce observables in the midrapidity region.
As seen in Fig. 1, the equilibration in the central region is achieved at rather high baryon densities even at high collision energies. This in contrast to conclusions made in Refs. Bialas:2016epd ; Shen:2017bsr where formation of the initial state for the hydrodynamic evolution was studied. E.g., in Ref. Bialas:2016epd it was even concluded that the stopped nucleons from the target and the projectile end up separated from each other by the distance increasing with the collision energy. For 6 or 10 GeV the latter implies that the created system is not in thermal and chemical equilibrium, and the net-baryon density reached is likely not much higher than that already present in the colliding nuclei Bialas:2016epd .
The equilibration in the central region in collisions at energies up to the top SPS one was also analyzed in Bravina:2008ra within the Quark-Gluon String Model (QGSM) and the model of the Ultrarelativistic Quantum Molecular Dynamics (UrQMD). The equilibration time in a small box (0.5 fm 0.5 fm 0.5 fm) within the QGSM and UrQMD Bravina:2008ra is very similar to the 3FD time at the energy of 7.7 GeV (or 30A GeV in the lab. frame). We do not refer to the results of Ref. Bravina:2008ra in the large box (5 fm 5 fm 5 fm) because this box is too large to consider the matter in it as a homogeneous medium in view of the Lorentz contraction of colliding nuclei. However, at the top SPS energy the QGSM and UrQMD equilibration times are essentially longer than that within the 3FD at the similar energy of 19.6 GeV. Consequently, the higher equilibrium densities are reached within the 3FD simulations. This is the effect of the stronger QGP friction required for reproduction of the SPS data Ivanov:2013wha ; Ivanov:2012bh ; Ivanov:2013yqa ; Ivanov:2013yla . Note that even within the hadronic scenario we had to considerably enhance the hadronic friction 3FD ; Ivanov:2013wha as compared with its microscopic estimate Sat90 in order to reproduce data at the top SPS energy.
In spite of the rather high initial baryon densities in the center region even at high collision energies, cf. Fig. 1, the resulting proton rapidity distributions manifest a dip at the midrapidity Ivanov:2013wha . In fact, there are two ways to achieve the midrapidity dip in the net-baryon rapidity distribution. The first one is high transparency of colliding nuclei as implemented in Refs. Bialas:2016epd ; Shen:2017bsr . An alternative scenario is the purely hydrodynamical 1D expansion of the initially compressed and thermalized thin disk of the baryon-rich matter. In the process of this one-dimensional (1D) expansion the baryon charge is pushed out to peripheral rapidities thus producing a dip at the midrapidity. These two scenarios were tested within the 3FD model when the friction parameters were fitted Ivanov:2013wha at the BES-RHIC energies. It was found that the problem of the first “transparent” scenario is that too many pions are produced. The actual friction of the 3FD model does not result in an immediate stopping of colliding nuclei, as seen from Fig. 1. E.g., in the initial thermalized state at the collision energy of 39 GeV, approximately 30% of the baryon charge is located in “true” fragmentation regions, i.e. in the baryon-rich matter passed through the interaction region, while 70% is located in the central fireball Ivanov:2017xee . Probably, the “transparent” scenario is relevant at the top RHIC and LHC energies.
III Bulk observables
Simulations of Au+Au collisions at energies 7.7, 11.5, 19.6, 27 and 39 GeV were performed at fixed impact parameters (). The correspondence between experimental centrality and the mean impact parameter was taken from Glauber simulations of Ref. Abelev:2008ab . Though Ref. Abelev:2008ab deals with higher collision energies, we implemented the reported correspondence to the BES-RHIC energy range in view of practical energy independence of the results deduced in Ref. Abelev:2008ab . If it is not stated otherwise, proton and antiproton observables include contributions from weak decays, while pion and kaon observables do not. This is in agreement with the STAR measurements Adamczyk:2017iwn .
III.1 Transverse-Momentum Spectra
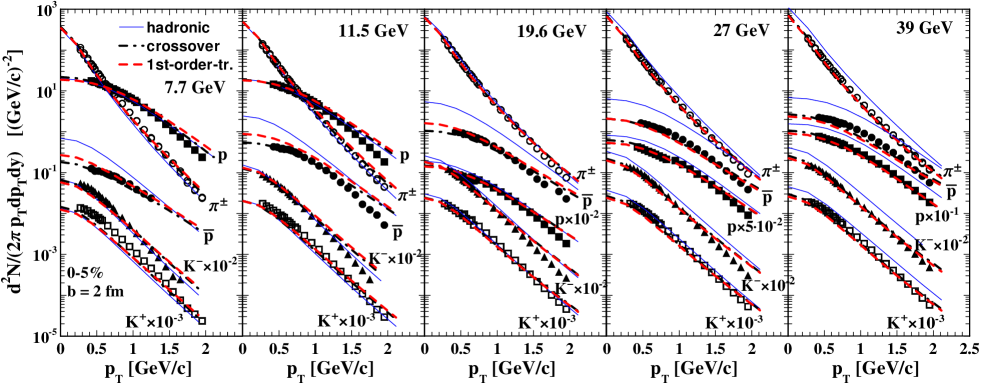
Figure 2 demonstrates transverse-momentum spectra at the midrapidity of various particles produced in central ( fm) Au+Au collisions at 7.7 – 39 GeV predicted by the 3FD model with three considered EoS’s. Experimental STAR data (0-5% centrality) are from Ref. Adamczyk:2017iwn . As seen, the hadronic scenario fails to describe the data. It fails first only for antiprotons at lower energies and then for all hadrons at higher collision energies.
The first-order-transition and crossover scenarios are quite successful in the reproduction of the data Adamczyk:2017iwn and give very similar results at all considered energies. However, there are exceptions. The spectra are underestimated at 7.7 GeV and less spectacular at 11.5 GeV. This is related to the failure to reproduce the horn in the ratio, discussed below.
A common feature of the 3FD results is overestimation of high- tails of the spectra. This overestimation happens earlier (i.e. at lower ) for rare probes ( and ). This is a consequence of the 3FD description being based on grand-canonical statistics which requires large multiplicities to be valid. A lack of exact conservations (of the baryon number and strangeness) in the grand-canonical ensemble results in overestimation of data for rare probes. Even abundant hadronic probes become rare at high momenta. Therefore, their treatment on the basis of the grand-canonical ensemble results in overestimation of their yields. Moreover, as a hadron by itself becomes more rare, the high- tail of the spectrum is more strongly suppressed due to restrictions of the canonical ensemble.
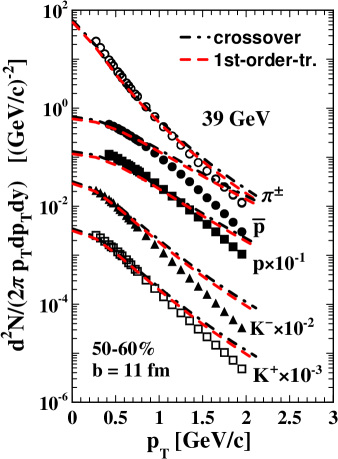
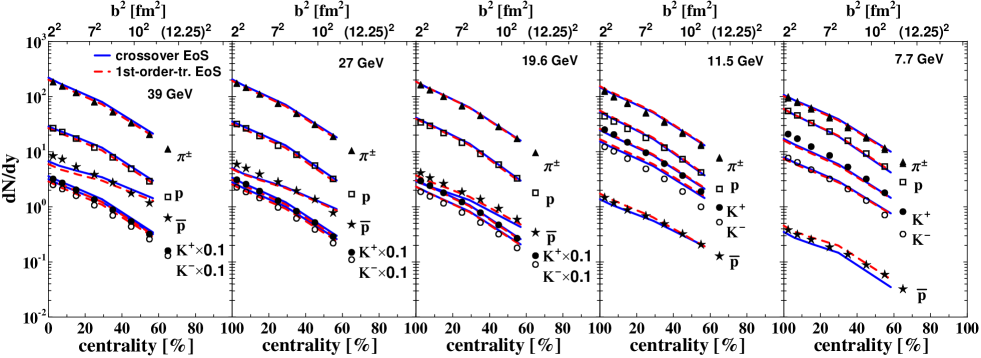
Figure 3 confirms our expectations on the applicability of the 3FD model. In peripheral collisions the total number of participants becomes smaller. Therefore, the applicability of the grand-canonical approximation and hence of the 3FD model worsens. It results in earlier (i.e. at lower ) overestimation of the tails of the spectra. The fact that the 3FD model indeed fails beyond the range of its applicability gives us confidence in the 3FD results in the range of their applicability.
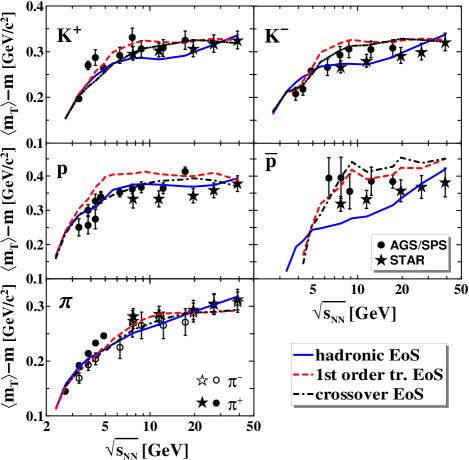
III.2 Mean Transverse Mass
The collision-energy dependence of the mean transverse mass is an economical way to present the excitation function of the spectrum. Excitation functions of the average transverse masses () of protons, pions, antiprotons and kaons are presented in Fig. 4. The presented excitation functions are in fact predictions for the BES-STAR data because they were published in Ref. Ivanov:2013yla before the STAR data appeared. In Fig. 4 we just compare the predictions of Ref. Ivanov:2013yla with the recent STAR data Adamczyk:2017iwn . A detailed discussion of the calculated mean transverse masses is also presented in Ref. Ivanov:2013yla .
As seen from Fig. 4 the step-like structure is well reproduced within all scenarios, except for antiprotons within the hadronic scenario. This is a consequence the specific freeze-out implemented within the 3FD model Russkikh:2006aa . The physical pattern behind this freeze-out resembles the process of expansion of a compressed and heated classical fluid into vacuum, mechanisms of which were studied both experimentally and theoretically. The freeze-out is associated with evaporation from the surface of the expanding fluid and sometimes with explosive transformation of the strongly superheated fluid to the gas. This freeze-out procedure results in a step-like excitation function of the effective freeze-out temperature Ivanov:2013yla which in its turn produces this step-like structure in .
Indeed, can be very approximately presented as Mohanty:2003fy
where the inverse slope parameter can be very approximately related to the freeze-out temperature and transverse velocity
The latter relation results from the nonrelativistic limit of the blast-wave model Bondorf78 ; Siemens79 ; Schnedermann:1993ws . As seen, indeed should follow the step-like behavior of if is approximately constant. This is actually the case for all particles and scenarios except for the antiprotons within the hadronic scenario. Antibaryons are dominantly produced from the baryon-free f-fluid. Because of long formation time of the f-fluid within the hadronic scenario Ivanov:2013wha (as compared with those within the deconfinement scenarios) the transverse velocity in the f-fluid is not constant but steadily rises with the collision energy, therefore rises too.
Figure 4 demonstrates that on average the crossover scenario still looks preferable, though the new STAR data are somewhat below those from SPS (for protons and antiprotons). It could seem that the crossover and hadronic scenarios reproduce (or fail to reproduce) the antiproton STAR data to the same extent. However, the slope of the crossover curve is definitely more adequate to the data. In fact, the overestimation of antiproton is expected because of the overestimation high- tails of the spectra discussed above, cf. Fig. 2. The first-order-transition scenario certainly fails for protons in the energy region where onset of deconfinement takes place in this EoS.
III.3 Rapidity Densities
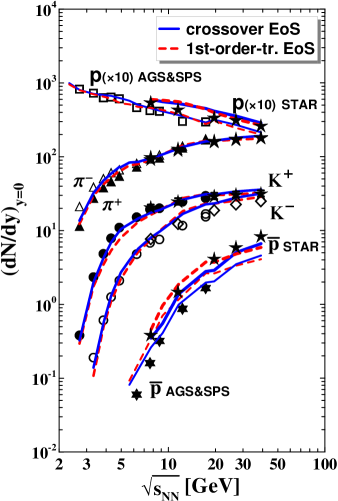
Midrapidity densities of various particles produced in Au+Au collisions at 7.7 – 39 GeV as functions of the centrality predicted by 3FD model are presented in Fig. 5, where they are compared with the recent experimental STAR data Adamczyk:2017iwn . The results of calculations are in good overall agreement with the data except for kaons and antiprotons. Figure 6 presents the midrapidity densities of these various particles produced in central ( 2 fm) Au+Au collisions but in a wider energy range 2.7 – 39 GeV.
The densities of positive kaons are underestimated at 7.7 GeV and mostly in central collisions, as already seen in spectra. This overestimation is not well resolved in Figs. 5 and 6, However, it is clearly visible in the ratio in Fig. 7. The densities are overestimated at 8 GeV, as seen from Fig. 6 and more distinctly from ratio in Fig. 7. As seen from Fig. 2, the soft parts of the -spectra are reasonably well reproduced at all BES RHIC energies. The overestimation observed in Fig. 6 may result from the overestimation of high- tails of spectra, cf. Fig. 2, which is the common problem for all rare probes described within the approximation of the grand-canonical ensemble. However, this explanation is not applicable at 39 GeV when negative and positive kaons are equally abundant and the high- tail of the spectrum is quite well reproduced. Another possible source of this overestimation is extrapolation of the experimental -spectra to a very low -region in order to calculate the midrapidity density. If this experimental extrapolation differs from the 3FD prediction for the low- spectrum, the difference between the experimental and 3FD midrapidity densities can be substantional.
Antiproton density is a delicate issue. Of course, the above discussed problems of the overestimation of high- tails and the extrapolation to the low- region take place for the antiprotons too. At lower collision energies the 3FD results overestimate the data (cf. Fig. 6), as expected within the approximation of the grand-canonical ensemble. However, at higher energies the data are already underestimated in the central collisions (Figs. 5 and 6) while they reasonably well agree with the 3FD results at larger centralities (impact parameters), see Fig. 5. This is already contrary to our expectations. Recently the production of anti-baryons was studied within the Parton-Hadron-String Dynamics (PHSD) transport approach Seifert:2017oyb . It was found that the PHSD results are also far from being perfect in reproduction of the antiproton data. This implies that we still do not well understand the mechanism of the production.
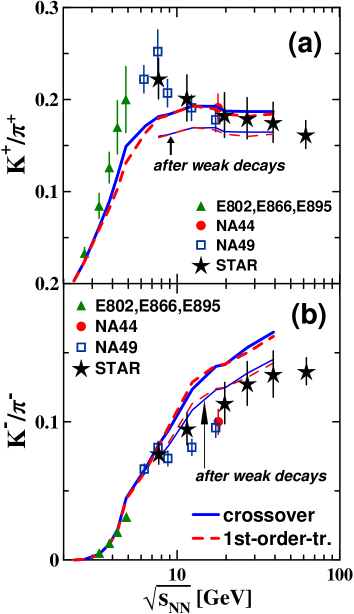
The particle ratios, Fig. 7, allow us to more distinctly see the problems in the description of the particle yields. The upper panel of Fig. 7 demonstrates the ratio with the well-known horn structure. Several statistical models Andronic:2005yp ; Andronic:2008gu ; Bugaev:2013sfa have succeeded in reproducing this experimental trend, but they can provide only a statistical description of the heavy-ion collision process. There were no conclusive interpretations of the horn from dynamical approaches. The 3FD model is not an exception, it does not reproduce the horn anomaly in the ratio Ivanov:2013yqa . Note that only deconfinement transitions are included in the EoS’s tested within the 3FD model. Recently, it was suggested that the chiral phase transition within the PHSD model Palmese:2016rtq results in a semiquantitative description of the horn anomaly. Restoration of the chiral symmetry enhances the strangeness production. It is equally important that this strangeness enhancement survives in the hadronic phase, as demonstrated in Refs. Palmese:2016rtq . Another possible mechanism to explain the “horn” effect was developed in Ref. Dubinin:2016wvt where the horn anomaly was associated with the occurrence of an anomalous mode for mesons composed of quarks with unequal masses in the course of the Mott transition within the PNJL model. It is still unclear if the produced effect survives in the hadronic phase, i.e. till the freeze-out.
The lower panel of Fig. 7 demonstrates the ratio which is overestimated within the 3FD model because of too high predicted yield. In order to demonstrate the effect of the weak decays Figs. 6 and 7 also display results with and without contributions of weak decays at BES-RHIC energies.
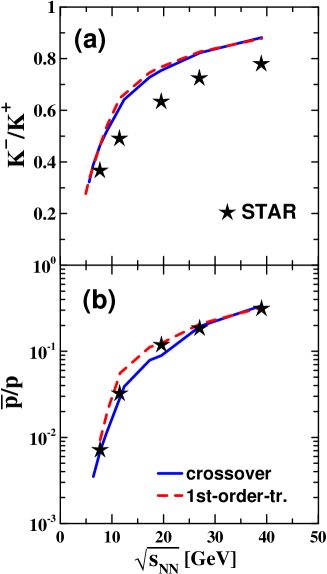
Figure 8 demonstrates comparison of the 3FD results on the and ratios with the corresponding STAR data Adamczyk:2017iwn . The calculated ratio overestimates the data because of the above mentioned excess of at 8 GeV. This is similar to that presented in panel (b) of Fig. 7. The overestimation at 7.7 GeV results from the underestimation of the midrapidity yield that is also clearly manifested in panel (a) of Fig. 7. The reproduction of the ratio [panel (b) of Fig. 8] is quite satisfactory, which is partially the effect of the logarithmic scale of the figure.
IV Summary
Recent STAR data Adamczyk:2017iwn on the bulk observables in the BES-RHIC energy range were analyzed within the 3FD model. The simulations were performed with different equations of state: the purely hadronic EoS gasEOS and two versions of the EoS involving the deconfinement transition Toneev06 , i.e. the first-order phase transition and the smooth crossover one. It was demonstrated that the purely hadronic EoS fails to reproduce the data. Therefore, we focused on the deconfinement EoS’s.
A good overall reproduction of the bulk observables of Ref. Adamczyk:2017iwn is found within the deconfinement scenarios, of course, within the range of applicability of the 3FD model. Note that some of the discussed 3FD results are in fact predictions because they were published Ivanov:2013yqa ; Ivanov:2013yla before the appearance of the recent STAR data Adamczyk:2017iwn . The crossover EoS tunes out to be slightly preferable. For this reproduction a quite strong friction in the QGP is required. This friction results in rather high initially equilibrated baryon densities in the central region even at high collision energies. However, this overall reproduction is not perfect. The main problem is the failure to reproduce the horn anomaly in the ratio. It is very probable that this anomaly is a signature of the chiral phase transition Palmese:2016rtq ; Dubinin:2016wvt which is absent in the present scenarios. It would be instructive to study the effect of the hadronic afterburner at the BES-RHIC energies within the THESEUS event generator Batyuk:2016qmb . The afterburner may, at least partially, solve the problems with and observables. It was found earlier Batyuk:2016qmb that the hadronic afterburner only weakly affects the bulk observables of protons, pions and kaons, though at lower collision energies.
It should be noted that the 3FD model does not need two separate freeze-outs (i.e. kinetic and chemical ones) to describe the BES-RHIC data, as well as the older AGS and SPS data. A unified freeze-out is applied at all energies 3FD ; Russkikh:2006aa . At the freeze-out stage the baryon-rich fluids are already unified while the net-baryon-free fluid still keeps its identity. Thus, the frozen-out system turns out to be kinetically equilibrated to a good extent, because the relative velocities of the baryon-rich and baryon-free fluids are small Ivanov:2017xee . At the same time the chemical equilibrium is absent: two overlapped equilibrated fluids do not provide a chemical equilibrium in the composed system. This way the simultaneous description of spectra and hadron abundances is achieved.
Acknowledgments
This work was carried out using computing resources of the federal collective usage center Complex for simulation and data processing for mega-science facilities at NRC ”Kurchatov Institute”, http://ckp.nrcki.ru/. Y.B.I. was supported by the Russian Science Foundation, Grant No. 17-12-01427. A.A.S. was partially supported by the Ministry of Education and Science of the Russian Federation within the Academic Excellence Project of the NRNU MEPhI under contract No. 02.A03.21.0005.
References
- (1) L. Adamczyk et al. [STAR Collaboration], Phys. Rev. C 96, no. 4, 044904 (2017) [arXiv:1701.07065 [nucl-ex]].
- (2) M. A. Stephanov, Phys. Rev. Lett. 102, 032301 (2009) [arXiv:0809.3450 [hep-ph]].
- (3) F. Karsch and K. Redlich, Phys. Lett. B 695, 136 (2011) [arXiv:1007.2581 [hep-ph]].
- (4) H. Suganuma, T. M. Doi, K. Redlich and C. Sasaki, J. Phys. G 44, 124001 (2017) [arXiv:1709.05981 [hep-lat]].
- (5) Yu. B. Ivanov, V. N. Russkikh, and V.D. Toneev, Phys. Rev. C 73, 044904 (2006) [nucl-th/0503088].
- (6) Yu. B. Ivanov, Phys. Rev. C 87, 064904 (2013) [arXiv:1302.5766 [nucl-th]].
- (7) Yu. B. Ivanov, Phys. Lett. B 721, 123 (2013) [arXiv:1211.2579 [hep-ph]]; Yu. B. Ivanov and D. Blaschke, Phys. Rev. C 92, no. 2, 024916 (2015) [arXiv:1504.03992 [nucl-th]].
- (8) Yu. B. Ivanov, Phys. Rev. C 87, no. 6, 064905 (2013) [arXiv:1304.1638 [nucl-th]].
- (9) Yu. B. Ivanov, Phys. Rev. C 89, no. 2, 024903 (2014) [arXiv:1311.0109 [nucl-th]].
- (10) Yu. B. Ivanov and A. A. Soldatov, Phys. Rev. C 91, no. 2, 024914 (2015) [arXiv:1401.2265 [nucl-th]]; Yu. B. Ivanov, Phys. Lett. B 723, 475 (2013) [arXiv:1304.2307 [nucl-th]].
- (11) V. P. Konchakovski, W. Cassing, Yu. B. Ivanov and V. D. Toneev, Phys. Rev. C 90, no. 1, 014903 (2014) [arXiv:1404.2765 [nucl-th]]; Yu. B. Ivanov and A. A. Soldatov, Phys. Rev. C 91, no. 2, 024915 (2015) [arXiv:1412.1669 [nucl-th]].
- (12) Yu. B. Ivanov and A. A. Soldatov, Eur. Phys. J. A 52, no. 1, 10 (2016) [arXiv:1601.03902 [nucl-th]].
- (13) L. M. Satarov, Sov. J. Nucl. Phys. 52, 264 (1990).
- (14) V. M. Galitsky and I. N. Mishustin, Sov. J. Nucl. Phys. 29, 181 (1979).
- (15) A. S. Khvorostukhin, V. V. Skokov, K. Redlich, and V. D. Toneev, Eur. Phys. J. C48, 531 (2006) [nucl-th/0605069].
- (16) I. C. Arsene, L.V. Bravina, W. Cassing, Yu.B. Ivanov, A. Larionov, J. Randrup, V.N. Russkikh, V.D. Toneev, G. Zeeb, D. Zschiesche, Phys. Rev. C 75, 034902 (2007) [nucl-th/0609042].
- (17) A. Bialas, A. Bzdak and V. Koch, arXiv:1608.07041 [hep-ph].
- (18) C. Shen and B. Schenke, arXiv:1710.00881 [nucl-th].
- (19) L. V. Bravina et al., Phys. Rev. C 78, 014907 (2008) [arXiv:0804.1484 [hep-ph]].
- (20) Y. B. Ivanov and A. A. Soldatov, Phys. Rev. C 97, 021901(R) (2018) [arXiv:1711.03069 [nucl-th]].
- (21) B. I. Abelev et al. [STAR Collaboration], Phys. Rev. C 79, 034909 (2009) [arXiv:0808.2041 [nucl-ex]].
- (22) L. Ahle et al. [E866 and E917 Collaborations], Phys. Lett. B 476, 1 (2000) [nucl-ex/9910008].
- (23) J. L. Klay et al. [E895 Collaboration], Phys. Rev. Lett. 88, 102301 (2002) [nucl-ex/0111006].
- (24) J. Barrette et al. [E877 Collaboration], Phys. Rev. C 62, 024901 (2000) [nucl-ex/9910004].
- (25) L. Ahle et al. [E802 Collaboration], Phys. Rev. C 60, 064901 (1999).
- (26) L. Ahle et al. [E802 Collaboration], Phys. Rev. C 57, 466 (1998).
- (27) S. V. Afanasiev et al. [NA49 Collaboration], Phys. Rev. C 66, 054902 (2002) [nucl-ex/0205002].
- (28) C. Alt et al. [NA49 Collaboration], Phys. Rev. C 77, 024903 (2008) [arXiv:0710.0118 [nucl-ex]].
- (29) C. Alt et al. [NA49 Collaboration], Phys. Rev. C 73, 044910 (2006).
- (30) T. Anticic et al. [NA49 Collaboration], Phys. Rev. C 69, 024902 (2004).
- (31) V. N. Russkikh and Yu. B. Ivanov, Phys. Rev. C 76, 054907 (2007) [nucl-th/0611094]; Yu. B. Ivanov and V. N. Russkikh, Phys. Atom. Nucl. 72, 1238 (2009) [arXiv:0810.2262 [nucl-th]].
- (32) B. Mohanty, J. e. Alam, S. Sarkar, T. K. Nayak and B. K. Nandi, Phys. Rev. C 68, 021901 (2003) [nucl-th/0304023].
- (33) J. P. Bondorf, S. I. A. Garpman and J. Zimanyi, Nucl. Phys. A296, 320 (1978).
- (34) P. J. Siemens and J. O. Rasmussen, Phys. Rev. Lett. 42, 880 (1979).
- (35) E. Schnedermann, J. Sollfrank and U. W. Heinz, Phys. Rev. C 48, 2462 (1993) [nucl-th/9307020].
- (36) A. Andronic, P. Braun-Munzinger and J. Stachel, Nucl. Phys. A 772, 167 (2006) [nucl-th/0511071].
- (37) C. Blume, M. Gazdzicki, B. Lungwitz, M. Mitrovski, P. Seyboth, and H. Strobele, Compilation of NA49 Numerical Results, http://edms.cern.ch/document/1075059.
- (38) C. Blume and C. Markert, Prog. Part. Nucl. Phys. 66, 834 (2011) [arXiv:1105.2798 [nucl-ex]].
- (39) E. Seifert and W. Cassing, arXiv:1710.00665 [hep-ph].
- (40) A. Andronic, P. Braun-Munzinger and J. Stachel, Phys. Lett. B 673, 142 (2009) Erratum: [Phys. Lett. B 678, 516 (2009)] [arXiv:0812.1186 [nucl-th]].
- (41) K. A. Bugaev, D. R. Oliinychenko, J. Cleymans, A. I. Ivanytskyi, I. N. Mishustin, E. G. Nikonov and V. V. Sagun, EPL 104, no. 2, 22002 (2013) [arXiv:1308.3594 [hep-ph]].
- (42) A. Palmese, W. Cassing, E. Seifert, T. Steinert, P. Moreau and E. L. Bratkovskaya, Phys. Rev. C 94, no. 4, 044912 (2016) [arXiv:1607.04073 [nucl-th]]; W. Cassing, A. Palmese, P. Moreau and E. L. Bratkovskaya, Phys. Rev. C 93, 014902 (2016) [arXiv:1510.04120 [nucl-th]].
- (43) A. Dubinin, A. Radzhabov, D. Blaschke and A. Wergieluk, Phys. Rev. D 96, 094008 (2017) [arXiv:1608.05383 [hep-ph]].
- (44) P. Batyuk et al., Phys. Rev. C 94, 044917 (2016) [arXiv:1608.00965 [nucl-th]].