∎
2 Department of Physics, the University of Tokyo, 7-3-1, Hongo, Bunkyo-ku, Tokyo 133-0033, Japan
Pyrolytic Graphite Sheet††thanks: This work was financially supported by Grant-in-Aid for Scientific Research (B) (Grant No. 15H03684), and Challenging Exploratory Research (Grant No. 15K13398) from JSPS.
Abstract
We have measured surface morphology and gas adsorption characteristics of uncompressed pyrolytic graphite sheet (uPGS) which is a candidate substrate for AC and DC superflow experiments on monolayers of 4He below K. The PGS is a mass-produced thin graphite sheet with various thicknesses between 10 and 100 m. We employed a variety of measuring techniques such as imagings with optical microscope, SEM and STM, Raman spectroscopy, and adsorption isotherm. PGS has smooth and atomically-flat external surfaces with high crystallinity. Although the specific surface area ( m2/g) is rather small, by making use of its smooth external surface, the thinnest uPGS of 10 m thick is found to be suitable for the superflow experiments on the strictly two-dimensional helium systems.
Keywords:
graphite adsorptionhelium monolayer superfluidity1 Introduction
A few atomic layers of helium (He) adsorbed on graphite substrate are experimental realization of correlated two-dimensional (2D) quantum systems. New types of superfluidity, which should not be a simple extrapolation of thin superfluid 4He films of several tens atomic layers thick, are expected there. Crowell and Reppy PhysRevLett.70.3291 found a novel superfluidity below 400 mK, which is reentrant as a function of density, in the second monolayer of 4He adsorbed on Grafoil Grafoil , a flexible exfoliated graphite sheet, using the torsional oscillator technique. Recently, similar observations followed using the same method and the same type of substrate 1742-6596-150-3-032096 ; nyeki2017 . Among them, Nyeki et al. nyeki2017 reported complicated density and temperature evolutions of the superfluid response in detail. Near the corresponding density region, the existence of the quantum liquid crystal phase, a new class of matter where spatial symmetry is partially broken keeping finite fluidity even at , has been proposed by the heat capacity measurement with a ZYX exfoliated graphite PhysRevB.94.180501 . Thus the observed reentrant superfluidity PhysRevLett.70.3291 ; 1742-6596-150-3-032096 ; nyeki2017 could be a novel one where spatial and superfluid orders are intertwined, attracting great attention as a possible experimental realization of supersolidity in 2D. Similar possibilities are discussed in different 2D quantum systems such as cold molecule gases Hazzard2017 .
However, superfluid detection efficiencies () in those torsional oscillator experiments PhysRevLett.70.3291 ; 1742-6596-150-3-032096 ; nyeki2017 are rather poor (only –) because of complicated structure and discontinuity of the Grafoil surface. Here is the tortuosity factor (–). Such structures are inevitably created during the production process, i.e., powdering natural flake graphite, exfoliating the powders at high temperature, and rolling them into a sheet under high pressure. This arises a doubt that liquid or amorphous 4He localized in the substrate heterogeneities might be responsible for the detected superfluid responses. Therefore, it is crucial to develop a more efficient graphite substrate for detection of the AC or DC superflow in monolayers of 4He.
From the previous heat capacity measurements PhysRevB.94.180501 ; PhysRevLett.38.501 ; qfs2013 , ZYX was proven to be a better substrate than Grafoil for studies of phase transitions in 2D helium systems because of its much larger single crystallite (platelet) size and hence much less heterogeneities. However, we have found that the surface of ZYX is covered by many deep crevices created during the exfoliation process, which may interrupt superflow in adsorbed monolayer of 4He. This problem seems to be relevant in our preliminary torsional oscillator experiment as described in Section 2.
Considering the above situation, in this article, we propose the pyrolytic graphite sheet (PGS) pgs as a suitable graphite substrate for detection of superfluidity in monolayers of 4He. PGS is a very thin graphite sheet of 10–100 m in thickness with a highly-oriented single-crystal-like structure made from stacked thin polymer films. We will make use of the external surface for helium adsorption unlike the exfoliated graphites like Grafoil and ZYX. Results of extensive characterizations of its surface structure and crystallinity are given here with comparisons to results for Grafoil and ZYX. The characterizations include (i) surface morphology observations with optical microscope, scanning electron microscope, and scanning tunneling microscope, (ii) crystallographic obsevation with Raman scattering, and (iii) adsorption isotherms. Other properties of PGS such as thermal conductivity, electrical conductivity and crystal analysis have already been published elsewhere NAKAMURA2017118 .
2 Morphology
2.1 Observations with optical and scanning electron microscopes
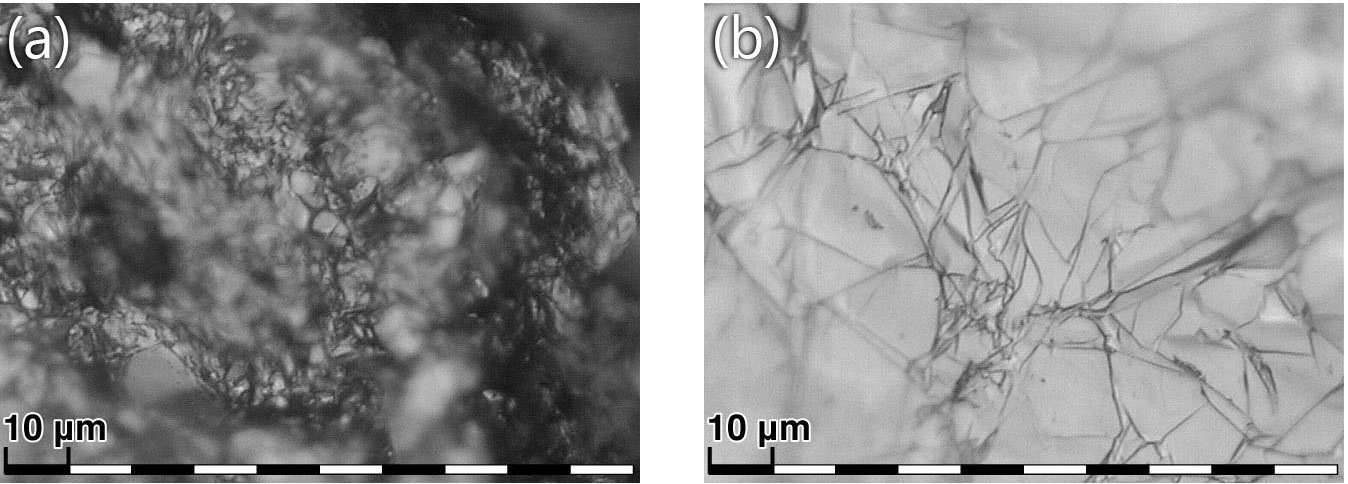
Morphology of cleaved surfaces of three different kinds of graphite substrates was checked in a relatively macroscopic scale with an optical microscope vh5000 . Before showing results of PGS, we first discuss those of Grafoil and ZYX. As shown in Fig. 1(a), the surface of Grafoil is quite irregular with a mosaic structure consisting of plates of random size. As shown in Fig. 1(b), the surface of ZYX is much more uniform. However, we found that it is fully covered by a network of deep crevices of 1–10 m long and that similar structures are seen at any cleaved surfaces. The crevices must be created by the exfoliation process of this product. The structure would prevent simply connected superflow in adsorbed 4He films. This could be the reason for a rather extended superfluid onset observed in a bilayer of liquid 4He adsorbed on ZYX in our preliminary torsional oscillator experiment (see Appendix A).
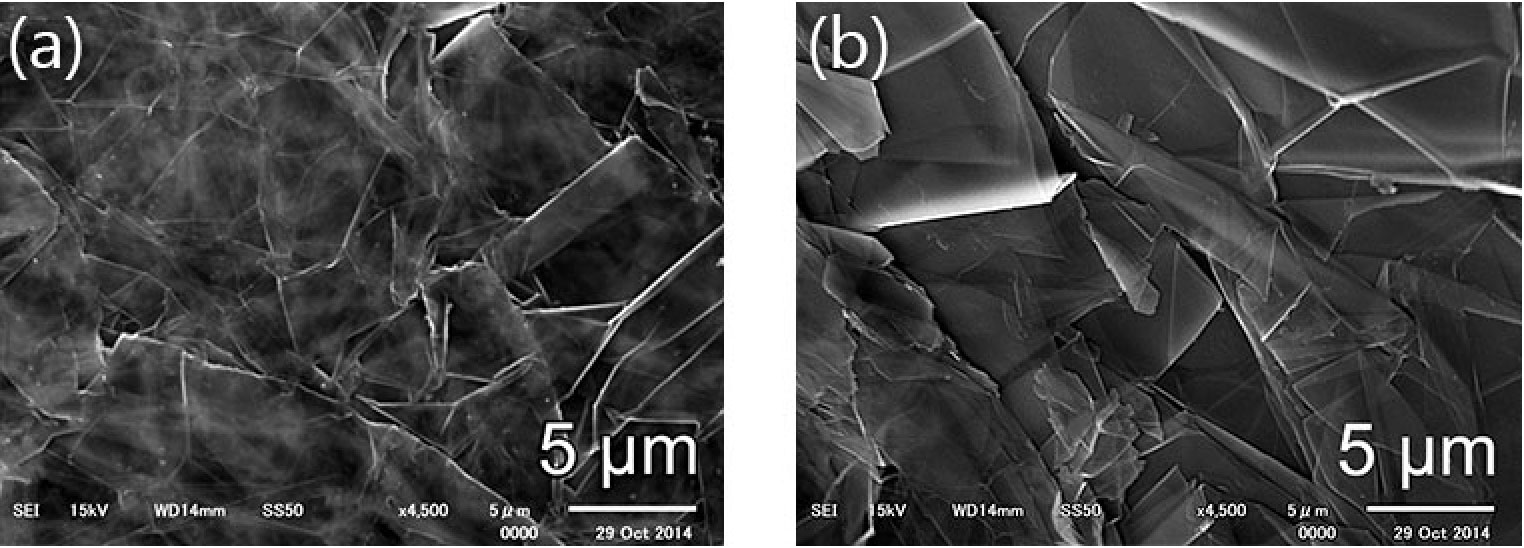
Secondary electron imaging with a scanning electron microscope (SEM) sem is more sensitive to a height variation of surface than the optical microscope imaging. Figures 2(a) and (b) are such images of cleaved surfaces of Grafoil and ZYX. They have a piled-up structure consisting of 1–20 m wide patches with sharp edges. This structure presumably reflects small graphite flakes, a raw material, in the case of Grafoil and a trace of rupture during exfoliation in the case of ZYX, respectively. In any case, it will largely reduce the connectivity of superflow in adsorbed 4He thin films as was actually found in the previous torsional oscillator experiments using Grafoil PhysRevLett.70.3291 ; 1742-6596-150-3-032096 ; nyeki2017 .
Next, we will show results for PGS. Two different kinds of PGS have been examined in this work. One is uncompressed PGS (uPGS), and the other is commercial PGS (cPGS) pgs ; NAKAMURA2017118 . uPGS is brittle and inflexible, while cPGS, which is produced by compressing uPGS, is flexible like paper. Note that numbers denoted to specify the sample thickness below are nominal ones. Actual thicknesses measured by micrometer are 132 m for cPGS-10m, 192 m for uPGS-10m, 29.70.6 m for uPGS-17m, 563 m for uPGS-25m, and 1454 m for uPGS-100m.
The surface morphology of PGS is largely different from those of Grafoil and ZYX. Figure 3(a) is an optical microscope image of a cleaved surface of uPGS-10m. The surface is quite smooth with a winkle (or wavy) structure of the length scale of 20–40 m without any crevices. On the other hand, in the case of cPGS-10m (Fig. 3(b)), the surface is little more complicated with small structures as well as sharp creases which must be created by the final compression process. Thus cPGS must be less suitable for superflow experiments than uPGS, and we will concentrate mostly on characterization of uPGS hereafter.
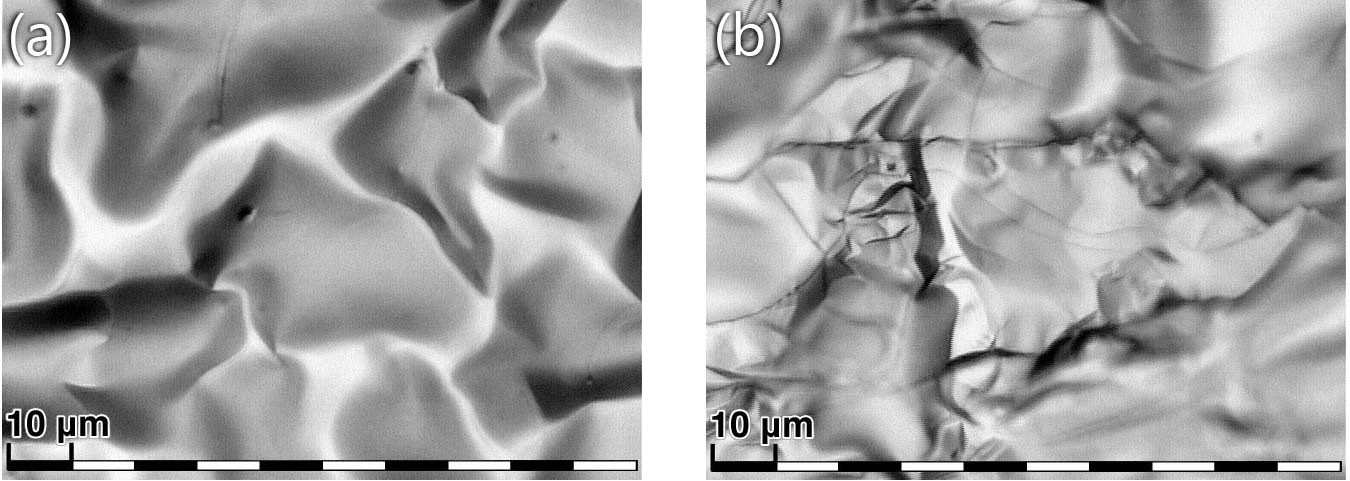
Figure 4(a) is a secondary electron SEM image of a cleaved surface of uPGS-17m. It was difficult to obtain enough contrast, indicating a quite smooth surface. A vaguely seen structure of the length scale of 50–100 m here is an alternative looking of the winkles seen by the optical microscope (Fig. 3(a)). The situation is somewhat different for uPGS-100m as shown in Fig. 4(b). The structure is much sharper and smaller in size, and thus the image contrast is much higher. Apparently, thicker uPGSs have less uniformity compared to thinner ones because gas is probably more difficult to escape during the carbonization process in the former case.
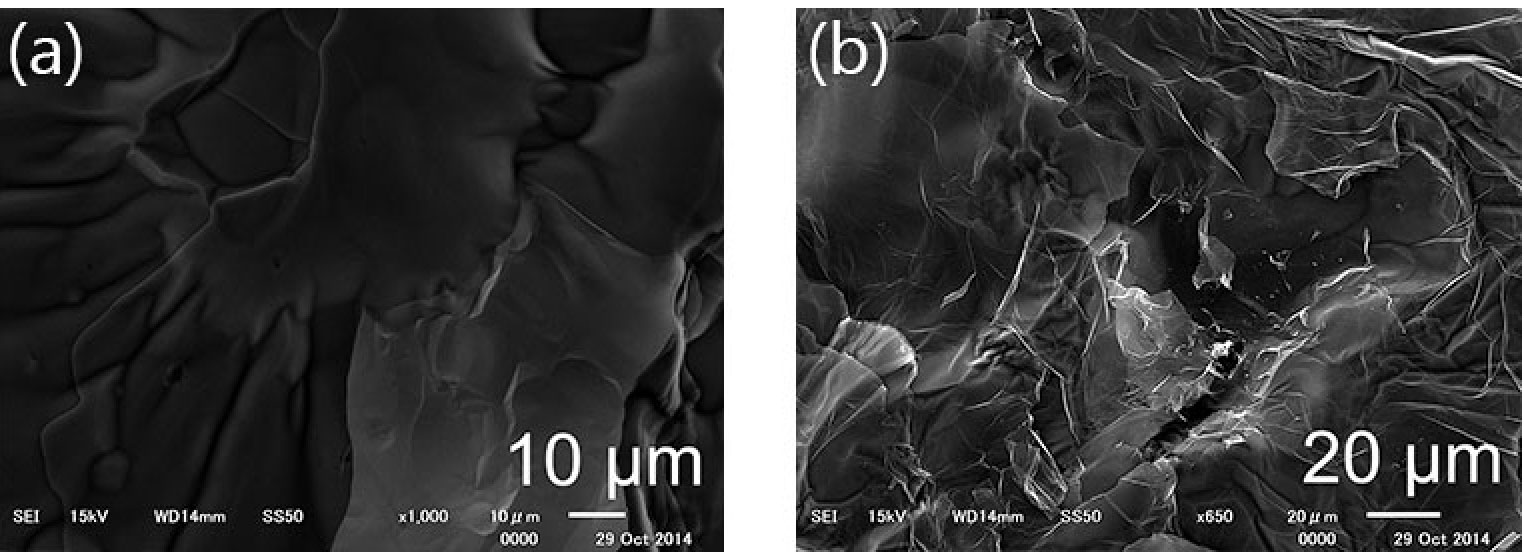
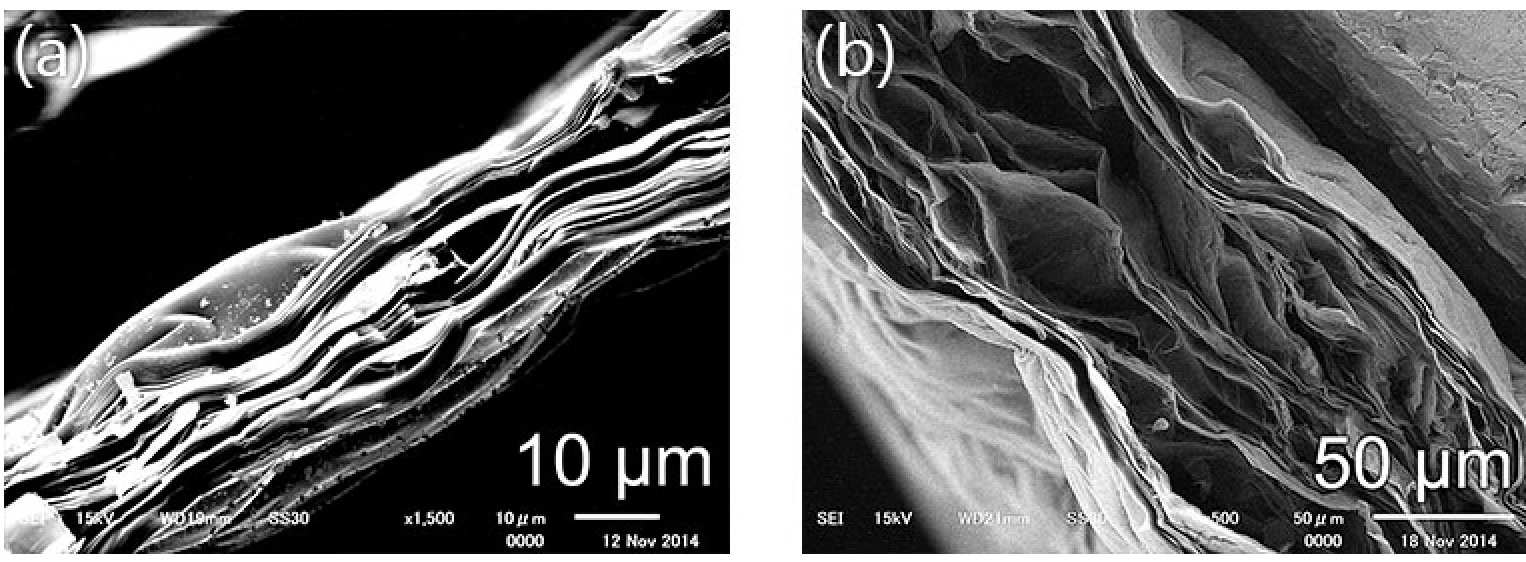
Internal morphology of uPGS was investigated by cross-sectional secondary-electron SEM imaging (see Figs. 5(a) and (b)), where the fracture surfaces were obtained by tearing uPGS pieces with a vise. The images show lamination of wavy layers of sub-m thick. A similar layer structure has also been observed in the previous TEM studies 10012555627 . Note that each layer is an order of magnitude thinner than raw polymer films before carbonization. In uPGS-17m the layers are rather densely packed, while in uPGS-100m they are loosely packed with large interlayer spaces which may or may not connect to the outside (see a related discussion in Section 4). The layer thickness is much thicker than individual graphene sheet. From the quantum Monte Carlo calculation PhysRevLett.102.085303 , the adsorption potential for helium of thin graphite is practically the same as that of bulk graphite if the thickness is larger than eight graphene layers.
2.2 Observation with scanning tunneling microscope
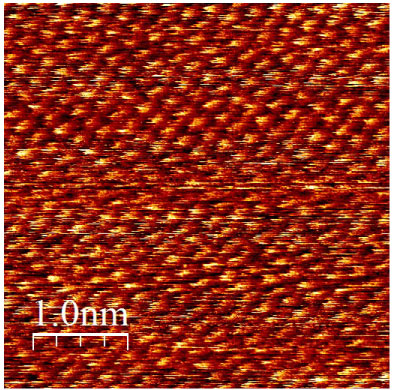
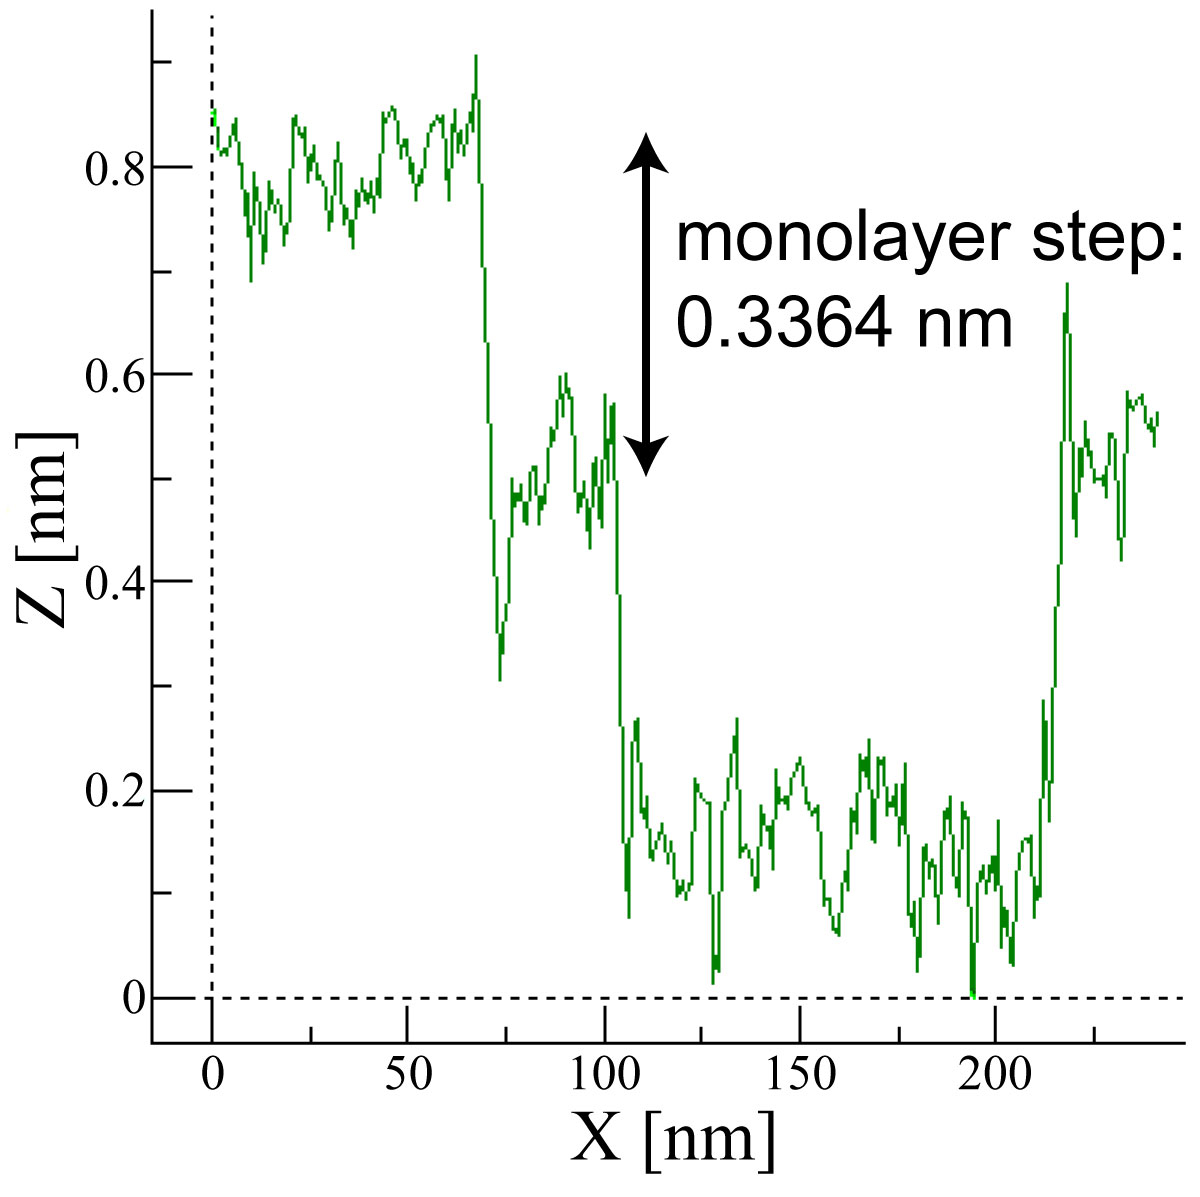
The lateral surface structure of uPGS-17m was also investigated with a scanning tunneling microscope (STM) stm in atomic scale at room temperature in the air. As shown in Fig. 7, the honeycomb lattice structure of graphite basal plane is seen almost everywhere on the surface. Note that, in STM imaging of a surface of graphite with the normal AB (Bernal) stacking, only carbon atoms belonging to one of two sublattices in topmost graphene are visible. That is why a triangular lattice rather than the honeycomb lattice is observed in Fig. 7. Besides the wavy structure of the order of 1 m, which would be related to the smaller scale structure seen by SEM, we observed monoatomic height steps with a mean separation of the order of 100 nm (see Fig. 7). The step density is an order of magnitude higher than highly oriented pyrolytic graphite (HOPG) PhysRevB.73.085421 . These steps may affect the critical velocity in superflow experiment for a few layers of 4He films to some extent (see Section 5).
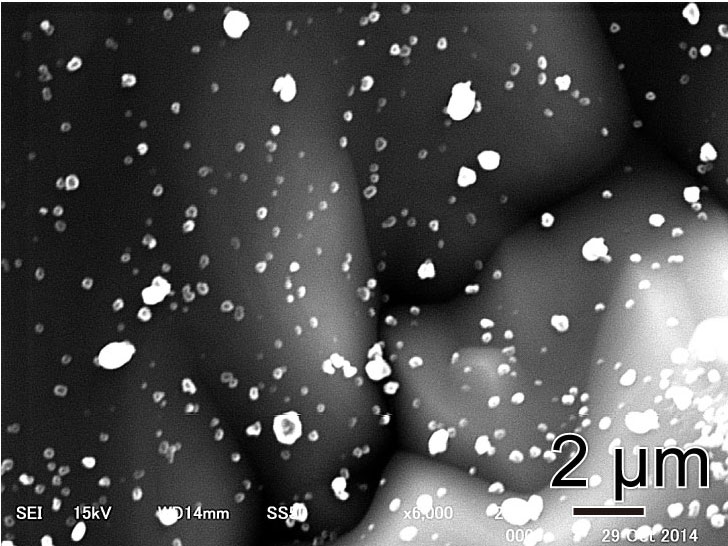
3 Small grains on top surface of PGS
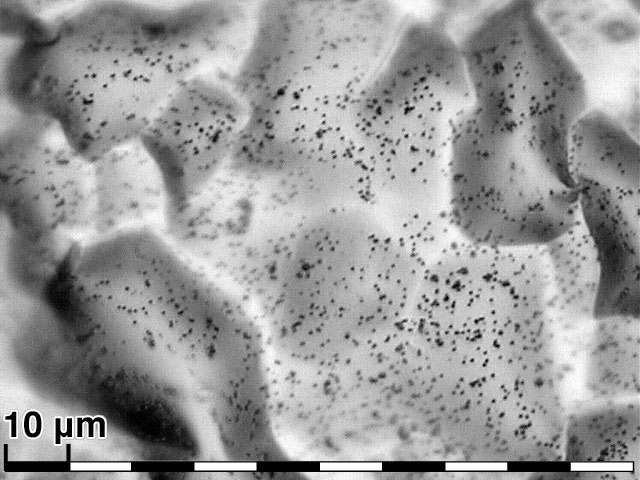
We found that top surfaces of uPGS and cPGS are covered by many tiny grains distributing randomly regardless of the sample thickness as shown in Fig. 9. The grain size determined by the secondary electron SEM is from 0.2 to 2 m in diameter, and they cover about 10% of the top surface in area (see Fig. 9). The grains are optically black and protruded from the surface judging from back scattered SEM imaging (not shown). The energy-dispersive X-ray spectroscopy, which is sensitive to boron and heavier elements, detected no traces other than carbon and oxygen. They can be removed neither by heating up to 700 ∘C in vacuum ( mbar) nor by washing with organic solvents or water. From all these facts including results of Raman spectroscopy measurements shown in Appendix B, we speculate that the surface grain is a stack of graphite microcrystallites consisting of relatively small numbers of graphene layers. Since the grains are stuck only on the top surface, they can throughly be removed by surface cleavage with scotch tape as shown in Figs. 3 and 4 and possibly with other methods like hydrogen plasma etching.
4 Adsorption Isotherm Measurement
Gas adsorption characteristics are crucial to apply a material to substrate for adsorption experiments. We have made adsorption isotherm measurements of nitrogen molecules (N2) at K for uncleaved uPGS-17m. The sample is a stack of 204 uPGS sheets whose total weight is 1.14 g. The size of each sheet is cm2. The sheets were packed into a cm3 open box made of a thin copper plate. They were baked at 700 ∘C in vacuum ( mbar) and then quickly inserted to a vacuum chamber (sample cell) made of brass. The nominal surface area () calculated from the outer dimensions of the PGS sheets is 600 cm2 without taking account of the wavy morphology of the outer surface and the possible interlayer space shown in Fig. 5(a).
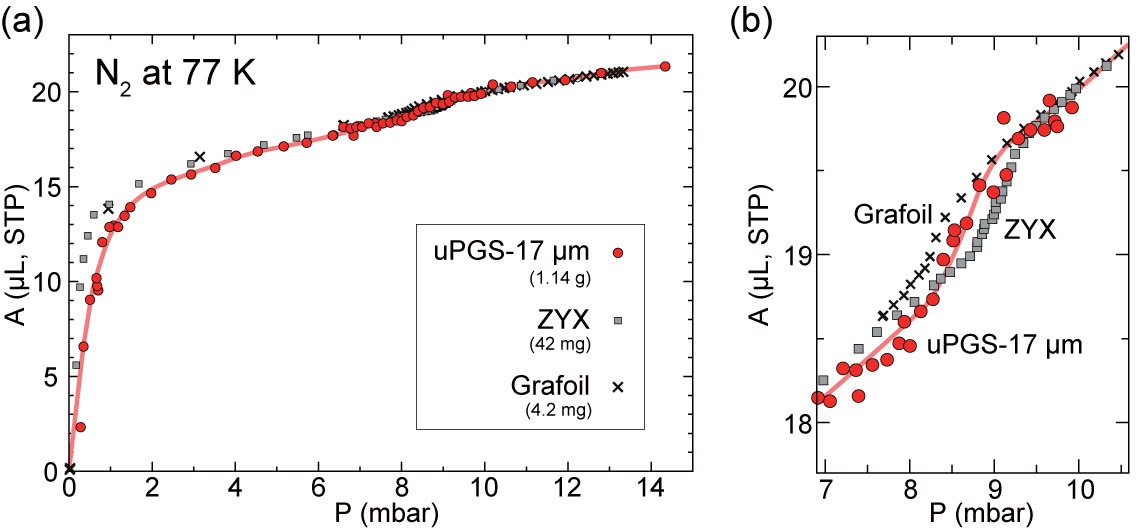
Before discussing the result shown in Fig. 10, let us first explain some technical details to perform this kind of measurement for bulk materials with tiny specific surface area (), i.e., surface area per unit weight. It is much more difficult than measurements for exfoliated, porous or powder materials. In Fig. 10 the vertical quantity () is an amount of N2 adsorbed on the surface, and the horizontal one () is the equilibrium gas pressure measured by a capacitive pressure gauge setra located at room temperature. Here an amount of gaseous N2 existing in an open volume (or dead volume) in the cell has already been subtracted from the raw data. ( cm3) was measured precisely with 4He gas, which is not adsorbed on the surface at 77 K, in a separate measurement. In that measurement, the apparent (skeletal) density of the sample can also be determined from a difference between values with and without the sample. The thermal transpiration effect takaishi1963thermal in the pressure measurement was directly measured for empty cell with N2 and was taken into account at 2 mbar.
The adsorption isotherm data for uPGS-17m shown by the closed circles in Fig. 10 agree reasonably well with those of Grafoil (crosses) niimi:4448 and ZYX (squares) LT26nakamura . Here, the data of Grafoil and ZYX are scaled to that of uPGS-17m at mbar. The data for uPGS-17m were reproducible among three independent measurements. The “substep” feature for the commensurate phase formation at atoms/nm2 PhysRevB.13.1446 is seen near mbar (see Fig. 10(b)). The small variation of substep structure in different substrates may come from small variations in surface uniformity and/or measuring temperature ( K). This also assures that the surface of PGS has nearly the perfect graphite structure in atomic scale, i.e., complete graphitization in the production process. The surface area () determined from the upper bound of the substep is 830 cm2 ( m2/g). This value is larger than by 40%, which is attributable to the existence of non-negligible internal surface area. Note that the wavy morphology of outer surface increases only by 3%. The apparent density of the uPGS-17m sample is estimated as 1.760.03 g/cm3, while that of bulk graphite is 2.26 g/cm3 This indicates the existence of an internal void space (22%) not accessible for N2 molecules from outside.
The adsorption isotherm measurement for uncleaved uPGS-100m was even more difficult than uPGS-17m because of much smaller , and hence the data show much larger scatterings (not shown). The apparent density determined from measurements is 1.20 g/cm3 for uPGS-100m sheets with 26–32 drill holes of 0.5 mm diameter, which is much smaller than that of uPGS-17m, indicating much larger inaccessible intra- and/or inter-sheet void volume. This is in accordance with the cross-sectional secondary-electron SEM images shown in Figs. 5(a) and (b). For sheets without the ventilation holes, an even lower value (0.82 g/cm3) was obtained.
5 Feasibility Studies of Experiments on Superfluid Thin Films Using uPGS
In this section, we study the feasibility of AC and DC superflow detection for monolayers of 4He adsorbed on a uPGS substrate at temperatures below 1 K by the torsional oscillator and thermal flow techniques. Here, among other types, uPGS-10-m was chosen as a substrate mainly because of its largest specific surface area and the highest in-plane thermal conductivity NAKAMURA2017118 .
In some experiments where so many uPGS sheets have to be used like torsional oscillator experiment, it is not easy to cleave all the surfaces to remove the surface grains discussed in Section 3. In that case, one may use uncleaved uPGS. However, since the grains are well-dispersed point defects rather than line defects like crevices, they would not be so serious obstacles for 4He superflow. The observation of the clear substep in the adsorption isotherm using uncleaved uPGS (Fig. 10) is also encouraging.
5.1 Torsional oscillator experiment
The substrate for torsional oscillator experiment will consist of a stack of 1000 uPGS-10-m disks of 20 mm in diameter and silver foils of 2 m in thickness and 8 mm in diameter. They will be piled up alternately and be diffusively bonded at 600 K under pressure to make them a mechanically rigid single piece. Then it will be tightly packed into a container made of magnesium alloy of 20 mm in height and 1 mm wall thickness. An estimated total surface area of uPGS is 0.53 m2. The silver foils are used not only to assist the thermal conductance of the stack but also to keep proper gaps between the uPGS disks in the outer region as spacers. Although a small amount of 4He may be adsorbed on the silver surface too, it will not affect the superfluid detection as follows. The adsorption potential of silver for helium is 3 times less than that of graphite PhysRevB.46.13967 . Thus, for example, the second layer of 4He adsorbed on uPGS will be in equilibrium with a submonolayer 4He adsorbed on silver which will not show superfluidity down to being tightly bound to the surface.
The superfluidity is detected as a resonance frequency shift () of the torsional oscillator due to a change of the moment of inertia (). Estimated values of the second layer of 4He sample of 7.5 atoms/nm-2, the uPGS disks, and the magnesium-alloy container are , , and kgm2, respectively. of the silver foils is negligibly small compared to that of the helium film because of the large difference in the diameters. Therefore, associated with superfluidity of the sample is expected to be 2.9 mHz at most. Since a typical accuracy of measurement is about 0.02 mHz, the superfluidity should sufficiently be detected even when the detection efficiency on the uPGS surface was only 0.1.
5.2 Thermal flow experiments
An abrupt increase of the thermal conductance along a 4He thin film with increasing the coverage at a fixed or decreasing at a fixed coverage will provide an alternative evidence for superfluid onset of the film. For this type of experiment, the substrate crystallinity should be as high as possible not to reduce the superflow. In addition, the substrate thickness should be as thin as possible not to shunt the temperature gradient by substrate itself when the film is in the normal state. The experiment by Polanco and Bretz POLANCO19801 using a ZYX wafer of mm3 was successful to detect superfluid onset of the third layer of 4He at K. uPGS-10-m should potentially be more advantageous for this experiment than ZYX because of its much better crystallinity NAKAMURA2017118 .
Next we recall the experiment by Maynard and Chan MAYNARD19822090 where a thin HOPG leaf (2140.1 mm3) was successfully used to detect third sound propagation again in the third layer of 4He at K. The third sound is a temperature wave (or equivalently an entropy wave) characteristic of superfluid thin films. They demonstrated that the thermal transport phenomenon of superfluid monolayer can be detected not being shunted by the 100 m-thick graphite substrate. We thus expect that much thinner uPGS-10m will be capable enough to detect a superfluid onset of 4He monolayer with an even smaller superfluid density such as the prospected quantum liquid crystal phase in the second layer PhysRevB.94.180501 .
6 Conclusions
We examined the surface morphology and adsorption isotherm of uncompressed pyrolytic graphite sheet (uPGS), a thin graphite sheet of various nominal thicknesses between 10 and 100 m. We propose this new type of graphite material as a suitable substrate for experiments to detect superflow in adsorbed monolayers of 4He below K. It was found that the cleaved surface of uPGS is quite smooth with the wavy structure of the length scale of several tens m from the optical and SEM imaging. The STM imaging showed that the surface is atomically flat over that length scale with monoatomic steps roughly every 100 nm. We found that many small grains are randomly distributed on PGS surfaces but they are completely absent on cleaved surfaces. Using different techniques including Raman spectroscopy, we almost identified them as thin graphite microcrystallites.
On the other hand, Grafoil and ZYX, which are exfoliated graphites commonly used for experiments on two dimensional (2D) 4He systems, have quite different surface morphology with much more complicated and shorter length scale structures (platelets) of the order of 10–200 nm. Even many deep crevices, which must be created by the exfoliation process, are found on the surface of ZYX. Our preliminary torsional oscillator measurement eventually suggested the unsuitability of ZYX as an adsorption substrate.
We also made feasibility studies of future torsional oscillator and thermal transport experiments using uPGS-10m. The results show that it is feasible to observe the AC and DC superflow in liquid monolayers or the recently proposed quantum liquid crystal phase in the second layer of 4He. Besides the detection of superfluidity, uPGS will be useful for other applications such as excellent heatsink in a wide temperature range from cryogenic to high temperature, high-conductivity electrode in electrochemistry, etc.
Appendix A Torsional oscillator measurement with ZYX substrate
Previously, we reported a preliminary attempt to observe superfluidity in 4He monolayers adsorbed on ZYX substrate by the torsional oscillator (TO) method Kubota2014 . In that experiment, there were two technical problems. One was the too large variation of the resonance frequency of the empty cell, , caused by an accidental application of large strain to the coin silver torsion rod before the measurement. The other was the instability of , i.e., the too high sensitivity to mechanical shocks and to the 1 K pot temperature of dilution refrigerator.
We have thus prepared a new experimental setup in which those problems are fixed. This time, the torsion rod is made of BeCu (o.d./i.d. mm), and a cell cap is made of 0.5-mm-thick copper. The surface area of ZYX substrate is 3.38 m2. The TO cell is fixed onto a massive copper platform (50 mm in diameter, 968 g in weight) with a copper vibration isolation rod (3 mm in diameter) which is installed on the mixing chamber of dilution refrigerator. and values of the empty cell were 1376 Hz and 2 at K, respectively. A measured variation of was less than 2 mHz at K. These performances are equivalent to those realized in the previous TOs PhysRevLett.70.3291 ; 1742-6596-150-3-032096 ; nyeki2017 .
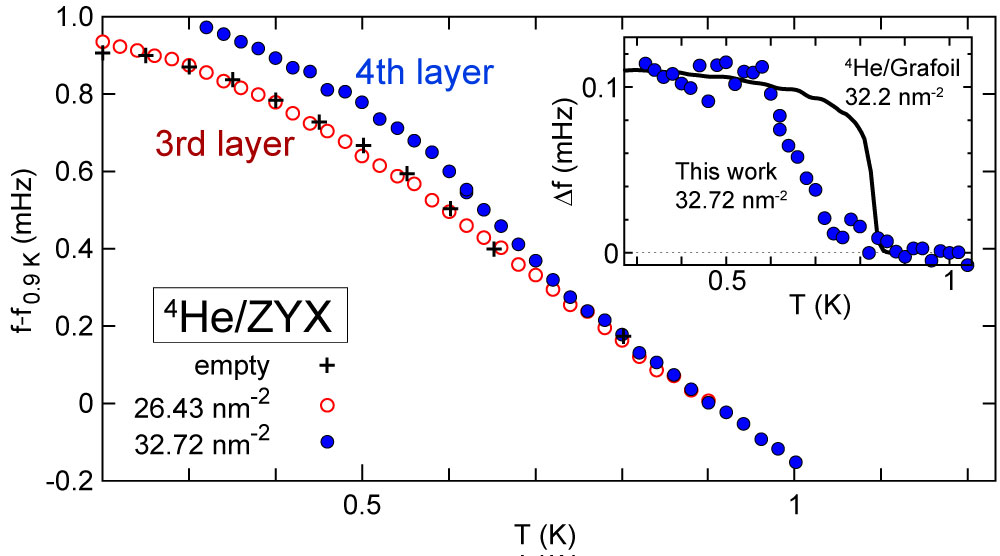
With this new setup, we have made preliminary TO measurements for 4He thin films of two different densities of 26.43 and 32.72 nm-2 down to 0.2 K. The former film consists of a solid bilayer and topmost “liquid monolayer”, and the latter does a solid bilayer and a topmost “liquid bilayer”, respectively PhysRevLett.70.3291 ; PhysRevB.47.309 . At both densities, superfluid responses were detected in the previous TO measurement by Crowell and Reppy (CR) PhysRevLett.70.3291 using Grafoil substrate. In Fig. 11, we plotted measured with and without the 4He films as differences from those at K. For 32.72 nm-2 (closed circles) an apparent increase of from (crosses) is observed below 0.8 K, while no meaningful change is seen at 26.43 nm-2. In the inset, for 32.72 nm-2 after subtracting is plotted. The solid line is the result by CR for a similar density ( nm-2) where they observed an abrupt jump of due to 2D superfluidity at an onset temperature ( K) as expected from the Kosterlitz-Thouless (KT) theory PhysRevLett.39.1201 . Here the frequency shift data of CR are normalized so as to be consistent with our data. On the other hand, our data show a much slower increase below a similar onset temperature. It is plausible that the crevice structure of ZYX described in the main text weakens the superfluid phase coherence making the transition signature rather extended as in superconducting Josephson networks PhysRevB.96.060508 . This may also explain the absence of superfluid response for 26.43 nm-2 at least down to 0.2 K.
A jump of superfluid density for our 32.72 nm-2 data is estimated as 0.160.01 nm-2 taking account of the measured mass loading coefficient (0.68 mHz/nm-2) and ( mHz), while 2.20.1 nm-2 is expected from the KT theory with K. Thus the superfluid detection efficiency () of ZYX is which is a little larger than the value (–) for Grafoil PhysRevLett.70.3291 ; 1742-6596-150-3-032096 ; nyeki2017 . Unfortunately, measurements of were not stable enough to derive meaningful information.
Appendix B Raman spectroscopy of uncleaved uPGS surface
We studied uncleaved uPGS surfaces by a laser Raman microscope raman and compared the results with our previous measurements on cleaved uPGS surfaces NAKAMURA2017118 . The measurements gave us useful insights to define the origin of the surface grains discussed in the main text as a stack of graphite microcrystallites of small numbers of graphene layers.
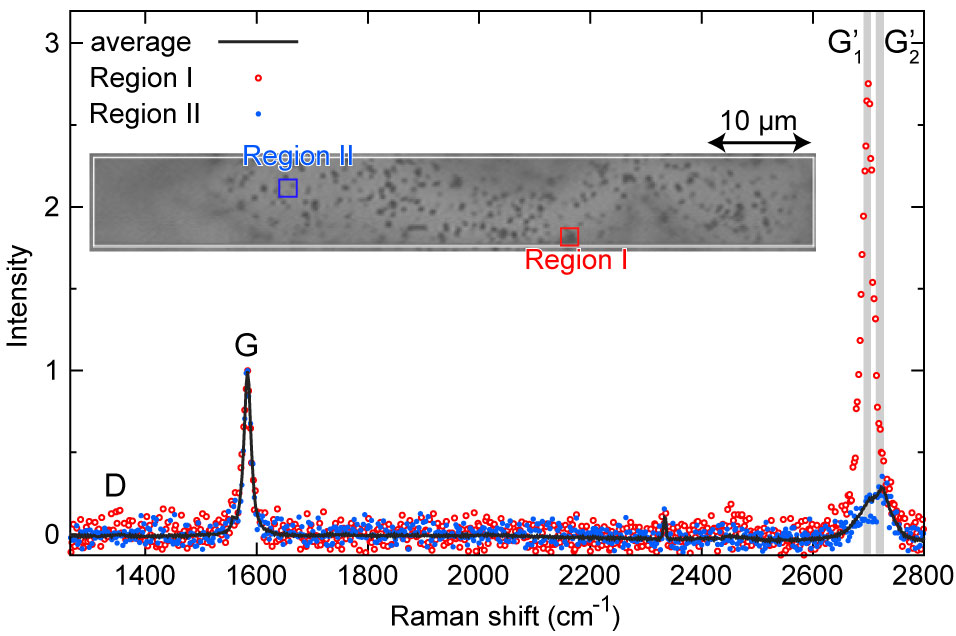
Raman spectra of graphite and graphene usually have three prominent bands: G, G’ and D bands PSSB:PSSB201100295 . G band (1580 cm-1) is the first order Raman process corresponding to in-plane vibration modes of pairs of sp2 carbon atoms, which is commonly found in aromatic and olefinic molecules PhysRevB.61.14095 . D band and G’ band (also known as D* band or 2D band) are second order ones whose wavenumber vary with the excitation energy. D band intensity is an indicator of disorder including edges PSSB:PSSB201100295 . Its overtone, G’ band, does not require any disorder and has a strong intensity comparable to that of G band. The G’ band appears a symmetric peak for monolayer graphene but bilayer graphene has a non-symmetric peak at a slightly higher wavenumber because there are 4 sub-bands due to inter-layer coupling. The width and wavenumber increase as we increase the number of graphene layers up to 10 PSSB:PSSB201100295 .
Figure 12 shows Raman spectra at uncleaved uPGS-17m averaged over the following three different areas indicated in the inset (optical microscope image). The solid circles represent a spectrum within the region I in the inset including a large grain, and the open circles do that of the region II including few grains. The solid line is a spectrum averaged over the whole image. Here the intensity of each spectrum is normalized by G peak height. Apparently, the grains have a strong intensity at lower wavenumbers of G’ band (G’1) at cm-1. This feature is characteristic of (a few layers of) graphene PhysRevLett.97.187401 . On the other hand, in Region II, the peak appears at slightly higher wavenumber, G’2, which is a common characteristic of bulk graphite.
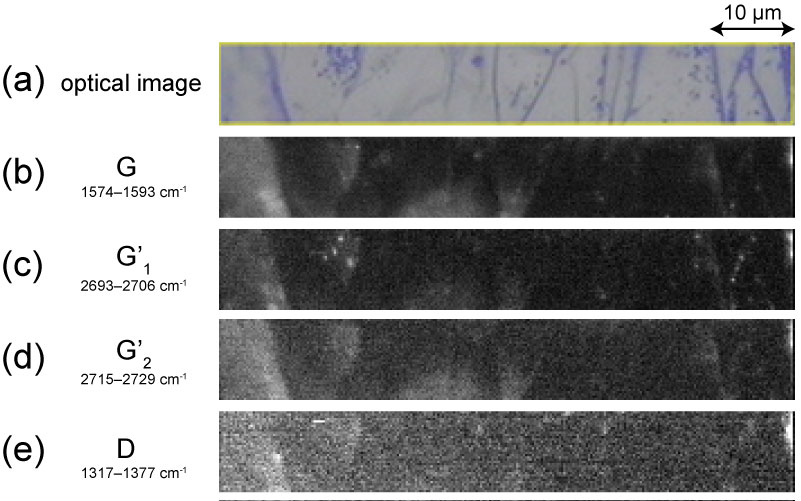
Spectral mappings for an uncleaved uPGS-100m surface shown in Fig. 13 provide us more information. While the G’2 mapping (Fig. 13(d), indicator of graphite) only has a shallow contrast due to the defocusing, G’1 mapping (Fig. 13(c), indicator of graphene) has many spots with strong intensity. These spots correspond to the grains in the optical image, Fig. 13(a). G band mapping, Fig. 13(b), also show similar spots. However, in those spots, Raman intensities at other wavenumbers, not only in G band, are equally enhanced. Thus the G band distribution does not indicate difference in the material composition.
At uncleaved uPGS surface we always observed a finite D band intensity, which is sensitive to symmetry breaking defects or edges rohtua , while it is not detectable at cleaved surface NAKAMURA2017118 (see also Table 1). However, it does not seem to be directly related to the surface grains, since one cannot find a strong correlation in a D band mapping (Fig. 13(e)) with the grain distribution in the optical image (Fig. 13(a)). The defects may be located just below the top surface ncomms5224 .
| material | nominal thickness | (G)/(G’) | (D)/(G) | reference |
|---|---|---|---|---|
| uncleaved uPGS | m | 1.3–3.3 | 0.028(5) | this work |
| uncleaved uPGS | m | 0.3–3.0 | 0.018(11) | this work |
| uncleaved uPGS | m | 0.3–3.2 | 0.013(5) | this work |
| cleaved uPGS | m | 3.2(1) | Ref. 10 | |
| cleaved uPGS | m | 3.1(1) | Ref. 10 | |
| cleaved uPGS | m | 3.1(1) | Ref. 10 |
Acknowledgements.
We are grateful to Yoshiya Sakaguchi, Hiroyuki Hase, and Makoto Nagashima of Automotive & Industrial Systems Company of Panasonic corporation for providing us the uPGS and cPGS samples. We also thank Hideki Sato for his assistance in the STM measurement and Takenori Fujii for his contribution in the energy-dispersive X-ray spectroscopy measurement. The laser Raman microscope used in this work was supplied by MERIT program, The University of Tokyo.References
- (1) P.A. Crowell, J.D. Reppy, Phys. Rev. Lett. 70, 3291 (1993). DOI 10.1103/PhysRevLett.70.3291. URL http://link.aps.org/doi/10.1103/PhysRevLett.70.3291
- (2) GrafTech International Ltd. Former Carbon Products Division of Union Carbide (UCAR).
- (3) Y. Shibayama, H. Fukuyama, K. Shirahama, Journal of Physics: Conference Series 150(3), 032096 (2009). URL http://stacks.iop.org/1742-6596/150/i=3/a=032096
- (4) J. Nyéki, A. Phillis, A. Ho, D. Lee, P. Coleman, J. Parpia, B. Cowan, J. Saunders, Nature Physics 13, 455 (2017). URL http://dx.doi.org/10.1038/nphys4023
- (5) S. Nakamura, K. Matsui, T. Matsui, H. Fukuyama, Phys. Rev. B 94, 180501 (2016). DOI 10.1103/PhysRevB.94.180501. URL http://link.aps.org/doi/10.1103/PhysRevB.94.180501
- (6) K.R.A. Hazzard, Nature 543(7643), 47 (2017). URL http://dx.doi.org/10.1038/543047a
- (7) M. Bretz, Phys. Rev. Lett. 38, 501 (1977). DOI 10.1103/PhysRevLett.38.501. URL http://link.aps.org/doi/10.1103/PhysRevLett.38.501
- (8) S. Nakamura, K. Matsui, T. Matsui, H. Fukuyama, Journal of Low Temperature Physics 171(5–6), 711 (2013). DOI 10.1007/s10909-012-0847-5. URL http://dx.doi.org/10.1007/s10909-012-0847-5
- (9) Panasonic Corporation, Automotive & Industrial Systems Company
- (10) S. Nakamura, D. Miyafuji, T. Fujii, T. Matsui, H. Fukuyama, Cryogenics 86, 118 (2017). DOI http://dx.doi.org/10.1016/j.cryogenics.2017.08.004. URL http://www.sciencedirect.com/science/article/pii/S0011227517301212
- (11) VH-5000 Digital Microscope manufactured by Keyence Corporation.
- (12) JSM-6610LV manufactured by JEOL Ltd.
- (13) N. Nishiki, H. Take, M. Murakami, S. Yoshimura, K. Yoshino, IEEJ Transactions on Fundamentals and Materials 123(11), 1115 (2003). DOI 10.1541/ieejfms.123.1115. URL http://ci.nii.ac.jp/naid/10012555627/en/. (in Japanese)
- (14) M.C. Gordillo, J. Boronat, Phys. Rev. Lett. 102, 085303 (2009). DOI 10.1103/PhysRevLett.102.085303. URL https://link.aps.org/doi/10.1103/PhysRevLett.102.085303
- (15) Specially manufactured by Omicron Vakuumphysik GMBH based on their commercial model MICRO-STM
- (16) Y. Niimi, T. Matsui, H. Kambara, K. Tagami, M. Tsukada, H. Fukuyama, Phys. Rev. B 73, 085421 (2006). DOI 10.1103/PhysRevB.73.085421. URL https://link.aps.org/doi/10.1103/PhysRevB.73.085421
- (17) S. Nakamura, K. Matsui, T. Matsui, H. Fukuyama, Journal of Physics: Conference Series 400(3), 032061 (2012). URL http://stacks.iop.org/1742-6596/400/i=3/a=032061
- (18) Y. Niimi, S. Murakawa, Y. Matsumoto, H. Kambara, H. Fukuyama, Review of Scientific Instruments 74(10), 4448 (2003). DOI 10.1063/1.1606540. URL http://link.aip.org/link/?RSI/74/4448/1
- (19) Setra Systems, Inc.
- (20) T. Takaishi, Y. Sensui, Transactions of the Faraday Society 59, 2503 (1963)
- (21) J.K. Kjems, L. Passell, H. Taub, J.G. Dash, A.D. Novaco, Phys. Rev. B 13, 1446 (1976). DOI 10.1103/PhysRevB.13.1446. URL http://link.aps.org/doi/10.1103/PhysRevB.13.1446
- (22) E. Cheng, M.W. Cole, W.F. Saam, J. Treiner, Phys. Rev. B 46, 13967 (1992). DOI 10.1103/PhysRevB.46.13967. URL http://link.aps.org/doi/10.1103/PhysRevB.46.13967
- (23) S. Polanco, M. Bretz, Surface Science 94(1), 1 (1980). DOI http://dx.doi.org/10.1016/0039-6028(80)90152-1. URL http://www.sciencedirect.com/science/article/pii/0039602880901521
- (24) J. Maynard, M. Chan, Physica B+C 109, 2090 (1982). DOI http://dx.doi.org/10.1016/0378-4363(82)90585-X. URL http://www.sciencedirect.com/science/article/pii/037843638290585X
- (25) Y. Kubota, R. Toda, M. Kamada, S. Nakamura, T. Matsui, H. Fukuyama, Journal of Low Temperature Physics 175(1), 160 (2014). DOI 10.1007/s10909-013-1047-7. URL https://doi.org/10.1007/s10909-013-1047-7
- (26) D.S. Greywall, Phys. Rev. B 47, 309 (1993). DOI 10.1103/PhysRevB.47.309. URL https://link.aps.org/doi/10.1103/PhysRevB.47.309
- (27) D.R. Nelson, J.M. Kosterlitz, Phys. Rev. Lett. 39, 1201 (1977). DOI 10.1103/PhysRevLett.39.1201. URL https://link.aps.org/doi/10.1103/PhysRevLett.39.1201
- (28) I. Maccari, L. Benfatto, C. Castellani, Phys. Rev. B 96, 060508 (2017). DOI 10.1103/PhysRevB.96.060508. URL https://link.aps.org/doi/10.1103/PhysRevB.96.060508
- (29) RAMAN-FM-UTM manufactured by Nanophoton Corporation
- (30) V. Zolyómi, J. Koltai, J. Kürti, physica status solidi (b) 248(11), 2435 (2011). DOI 10.1002/pssb.201100295. URL http://dx.doi.org/10.1002/pssb.201100295
- (31) A.C. Ferrari, J. Robertson, Phys. Rev. B 61, 14095 (2000). DOI 10.1103/PhysRevB.61.14095. URL https://link.aps.org/doi/10.1103/PhysRevB.61.14095
- (32) A.C. Ferrari, J.C. Meyer, V. Scardaci, C. Casiraghi, M. Lazzeri, F. Mauri, S. Piscanec, D. Jiang, K.S. Novoselov, S. Roth, A.K. Geim, Phys. Rev. Lett. 97, 187401 (2006). DOI 10.1103/PhysRevLett.97.187401. URL http://link.aps.org/doi/10.1103/PhysRevLett.97.187401
- (33) S. Reich, C. Thomsen, Philosophical Transactions of the Royal Society of London A: Mathematical, Physical and Engineering Sciences 362(1824), 2271 (2004). DOI 10.1098/rsta.2004.1454
- (34) W. Bao, J. Wan, X. Han, X. Cai, H. Zhu, D. Kim, D. Ma, Y. Xu, J.N. Munday, H.D. Drew, M.S. Fuhrer, L. Hu, Nature Communications 5, 4224 (2014)