Lattice Dynamics of Ultrathin FeSe Films on SrTiO3
Abstract
Charge transfer and electron-phonon coupling (EPC) are proposed to be two important constituents associated with enhanced superconductivity in the single unit cell FeSe films on oxide surfaces. Using high-resolution electron energy loss spectroscopy combined with first-principles calculations, we have explored the lattice dynamics of ultrathin FeSe films grown on SrTiO3. We show that, despite the significant effect from the substrate on the electronic structure and superconductivity of the system, the FeSe phonons in the films are unaffected. The energy dispersion and linewidth associated with the Fe- and Se-derived vibrational modes are thickness- and temperature-independent. Theoretical calculations indicate the crucial role of antiferromagnetic correlation in FeSe to reproduce the experimental phonon dispersion. Importantly, the only detectable change due to the growth of FeSe films is the broadening of the Fuchs-Kliewer (F-K) phonons associated with the lattice vibrations of SrTiO3(001) substrate. If EPC plays any role in the enhancement of film superconductivity, it must be the interfacial coupling between the electrons in FeSe film and the F-K phonons from substrate rather than the phonons of FeSe.
I Introduction
The superconducting transition temperature (TC) for monolayer FeSe films, with the thickness of one unit cell (uc), on SrTiO3(001) substrate (1uc-FeSe/STO)Wang et al. (2012); Zhang et al. (2014a) is significantly enhanced to K Zhang et al. (2014b); Liu et al. (2012); Lee et al. (2014); Tan et al. (2013) (even probably up to 109 K Ge et al. (2015)) compared to bulk FeSe (8 K)Hsu et al. (2008). This discovery serves as a prototypical example of interfacial TC enhancement, which has drawn the attention of the communityLee (2015); Bozovic and Ahn (2014); Huang and Hoffman (2017); Wang et al. (2017a, 2016a). Although the mechanism of the interfacial TC enhancement is not fully understood, electron doping from STO substrates due to the oxygen vacanciesTan et al. (2013) or band bendingZhao et al. (2017) at interface is widely believed to be an indispensable ingredientHe et al. (2013, 2014). On the other hand, in the systems such as the intercalated (Li,Fe)OHFeSeLu et al. (2015); Zhao et al. (2016), and thick FeSe films/flakes with alkali metal adatomsSeo et al. (2016); Wen et al. (2016); Miyata et al. (2015); Song et al. (2016) or ionic liquid gatingShiogai et al. (2015); Lei et al. (2016); Hanzawa et al. (2016), where the electron density of the FeSe layer can reach a value as high as that in 1uc-FeSe/STO, the TC is enhanced only up to K. Thus, electron doping is not the only contributor to the increased TC. There must be other interfacial effects involved to give rise to the extra K enhancement in 1uc-FeSe/STO.
From the structural point of view, the tensile strain induced by lattice mismatchWang et al. (2012); Tan et al. (2013); Peng et al. (2014a) leads to the formation of strain stripsWang et al. (2012). The specific interfacial structure with a double-TiOx termination has been observed by scanning transmission electron microscopyLi et al. (2016); Zou et al. (2016), and thus the vibration of Ti-O bond might be crucial. Similar enhancement behavior has also been discovered in 1uc-FeSe grown on various oxide substrates with Ti-O bonds such as BaTiO3(001)Peng et al. (2014b), SrTiO3(110)Zhang et al. (2016a); Zhou et al. (2016), anatase TiO2(001)Ding et al. (2016), and rutile TiO2(001)Rebec et al. (2017), all with different lattice constants and crystal orientations. These results suggest that it is essential to understand the interfacial lattice dynamics.
From the dynamical point of view, phonons have been studied to elucidate the possible contribution to the interfacial enhancement. Some studies have proposed that Fe- and Se-derived phonons (FeSe phonons) could participate in the interfacial enhancement, which is supported by electron scattering with FeSe phonons in inelastic electron tunneling spectroscopy measurementsTang et al. (2016). Electron-phonon coupling (EPC) of FeSe phonons is also addressed by ab initio calculationsCoh et al. (2015); Wang et al. (2016b); Li et al. (2014). On the other hand, several investigations have shown that phonons from STO substrate can strongly interact with the electrons in the FeSe film as evidenced by the observations of FeSe band replicaLee et al. (2014); Rademaker et al. (2016); Lee (2015) in angle resolved photoemission spectroscopy (ARPES) measurements and the penetration of the STO Fuchs-Kliewer (F-K) phonons into FeSe film in high-resolution electron energy loss spectroscopy (HREELS) measurementsZhang et al. (2016b). However, none of the above studies provide the lattice dynamical information of FeSe films, such as the phonon energy and linewidth as a function of wavevector, which can be used to understand the EPC related to superconductivity enhancement.
If phonons are involved in the interfacial enhancement of TC, several essential questions arise: Which phonons provide the major contribution, the FeSe phonons in the thin film or the STO phonons in the substrate? As the dipole field generated by the STO phonons can penetrate into the thin FeSe filmZhang et al. (2016b), are the FeSe phonons affected by the STO lattice and its dynamics? In this paper, we address these questions by measuring the lattice dynamics using HREELS. We demonstrate that although the electronic structure and superconducting behavior vary in films with different thicknesses, the lattice dynamics (phonon spectra and Debye temperature) of Fe- and Se-derived phonons remain unchanged (from 1uc to 10uc thickness). Thus FeSe phonons are not the essential component in the enhanced interfacial superconductivity. Additionally, the first-principles calculation shows that the antiferromagnetic (AFM) correlation in FeSe is indispensable to quantitatively reproduce the experimental phonon dispersions in the ultrathin FeSe films, suggesting that the magnetic correlation or spin fluctuation is critical not only in FeSe bulkWang et al. (2016c, d) but also in 1uc-FeSe films. In contrast, surface F-K phonon modes of the STO(001) substrate are strongly temperature-dependent, and clearly broaden after the growth of FeSe films. These results indicate that the penetrating substrate F-K phonon field, interacting with electrons therein, provides additional glue for the existing electron pairing of FeSe.
II Experiments and Methods
Lattice dynamics including phonon spectraShukla et al. (2003); Gnezdilov et al. (2013); Mittal et al. (2009); Ksenofontov et al. (2010) and Debye temperatureKsenofontov et al. (2010); Gang et al. (2008); Lin et al. (2011); Lawless and Morrow (1977); Bell and Rupprecht (1963), can be obtained using techniques such as inelastic x-ray scatteringShukla et al. (2003), Raman scatteringGnezdilov et al. (2013), inelastic neutron scatteringMittal et al. (2009), nuclear inelastic scatteringKsenofontov et al. (2010),specific heatGang et al. (2008); Lin et al. (2011), elastic constantLawless and Morrow (1977); Bell and Rupprecht (1963), etc. These techniques, however, only measure the bulk properties of materials. Substrate effects on an individual phonon branch of ultrathin films, such as FeSe, can only be measured utilizing surface-sensitive techniques such as HREELS or inelastic helium atom scatteringBenedek et al. (2013). Due to the limitation of the polycrystal nature of FeSe bulk in pervious studiesKsenofontov et al. (2010); Phelan et al. (2009), the phonon dispersions of FeSe have not been obtained. Here, the combination of a momentum resolved surface-sensitive technique (HREELS) and the growth of high-quality single crystalline FeSe films allows for the first observation of the phonon dispersions.
II.1 Preparation of Oxide Substrates
In this study, HREELS measurements were performed on various different samples, including single crystalline oxides, oxide films, and ultrathin single crystalline FeSe films grown on single crystalline oxides. The samples and the preparation methods are summarized in Table.1. The Nb-doped (0.5%) SrTiO3 substrates are annealed at 600∘C for 12 h and then at 950∘C for 1 h in ultra-high vacuum (UHV) condition, which is labeled as ”treated STO” in the paper and is used as the substrate of FeSe films. The treated STO samples are covered by thick amorphous selenium layer at room temperature, and annealed at 600 ∘C to remove the Se capping layer before HREELS measurements. To compare with treated STO, another Nb-doped (0.5%) SrTiO3 substrate is etched by HF and annealed at 600 ∘C for 12 h before EELS measurement, which is labeled as ”clean STO” in this paper. 40uc SrTiO3 films without Nb doping are grown by pulsed laser deposition (PLD) at 600∘C in UHV condition and labeled as ”clean STO (w/o Nb)”. 40uc BaTiO3 films are grown by PLD at 670∘C in UHV condition. Both clean STO (w/o Nb) and BaTiO3 films are annealed at 600 ∘C for 12 h before EELS measurement. TiO2(110) substrates are annealed at 600∘C for 12 h and then at 900∘C for 1 min in UHV condition. The SrTiO3(110) substrates with two different surface reconstructions, 28 and 41 superlattices respect to the lattice of STO(110) surface, are prepared using the method in Ref.Cao et al., 2012.
| Labels | Substrate | Films | Substrate Preparation |
|---|---|---|---|
| treated STO | 0.5% Nb-doped SrTiO3(001) | - | 950∘C annealing and Se treatment |
| clean STO | 0.5% Nb-doped SrTiO3(001) | - | HF etching and 600∘C annealing |
| clean STO (w/o Nb) | 0.5% Nb-doped SrTiO3(001) | 40uc SrTiO3(001) film (w/o Nb) | HF etching and 600∘C annealing |
| 1uc-FeSe/STO | 0.5% Nb-doped SrTiO3(001) | 1uc FeSe films | 950∘C annealing and Se treatment |
| 3uc-FeSe/STO | 0.5% Nb-doped SrTiO3(001) | 3uc FeSe films | 950∘C annealing and Se treatment |
| 10uc-FeSe/STO | 0.5% Nb-doped SrTiO3(001) | 10uc FeSe films | 950∘C annealing and Se treatment |
| TiO2(110)(w/o Nb) | rutile TiO2(110) | - | 900∘C annealing |
| BaTiO3 (w/o Nb) | 0.5% Nb-doped SrTiO3(001) | 40uc BaTiO3(001) film (w/o Nb) | HF etching and 600∘C annealing |
| STO(110) 28 | 0.5% Nb-doped SrTiO3(110) | - | Ar+ ion sputtering and 1470∘C annealing |
| STO(110) 41 | 0.5% Nb-doped SrTiO3(110) | - | Ar+ ion sputtering and 1470∘C annealing |
II.2 Growth of FeSe films
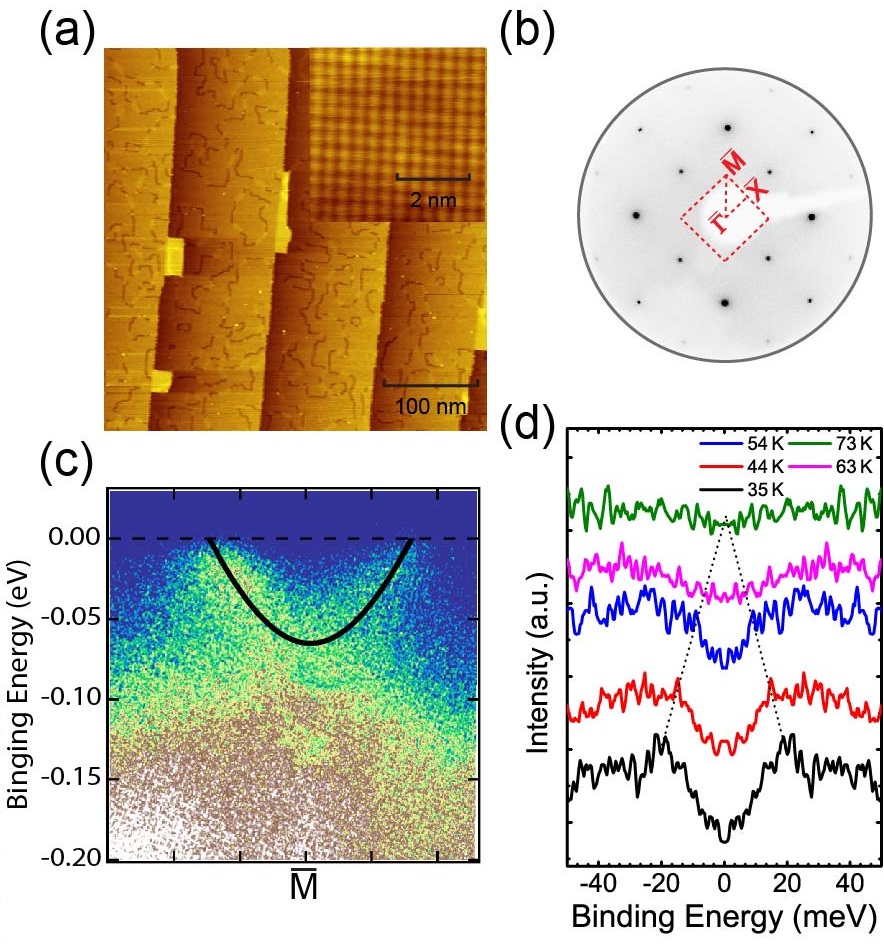
High-quality single crystalline FeSe films were grown by co-depositing high-purity Fe (99.99%) and Se (99.99+%) with a flux ratio of onto the treated STO held at 400 ∘C. The as-prepared samples were post-annealed at 470 ∘C for 5 h in UHV to make the first layer FeSe superconducting. The in-situ scanning tunneling microscopy (STM) measurements were performed to confirm the sample quality [Fig. 1 (a)]. 1uc, 3uc and 10uc-FeSe/STO samples were capped with thick amorphous Se layer at 300 K and transferred to our two-dimensional (2D) HREELS systemZhu et al. (2015). The Se capping layer was removed by in-situ annealing at 450 ∘C for 1uc-FeSe/STO and 400 ∘C for 3uc and 10uc-FeSe/STO. ARPES measurements were performed for 1uc-FeSe/STO to determine the superconducting gap and the superconducting transition temperature K. The Debye temperature measurements were performed using low energy electron diffraction (LEED) on 1uc and 10uc-FeSe/STO samples.
II.3 ARPES Measurements
Angle resolved photoemission spectroscopy (ARPES) measurements were performed on 1uc-FeSe/STO samples using a He lamp (21.2 eV) and our 2D-HREELS analyzer along the direction, corresponding to the horizontal direction in the LEED pattern in Fig. 1(b). A parabolic electron band can be clearly observed in the spectrum [Fig. 1(c)]. Temperature-dependent EDCs symmetrized around reveal the superconducting gap at 35 K is meV, which closes between 63 K and 73 K [Fig. 1(d)].
II.4 Surface Debye Temperature Measurements
LEED has been used routinely to determine the surface Debye temperatureTabor et al. (1971); Jones et al. (1966); Reid (1970). According to the Debye-Waller theoryDebye (1913); Waller (1923), the coherent peak intensity will decay exponentially with increasing temperature due to the thermal vibrations. The time-averaged scattered intensity affected by thermal vibrations is given byJames (1952)
| (1) | ||||
with
| (2) |
and
| (3) |
where is the structure factor, is the diffraction vector , is the mean square displacement of the atoms′ thermal vibrations from their equilibrium position parallel to , is the wavelength of the scattered radiation, is the Bragg angle, is the Boltzmann constant, is the atomic mass, and is the Debye temperature.
The first term in Eq. 1 shows that the Bragg intensity is reduced by a prefactor . This prefactor is known as the Debye-Waller factor, containing the effect of the thermal vibrations of the atoms about their equilibrium position. Since the mean square of displacement from equilibrium will increase with increasing temperature [as shown in Eq. 2 and Eq. 3, is proportional to ], the thermal vibrations reduces exponentially the intensity of the Bragg peaksAshcroft and Mermin (1976). Accordingly, the temperature dependence of LEED spot intensity can be used to determine the Debye-Waller factor and calculate the surface Debye temperature. The second term in Eq. 1 represents the first order temperature diffuse scattering, which induces a background in LEED pattern and should be subtracted before calculating the Debye temperature.
II.5 HREELS Measurements
As a surface-sensitive technique, HREELS is an ideal candidate to study the interfacial lattice dynamics of FeSe/STO systems. Compared with conventional HREELS, our recently developed 2D-HREELS systemZhu et al. (2015) can directly map a 2D energy-momentum dispersion over a very large momentum range without mechanically rotating sample, monochromator, or analyzer. Phonon spectra measurements were performed by the 2D-HREELS on 1uc, 3uc and 10uc-FeSe/STO samples.
In HREELS, a monochromic electron beam with energy incident on the sample surface may interact with surface elementary excitations such as phonons, and be scattered with the final energy . The energy loss represents the energy of surface excitations. In our HREELS measurements, the incident electron beam energies are =50 eV and 80 eV for the scattering direction along the and directions, respectively, and the incident angle() is 60∘ with respect to the surface normal. The surface phonon momentum can be determined from the scattering angles by when Eloss Ei, where is the electron mass, and are the angles of the incident and scattered electrons, respectively. The energy and momentum resolutions of HREELS in this study are 3 meV and , respectively.
For most samples, the HREELS measurements were carried out along both and directions with the sample temperature ranging from 35 K to 300 K.
II.6 First Principles Calculation Details
For the calculations of FeSe phonon dispersions, we use the frozen-phonon method as implemented in the phonopy code Togo and Tanaka (2015) by performing density functional theory (DFT) calculations to extract the interatomic force constant matrix. The DFT calculations are performed using the plane wave projector augmented wave (PAW) method Blöchl (1994) as implemented in the VASP code Kresse and Furthmüller (1996); Kresse and Joubert (1999). The phonon dispersion calculated with the frozen-phonon method and VASP code (FP/VASP) is compared with the phonon dispersion calculated with the density functional perturbation theory (DFPT) method as implemented in the Quantum espresso packageGiannozzi et al. (2009) (DFPT/QE), and they agree with each other well with a maximum difference less than meV. In the DFPT/QE calculations, we use the plane wave ultrasoft pseudopotential method and the GBRV pseudopotential libraryGarrity et al. (2014). In both FP/VASP and DFPT/QE calculations, we take the exchange-correlation functional in the generalized gradient approximation (GGA) of Perdew-Burke-Ernzerhof (PBE) typePerdew et al. (1996).
In experiment the monolayer FeSe thin film is deposited on the SrTiO3 substrate, which exerts strong tensile strain on the monolayer FeSe. To take into account this effect, in the calculations we set the in-plane lattice parameter Å for the monolayer FeSe thin film, the same as the lattice parameter for a bulk SrTiO3 crystal. Lattice constants corresponding to the 3 and 10 unit cell FeSe films are extracted from Ref.Peng et al., 2014a. We place a vacuum layer around Å in height above the monolayer FeSe before it is repeated in the direction. Before phonon dispersion calculations, the internal atomic coordinates are relaxed until a force smaller than meV/Å is found on each atom. We have performed phonon dispersion calculations for both nonmagnetic (NM) and checkerboard antiferromagnetic (cAFM) phases and find that the phonon dispersion of the cAFM phase quantitatively agrees with the EELS experiment much better than that of NM phase. For the VASP monolayer FeSe calculations k-point grids were used to relax the atoms in the unit cells and k-grids were used in supercells to compute the phonon dispersions. For the VASP bulk FeSe calculations k-point grids were used to relax the atoms in the unit cells and k-grids were used in supercells to compute the phonon dispersions. For all VASP calculations a 500 eV kinetic energy cutoff was employed.
III Results
III.1 Surface Phonon Spectra
The HREELS results are summarized in Fig. 2. Figure 2(a) is a schematic drawing of the FeSe layer on SrTiO3. The FeSe lattice is consisted of Se-Fe-Se triple layers stacked by van der Waals forces, with the primitive unit cell containing two Fe atoms and two Se atoms. In each Se-Fe-Se triple layer, Fe atoms form a square lattice and Se atoms staggered above and below the Fe plane, as shown in Fig. 2(c). The film with 1uc thickness ( 5.5 Å) corresponds to one Se-Fe-Se triple layer. Figures 2(b) and 2(c) depict the vibrational modes of some relevant optical phonons at of the STO and FeSe, respectively. To illustrate the phonon dispersions at 1uc-FeSe/STO surface, in Figs. 2(d) and 2(e), we show a typical 2D-HREELS energy-momentum mapping for the 1uc-FeSe/STO(001) sample along direction at 36 K.
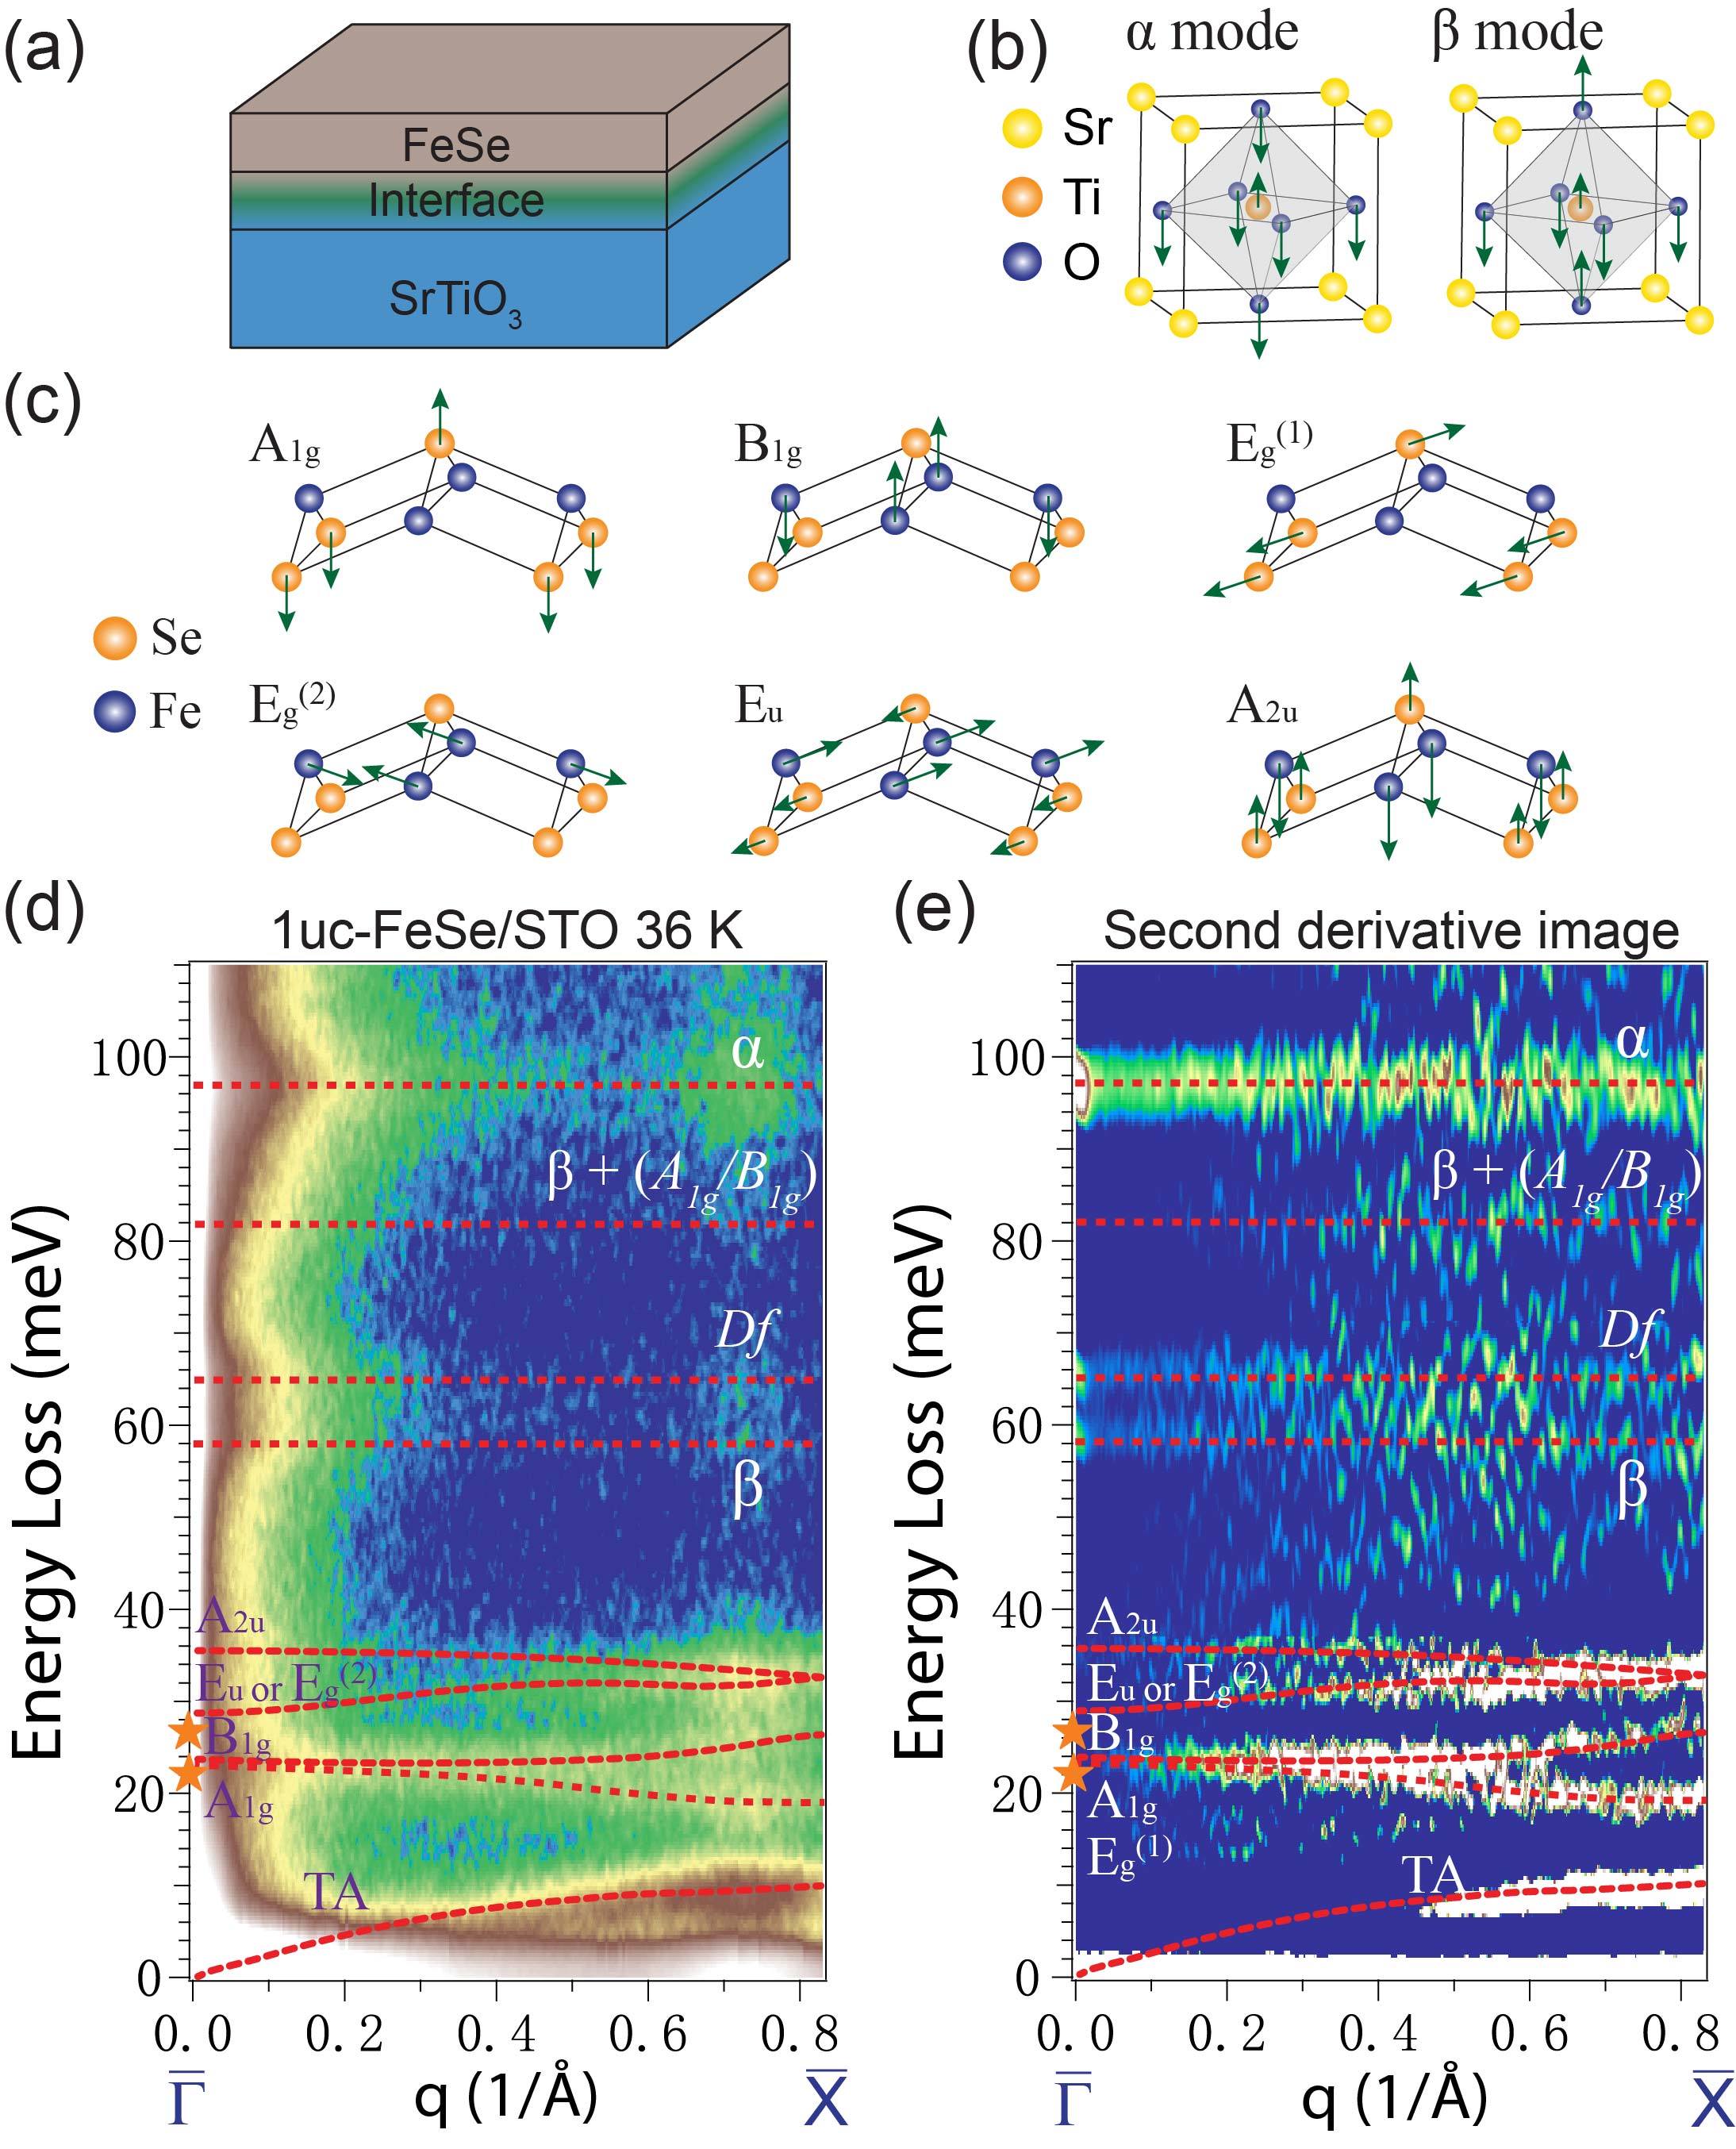
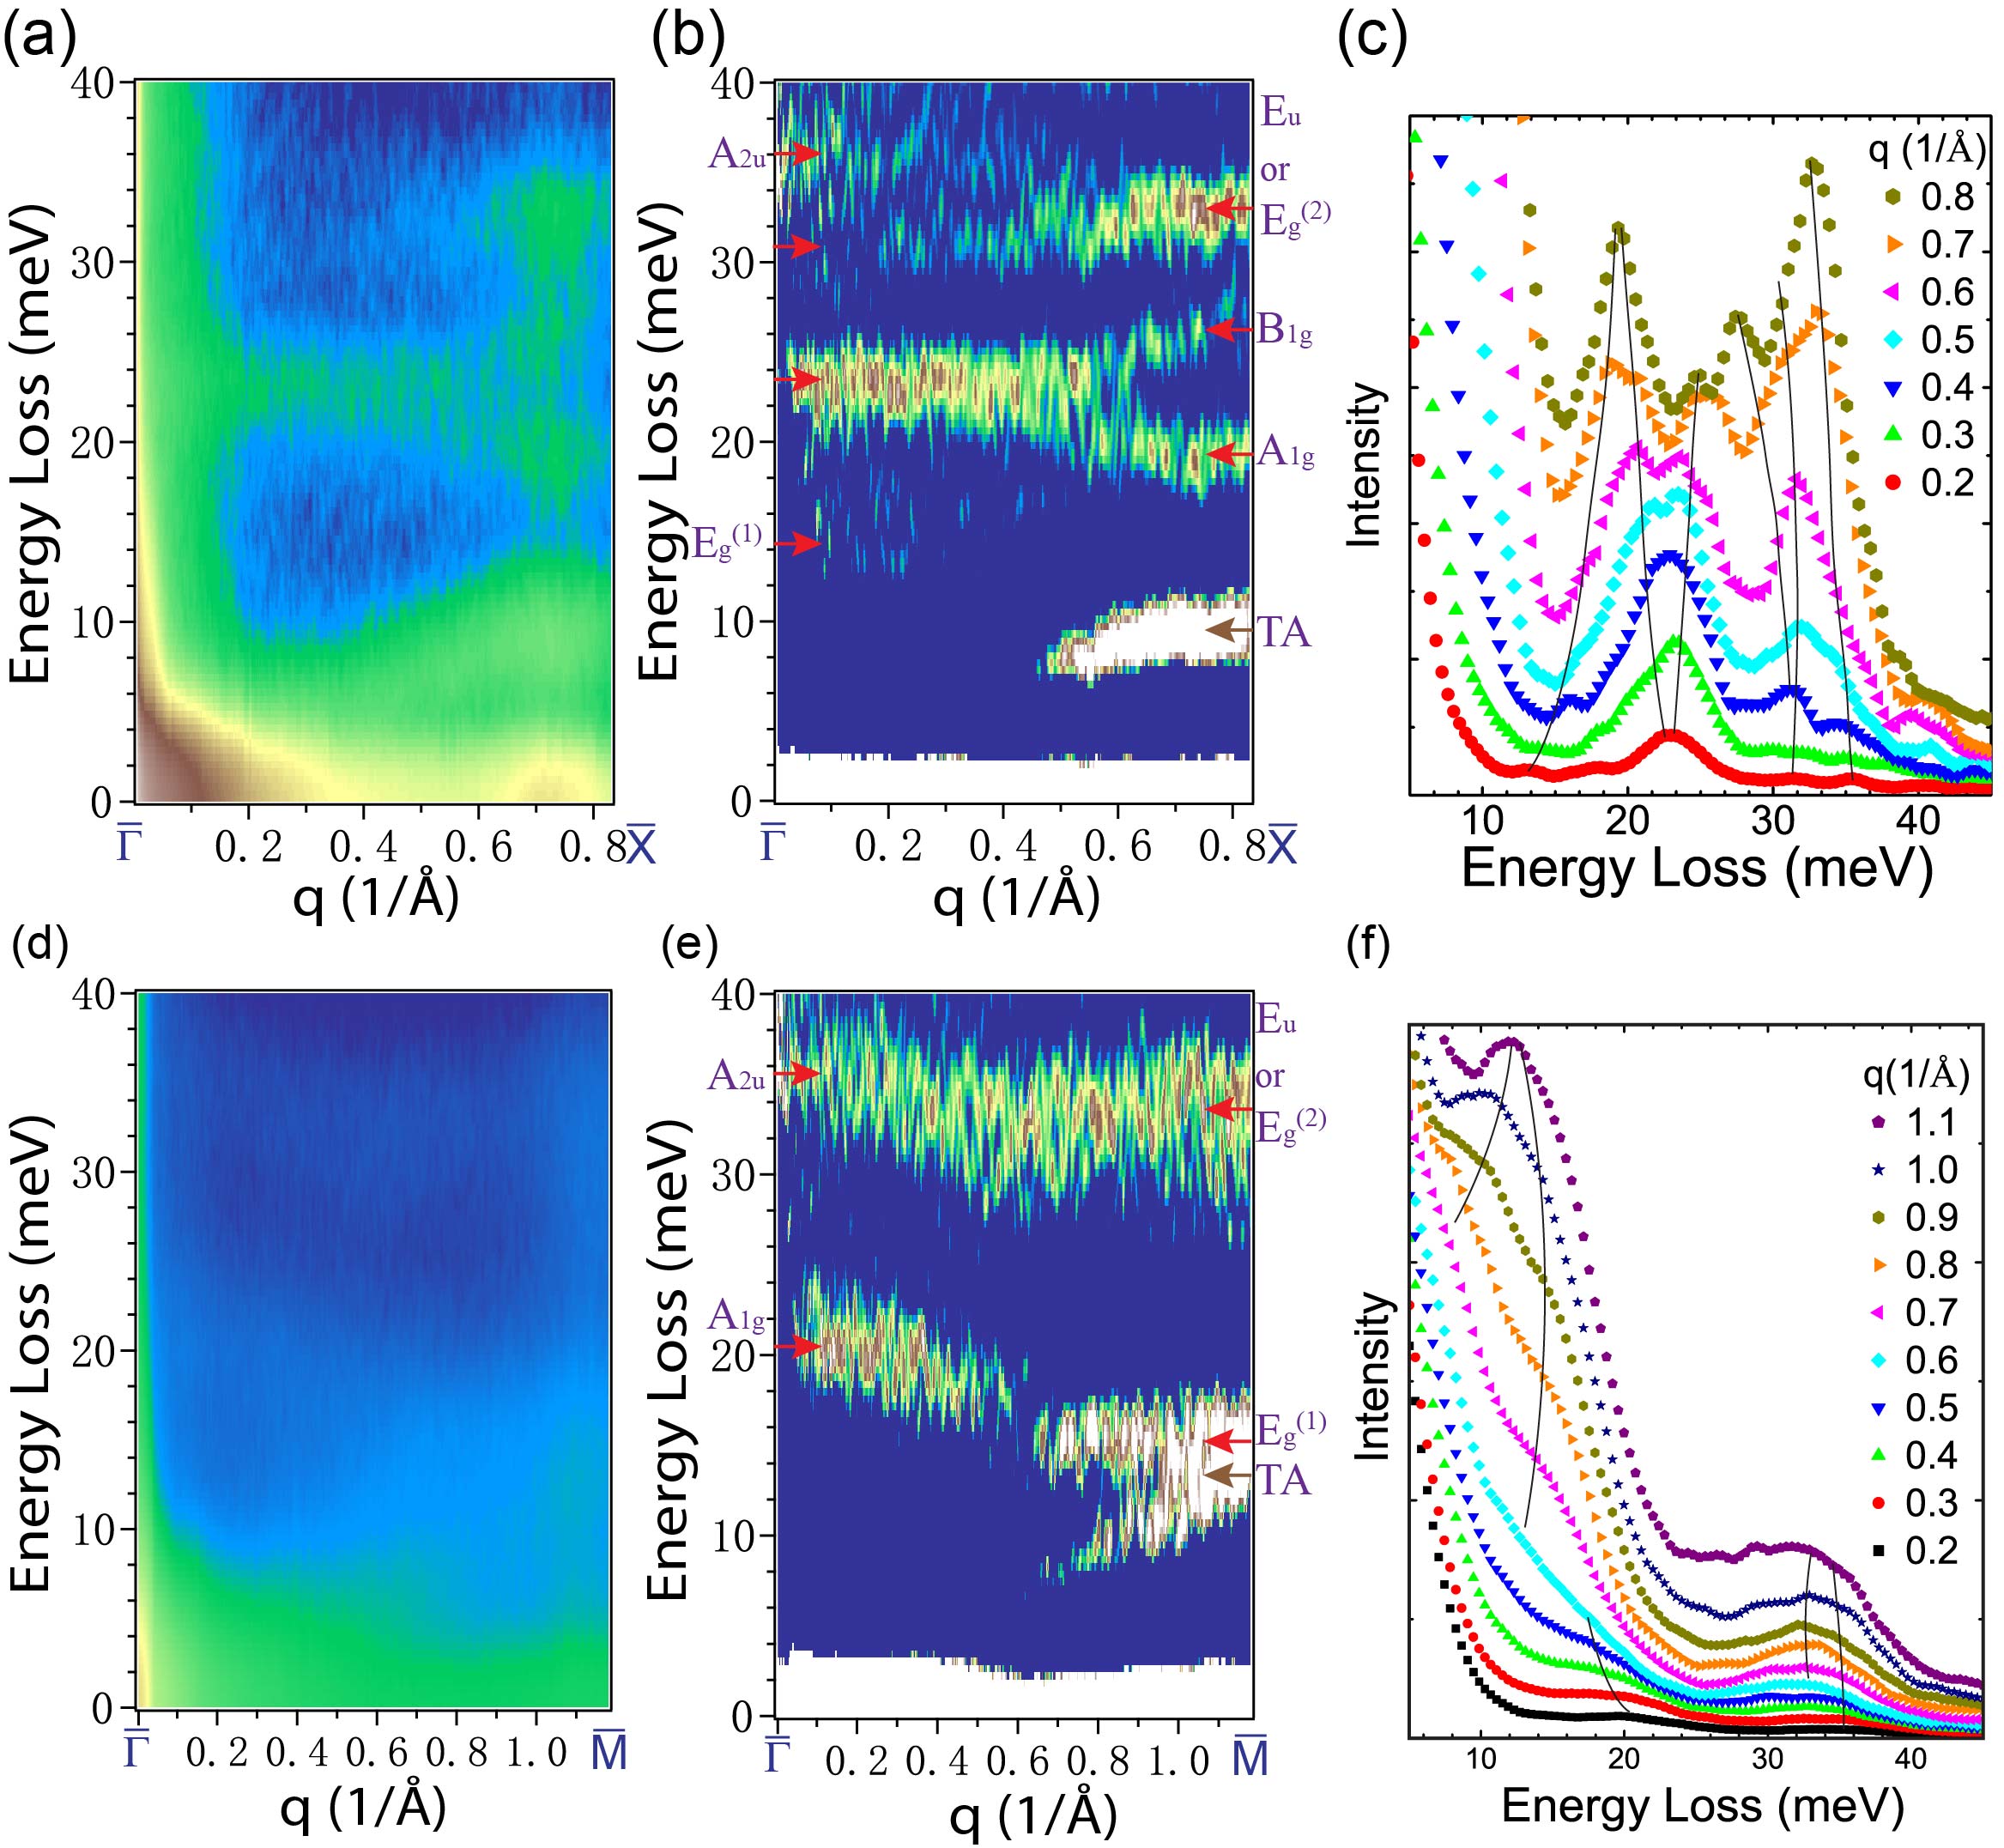
In a HREELS measurement, there are two scattering mechanismsIbach and Mills (1982). One is referred to as impact scattering, where the incident electrons are scattered by impacting with nuclei of the sample. In this mechanism, the penetration depth or free electron path of incident electrons (with the energy of 50 eV) is nearly three atomic layers, i.e., around one Se-Fe-Se triple layer (one unit cell thick in c direction of FeSe crystal). In this context, most the detected signals of FeSe phonons come from the topmost Se-Fe-Se layer of FeSe films. In the low energy range 0-40 meV (Fig. 3), five Fe- and Se-derived phonon branches are clearly observed: one acoustic branch with energy from 0 - 8 meV, and the other four optical branches with energies ranging from 18 - 40 meV. Another branch around 15 meV [ mode] has a very weak signal that is barely discernible in the second derivative image from the data at T=35 K. The energies of two bulk phonon modes determined from Raman scattering experimentGnezdilov et al. (2013) are also labeled at the point in Figs. 2(d) and 2(e), indicating that the corresponding phonon energies of single layer FeSe films are similar to the bulk modes.
The other mechanism is called dipole scattering, where the incident electrons are scattered by dipole fields generated by ionic vibrations. The ultra-sensitivity to F-K phonons in HREELS measurements is due to this mechanism. In this case, the incident electrons may scatter outside the surface nuclei position, depending on the strength of the dipole field. The STO substrate has two obvious F-K surface phonons, labeled by and , which can generate strong electric fields and penetrate through FeSe films. The buried STO signal can be observed because the electrons in FeSe layers can not completely screen the electric field from the F-K phononsZhang et al. (2016b).
III.2 Thickness Independence of FeSe phonons
III.2.1 Surface Phonon Dispersions
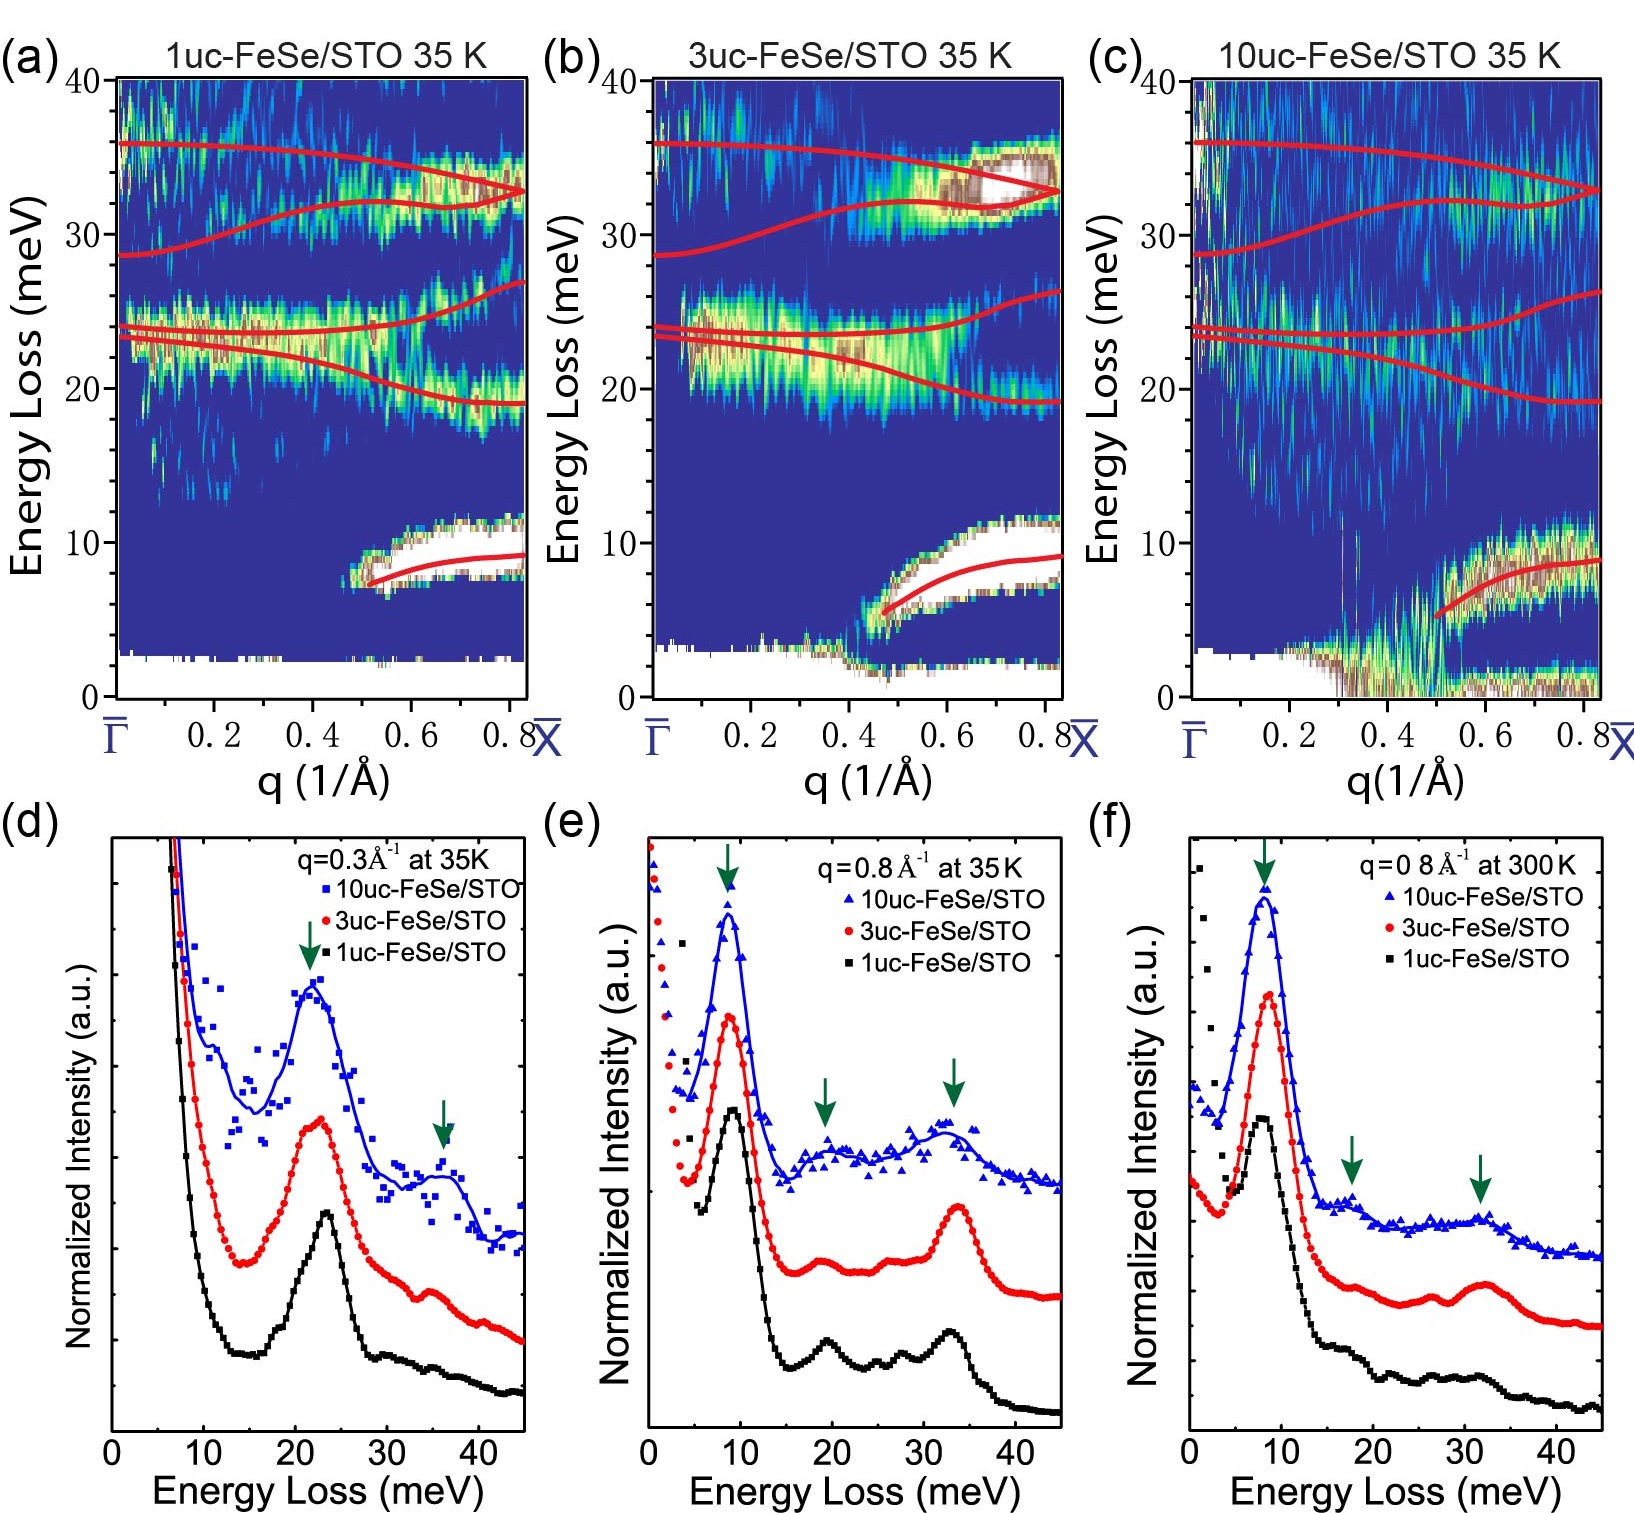
To check the substrate effect on the FeSe phonons as a function of film thickness, phonon spectra of 3uc and 10uc-FeSe/STO are also measured, and compared with 1uc-FeSe/STO in Fig. 4. Phonon energies and dispersions of thick FeSe films show no obvious difference (within the energy resolution) compared to the phonons of 1uc-FeSe films at 35 K. This indicates that charge transfer or other interfacial coupling such as tensile strain does not renormalize the phonon dispersions. As shown by the energy distribution curves (EDCs) at different momentum points in Figs. 4(d) - 4(f), the linewidths of FeSe phonons in different thickness samples are also similar and all close to the instrument resolution. Since the linewidths and dispersion profiles of phonons can reflect the strength of mode-specific EPCZhu et al. (2011), the similar linewidth and dispersion for different thickness films provide evidence that the EPC from FeSe phonons is not altered by the existence of substrate or the thickness of the film. Thus, FeSe phonons are not directly related to the interfacial TC enhancement.
III.2.2 Surface Debye Temperature
The thickness independence of FeSe phonons is further confirmed by the measurements of the surface Debye temperature. To check the lattice contribution in electron pairing, Debye temperature () is a vital factor in the McMillan equationMcMillan (1968) and sets the energy scale for in the standard BCS approach in bulk iron pnictidesGang et al. (2008); Boeri et al. (2008). We use the surface sensitive probe LEED to determine the surface Debye temperature (see Section II D for details of this technique).
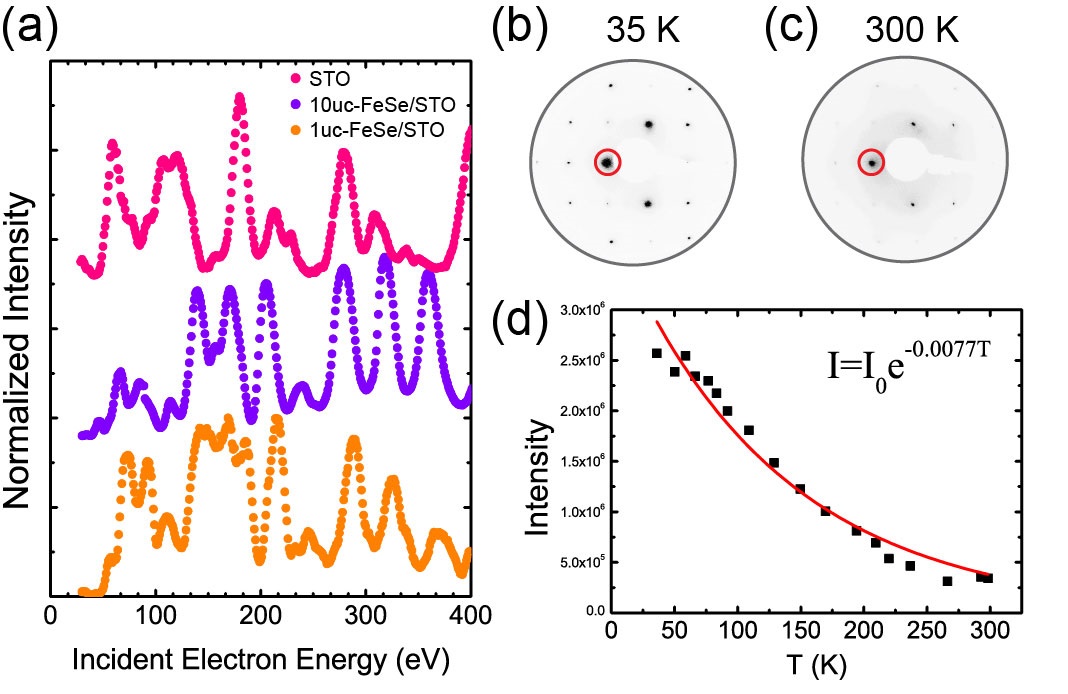
We performed LEED I/V measurements to determine the positions of the Bragg peaks (Bragg positions) for three different samples: STO, 1uc-FeSe/STO and 10uc-FeSe/STO as shown in Fig. 5(a). To acquire the Debye-Waller factor, LEED I/V spectra measurements were performed at different temperatures from 35 - 300 K. Figures 5(b) and 5(c) show the LEED patterns of 1uc-FeSe/STO at 35 K and 300 K respectively. Clearly, the spot intensity at 35 K [Fig. 5(b)] is much stronger than that at 300 K [Fig. 5(c)] because of the reduced thermal vibrations. The spot intensities as a function of temperature at a given voltage (Bragg positions) are plotted and fitted exponentially with to determine the Debye temperature. As an example of the analysis, the LEED (00) spot intensity for 1uc-FeSe/STO at 220 eV is shown in Fig. 5(d), giving K. In the fitting, we approximate the Bragg angle as 90∘, and the average atomic mass of FeSe. The average surface Debye temperature measured from different Bragg positions is K for 1uc-FeSe/STO and K for 10uc-FeSe/STO, showing no obvious difference within the statistical error. The surface Debye temperatures for the two different film thicknesses are both located in the range of reported values for bulk FeSe, from 210 K (measured by specific heatLin et al. (2011)) to 285 K (measured by 57Fe nuclear inelastic scatteringKsenofontov et al. (2010)).
III.3 Changes of Substrate Phonons
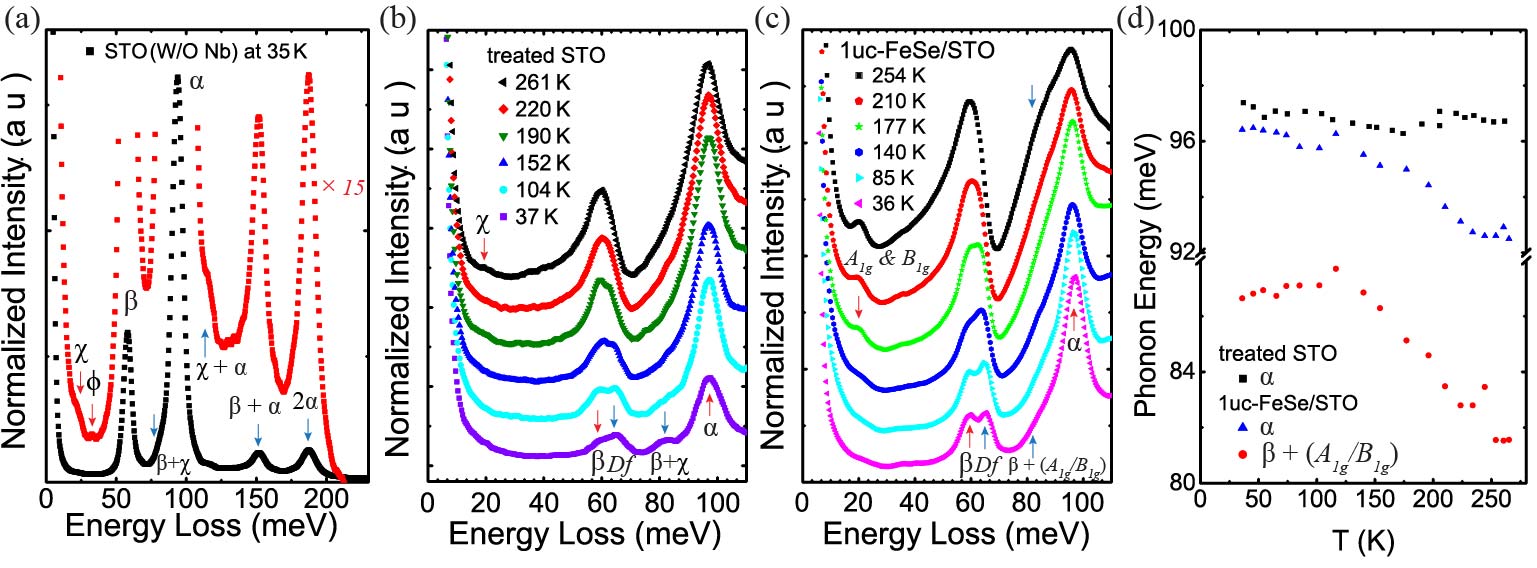
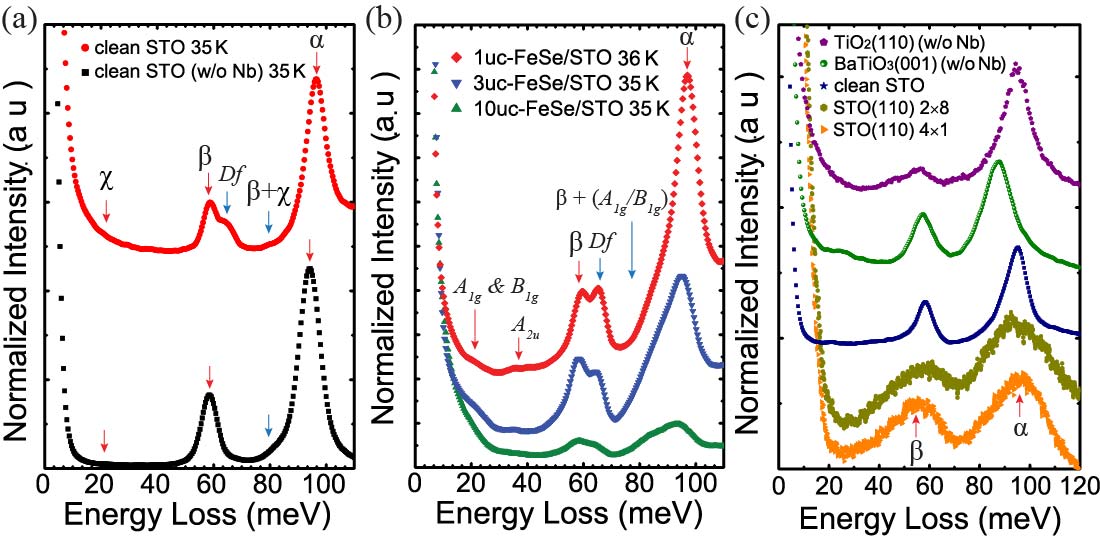
In stark contrast to the unflappable FeSe phonons, the F-K phonons of STO substrate respond to every change in the system. As shown in Fig. 6 and Fig. 7, the phonon spectra of the F-K modes for various samples are plotted for comparison. The F-K phonons from the 1uc-FeSe/STO surface show several important features: (1) appearance of new energy loss modes; (2) dramatic temperature dependence; and (3) linewidth broadening compared to the F-K modes of clean STO.
III.3.1 Appearance of new energy loss modes
The first feature is the appearance of new energy loss modes, and + A1g/B1g, as shown in Figs. 6(b), 6(c) and Figs. 7(a), 7(b). It turns out that the originates from Nb-induced defects in STO substrate and the + A1g/B1g mode is an overtone of mode in STO and A1g or B1g mode in FeSe films.
To illuminate the origin of the new energy loss modes, all energy loss modes observed on clean STO (w/o Nb) surface are labeled in Fig. 6(a) and summarized in Table.2. There are 4 optical phonon modes and 4 overtones. The overtone of modes can also be observed on treated STO surface as shown in Fig. 6(b). After the growth of FeSe films, A and B modes from Fe- and Se-derived phonons are also involved into the overtone [labeled as + A/B in Fig. 6(c)] with the energy similar to mode. Thus, thicker FeSe films have larger intensity ratio , as shown in Fig. 7(b).
For STO with Nb doping, a new energy loss mode with 65.3 meV labeled by emerges as shown Fig. 6(b), while this mode does not exist in samples without Nb-doping. Thus the mode should originate from Nb-induced defects in STO substrate. It is well-known that the superconducting behavior of FeSe films does not depend on Nb-doping of the STO substrate, thus the mode is not related to the TC in 1uc-FeSe/STO samples.
| Phonon Mode | Phonon Energy (meV) | Overtone | Overtone Energy (meV) |
| 22.8 | 84.2 | ||
| 32.9 | 115.9 | ||
| 58.9 | 152.2 | ||
| 94.6 | 188.1 |
III.3.2 Dramatic temperature dependence
The second feature is the dramatic temperature dependence in phonon energy of F-K phonons as shown in Fig. 6(c). From the comparison between Figs. 6(b) and 6(c), the line profile of the energy loss spectra is different with or without the growth of FeSe films. The difference of temperature-dependent line profile contains two part of contributions: (1) overtone of and A/B; (2) energy softening caused by anharmonic phonon-phonon interaction.
First, as observed from Figs. 6(b) and 6(c), the intensity of A and B modes in FeSe films increase with increasing temperature, thus the intensity of the overtone + A/B becomes stronger at high temperature than that of on treated STO surface.
Second, on 1uc-FeSe/STO surface [Fig. 6(d)]), the energy of mode is strongly temperature-dependent, softening from 97 meV at 35 K to 92 meV at 254 K. In contrast, it is almost temperature-independent on all STO substrates without FeSe. This energy shift accompanied with linewidth broadening is due to the anharmonic phonon-phonon interaction, which will lead to the decay of F-K modes into other low energy FeSe phonons. The low energy FeSe phonons provide more possible decay channels for the F-K phononsZhang et al. (2016b). As an example in MgB2Yildirim et al. (2001), the anharmonic phonon-phonon interaction can adjust the band structure and then generate strong EPC. Thus, F-K phonons from the STO substrate and interfacial electronic structure might be critical to reveal the interfacial EPC.
| mode | clean STO (w/o Nb) | clean STO | 1uc-FeSe/STO | 3uc-FeSe/STO | 10uc-FeSe/STO | |
|---|---|---|---|---|---|---|
| Energy (meV) | 94.1 | 96.5 | 96.9 | 96.4 | 93.4 | |
| 59.0 | 58.8 | 59.3 | 58.3 | 58.6 | ||
| Linewidth (meV) | 6.0 | 7.0 | 7.4-10.21 | 9.7 | 13.7 | |
| 1.6 | 2.9 | 1.8-3.41 | 5.6 | 8.3 |
-
1
The linewidth of 1uc-FeSe/STO varies with the substrate batches and film growth conditions. The average value is 9.11.5 meV for mode, and 2.40.9 meV for mode.
III.3.3 Linewidth broadening compared to the F-K modes of clean STO
The third feature is that the linewidths () of F-K phonon modes associated with 1uc-FeSe/STO are larger than those of clean STO(001) as illustrated in Table.3. The phonon linewidth broadening can be either from EPC or anharmonic phonon-phonon interaction. The phonon-phonon interactions are strongly temperature dependent and can be neglected at low temperature. So the strength of the mode-specific EPC is approximately proportional to the phonon linewidth at 35 K. After the growth of FeSe film, the linewidth of mode ( 9.11.5 meV) is broadened comparing to that of clean STO ( 6.50.7 meV). This linewidth broadening is a signature of EPC enhancement, implying the penetrated F-K phonons do interact with electrons in FeSe films. While the broadening of the mode is less obvious than the mode, indicating a relatively weaker coupling between electrons and the mode. However, this broadening at q = 0 is currently a challenge for theoryWang et al. (2017b); Zhou and Millis (2017) of interfacial e-ph coupling, rooted in Migdal-Eliashberg-based approaches with dynamics screening.
Additionally thicker FeSe films accompany with larger linewidth, also shown in Table.3. Since the electric field generated by STO F-K phonons can penetrate into FeSe films, F-K phonons from substrate STO interact with all the electrons in FeSe films. The total amount of electrons in FeSe films increase with increasing thickness, thus the linewidth broadening of the F-K phonon is an additive effect layer by layer with the growth of FeSe films. As a result, thicker FeSe films will always show a larger phonon linewidth than that of thinner films. Electrons in the FeSe layer closest to FeSe/STO interface contribute the largest electron-phonon coupling. This contribution becomes smaller in the layers further from the interface, because the electric field decays exponentially inside the FeSe flimsZhang et al. (2016b).
If EPC of F-K phonons play a vital role on the superconductivity of FeSe films, these high energy F-K phonons should also be present in a variety of oxide substrates. Surface phonons on other oxides, such as rutile TiO2(110), BaTiO3(001) and SrTiO3(110)Cao et al. (2012), are measured and shown in Fig. 7(c). As a ubiquitous characteristic of oxidesFuchs and Kliewer (1965), all those sample surfaces have F-K phonons with similar energies that are accompanied with strong electric field, independent of the crystal orientation, surface reconstruction, crystal symmetry, or lattice constant. These facts establish the critical role played by oxide F-K phonons on the TC enhancement at FeSe/oxides interface. Thus the specific F-K phonon energy scale 100 meV and the metal-oxygen chemical bond strength should be vital for the interfacial TC enhancement.
III.4 First-principles Calculations and the Magnetic Structure in FeSe films
Although the F-K phonons from STO substrate play an essential role, the enhancement in FeSe-derived systems without the substrate indicate that these modes do not act alone. Magnetic interactions have been always speculated as one of the most possible candidate origins of the pairing in FeSe bulk. However, the existence of magnetic interaction in FeSe/STO is still elusive, due to the limitation of the experimental techniques to measure the magnetic ordering of ultrathin films. In this study our first-principles calculation results show that the AFM correlation in FeSe is indispensable to quantitatively reproduce the experimental phonon dispersions in the ultrathin FeSe films.
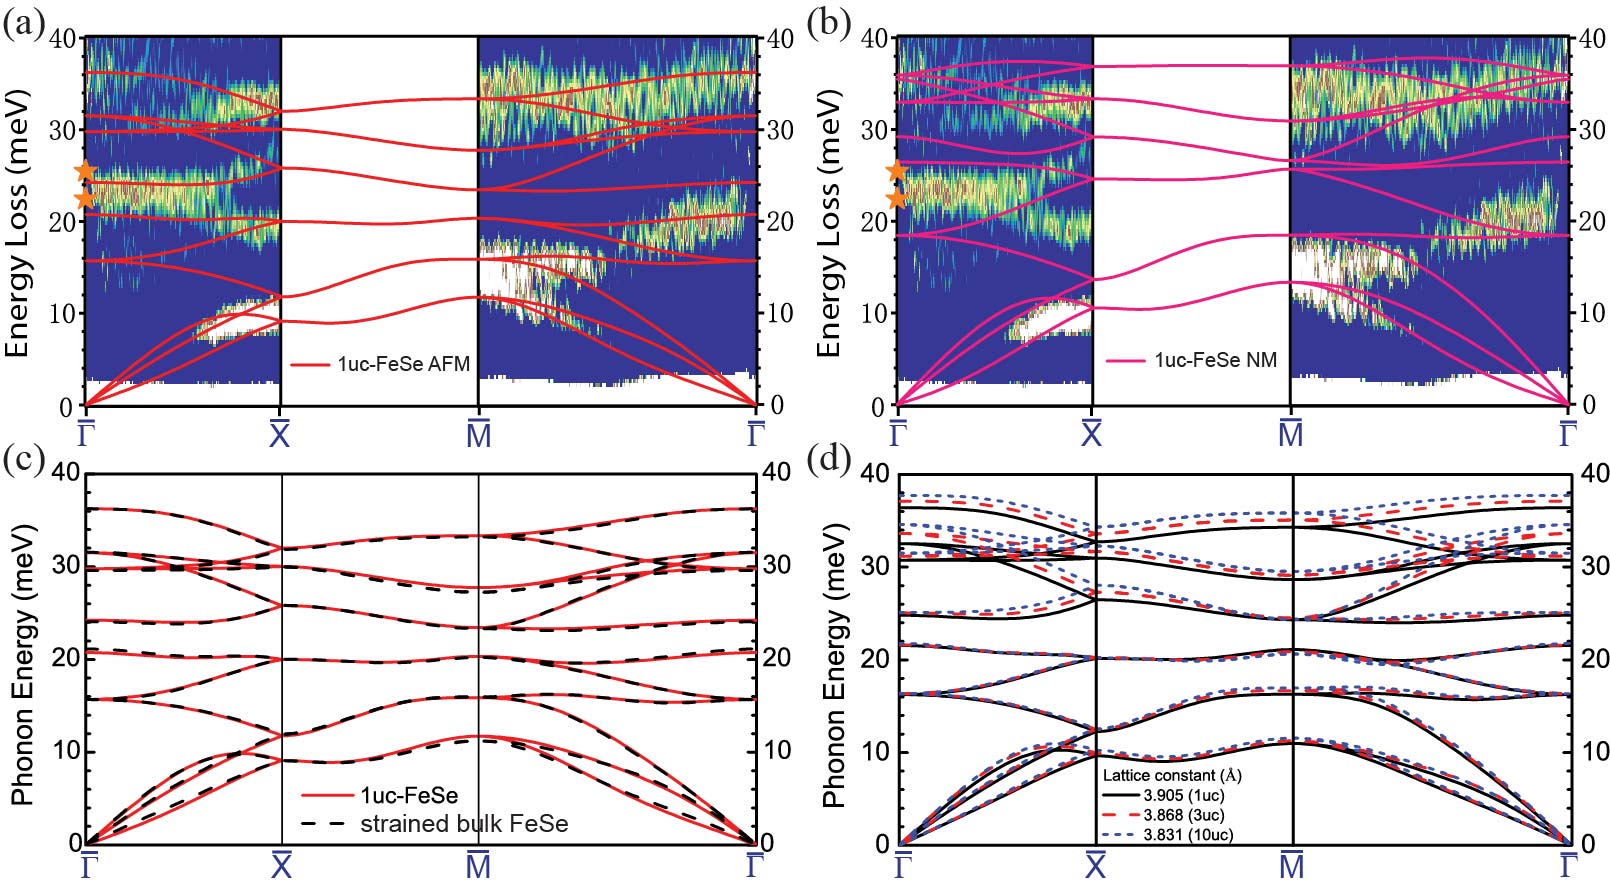
First-principles calculations are performed to calculate the dispersions of the Fe- and Se-derived phonons in the single layer FeSe film. The technical details of computation have been given in Section II F. In the calculations, when the AFM spin configuration on Fe lattice is taken into account, the total energy per Fe is 103 meV lower compared to the non-magnetic configuration. Moreover, the AFM results exhibit significant phonon energy renormalization and provide much better consistency with our experimental results than these from nonmagnetic structure, as shown in Figs. 8(a) and 8(b). In addition, these figures show that the AFM calculations agree better with Raman scattering at 7 KGnezdilov et al. (2013) compared to the NM calculations. We note that phonon bands 6 and 7 (counting from the low energy bands) at in the AFM and NM calculations correspond to the A1g(Se) and B1g(Fe) modes respectively. These results verify the existence of AFM correlations in single layer FeSe films, which implies spin fluctuation is still important to the superconductivity of single layer FeSe films, similar to the case in FeSe bulkWang et al. (2016c, d). As seen from the comparisons in Figs. 8(c) and 8(d), film thicknesses and lattice constant cannot significantly modify the energies of FeSe phonons, which is also consistent with the HREELS experimental results. The unflappable FeSe phonons for different film thickness suggest that similar magnetic moments or AFM correlations are possessed by Fe atoms for various thickness FeSe films, since the phonon energy directly reflects the AFM ground state of FeSe as discussed above. As a result, from a similar strength of AFM correlations, the spin fluctuations are not expected to be enhanced from the FeSe bulk to thin films. Rather than directly increasing the AFM correlation in the films to enhance the superconductivity mediated by the spin fluctuations, the F-K phonons of STO must take effect by itself or in an indirect way to give a significantly higher , which requires further theoretical and experimental investigations.
IV Conclusion
In summary, although the electronic structure is tuned by STO substrates, lattice dynamics of FeSe films are unaffected. The phonon energy dispersions associated with the Fe and Se atoms are not only temperature-independent but also thickness-independent. In contrast, the F-K phonons of STO substrate are strongly temperature-dependent in line profile, and change drastically with or without FeSe films. Therefore, if there is EPC which could enhance the interfacial superconductivity, it must be the interaction between the F-K modes of the substrate (with electric field penetrating into the film) and electrons in the FeSe film. Coupling to the FeSe derived phonon modes does not increase the superconducting . Moreover, combination of the calculations and experimental phonon dispersions strongly suggest the existence of AFM correlations in 1uc-FeSe/STO, which is also verified to be thickness-independent. Since the superconductivity pairing mechanism of bulk FeSe is still elusive, how the F-K phonon modes in the substrates enhance the existing pairing still needs to be elucidated in future studies.
Acknowledgements
The work was supported by the National Natural Science Foundation of China (No. 11634016), the National Key R&D Program of China (No. 2017YFA0303600). X. Z. was partially supported by the Youth Innovation Promotion Association of Chinese Academy of Sciences (CAS), and the Open Research Fund Program of the State Key Laboratory of Low-Dimensional Quantum Physics. Y. W. was supported by the U.S. Department of Energy, Office of Basic Energy Sciences, Materials Sciences and Engineering Division. Part of this work (T. B.) was conducted at the Center for Nanophase Materials Sciences, sponsored by the Scientific User Facilities Division (SUFD), Basic Energy Sciences (BES), DOE, under contract with UT-Battelle. CPU time was provided in part by resources supported by the University of Tennessee and Oak Ridge National Laboratory Joint Institute for Computational Sciences (http://www.jics.utk.edu). This research used resources of the National Energy Research Scientific Computing Center, a DOE Office of Science User Facility supported by the Office of Science of the U.S. DOE under Contract No. DE-AC02-05CH11231. J. Z. was partially supported by U.S. NSF through Grant No. DMR 1608865, and the sabbatical program of the Institute of Physics CAS.
References
- Wang et al. (2012) Q.-Y. Wang, Z. Li, W.-H. Zhang, Z.-C. Zhang, J.-S. Zhang, W. Li, H. Ding, Y.-B. Ou, P. Deng, K. Chang, J. Wen, C.-L. Song, K. He, J.-F. Jia, S.-H. Ji, Y.-Y. Wang, L.-L. Wang, X. Chen, X.-C. Ma, and Q.-K. Xue, Chinese Physics Letters 29, 037402 (2012).
- Zhang et al. (2014a) W.-H. Zhang, Y. Sun, J.-S. Zhang, F.-S. Li, M.-H. Guo, Y.-F. Zhao, H.-M. Zhang, J.-P. Peng, Y. Xing, H.-C. Wang, T. Fujita, A. Hirata, Z. Li, H. Ding, C.-J. Tang, M. Wang, Q.-Y. Wang, K. He, S.-H. Ji, X. Chen, J.-F. Wang, Z.-C. Xia, L. Li, Y.-Y. Wang, J. Wang, L.-L. Wang, M.-W. Chen, Q.-K. Xue, and X.-C. Ma, Chinese Physics Letters 31, 017401 (2014a).
- Zhang et al. (2014b) W. Zhang, Z. Li, F. Li, H. Zhang, J. Peng, C. Tang, Q. Wang, K. He, X. Chen, L. Wang, X. Ma, and Q.-K. Xue, Phys. Rev. B 89, 060506 (2014b).
- Liu et al. (2012) D. Liu, W. Zhang, D. Mou, J. He, Y.-B. Ou, Q.-Y. Wang, Z. Li, L. Wang, L. Zhao, S. He, et al., Nature communications 3, 931 (2012).
- Lee et al. (2014) J. Lee, F. Schmitt, R. Moore, S. Johnston, Y.-T. Cui, W. Li, M. Yi, Z. Liu, M. Hashimoto, Y. Zhang, et al., Nature 515, 245 (2014).
- Tan et al. (2013) S. Tan, Y. Zhang, M. Xia, Z. Ye, F. Chen, X. Xie, R. Peng, D. Xu, Q. Fan, H. Xu, et al., Nature materials 12, 634 (2013).
- Ge et al. (2015) J.-F. Ge, Z.-L. Liu, C. Liu, C.-L. Gao, D. Qian, Q.-K. Xue, Y. Liu, and J.-F. Jia, Nature materials 14, 285 (2015).
- Hsu et al. (2008) F.-C. Hsu, J.-Y. Luo, K.-W. Yeh, T.-K. Chen, T.-W. Huang, P. M. Wu, Y.-C. Lee, Y.-L. Huang, Y.-Y. Chu, D.-C. Yan, et al., Proceedings of the National Academy of Sciences 105, 14262 (2008).
- Lee (2015) D.-H. Lee, Chinese Physics B 24, 117405 (2015).
- Bozovic and Ahn (2014) I. Bozovic and C. Ahn, Nature Physics 10, 892 (2014).
- Huang and Hoffman (2017) D. Huang and J. E. Hoffman, Annual Review of Condensed Matter Physics 8, 311 (2017).
- Wang et al. (2017a) Z. Wang, C. Liu, Y. Liu, and J. Wang, Journal of Physics: Condensed Matter 29, 153001 (2017a).
- Wang et al. (2016a) L. Wang, X. Ma, and Q.-K. Xue, Superconductor Science and Technology 29, 123001 (2016a).
- Zhao et al. (2017) W. Zhao, M. Li, C.-Z. Chang, J. Jiang, L. Wu, C. Liu, Y. Zhu, J. S. Moodera, and M. H. Chan, arXiv preprint arXiv:1701.03678 (2017).
- He et al. (2013) S. He, J. He, W. Zhang, L. Zhao, D. Liu, X. Liu, D. Mou, Y.-B. Ou, Q.-Y. Wang, Z. Li, et al., Nature materials 12, 605 (2013).
- He et al. (2014) J. He, X. Liu, W. Zhang, L. Zhao, D. Liu, S. He, D. Mou, F. Li, C. Tang, Z. Li, et al., Proceedings of the National Academy of Sciences 111, 18501 (2014).
- Lu et al. (2015) X. Lu, N. Wang, H. Wu, Y. Wu, D. Zhao, X. Zeng, X. Luo, T. Wu, W. Bao, G. Zhang, F. Huang, Q. Huang, and X. Chen, Nature Materials 14, 325 (2015).
- Zhao et al. (2016) L. Zhao, A. Liang, D. Yuan, Y. Hu, D. Liu, J. Huang, S. He, B. Shen, Y. Xu, X. Liu, L. Yu, G. Liu, H. Zhou, Y. Huang, X. Dong, F. Zhou, K. Liu, Z. Lu, Z. Zhao, C. Chen, Z. Xu, and X. J. Zhou, Nature Communications 7, 10608 (2016).
- Seo et al. (2016) J. Seo, B. Kim, B. Kim, J. Jeong, J. Ok, J. S. Kim, J. Denlinger, S.-K. Mo, C. Kim, and Y. Kim, Nature Communications 7, 11116 (2016).
- Wen et al. (2016) C. Wen, H. Xu, C. Chen, Z. Huang, X. Lou, Y. Pu, Q. Song, B. Xie, M. Abdel-Hafiez, D. Chareev, et al., Nature communications 7, 10840 (2016).
- Miyata et al. (2015) Y. Miyata, K. Nakayama, K. Sugawara, T. Sato, and T. Takahashi, Nature materials 14, 775 (2015).
- Song et al. (2016) C.-L. Song, H.-M. Zhang, Y. Zhong, X.-P. Hu, S.-H. Ji, L. Wang, K. He, X.-C. Ma, and Q.-K. Xue, Phys. Rev. Lett. 116, 157001 (2016).
- Shiogai et al. (2015) J. Shiogai, Y. Ito, T. Mitsuhashi, T. Nojima, and A. Tsukazaki, Nature Physics 12, 42 (2015).
- Lei et al. (2016) B. Lei, J. H. Cui, Z. J. Xiang, C. Shang, N. Z. Wang, G. J. Ye, X. G. Luo, T. Wu, Z. Sun, and X. H. Chen, Phys. Rev. Lett. 116, 077002 (2016).
- Hanzawa et al. (2016) K. Hanzawa, H. Sato, H. Hiramatsu, T. Kamiya, and H. Hosono, Proceedings of the National Academy of Sciences 113, 3986 (2016).
- Peng et al. (2014a) R. Peng, X. P. Shen, X. Xie, H. C. Xu, S. Y. Tan, M. Xia, T. Zhang, H. Y. Cao, X. G. Gong, J. P. Hu, B. P. Xie, and D. L. Feng, Phys. Rev. Lett. 112, 107001 (2014a).
- Li et al. (2016) F. Li, Q. Zhang, C. Tang, C. Liu, J. Shi, C. Nie, G. Zhou, Z. Li, W. Zhang, C.-L. Song, K. He, S. Ji, S. Zhang, L. Gu, L. Wang, X.-C. Ma, and Q.-K. Xue, 2D Materials 3, 024002 (2016).
- Zou et al. (2016) K. Zou, S. Mandal, S. D. Albright, R. Peng, Y. Pu, D. Kumah, C. Lau, G. H. Simon, O. E. Dagdeviren, X. He, I. Božović, U. D. Schwarz, E. I. Altman, D. Feng, F. J. Walker, S. Ismail-Beigi, and C. H. Ahn, Phys. Rev. B 93, 180506 (2016).
- Peng et al. (2014b) R. Peng, H. Xu, S. Tan, H. Cao, M. Xia, X. Shen, Z. Huang, C. Wen, Q. Song, T. Zhang, et al., Nature communications 5, 5044 (2014b).
- Zhang et al. (2016a) P. Zhang, X.-L. Peng, T. Qian, P. Richard, X. Shi, J.-Z. Ma, B. B. Fu, Y.-L. Guo, Z. Q. Han, S. C. Wang, L. L. Wang, Q.-K. Xue, J. P. Hu, Y.-J. Sun, and H. Ding, Phys. Rev. B 94, 104510 (2016a).
- Zhou et al. (2016) G. Zhou, D. Zhang, C. Liu, C. Tang, X. Wang, Z. Li, C. Song, S. Ji, K. He, L. Wang, X. Ma, and Q.-K. Xue, Applied Physics Letters 108, 202603 (2016).
- Ding et al. (2016) H. Ding, Y.-F. Lv, K. Zhao, W.-L. Wang, L. Wang, C.-L. Song, X. Chen, X.-C. Ma, and Q.-K. Xue, Phys. Rev. Lett. 117, 067001 (2016).
- Rebec et al. (2017) S. N. Rebec, T. Jia, C. Zhang, M. Hashimoto, D.-H. Lu, R. G. Moore, and Z.-X. Shen, Phys. Rev. Lett. 118, 067002 (2017).
- Tang et al. (2016) C. Tang, C. Liu, G. Zhou, F. Li, H. Ding, Z. Li, D. Zhang, Z. Li, C. Song, S. Ji, K. He, L. Wang, X. Ma, and Q.-K. Xue, Phys. Rev. B 93, 020507 (2016).
- Coh et al. (2015) S. Coh, M. L. Cohen, and S. G. Louie, New Journal of Physics 17, 073027 (2015).
- Wang et al. (2016b) Y. Wang, A. Linscheid, T. Berlijn, and S. Johnston, Phys. Rev. B 93, 134513 (2016b).
- Li et al. (2014) B. Li, Z. W. Xing, G. Q. Huang, and D. Y. Xing, Journal of Applied Physics 115, 193907 (2014), http://dx.doi.org/10.1063/1.4876750 .
- Rademaker et al. (2016) L. Rademaker, Y. Wang, T. Berlijn, and S. Johnston, New Journal of Physics 18, 022001 (2016).
- Zhang et al. (2016b) S. Zhang, J. Guan, X. Jia, B. Liu, W. Wang, F. Li, L. Wang, X. Ma, Q. Xue, J. Zhang, E. W. Plummer, X. Zhu, and J. Guo, Phys. Rev. B 94, 081116 (2016b).
- Wang et al. (2016c) Q. Wang, Y. Shen, B. Pan, Y. Hao, M. Ma, F. Zhou, P. Steffens, K. Schmalzl, T. Forrest, M. Abdel-Hafiez, et al., Nature materials 15, 159 (2016c).
- Wang et al. (2016d) Q. Wang, Y. Shen, B. Pan, X. Zhang, K. Ikeuchi, K. Iida, A. Christianson, H. Walker, D. Adroja, M. Abdel-Hafiez, et al., Nature communications 7, 12182 (2016d).
- Shukla et al. (2003) A. Shukla, M. Calandra, M. d’Astuto, M. Lazzeri, F. Mauri, C. Bellin, M. Krisch, J. Karpinski, S. M. Kazakov, J. Jun, D. Daghero, and K. Parlinski, Phys. Rev. Lett. 90, 095506 (2003).
- Gnezdilov et al. (2013) V. Gnezdilov, Y. G. Pashkevich, P. Lemmens, D. Wulferding, T. Shevtsova, A. Gusev, D. Chareev, and A. Vasiliev, Phys. Rev. B 87, 144508 (2013).
- Mittal et al. (2009) R. Mittal, L. Pintschovius, D. Lamago, R. Heid, K.-P. Bohnen, D. Reznik, S. L. Chaplot, Y. Su, N. Kumar, S. K. Dhar, A. Thamizhavel, and T. Brueckel, Phys. Rev. Lett. 102, 217001 (2009).
- Ksenofontov et al. (2010) V. Ksenofontov, G. Wortmann, A. I. Chumakov, T. Gasi, S. Medvedev, T. M. McQueen, R. J. Cava, and C. Felser, Phys. Rev. B 81, 184510 (2010).
- Gang et al. (2008) M. Gang, Z. Xi-Yu, F. Lei, S. Lei, R. Cong, and W. Hai-Hu, Chinese Physics Letters 25, 2221 (2008).
- Lin et al. (2011) J.-Y. Lin, Y. S. Hsieh, D. A. Chareev, A. N. Vasiliev, Y. Parsons, and H. D. Yang, Phys. Rev. B 84, 220507 (2011).
- Lawless and Morrow (1977) W. N. Lawless and A. J. Morrow, Ferroelectrics 15, 159 (1977), http://dx.doi.org/10.1080/00150197708237810 .
- Bell and Rupprecht (1963) R. O. Bell and G. Rupprecht, Phys. Rev. 129, 90 (1963).
- Benedek et al. (2013) G. Benedek, V. Celli, G. Comsa, R. Doak, J. Frenken, B. Hinch, H. Hoinkes, K. Kern, A. Lahee, J. Lapujoulade, et al., Helium atom scattering from surfaces, Vol. 27 (Springer Science & Business Media, 2013).
- Phelan et al. (2009) D. Phelan, J. N. Millican, E. L. Thomas, J. B. Leão, Y. Qiu, and R. Paul, Phys. Rev. B 79, 014519 (2009).
- Cao et al. (2012) Y. Cao, S. Wang, S. Liu, Q. Guo, and J. Guo, The Journal of Chemical Physics 137, 044701 (2012), http://dx.doi.org/10.1063/1.4737946 .
- Zhu et al. (2015) X. Zhu, Y. Cao, S. Zhang, X. Jia, Q. Guo, F. Yang, L. Zhu, J. Zhang, E. Plummer, and J. Guo, Review of Scientific Instruments 86, 083902 (2015).
- Tabor et al. (1971) D. Tabor, J. Wilson, and T. Bastow, Surface Science 26, 471 (1971).
- Jones et al. (1966) E. R. Jones, J. T. McKinney, and M. B. Webb, Phys. Rev. 151, 476 (1966).
- Reid (1970) R. Reid, physica status solidi (a) 2, K109 (1970).
- Debye (1913) P. Debye, Annalen der Physik 348, 49 (1913).
- Waller (1923) I. Waller, Zeitschrift für Physik 17, 398 (1923).
- James (1952) R. James, The Optical Principles of the Diffraction of X-rays. (G. Bell and sons, 1952).
- Ashcroft and Mermin (1976) N. W. Ashcroft and N. D. Mermin, Solid state physics (holt, rinehart and winston, new york, 1976) (1976) p. 793.
- Togo and Tanaka (2015) A. Togo and I. Tanaka, Scripta Materialia 108, 1 (2015).
- Blöchl (1994) P. E. Blöchl, Phys. Rev. B 50, 17953 (1994).
- Kresse and Furthmüller (1996) G. Kresse and J. Furthmüller, Phys. Rev. B 54, 11169 (1996).
- Kresse and Joubert (1999) G. Kresse and D. Joubert, Phys. Rev. B 59, 1758 (1999).
- Giannozzi et al. (2009) P. Giannozzi, S. Baroni, N. Bonini, M. Calandra, R. Car, C. Cavazzoni, D. Ceresoli, G. L. Chiarotti, M. Cococcioni, I. Dabo, A. D. Corso, S. de Gironcoli, S. Fabris, G. Fratesi, R. Gebauer, U. Gerstmann, C. Gougoussis, A. Kokalj, M. Lazzeri, L. Martin-Samos, N. Marzari, F. Mauri, R. Mazzarello, S. Paolini, A. Pasquarello, L. Paulatto, C. Sbraccia, S. Scandolo, G. Sclauzero, A. P. Seitsonen, A. Smogunov, P. Umari, and R. M. Wentzcovitch, Journal of Physics: Condensed Matter 21, 395502 (2009).
- Garrity et al. (2014) K. F. Garrity, J. W. Bennett, K. M. Rabe, and D. Vanderbilt, Computational Materials Science 81, 446 (2014).
- Perdew et al. (1996) J. P. Perdew, K. Burke, and M. Ernzerhof, Phys. Rev. Lett. 77, 3865 (1996).
- Ibach and Mills (1982) H. Ibach and D. L. Mills, Electron energy loss spectroscopy and surface vibrations (Academic press, 1982).
- Zhu et al. (2011) X. Zhu, L. Santos, R. Sankar, S. Chikara, C. . Howard, F. C. Chou, C. Chamon, and M. El-Batanouny, Phys. Rev. Lett. 107, 186102 (2011).
- McMillan (1968) W. L. McMillan, Phys. Rev. 167, 331 (1968).
- Boeri et al. (2008) L. Boeri, O. V. Dolgov, and A. A. Golubov, Phys. Rev. Lett. 101, 026403 (2008).
- Yildirim et al. (2001) T. Yildirim, O. Gülseren, J. W. Lynn, C. M. Brown, T. J. Udovic, Q. Huang, N. Rogado, K. A. Regan, M. A. Hayward, J. S. Slusky, T. He, M. K. Haas, P. Khalifah, K. Inumaru, and R. J. Cava, Phys. Rev. Lett. 87, 037001 (2001).
- Wang et al. (2017b) Y. Wang, L. Rademaker, E. Dagotto, and S. Johnston, Phys. Rev. B 96, 054515 (2017b).
- Zhou and Millis (2017) Y. Zhou and A. J. Millis, Phys. Rev. B 96, 054516 (2017).
- Fuchs and Kliewer (1965) R. Fuchs and K. L. Kliewer, Phys. Rev. 140, A2076 (1965).