Metal-poor star formation triggered by the feedback effects from Pop III stars
Abstract
Metal enrichment by the first-generation (Pop III) stars is the very first step of the matter cycle in the structure formation and it is followed by the formation of extremely metal-poor (EMP) stars. To investigate the enrichment process by the Pop III stars, we carry out a series of numerical simulations including the feedback effects of photoionization and supernovae (SNe) of Pop III stars with a range of masses of minihaloes (MHs), , and Pop III stars, . We find that the metal-rich ejecta reaches neighbouring haloes and external enrichment (EE) occurs when the halo binding energy is sufficiently below the SN explosion energy, . The neighbouring haloes are only superficially enriched, and the metallicity of the clouds is . Otherwise, the SN ejecta falls back and recollapses to form enriched cloud, i.e. internal enrichment (IE) process takes place. In case that a Pop III star explodes as a core-collapse SNe (CCSNe), MHs undergo IE, and the metallicity in the recollapsing region is in most cases. We conclude that IE from a single CCSN can explain the formation of EMP stars. For pair-instability SNe (PISNe), EE takes place for all relevant mass range of MHs, consistent with no observational sign of PISNe among EMP stars.
keywords:
galaxies: evolution — ISM: abundances — stars: formation — stars: low-mass — stars: Population III — stars: Population II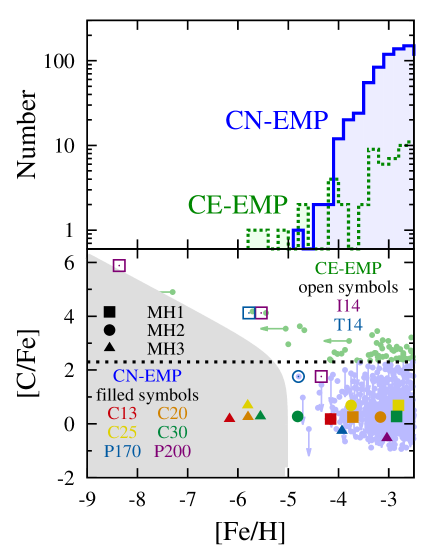
1 INTRODUCTION
The stellar initial mass function (IMF) and the evolution of elemental abundances within billion years after the Big Bang have been intensively investigated to uncover the nature of the early structure formation. The IMF and the metal content evolve, affecting each other. The first-generation stars (Pop III stars) born in pristine clouds are majorly massive (–) by the lack of cooling agents other than hydrogen molecules (Bromm et al., 1999; Abel et al., 2002; Yoshida et al., 2003; Susa et al., 2014; Hirano et al., 2014, 2015a). They explode to enrich the surrounding gas with metals and dusts. The metal- and dust-enriched clouds undergo fragmentation by additional radiative cooling, and are likely to host low-mass stars (Pop II/I stars Omukai, 2000; Schneider et al., 2003; Bromm & Loeb, 2003; Frebel et al., 2005).
Those star formation and metal enrichment proceed in the early stage of the structure formation. The standard cold dark matter (CDM) model predicts that the structures hierarchically evolve from small to large ones, i.e., from stars to galaxies/galaxy clusters (Audouze & Silk, 1995). Pop III stars are formed in tiny dark matter (DM) haloes with mass and with the virial temperature K, so-called minihaloes (MHs), at redshifts . Then, through the halo merger, the first galaxies, defined as objects in which the cycle of material stably stands, are formed in atomic-cooling haloes with at (Bromm & Yoshida, 2011). These objects are considered to contain more primitive population of stars and elemental abundances than those in the present-day massive galaxies. In the next decades, observational instruments such as the Thirty-Meter Telescopes (TMT), Space Infrared Telescope for Cosmology and Astrophysics (SPICA), and James-Webb Space Telescope (JWST) target the high-redshift galaxies, or even the first galaxies. The formation of galaxies at high redshifts have intensely been investigated by numerical simulations (e.g. Wise et al., 2012; Xu et al., 2013; Barrow et al., 2017a, b) and semi-analytical studies (e.g. de Bennassuti et al., 2014, 2017; Komiya et al., 2015; Magg et al., 2017). The confrontation of these simulations with the future observations will help us to understand the metal enrichment process in the early universe.
Another way to approach the stellar IMF and metal enrichment process in the early Universe is to observe long-lived metal-poor (MP) stars residing in the outskirts of our Galaxy and ultra-faint dwarf (UFD) galaxies. The metallicity of MP stars are often measured as iron abundance normalized by the solar one, , where is the number abundance of element relative to hydrogen nuclei. In particular, the stars with are called as extremely metal-poor (EMP) stars, which are considered to be enriched by a single or several SN(e) for their small metal contents (Ryan et al., 1996; Cayrel et al., 2004). As Figure 1 shows, they are classified according to their carbon-enhancement as C-enhanced EMP (CE-EMP) and C-normal EMP (CN-EMP) stars above and below , respectively (Beers & Christlieb, 2005; Aoki et al., 2007; Chiaki et al., 2017). It is considered that MP stars are originated from the fragmentation of their parent clouds by the radiative cooling of dust thermal emission so that the low-mass, i.e., long-lived stars are likely to be formed (Omukai, 2000; Schneider et al., 2003, 2006; Bromm, 2014). The distribution of CE-EMP and CN-EMP stars shows the vacant region on [C/Fe]-[Fe/H] plane (gray shaded region), which would indicate the minimum elemental abundances and required to activate the carbon and silicate dust cooling, respectively (Chiaki et al., 2017).
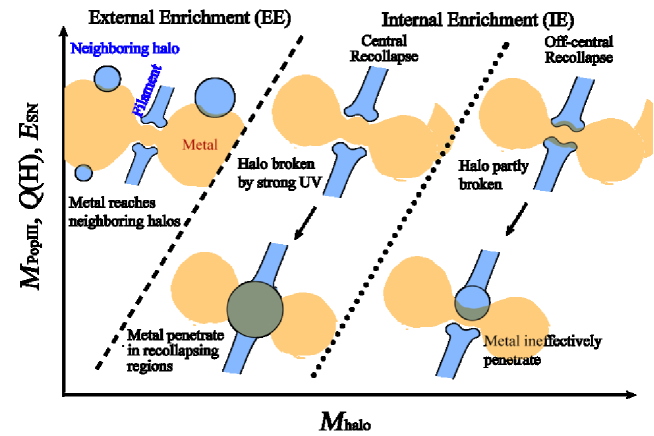
The enrichment of the gas that will collapse to form EMP stars proceeds in qualitatively distinct ways. It is considered that there are two major processes, internal enrichment (IE) and external enrichment (EE). In the former case, SN shocks rich with metals fall back into and pollute the MH which has hosted a progenitor Pop III star. Ritter et al. (2012, 2015, 2016) and Sluder et al. (2016) find that, several ten million years after the explosion, the gas contracts again by the gravitational potential of the central MH, and the resulting metallicity is above . In the latter case, SN shocks from a MH reach and pollute neighbouring haloes. Smith et al. (2015) report that a neighbouring halo is enriched up to in a cosmological simulation. Besides, with the initial condition put by hand and higher resolution simulations, Chen et al. (2017) report that metal can not penetrate into the center of the clouds eroded by SN shocks for any models but for a model with a PISN. These simulations predict the lower metallicity in the second-generation star-forming regions than IE. We expect that the metallciity range depends on the enrichment processes.
Both IE and EE should occur, depending on the balance between the injected energies of ultraviolet photons/SN explosions and the halo binding energy. Therefore, to know the conditions for the two enrichment processes and which process is dominant, it is required to perform simulations in a wide range of parameters such as masses of MH and a Pop III star . However, IE and EE have so far been separately investigated with one combination of the initial parameters by each earlier work.
In addition, the elemental abundance of EMP stars is the clue to restrict IMF of Pop III stars. Pop III stars with masses explode as normal Type-II core-collapse SNe (CCSNe) and eject the normal elemental abundance ratio. More massive ones with explode as pair-instability SNe (PISNe) and their ejecta show Fe-enhanced features and the large abundance contrasts between odd and even elements (Aoki et al., 2014). The elemental abundances of EMP stars can well be reproduced by the nucleosynthetic models of CCSNe. Interestingly, the stars with elemental abundances consistent with PISN model have not been observed so far. This is considered to be either because the formation rate of extremely massive Pop III stars are intrinsically small, or because the ejecta from PISNe, if exist, can not enrich their host or neighbouring MHs. Again, most of earlier works employ one initial parameter of , and restrict their interest to either CCSNe or PISNe. To compare with the observations, the simulations with covering the mass ranges from CCSNe to PISNe is required.
Another clue of the nucleosynthetic feature of Pop III stars is that CE-EMP stars account for the dominant fraction (80%) for the subset of EMP stars with lowest metallicity (). Their origin is considered to be the enrichment of their parent clouds by faint SNe (FSNe) whose inner layer of ejecta undergoes mixing/fall-back and only C-rich materials are ejected (Umeda & Nomoto, 2003; Marassi et al., 2014, 2015; Chen et al., 2017; Chiaki et al., 2017). Although the model can well reproduce the relative elemental abundance of CE-EMP stars, it has not yet been explicitly shown that the absolute elemental abundance of enriched clouds becomes as high as observed values of regardless of the loss of the ejecta mass.
We in this paper focus on the first step of the matter cycle from the formation of Pop III stars to star-forming clouds of Pop II stars. We perform a series of simulations to study the metal enrichment of star-forming clouds by a single Pop III star, considering its radiative/mechanical feedbacks. The method is described in Section 2. We investigate two environmental parameters: masses of MHs with a range of – and Pop III stars –, covering the mass range of CCSNe and PISNe. The results of the simulations separately for the combination of massive/low-mass MHs and CCSNe/PISNe are shown in Section 3. We find the different ‘modes’ appear in the enrichment processes as discussed in Section 4, and apply our result to the comparison with observations of EMP stars (Section 5). We discuss other issues in Section 6, and conclude the paper in Section 7.
2 Numerical models
2.1 Flow of simulations
This work follows the process of radiative feedback from main-sequence (MS) Pop III stars
and kinetic feedback and metal dispersion from their SNe.
Throughout the simulations, we employ the -body/Smoothed Particle Hydrodynamics (SPH) code gadget-2 (Springel, 2005)
including all relevant non-equilibrium chemistry and heating/cooling processes.
The whole course of the simulations is divided into the following three steps.
Formation of minihaloes and Pop III stars
We extract MHs from a parent cosmological simulation with a large simulation box, and
calculate gravitational collapse of Pop III star-forming clouds hosted by MHs until
the central density reaches and run-away collapse onsets.
Radiative feedback
After the collapse simulations, we put a collisionless particle as a Pop III star
at the centroid of SPH particles with densities .
The velocity of the star particle is initially mass-weighted average of the central SPH particles.
We update it by integrating the gravity force.
The star particle is the source of ionization and dissociation photons.
According to their mass, the emission rates of ionizing and dissociating photons are given.
After the corresponding lifetime of a Pop III star, the photon emission is turned off
to give the initial condition of the subsequent simulations
of SN explosions.
Supernova feedback
Then, propagation of shock front associated with the supernova explosion is followed under the point explosion approximation. All of the energies are added as thermal energy at the location of the Pop III star particle. The energy is given according to the different types of SN, CCSNe and PISNe. We follow the metal dispersion until the density of the recollapsing region reaches again.
2.2 Resolution
In an SPH scheme, a density distribution is expressed as the spatial distribution of SPH particles. As the nature of the scheme, the spatial resolution is automatically improved with increasing density. The employed mass of an SPH particle is and the number of neighbouring particles is . As a result, the minimum mass which SPH particles resolve is . For the maximum density , the minimum length which can be resolved is described as the minimum smoothing kernel size,
| (1) |
However, when the size fails to sufficiently resolve the local Jeans length, it is reported that spurious fragmentation occurs (Truelove et al., 1997). At the maximum density, the ratio of the local Jeans mass to is
| (2) | |||||
(Chiaki & Yoshida, 2015). In simulations of isolated collapsing gas clouds, the ratio is obliged to be above 1000 by zoom-in techniques such as the particle-splitting (Hirano et al., 2014; Chiaki et al., 2016). In our simulations, the minimum resolution of is sufficient because we are not interested in the cloud fragmentation but the average metallicity of recollapsing region.
2.3 Chemical reactions and heating/cooling
2.3.1 Non-radiative reactions
Throughout the simulation, we solve the non-equilibrium chemical networks of 53 reactions for 15 primordial species of , , , , , , , , , , , , , , and , which cover the wide range of density of and temperature of . The collisional ionization and recombination of H and He atoms and ions, charge transfer of relevant species, and formation of H2 and HD molecules are included. The compilation of reaction rates is taken from the primordial part of Nagakura et al. (2009).
2.3.2 Radiative cooling
From abundances of the species, we calculate the radiative cooling rates of the inverse Compton cooling, bremsstrahlung, H, He, and He+ transition lines including two-photon decay, ionization and recombination cooling, and ro-vibrational transition line cooling of H2 and HD molecules. We do not include the radiative cooling by ejected metal because it activates at densities with metallicities , above our maximum density (Jappsen et al., 2007).
We ignore the star formation in neighbouring haloes, focusing on the enrichment of one halo which have hosted the Pop III star. In order to prevent the gas from collapsing in the neighbouring haloes, H2 and HD cooling is switched off in the region 100 pc outside from the target halo, the typical virial radius. Inside 100 pc from the center of the target halo, we prevent density from increasing larger than by switching off molecular cooling due to the limit of resolution.
2.3.3 Photo-chemistry and heating
Radiative transfer
During MS of Pop III stars, we perform radiation transfer simulations,
using the ray-tracing method presented by Susa (2006).
The rates of photoionization and dissociation are calculated at the position of each SPH particle.
Since they depend on the column density of the relevant species,
we derive this by integrating the element (H i) along the ray from the source to the target SPH particle.
The element (H i) is calculated between a SPH particle on the ray
and one of its neighbors that is selected
so that the angle between the direction from to and the direction from to the source is smallest.
The subroutine of radiative transfer are heavily parallelized.
Photoionization of H atoms
We add the reactions of photoionization of H atoms and photodissociation of H2 molecules. The former proceeds by the ionizing photons with energies as
The reaction rate and corresponding heating
rate at the position of an SPH particle
are calculated from the column density (H i), using the photon-conserving
procedure (Susa, 2006).
The frequency-dependent cross-section is taken from Shapiro & Kang (1987).
We ignore the photoionization of helium atoms and ions.
Photodissociation of H2 molecules
The dissociation of hydrogen molecules induced by photons in the Lyman-Werner band (– eV) are also solved as
Using the self-shielding approximation of Draine & Bertoldi (1996), we calculate the photodissociation rate by the column density of H2 molecules.
2.4 Supernova Feedback
2.4.1 Mechanical feedback
The explosion energy is added as thermal energy uniformly in a spherical region around a Pop III remnant which contains gas particles, mimicking the end of the free-expansion (FE) phase. Note that the FE phase is transmitted into the Sedov-Taylor (ST) phase when a SN ejecta sweeps up the ambient medium with the same mass. Since the mass of SPH particles is in this simulation, the mass of the initial heated region is , which is larger than the ejecta mass. It is the trade-off for the large simulation box size of to cover the entire volume which PISN shell can cover. Zoom-in techniques such as particle splitting (Chiaki & Yoshida, 2015) could resolve the innermost region of SN ejecta. However, when refined particles are brown away into the ambient region with coarse gas particles, significant error in density and pressure force estimations would be induced. Thus, we do not employ the particle splitting in the present simulations.
| MH | |||||
|---|---|---|---|---|---|
| [pc] | [] | [] | |||
| LH | MH1 | 28.47 | 70.12 | ||
| MH2 | 27.52 | 79.52 | |||
| HH | MH3 | 23.58 | 186.85 |
Note — and denote the virial mass and radius of MHs so that the average density of both gas and dark matter is 200 times the critical density at the redshift when the maximum gas density reaches . is the gas mass within .
| ID | ||||||||
|---|---|---|---|---|---|---|---|---|
| [Myr] | [K] | [s-1] | [1051 erg] | [] | [] | |||
| CCSN | C13 | 13 | 13.7 | 1 | 0.746 | 0.0718 | ||
| C20 | 20 | 8.43 | 1 | 2.56 | 0.0789 | |||
| C25 | 25 | 6.46 | 1 | 3.83 | 0.0758 | |||
| C30 | 30 | 5.59 | 1 | 7.18 | 0.105 | |||
| PISN | P170 | 170 | 2.32 | 20 | 83.4 | 4.42 | ||
| P200 | 200 | 2.20 | 28 | 114 | 7.74 |
2.4.2 Metal enrichment
The propagation of metals is traced by Lagrangian test particles with mass , where is the metal mass produced by SNe and is the number of metal particles. We set as in Ritter et al. (2012). The velocity of a metal particle is interpolated from neighbouring SPH particles with the ordinal SPH procedure as
| (3) |
where , , and denote the mass, density, and velocity of SPH particle , is the distance between the metal particle and SPH particle , is the smoothing length of metal particle within which SPH particles are contained, and is the smoothing kernel function. Then the position of a metal particle at the time are updated as , where is the simulation timestep.
Note that we here employ the ordinal cubic spline kernel to estimate metal density of each SPH particle. In order to obtain a better estimation of metallicity, some researchers adopt various kernel functions (Tornatore et al., 2007a, b; Dehnen & Aly, 2012). Tornatore et al. (2007b) compare the runs with the ordinal cubic spline and top-hat kernel function. They conclude that the difference of metallicity between two runs are less significant relative to the diversity of realizations. Thus we employ the ordinary cubic spline kernel function.
2.4.3 Metallicity in recollapsing region
The metallicity of the recollapsing region is calculated as
| (4) |
where and are the mass of metal and primordial gas particles within the local Jeans radius centered at the SPH particle of highest density. From the total ejected mass of Fe, we can estimate the number abundance of Fe relative to hydrogen in the recollapsing region as
| (5) |
where is the molecular weight of Fe. Using the solar abundance (Asplund et al., 2009), the relative abundance is estimated as .
2.5 Initial conditions
2.5.1 Minihaloes
In the parent cosmological simulation, we use gadget-2 suitably modified to follow the formation of primordial gas clouds (Hirano et al., 2014). The simulations are initialized at with a box size Mpc using the music software (Hahn & Abel, 2011). Cosmological parameters are adopted from the latest Planck data (Planck Collaboration et al., 2016, last column of their table 4). We first run a dark matter only simulation with -body particles, and identify dark haloes at by running a friends-of-friends halo finder. Next, we perform multi-level zoom-in simulations for the selected target haloes with a high spatial resolution. Finally, we perform the zoom-in simulations including SPH particles with mass . The SPH simulations are stopped when the target haloes collapse gravitationally, and the central gas density reaches . We select three MHs with masses – to cover the mass range of MHs in the entire cosmological MHs given by Hirano et al. (2015a). We step back the simulation when the central gas density is , and cut out a spherical region with a radius 2.5 kpc centered at the density peak so that the SN shocks even for PISNe can not go beyond the simulation region. We then restart the collapse simulation with the chemical reactions and radiative cooling presented in Section 2.3.
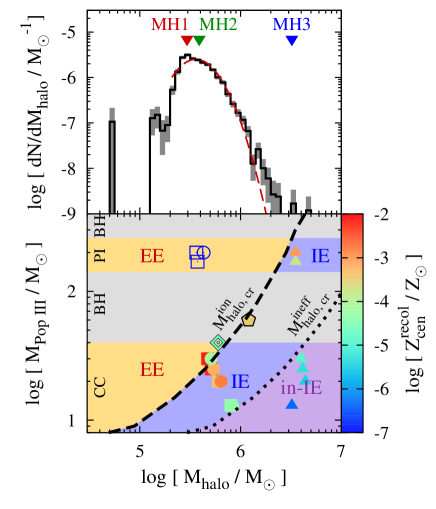
Table 1 shows the total mass and baryon mass within the virial radius of the MHs at the time when their maximum density reaches for the first time. MH1 and MH2 host Pop III stars at high redshifts –. The mass of both MH1 and MH2 is around , but MH1 does not have substructures within 500 pc around it while MH2 does. Until the time when shocked gas falls back into MH2, it is expected that the neighbouring haloes also merge with MH2 and reduce its metallicity. We also study the enrichment of more massive halo, MH3, with growing at a lower redshift 24.
2.5.2 Pop III stars
The mass function of Pop III stars is still under the debate because of the limitations of spatial resolution and computational time to follow the entire accretion history of a disk into the central protostellar core. Several researchers have reported that the fragmentation of accretion disk around a protostar drives the formation of Pop III star cluster including low-mass () stars (Clark et al., 2011; Greif et al., 2011; Stacy et al., 2012; Susa, 2013; Susa et al., 2014; Chiaki et al., 2016; Hirano & Bromm, 2017). However, even in such simulations, the primary protostar is still massive (). In the present simulations we only take into account the feedback by a primary star.
We consider the wide range of progenitor mass of – and – exploding as CCSNe and PISNe. These models reproduce the elemental abundance ratio of CN-EMP stars. The stellar properties, such as their lifetime and emission rate of ionizing photons , are interpolated by the quantities presented by Schaerer (2002) as listed in Table 2. The explosion energy is fixed for CCSNe to be , and and for PISNe with and , respectively. With those explosion energies, the mass of nucleosynthesized metal is listed in Table 2 (Umeda & Nomoto, 2002). The mass of synthesized iron is less sensitive to the progenitor mass than the total metal mass. The oxygen mass accounts for the large fraction of the ejected metal, and increases with , but it is observationally difficult to constrain the oxygen abundance of EMP stars (Cayrel et al., 2004).
Hereafter, we indicate these models by the combination of IDs of MHs and . The name ‘MH1-C30’ denotes the model with hosted in MH1, for example. For the later discussion, we generalize the models with as ‘CCSN’ and as ‘PISN’. Also, we call low-mass MH1 and MH2 as LH while high-mass MH3 as HH to compare their hydrodynamic evolutions.
2.5.3 Parameters of the Cosmological Simulation
Throughout the simulations as well as the parent cosmological simulation, the cosmological parameters are , , , and (Planck Collaboration et al., 2016). We perform simulations in the comoving coordinate, but we show the physical quantities in proper coordinate in the text, tables, and figures hereafter.
Although helium is nucleosynthesized and dispersed by a SN, we fix the mass fraction of helium to . We show gas density in the form of number density of hydrogen nuclei as , where is the mass fraction of hydrogen nuclei, is the mass density of gas, and is the mass of a hydrogen nucleus. The metallicity is shown in the unit of the solar one .
| Halo | ||||||||
| [] | [] | [Myr] | [] | [] | ||||
| MH1 | 13 | 5.74 | 0.555 | 3.87 | ||||
| 20 | 7.19 | 0.459 | 2.85 | |||||
| 25 | 8.41 | 0.368 | 2.60 | |||||
| 30 | 12.2 | 0.398 | 2.62 | |||||
| MH2 | 13 | 11.3 | 0.701 | 3.79 | ||||
| 20 | 12.5 | 0.648 | 2.90 | |||||
| 25 | 22.4 | 0.300 | 4.07 | |||||
| 30 | 39.7 | 0.254 | 5.96 | |||||
| MH3 | 13 | 0.979 | () | 0.895 | 1.91 | |||
| 20 | 1.16 | () | 0.608 | 1.31 | ||||
| 25 | 1.23 | () | 0.557 | 1.32 | ||||
| 30 | 1.30 | () | 0.421 | 1.30 | ||||
| 170 | 5.85 | 0.368 | 1.17 | |||||
| 200 | 28.5 | 0.449 | 2.94 |
Note — (3) : central number density at the lifetime of a Pop III star. (4) : time to recollapse from a SN explosion. (5, 6) , : metallicity and iron abundance in the recollapsing cloud. Parentheses are attached for models with below the critical value (Chiaki et al., 2015, 2017). (7) : mass fraction of metal remaining within the virial radius to ejected. (8) : mass fraction of primordial gas within at to the initial. (9) : metallicity within at .
3 Results
3.1 Overview
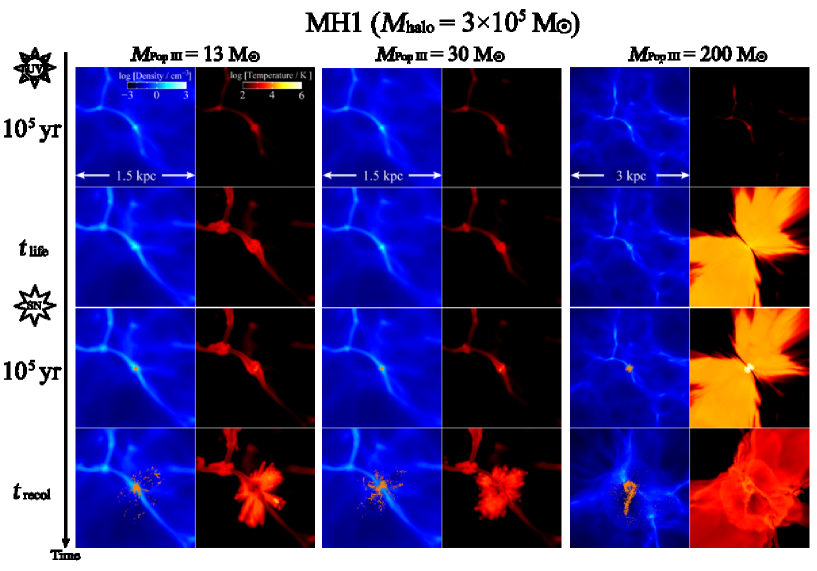
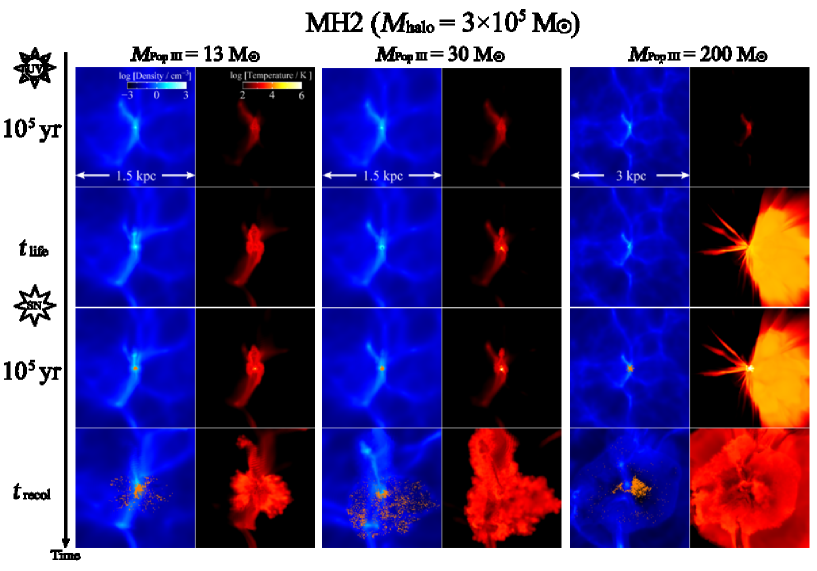
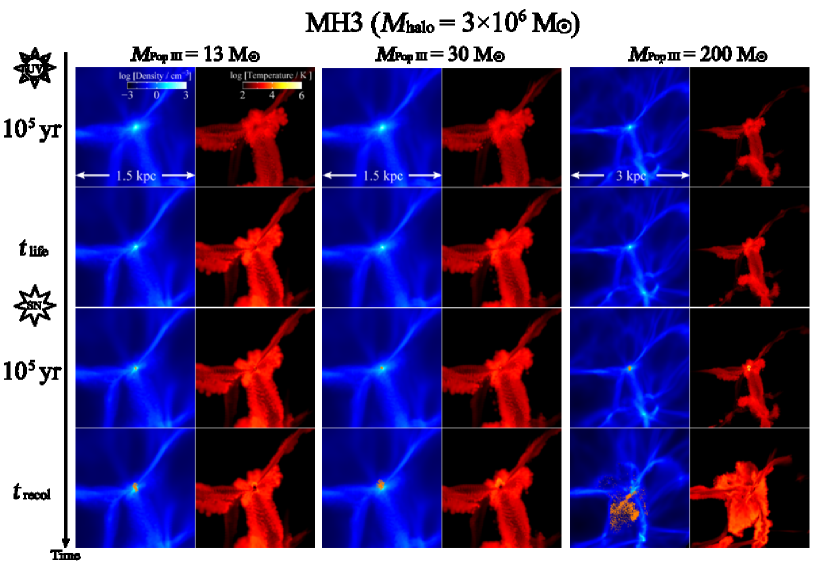
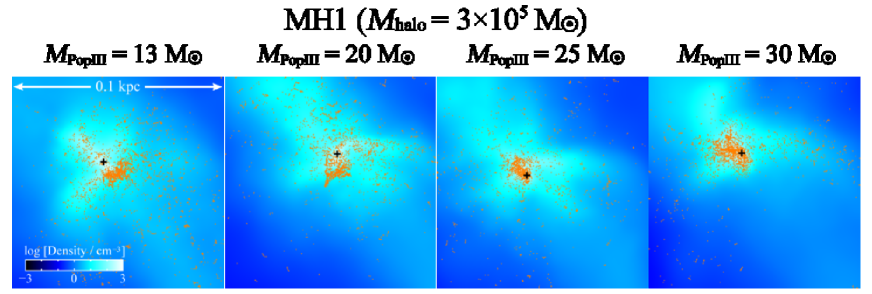
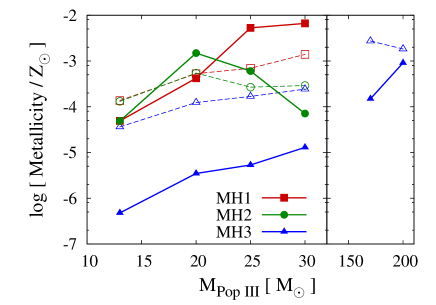
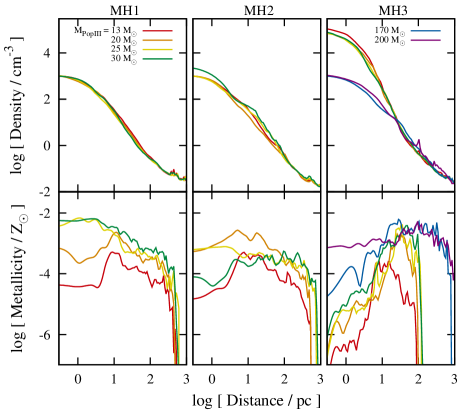
Figures 3–4 show the density and temperature distributions during MS (top two rows) and after SN explosions (bottom two rows) for each MH. In most models, the central gas clouds hosted by MHs are not affected or partly broken by the emission of ionizing photons. Then, after SN explosions, metal particles expel mainly in the direction perpendicular to the filaments of the cosmological large-scale structures, i.e., direction to the voids. A fraction of metals is halted to be dispersed by the continuous gas accretion in the direction of the filament, and falls back into the central MHs at 1–10 Myr after explosions. The MHs are self-enriched (IE) by Pop III stars which they have hosted (Figure 5). The metallicity ranges in the recollapsing clouds are – for LH, consistent with that of observed EMP stars, and – for HH as shown in Figure 6 and Table 3. The metallicity of recollapsing regions depends not only on the halo mass and the Pop III mass, but also on the presence of substructures. When subclumps merge before the run-away collapse of the recollapseing cloud, the pristine gas flows into the central clouds, and the metallciity becomes smaller than in the cases without substructures.
On the other hand, for LH-PISN, H ii regions expel to more than 1 kpc away from the central Pop III stars as indicated by the region with several tens-thousands kelvins. The gas with metals is ejected from SNe and never falls back until at least 50 Myr after SN. Instead, it goes through the voids to reach the regions within virial radii of several neighbouring haloes locating at kpc distant from the central MHs (Figures 3 and 3). We observe that metals are incorporated into the central part of one neighbouring halo, and its metallicity is , indicating that EE is ineffective relative to IE.
The metallicity ranges in the recollapsing regions depend largely on enrichment processes, IE or EE. We can see this for the first time by performing simulations for ranges of and (). We see the details of hydrodynamical evolution and resulting metallicity range of the recollapsing regions for IE (Section 3.2) and EE events (Section 3.3).
3.2 Internal Enrichment
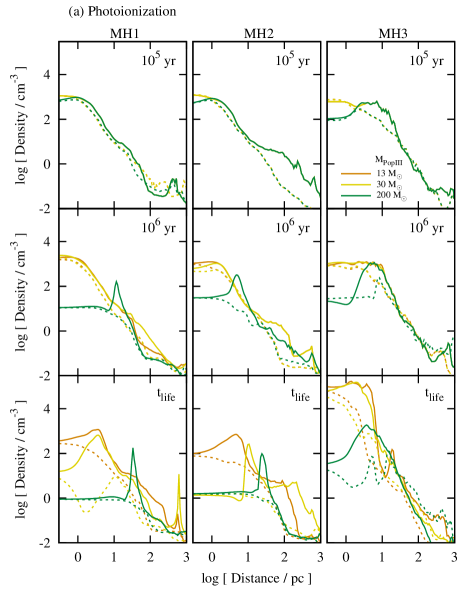
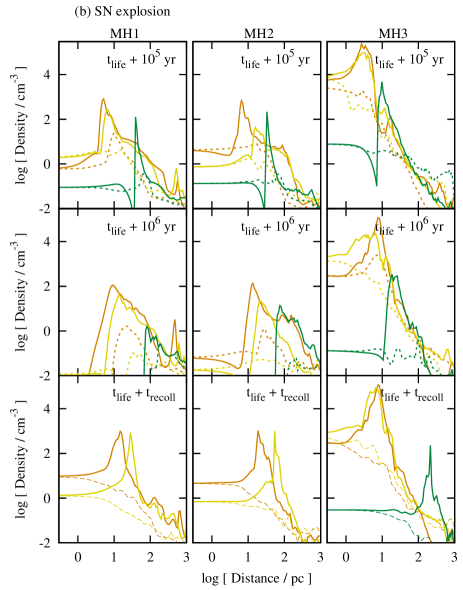
We observe IE for all models but for LH-PISN. Figure 7 shows the radial density profiles (a) during MS and (b) after SN explosions centered at Pop III stars and their explosion center, respectively. Radial profiles in two representative directions are shown by the solid and dotted curves that correspond to the directions to cosmological filaments and voids, respectively. The dynamics of the gas in the halo and the metallicity in the recollapsing region depend on , , and the presence substructures. We classify our models into three groups of LH-CCSN (Section 3.2.1), HH-CCSN (Section 3.2.2), and HH-PISN (Section 3.2.3). We summarize the complicated dependency of metallicity on and in Section 3.2.4.
3.2.1 CCSNe in Low-mass MHs
In the direction of filaments, H ii regions is still R-type at yr after star formation, and then transit to the D-type at finding the D-type shocks at 1–10 pc from the Pop III stars for LH (solid yellow and orange curves in Figure 7). In the direction of voids, D-type fronts propagate more rapidly, reaching pc at . The distance of the shocks from Pop III star increases with increasing because the emission rates of ionizing photons increases (Table 2). For MH1-C30 and MH2-C30, ionization region expands to 5 and 10 pc, and the density at the position of the Pop III star decreases from the initial value of to and , respectively. On the other hand, for MH1-C13 and MH2-C13, the gas density only slightly decreases to and , respectively. As the Pop III stellar mass decreases, the decrement of becomes smaller because the ionization photon emission rate declines, and also because the halo mass becomes larger due to accretion through the longer stellar life time.
The blast wave from SN explosion further destroy the clouds in the MHs (Figure 7b). At yr after explosion, the central region is significantly evacuated with densities less than . As shown in the fourth column of Table 3, the density of the recollapsing regions reaches at the time – Myr after the explosion. The time becomes longer with increasing because the shock velocity decreases going through the denser region owing to weaker pre-ionization rates. Although about a half of metals is dispersed in the direction of voids (orange dots in Figure 3), the rest remains around the loci of the explosion center (Figure 5).
As shown in the last column in Table 3 and Figure 6, the metallicity in the recollapsing region is and , which indicates that the second generation stars are expected to form in the enriched clouds, to be found as EMP stars in the local Universe. We conclude that a single CCSN is enough to pollute the halo having hosted its progenitor to reproduce the metallicity range of the star-forming clouds of EMP stars.
The metallicity becomes smaller as the progenitor mass gets smaller. We find the enrichment process is different between large and small . As shown in Figure 5, for MH1-C25 and C30, the shocked gas contracts again, gathering metals remaining at the central region. On the other hand, for C13 and C20, the gas in the direction of the filament is compressed and begins to collapse too rapidly to fall back again into the center because the gas has been dense during MS due to the week ionization efficiency. As Chiaki et al. (2013) predict by one-dimensional calculations, SN shells become gravitationally unstable during expanding in the dense medium. Since the metals coming from behind the shock can not efficiently penetrate into the shock-driven recollapsing region, the only slightly enriched cloud is formed in the offset region against the explosion center. We call the former enrichment process as the central recollapse, and the latter as the shock-driven off-central recollapse.
Figure 8 shows the density and metallicity as a function of the distance from the density maxima of the recollapsing clouds at the time . For MH1-C13 (red curve), the metallicity is in the center while it is higher () at the distance pc, which indicates that metal does not penetrate into the off-center recollapsing region. On the other hand, for C30 (green curve), the metallicity is higher in the center than in the ambient gas, which indicates that metal is sufficiently incorporated into the central part of the recollapsing clouds. The slope of metallicity against the radius continuously becomes opposite with increasing from red to green curves for MH1 and from red to orange curves for MH2 in Figure 8.
We can not see this trend for MH2-C25 and C30. In those cases, a neighbouring halo containing only the pristine gas merges with the central halo from above in Figure 3. For C30, the neighbouring halo goes through the central one with a part of primordial gas accreted (Figure 3). Consequently, the metallicity for C25 and C30 is and , respectively, below the one for C20. The presence of substructures in the MHs can leads to the scatter of metallicity by two orders of magnitude.
Besides, for MH2-C13 and C20, the neighbouring halo approaches the central MH, but they do not merge until the central MH recollapses because is shorter for the less efficient photoionization than C25 and C30. The resulting metallicities with the same for MH1 and MH2 are similar, within a factor of three. Unless the subclumps merge, the hydrodynamic evolution are unaffected by the substructures because they are generally connected with the central MH through cosmological filaments by which the expansion of the H ii region and SN shells is halted.
Since the approaching halo is only 63.5 and 105 pc away from MH2, we expect that EE occurs. For C13, the metallicity in the region centered at the density peak with within the Jeans radius pc is , much smaller than the critical metallicity. For C20, we can not observe metal particles in the neighbouring cloud with maximum density and Jeans radius pc. Smith et al. (2015) perform simulations with a neighbouring cloud at pc from a Pop III star-hosting cloud with , , and erg, and report the cloud is polluted with . This higher metallciity than we obtain may be due to the larger with larger efficiency of photoionization.
We estimate the number fraction of MHs harbouring substructures. We find MHs which have subclumps within 250 pc among 110 cosmological samples of Hirano et al. (2014, see figure D.1 of ()). Although further calculations are required to see whether they merge with the central MHs before the shocked gas recollapses or not, we can see that 30% of MHs will evolve as MH2.
| Halo | Cloud | ||||
|---|---|---|---|---|---|
| [] | [pc] | [] | [pc] | ||
| MH1 | 170 | 1A | 281 | 357 | |
| 1B | 909 | 192 | |||
| 1C | 393 | 251 | |||
| 1D | 656 | 167 | |||
| 1E | 648 | 138 | |||
| 1F | 903 | 159 | |||
| 1G | 593 | 278 | |||
| 200 | 1A | 210 | 392 | ||
| 1B | 873 | 208 | |||
| 1C | 335 | 351 | |||
| 1D | 613 | 186 | |||
| 1E | 550 | 144 | |||
| 1F | 886 | 195 | |||
| 1H | 606 | 165 | |||
| MH2 | 170 | MH2 | — | 211 | |
| 2A | 643 | 213 | |||
| 2B | 613 | 179 | |||
| 2C | 1099 | 207 | |||
| 2D | 1006 | 132 | |||
| 200 | MH2 | — | 210 | ||
| 2A | 632 | 216 | |||
| 2B | 615 | 180 | |||
| 2E | 1312 | 285 | |||
| 2F | 1306 | 110 |
(4) : distance of enriched neighbouring halo from the central MH. (5, 6) , : virial mass and radius of a neighbouring halo.
3.2.2 CCSNe in Massive MHs
For the massive halo (MH3; ), the H ii region can not expand prior to the CCSNe (see Figures 4 and 7) because the gas accretion is more rapid than the expansion of the H ii region. The central density at just before the SNe grows up to – (Table 3) although we turn off molecular cooling above because the gas temperature is still below the virial temperature K.
At yr after the SN explosions, large pressure reduces the gas density in the central region, but it is not sufficient to lead the complete evacuation. While the SN ejecta barely expels in the direction of voids, blast waves are dammed and further push the gas along the filaments. The gas on the root of the filament collapses more rapid than the metal mixing, i.e., the off-central recollapse occurs as we have seen in the previous section (LH-C13 and LH-C20). Figure 4 shows that the distributions of metal particles (orange dots) remaining center with offset to the density peak. The red to green curves in Figure 8 have the steeper dependency on radius than in LH-CCSN. Consequently, the metallicity in the self-enriched region becomes and . This result implies that the next generation stars formed in this recollpased cloud would be similar to the Pop III stars because clouds with metalliciteis below the critical will collapse in a single or several massive object(s) due to insufficient radiative cooling (Omukai, 2000; Schneider et al., 2003; Chiaki et al., 2016). We revisit this issue later in Section 5.3.
3.2.3 PISN in Massive MHs
For the massive halo (MH3), the H ii region can expand only pc, albeit the copious emission of ionization photons () for PISNe. That is caused by the large accretion rate into the massive halo (see Figures 4 and 7).
At yr after the SN explosions, large pressure leads the gas in the central region to be evacuated as for the low-mass MHs. For P170, the recollapse is delayed to 5.85 Myr because of the energetic explosion. For P200, the gas recollapses at the time 28.5 Myr after the SN.
The metallicity in the recollapsing region is and ( and ) for P170 and P200, respectively, above the critical metallicity for the cloud fragmentation so that low-mass EMP stars with the abundance ratio of PISNe which can survive until the present day are likely to be formed. Following the recommendation of Karlsson et al. (2008), we estimate the calcium abundance and , respectively. We also confirm that a PISN can create the highly enriched region due to its large mass of ejected metals as Karlsson et al. (2008) point out. We estimate the number fraction of MHs which will host such stars in Section 4.3.
3.2.4 Summary of dependency of metallicity on and
As we have seen so far, the metallicity range resulting from the self-enrichment of MHs spreads a wide range from to , depending on , and the presence of substructures. In case we consider large and small , H ii region are ‘extinguished’ by the rapid gas accretion along the filaments, and by succeeding SN explosion metal can not sufficiently penetrate into the recollapsing region at the limb of the MH connecting to the filaments as schematically shown in Figure 9 (off-central recollapse). This occurs for LH-C13 and C20, and resulting metallicity is below . Especially for HH-CCSN, the reduction of metallicity is remarkable to be below . In this metallicity range, no CN-EMP stars have been observationally found so far (Figure 1). Therefore, we hereafter call this enrichment mode as the ‘ineffective IE’ mode as a subset of the cases with the off-central recollapse. We will estimate the condition for the mode in Section 4.2.
A series of earlier works reports that the recollapsing regions formed through IE have above the critical metallicity (Ritter et al., 2012, 2015, 2016; Sluder et al., 2016). They however consider that s-1, corresponding to (Schaerer, 2002) and , where H ii region sufficiently break the Pop III hosting cloud in MHs. By performing simulations with lower and higher , we find the ineffective IE mode.
3.3 External enrichment
PISN in Low-mass MHs
In the case of LH-PISN, Figures 3 and 3 show that H ii region expands beyond the virial radius ( pc), since the halo mass is less than the critical mass. Ionizing photons expel to the void regions, but the gas temperature does not change along the filaments of the cosmic web, which leads the shape of H ii region to be bipolar. The gas density decreases down to due to strong pressure as shown by red and green curves in Figure 7, which is consistent with the one-dimensional calculations of Kitayama et al. (2004) and Whalen et al. (2008).
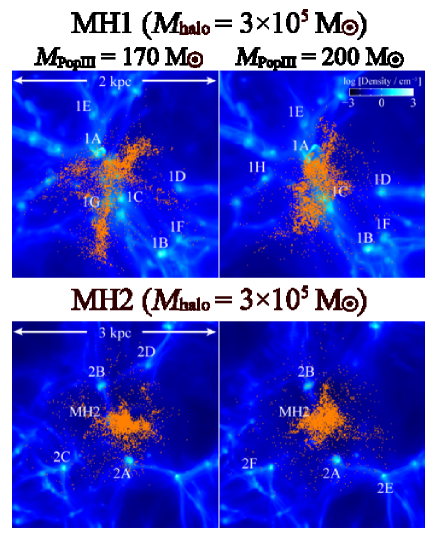
Figure 10 shows the projection of density for LH-PISN. Since the SN shocks go through the rarefied regions, the enriched region extends to – kpc from the locus of the progenitors at Myr after the SN. At that time, the gas density does not reach in the halo hosting the progenitors. Before the self-enrichment, the central density of some neighbouring haloes (dubbed ‘1A’ and ‘2E’) exceeds by the halo mergers although we do not consider molecular cooling at that regions. We terminate the simulation at Myr after the SN explosions because the computational timestep becomes shorter and because star formation activity would begin in the neighbouring haloes.
Within 1.5 kpc from the central halo, several neighbouring haloes reside. To study whether the neighbouring haloes are enriched or not, we pick up the ones with non-zero metallicities within the virial radii. The properties of haloes are listed in Table 4, and their loci are shown in Figure 10. The configurations of these haloes are different between for P170 and P200 because and elapse time after SNe are different. The bottom panels of Figure 11 show the metallicity profile. In most cases, the gas with metals is dammed at the regions with density and does not reach the central densest region of the neighbouring haloes as Chen et al. (2017) reported. Only MH1-P170, metals are penetrated into the center of a neighbouring halo 1A, which is formed through mergers of some haloes. By the merger of one of the progenitors which has been superficially polluted, the metals are incorporated into the central region. Still, the average metallicity within the Jeans radius of 2.4 pc is , which is below the critical metallicity , and low-mass stars are unlikely to be formed.
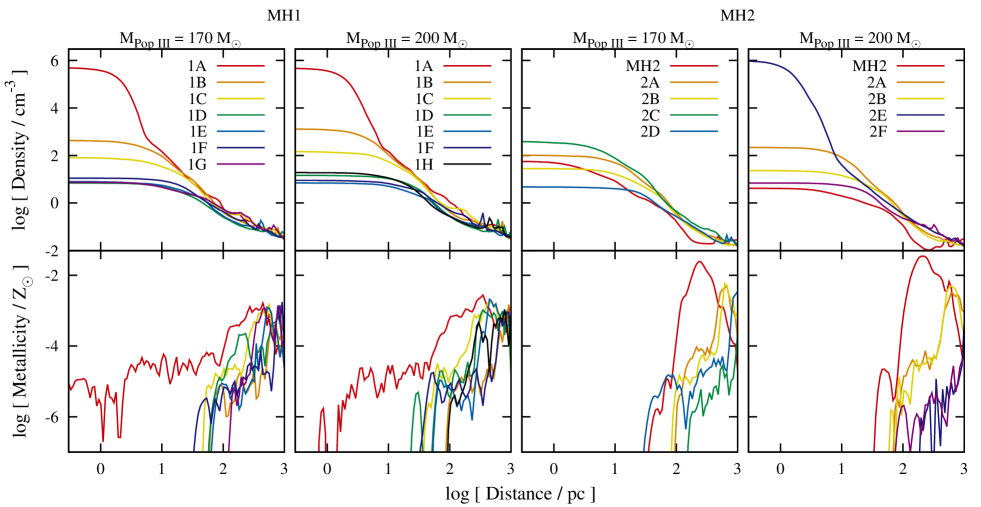
4 Critical halo masses
4.1 Boundary between IE and EE
In this section, we quantitatively define the boundary between IE and EE which is schematically shown by dashed line in Figure 9. First of all, the critical halo mass below which EE realises is defined so that the explosion energy , including the effect of radiative loss, is sufficiently above the gas binding energy . We then introduce the ratio . When the H ii region fails to expand, is required for the MH to be brown away by the explosion. as confirmed by one-dimensional calculations of Kitayama & Yoshida (2005). On the other hand, when H ii region expands, since the SN shocks go through the rarefied gas, is applied. We then estimate the critical halo mass below which the ratio exceeds as,
| (6) |
at with matter to baryon mass ratio 6.
Whether the gas has been diluted by the preceding photoionization is discribed as the critical halo mass above which the Strömgrem radius fails to exceed the radius of a D-type ionization front (I-front) within to expand as an R-type front:
| (7) | |||||
for the initial radial profile of clouds , where is the velocity of the D-type I-front (Kitayama et al., 2004). In Figure 12, the dashed curve shows with and of the results of Schaerer (2002).
Then, the condition for EE is written as
| (8) |
When H ii region can expand (; top-left of Figure 12), MHs with (CCSN) and (PISN), that is, the all regions with undergo EE. When H ii region fails to expand (), MHs with (CCSN) and (PISN) undergo EE. Although a tiny fraction of the region with is favoured for EE for CCSN, let us define the condition for EE is for simplification. For convenience, we present the fitting formula of the boundary as
| (9) | |||||
valid for – and –.
Note that MH1-C30 and MH2-C30 are marginally judged to be the models with EE by this criterion. The estimation of the critical halo mass is still simplified. More simulations with various initial parameters can make the estimation more accurate.
In Figure 12, we also plot the results of previous works. Their results agree with our criterion. Smith et al. (2015) find that EE occurs with the initial halo mass and , and . Ritter et al. (2016) show that IE occurs with and , and resulting metallicity is –. To consider the accretion of pristine gas into MHs, we plot them on 1.2 times larger than their initial values. These parameters are slightly above and below , respectively.
4.2 Condition for ineffective IE
We also define the condition for the ineffective IE presented in Section 3.2.4. In Figure 9, the region of ineffective IE exists lower right corner, where a less massive Pop III star explodes in a massive minihalo. As the necessary condition for this mode, SN remnants should undergo off-central recollapse, where H ii region can hardly break the Pop III star-forming clouds, and even continue to collapse with ineffectively accreting metals. The critical condition (dashed curve in Figure 12) is consistent with the boundary between the central recollapse and off-central recollapse seen in our simulations. The parameters ( and ) for MH1-C13 and C20, where the off-central recollapse occurs, are below the dotted line. The legend’s colour shows the metalliciites in the recollapsing regions in the simulations. The boundary separates the parameters which gives the metallicities above and below . We define the ineffective IE as the cases with . For smaller metallicity boundary, larger is permitted because it can retain more dense pristine clouds during MS of Pop III stars into which metals more hardly penetrate. Multiplying with a factor of six can reproduce the critical halo mass above which ineffective IE occurs as indicated by the dotted curve:
| (10) | |||||
4.3 Number fraction of MHs for each enrichment process
As a next step, we estimate the number fractions of MHs where each enrichment mode occurs. For this purpose, we use the mass distribution of 1538 MHs hosting Pop III stars taken from a cosmological simulations (Hirano et al., 2015a). The top panel of Figure 12 shows it with error bars estimated as the Poisson error. The lower limit is determined by the minimum virial temperature K above which primordial gas can collapse by the radiative cooling owing to hydrogen molecules while the upper limit is determined by the redshift-dependent intensity of dissociation photons from the neighbouring haloes. In this range, the mass distribution of MHs is fitted by a log-normal function truncated at those masses. With the least squares, its mean and standard deviation are estimated as and , respectively (red dashed curve in Figure 12).
Since the critical halo masses ( and ) depend on , we should assume some IMF of Pop III stars: the flat and Salpeter IMFs with slope indices and , respectively. Using this halo mass function and Pop III IMF, the number fractions of MHs with each enrichment mode are estimated for PISNe and CCSNe (Table 5).
For PISNe, our simulations suggest that almost all MHs undergo EE in the relevant mass range by the large efficiency of photoionization and large explosion energy regardless of the Pop III IMF. This shows that negligible fractions (–) of MHs create low-mass EMP stars with the abundance ratio of PISNe even if such massive progenitors exist. It is consistent with the observations showing that such EMP stars have not been observed so far as further discussed in the next section.
For CCSNe, EE is predicted to occur 42% and 13% of MHs for the flat and Salpeter IMFs, respectively. More than half of MHs are sufficiently self-enriched to form metal-poor star-forming clouds with metallicities . For the flat and Salpeter IMF, only 1% and 5% of MHs more massive than , thereby they undergo ineffective IE.
| SN | Enr. mode | Fraction | ||
|---|---|---|---|---|
| flat IMF | Salpeter IMF | |||
| PI | EE | |||
| IE | ||||
| CC | EE | |||
| IE | ||||
| in-IE | ||||
Note — (2) Enrichment mode: external enrichment (EE), internal enrichment (IE), and ineffective IE (in-IE). See Section 4.3 for the detailed descriptions.
5 Comparison with the observations of EMP stars
5.1 Formation of massive Pop III exploding as PISNe
Although we see that IE occurs for our HH-PISN models, such a massive halo with is very rare (Figure 12). This indicates that Pop II stars which inherit elemental abundance ratios of PISNe are hardly formed in the metallicity range of because almost all MHs are blown away by the copious emission of ionizing photons from massive Pop III stars and energetic explosion of PISNe even if they exist. Although 1,401 stars with have already been observed until September 2017, EMP stars with the elemental abundance ratio of PISNe have not been observed yet, or only one candidate (Aoki et al., 2014). Our results suggest that – stars should be observed to find a star with a sign of PISNe.
Some researches suggest that even the existence of the progenitors is unlikely. Some numerical works show the fragmentation of primordial clouds (Bromm et al., 1999) and accretion disk around a Pop III protostar (Greif et al., 2011; Stacy et al., 2012; Susa et al., 2014; Hosokawa et al., 2016; Hirano & Bromm, 2017). Also, it has been suggested that even with the Salpeter IMF the inefficient sampling of stellar mass fails to create such massive stars exploding as PISNe, because MHs are expected to have smaller star formation efficiencies due to their lack of coolant (de Bennassuti et al., 2014, 2017).
| Observation | Model | This work | |||||||
| Star | Ref. | Halo | |||||||
| [] | [] | [] | [] | ||||||
| HE0557 | I14 | 25 | 1 | 1.7 | MH1 | ||||
| MH2 | |||||||||
| MH3 | |||||||||
| T14 | 25 | 5.0 | 1.78 | MH1 | |||||
| MH2 | |||||||||
| MH3 | |||||||||
| M15 | 20 | 1.0 | 5 | MH1 | |||||
| MH2 | |||||||||
| MH3 | |||||||||
| HE0107 | I14 | 25 | 1 | 1.7 | MH1 | ||||
| MH2 | |||||||||
| MH3 | |||||||||
| T14 | 25 | 5.0 | 1.90 | MH1 | |||||
| MH2 | |||||||||
| MH3 | |||||||||
| HE1327 | I14 | 25 | 1 | 1.7 | MH1 | ||||
| MH2 | |||||||||
| MH3 | |||||||||
| T14 | 25 | 0.72 | 1.69 | MH1 | |||||
| MH2 | |||||||||
| MH3 | |||||||||
| M15 | 30 | 1.6 | 5 | MH1 | |||||
| MH2 | |||||||||
| MH3 | |||||||||
| [] | |||||||||
| SM0313 | I14 | 25 | 1 | 2.0 | MH1 | ||||
| MH2 | |||||||||
| MH3 | |||||||||
Note — The observed data and for the CE-EMP stars are taken from SAGA database and references therein. Using the Fe mass ejected from the progenitors modeled by Ishigaki et al. (2014, I14), Tominaga et al. (2014, T14), and Marassi et al. (2015, M15), we estimate the iron abundance in the recollapsing region when each progenitor explodes in MH1, MH2, and MH3. The MH models in which is close to within 0.5 dex are written in bold.
5.2 C-enhanced EMP stars
We have calculated the metallicity in the recollapsing region for CCSNe which produce the C-normal abundance ratio. For stars with , the fraction of CE-EMP stars increase as [Fe/H] decreases (Beers & Christlieb, 2005). In order to reproduce the elemental abundance of CE-EMP stars, the model of faint SNe (FSNe) is often employed. In the mixing-fallback scenario, the inner layer of ejecta enriched with Fe-peak elements sink into central compact objects while the outer C-rich layer is ejected. Although the models of a single FSN can well reproduce abundance patterns of CE-EMP stars, it has not been numerically shown that the metallicity of the gas enriched by a FSN can reproduce the absolute metallicity, or Fe abundance .
Our results can be applied to general SN models with the common progenitor mass and explosion energy , which determine the density distribution of the ambient gas. Since we do not calculate the back reaction of the metal distribution to the hydrodynamic motions of gas such as the additional radiative cooling owing to metal and dust, we can reproduce the spatial distribution of metal ejected from any SN models by just scaling the total metal mass. We here employ models tailored to reproduce the elemental abundances of CE-EMP stars, - (HE0557), - (HE0107), - (HE1327), and - (SM0313), presented by Ishigaki et al. (2014, I14), Tominaga et al. (2014, T14), and Marassi et al. (2015, M15). To compare with observations, we estimate from the iron mass of each SN model with equation (5). Since the efficiency of metal dispersion varies among the MHs, we estimate for each MH as shown in Table 6. The MH models which can reproduce within 0.5 dex are written in bold.
For the star HE0557 with a moderate C-enhancement , the resulting metallicities for the progenitor model of I14 for MH1 is consistent with the observed metallicity . The model of T14 for MH2 can explain the formation of HE0557. Note that in their model is erg while erg in our simulations. Simulations with erg would result in smaller metallicities because the metals would be brown away to larger distances. For M15, the metallicity is smaller than the observed abundance because of the larger mass-cut and accordingly smaller ejected metal mass. For the massive halo MH3, where ineffective IE takes place, the metallicities are smaller than the observed one by more than three orders of magnitude for every progenitor model. This indicates that IE from FSN hosted by MH1 and MH2 with normal halo mass can explain the formation of the C-moderate star.
For the star HE0107, and are consistent among the literatures. Although M15 present the progenitor model, their best-fit model is for with which we do not simulate the process of metal dispersion. In the models of I14 and T14 for MH1, and , respectively, are slightly smaller than by a factor of 0.1–0.3 dex.111Take care that the iron abundance does not violate the critical condition for the formation of low-mass stars in the CE-EMP regime. Instead of silicate grains, carbon grains are dominant species and gives the critical C abundance as (Marassi et al., 2014). The predicted metallicity for MH2 is smaller than for MH1 because a pristine cloud falls into the central halo before the shocked shell accretes again. As for HE0557, the metallicity for MH3 is further smaller than MH1 by three orders of magnitude. Let us thus conclude that IE from a FSN hosted by a less-massive halo without sub-structures is most likely to explain the formation of the star HE0107.
For HE1327, the tendency of metallicity among MHs is the same as for HE0107. However, the predicted metallicity is smaller than the observed one by a factor of at least 0.8–0.9 dex for MH1. The FSN scenario generally predicts the smaller mass of ejected metal relative to normal CCSNe due to the fallback of material into the core. To create the star-forming region simultaneously satisfying the large C-enhancement and metallicity , multiple SN explosions including FSN would be required.
For SM0313, Keller et al. (2014) measure only the upper limit of its iron abundance. Therefore, we compare the carbon abundance predicted from our simulations with the one constrained by the observation. I14 and M15 present the progenitor models which can reproduce its elemental abundance ratio. The best-fit model by M15 is with , for which we here do not calculate. The model with of I14 predicts the carbon mass of . For MH1, we can predict the carbon abundance in the recollapsing clouds to be , which is consistent with the observation with a 3D-LTE model. For MH2, the C abundance is smaller as because the pristine clouds merge with the central cloud. It is likely that IE from a single FSN hosted by isolated less-massive halo can explain the formation of the most iron-poor star observed.
5.3 Critical metallicity
For HH-CCSN, the metallicity resulting from the off-central recollapse is very small, less than (the triangle symbols in Figure 1). For FSNe exploding in MH3, the carbon fraction becomes (Table 6). Figure 1 shows that EMP stars with this metallicity range () have so far not been found (gray shaded region). From the theoretical point of view, clouds in such a metallicity range collapse to form a single massive objects due to the lack of cooling efficiency of dust grains (Omukai, 2000; Schneider et al., 2003; Chiaki et al., 2017). On the other hand, some researchers report that the fragmentation of the accretion disk around a Pop III protostellar core leads to low-mass star formation below the critical metallicity. Consequently, the clouds with might have similar properties of fragmentation process, since its thermal evolution is almost identical to the primordial one.
By EE and ineffective IE modes, metallicities in the recollapsing regions do not reach the critical metallciity. Our simulations predict the number fraction of MHs which undergo EE and ineffective IE as 18–43% for CCSNe (Section 4.3). Suppose that the slightly enriched clouds in these MHs collapse to low-mass objects through the fragmentation, then the number fraction of EMP star would also become 18–43% for the simple estimation. From the number of EMP stars ever observed (1,401), the number of stars below the critical metallicity would be 252–602, which can not explain the current observations. Therefore, the scenario of dust-driven fragmentation would be favored to the current observation. We should note that the estimation may be oversimplified because we assume that the IMF of Pop III is uniform in all mass range of MHs and that the number of fragments is uniform in all metallicity range.
6 Discussion
6.1 Enrichment efficiency of MHs
Although we have so far estimated the averaged metallicities of the recollapsing gas clouds within their Jeans length and of EMP stars which collapse earliest, the succeeding EMP star formation will take place in the whole region of MHs. We in this section estimate the average metallicity and the efficiency of metal enrichment of each MH as indicated by the dashed lines in Figure 6 and the last column of Table 3.
We introduce the mass ratio of metal and primordial gas particles within the virial radius at to the initial as
| (11) | |||||
| (12) |
We only consider metal and gas particles trapped by the DM potential well with the radial velocity smaller than the escape velocity . These factors are shown in the seventh to eighth columns of Table 3.
The simple estimation of the metallicity in a MH is the mass ratio
.
The factor gives the correction
for it.
For example,
for MH1-C30, but the 60.2% of metal is dispersed into the voids and the MH accretes the primordial
gas with 2.62 times its initial mass.
The dilution of metal by the factor of results in the eventual metallicity
.
CCSNe in low-mass MHs
For LH-CCSN, the metallicity range is –,
comparable to in the center of the recollapsing regions.
The dashed lines in Figure 6 shows that
the dependency of the metallicity on is mitigated relative to the solid lines
by averaging the metallicity in the wider region
beyond the offset between the metal and primordial gas distributions for ineffective IE.
Since the accretion of primordial gas overcomes its evacuation by SN explosion,
the primordial gas mass increases by a factor of 44.2–117.2.
Whereas, about a half (0.254–0.701) of metals remain in the virial radius.
Consequently, the resulting metallicity is smaller than the simple estimation by a factor of .
For MH2-CCSN, is larger than for MH1-CCSN because of the halo merger.
CCSNe in massive MHs
For HH-CCSN, since a large fraction of metal does not enter the central clouds
but remains within the virial radius (Figure 8), the metallicity
range is –, slightly above the critical metallicity
(Figure 6).
Both and are larger than those
for LH-CCSN by the larger accretion rate and by the smaller .
PISNe in massive MHs
For HH-PISN, both and is
comparable those for HH-CCSN.
However, the mass is larger by a factor of ten (Table 2),
the metallicity is also larger by the same factor.
For MH3-P200, the metallicity is smaller than P170 because a neighbouring halo is merged, and
the dense primordial envelope spreads around the enriched cloud.
6.2 Caveats
Our method can uncover the various nature of metal enrichment occurring in the transition from first-generation metal-free Pop III stars to Pop II star formation. Some caveats still remain in our methodology.
6.2.1 Star formation in neighbouring haloes
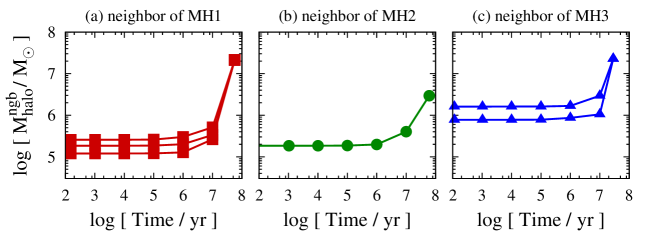
In our simulations, gas contraction is prohibited by switching off molecular cooling in the other haloes than the central one only whose stellar feedbacks interests us in this work. In reality, feedbacks from stars formed in neighbouring haloes can affect the propagation of shocks from the central star. Also, in some recollapsing regions, the metallicity will be the sum of the contributions from more than one halo, and the elemental abundance ratio will be the superposition of them. In this section we discuss the efficiency of the feedback from stars hosted by the neighbouring haloes, following the evolution of their mass in the case of P200, where we can follow the longest growth history of haloes.
The halo 1A (see Figure 10) becomes the closest to MH1. It is formed through the merger of three haloes and accretion of the intergalactic gas. Figure 13(a) shows the temporal evolution of the masses of the progenitors and 1A. The progenitors contain , , and within Myr after the SN explosion in MH1, and they increase by a factor of two at 10 Myr. They reside at the distance pc from MH1. At Myr, eventually, the mass and distance of 1A becomes and pc, respectively. For CCSNe, since the SN shocks should go beyond the dense filament to reach MH1, they are unlikely to affect the hydrodynamic evolution of shocks from MH1. For PISNe, although the shocks and metal will reach MH1, metal can not penetrate the central clouds as we have seen above. Since the mass evolution of the neighbouring halo of MH2 is similar to that of MH1 (Figure 13b), we can conclude that the external explosion around MH2 neither likely affect the propagation of shock and metal from MH2.
For massive halo (MH3), the neighbouring haloes are also massive with and in the initial state. Thus, the feedbacks from the stars in these haloes can not affect the hydrodynamics of the shocks from MH3 through the filaments connecting them to MH3. However, these haloes eventually merge with MH3 at Myr after the SN. When the stars in the neighbouring haloes explode in the vicinity of MH3, the shock will affect and metal is mixed in the recollapsing region. We will examine this by permitting star formation in all haloes in forthcoming papers.
6.2.2 Multiple star formation in a halo
We assume that each MH hosts a single Pop III star. However, the number of Pop III stars which are hosted by a MH is still uncertain. Multiple star formation in a MH through the fragmentation of accretion disk around the primary protostar has been reported by some numerical works (Bromm et al., 1999; Clark et al., 2011; Greif et al., 2011; Stacy et al., 2012; Susa, 2013; Susa et al., 2014; Hosokawa et al., 2016; Hirano & Bromm, 2017). Majority of those fragments seem to fall in the range of CCSN. On the other hand, the explosion energy of PISNe is larger than that of CCSNe by a factor of . Hence if the number of fragments is , the total explosion energy becomes larger than that of a single PISN.
However, it has been reported that the number of fragments less than 30 thereby the multiple CCSNe would be less energetic than the PISN case investigated in the present simulations. Thus the dynamics of the ejecta of the multiple CCSNe would be in between the CCSN and PISN cases shown in the present paper. It also will increase the amount of metals by some factors. These issues will be addressed in the forthcoming papers.

6.2.3 Resolution
Metals mix into the pristine gas mainly due to the turbulence driven by fluid instabilities around shocks. Since the size of eddies cascades into smaller scales, it is ideally required to resolve down to the scale at which the eddies are dissipated to see the full mixing processes. In our simulations, the minimum spacial resolution is 1.3 pc (equation 1) because of the large simulation region. In order to investigate the wide range of the parameters, we can not perform convergence tests.
Instead, we compare our results with the recent work (Chen et al., 2017): high-resolution two-dimensional simulations of the region where a SN shock hits a neighbouring pristine cloud with the minimum resolution of 0.015 pc. The separation of the target cloud and SN is 250 pc both in their work and in our LH-PISN models (Table 4). They show that SN shocks drive the Rayleigh-Taylor (RT) instability at the wall of the target cloud, but metals fails to incorporate into the clouds in most cases. The penetration of metals halt at the position 30 pc away from the cloud center (figure 9 in their paper) as seen also in our results (Figure 11). Even with our spatial resolution coarser, the behavior of metal mixing is consistent with their results.
The resolution also affects the cooling efficiency by metals in a dense snowplough shell and recollaising region. We ignore metal cooling in the enriched gas. In the simulations of cosmological star formation history by Schaye et al. (2010), the global star formation rate is underestimated in the run without metal cooling. Ritter et al. (2016) shows that fragments insufficiently enriched by a SN undergo loitering for 10 Myr while cooling time in a clump with becomes smaller than the dynamical time-scale due to C and O fine-structure coolings to start run-away collapse. Figure 14 shows the ratio of cooling time to dynamical time as a function of distance from the collapse center in our simulation with MH1-C30, where the metallicity in the recollapsing center becomes . The ratio becomes smaller for the case with metal cooling (dashed curve) than only with contribution of primordial species (solid curve) by a factor of two. In that case, cloud collapse becomes faster, and efficiency of metal mixing would become lower. We will confirm this in the forthcoming paper.
7 Conclusion
By the numerical simulations for the ionization and SN feedbacks, we estimate the metallicities in the recollapsing region which will be Pop II star-forming clouds or continue to be in the Pop III star formation regime. Thanks to the simulations with a range of initial parameters, and , and the initial gas distributions with various substructures, we find that a few enrichment modes can occur, and the metallicity range accordingly varies. We have found that
-
•
there are two general enrichment processes by Pop III SNe: internal enrichment (IE) and external enrichment (EE). They exclusively occurs depending on and ().
-
•
for CCSNe, a non-negligible fraction (13–42%) of MHs undergo EE to form recollapsing clouds with . So far no CN-EMP stars with the metallicity range are observed, indicating that the inefficient dust cooling prevents low-mass stars from being formed.
-
•
for PISNe, IE takes place for a negligible fraction of MHs, which is consistent with the current observations: no EMP stars have so far been observed.
-
•
faint supernova (FSN) models, that reproduce the abundance ratio of CE-EMP stars, can also successfully account for the absolute iron/carbon abundance of those stars in the recollapsing regions.
-
•
we can therefore conclude that the enrichment mode IE of MHs from a single CCSN or FSN event can explain the formation of CN- and CE-EMP stars.
These findings are compared with the observations of EMP stars in the halo region of our Galaxy, and ultra-faint dwarfs (UFDs). Although our knowledge is now limited to a single event of transition from Pop III star formation to the succeeding generation of stars, i.e., the very first step of the matter cycle in ISM, we will extend this study to the early-generations of galaxies in which a number of cycles take place and directly observed by the next-decade instruments such as JWST and TMT.
acknowledgments
We are grateful for the anonymous referee to the suggestions and comments for our work. We also thank T. Nozawa and M. Ishigaki who kindly give us the SN models. Thanks to the deep insight of R. Schneider, L. Graziani, N. Tominaga, and T. Ishiyama, we can improve our manuscript. GC and SH are supported by Research Fellowships of the Japan Society for the Promotion of Science (JSPS) for Young Scientists. HS acknowledges the financial supports from JSPS Grant-in-Aid for Scientific Research (17H01101,17H02869,17H06360). The numerical simulations in this work are carried out on Cray XC30 at Center for Computational Astrophysics, National Astronomical Observatory of Japan and on Cray XC40 at the Yukawa Institute Computer Facility.
References
- Abel et al. (2002) Abel, T., Bryan, G. L., & Norman, M. L. 2002, Science, 295, 93
- Aoki et al. (2007) Aoki, W., Beers, T. C., Christlieb, N., et al. 2007, ApJ, 655, 492
- Aoki et al. (2014) Aoki, W., Tominaga, N., Beers, T. C., Honda, S., & Lee, Y. S. 2014, Science, 345, 912
- Asplund et al. (2009) Asplund, M., Grevesse, N., Sauval, A. J., & Scott, P. 2009, ARA&A, 47, 481
- Audouze & Silk (1995) Audouze, J., & Silk, J. 1995, ApJ, 451, L49
- Barrow et al. (2017a) Barrow, K. S. S., Wise, J. H., Norman, M. L., O’Shea, B. W., & Xu, H. 2017, MNRAS, 469, 4863
- Barrow et al. (2017b) Barrow, K. S. S., Wise, J. H., Aykutalp, A., et al. 2017, arXiv:1709.04473
- Beers & Christlieb (2005) Beers, T. C., & Christlieb, N. 2005, ARA&A, 43, 531
- Bromm et al. (1999) Bromm, V., Coppi, P. S., & Larson, R. B. 1999, ApJ, 527, L5
- Bromm & Loeb (2003) Bromm, V., & Loeb, A. 2003, Nat, 425, 812
- Bromm & Yoshida (2011) Bromm, V., & Yoshida, N. 2011, ARA&A, 49, 373
- Bromm (2014) Bromm, V. 2014, Science, 345, 868
- Cayrel et al. (2004) Cayrel, R., Depagne, E., Spite, M., et al. 2004, A&A, 416, 1117
- Clark et al. (2011) Clark, P. C., Glover, S. C. O., Smith, R. J., et al. 2011, Science, 331, 1040
- Chen et al. (2017) Chen, K.-J., Whalen, D. J., Wollenberg, K. M. J., Glover, S. C. O., & Klessen, R. S. 2017, ApJ, 844, 111
- Chen et al. (2017) Chen, K.-J., Heger, A., Whalen, D. J., et al. 2017, MNRAS, 467, 4731
- Chiaki et al. (2013) Chiaki, G., Yoshida, N., & Kitayama, T. 2013, ApJ, 762, 50
- Chiaki et al. (2015) Chiaki, G., Marassi, S., Nozawa, T., et al. 2015, MNRAS, 446, 2659
- Chiaki & Yoshida (2015) Chiaki, G., & Yoshida, N. 2015, MNRAS, 451, 3955
- Chiaki et al. (2016) Chiaki, G., Yoshida, N., & Hirano, S. 2016, MNRAS, 463, 2781
- Chiaki et al. (2017) Chiaki, G., Tominaga, N., & Nozawa, T. 2017, MNRAS, 472, L115
- de Bennassuti et al. (2014) de Bennassuti, M., Schneider, R., Valiante, R., & Salvadori, S. 2014, MNRAS, 445, 3039
- de Bennassuti et al. (2017) de Bennassuti, M., Salvadori, S., Schneider, R., Valiante, R., & Omukai, K. 2017, MNRAS, 465, 926
- Dehnen & Aly (2012) Dehnen, W., & Aly, H. 2012, MNRAS, 425, 1068
- Draine & Bertoldi (1996) Draine, B. T., & Bertoldi, F. 1996, ApJ, 468, 269
- Frebel et al. (2005) Frebel, A., Aoki, W., Christlieb, N., et al. 2005, Nat, 434, 871
- Greif et al. (2011) Greif, T. H., Springel, V., White, S. D. M., et al. 2011, ApJ, 737, 75
- Hahn & Abel (2011) Hahn, O., & Abel, T. 2011, MNRAS, 415, 2101
- Heger & Woosley (2002) Heger, A., & Woosley, S. E. 2002, ApJ, 567, 532
- Hirano et al. (2014) Hirano, S., Hosokawa, T., Yoshida, N., et al. 2014, ApJ, 781, 60
- Hirano et al. (2015a) Hirano, S., Hosokawa, T., Yoshida, N., Omukai, K., & Yorke, H. W. 2015, MNRAS, 448, 568
- Hirano et al. (2015b) Hirano, S. 2015, Ph.D. Thesis, The University of Tokyo
- Hirano & Bromm (2017) Hirano, S., & Bromm, V. 2017, MNRAS, 470, 898
- Hosokawa et al. (2016) Hosokawa, T., Hirano, S., Kuiper, R., et al. 2016, ApJ, 824, 119
- Ishigaki et al. (2014) Ishigaki, M. N., Tominaga, N., Kobayashi, C., & Nomoto, K. 2014, ApJ, 792, L32
- Jappsen et al. (2007) Jappsen, A.-K., Glover, S. C. O., Klessen, R. S., & Mac Low, M.-M. 2007, ApJ, 660, 1332
- Karlsson et al. (2008) Karlsson, T., Johnson, J. L., & Bromm, V. 2008, ApJ, 679, 6-16
- Keller et al. (2014) Keller, S. C., Bessell, M. S., Frebel, A., et al. 2014, Nature, 506, 463
- Kitayama et al. (2004) Kitayama, T., Yoshida, N., Susa, H., & Umemura, M. 2004, ApJ, 613, 631
- Kitayama & Yoshida (2005) Kitayama, T., & Yoshida, N. 2005, ApJ, 630, 675
- Komiya et al. (2015) Komiya, Y., Suda, T., & Fujimoto, M. Y. 2015, ApJ, 808, L47
- Magg et al. (2017) Magg, M., Hartwig, T., Agarwal, B., et al. 2017, arXiv:1706.07054
- Marassi et al. (2015) Marassi, S., Schneider, R., Limongi, M., et al. 2015, MNRAS, 454, 4250
- Marassi et al. (2014) Marassi, S., Chiaki, G., Schneider, R., et al. 2014, ApJ, 794, 100
- Nagakura et al. (2009) Nagakura, T., Hosokawa, T., & Omukai, K. 2009, MNRAS, 399, 2183
- Nozawa et al. (2007) Nozawa, T., Kozasa, T., Habe, A., et al. 2007, ApJ, 666, 955
- Omukai (2000) Omukai, K. 2000, ApJ, 534, 809
- Planck Collaboration et al. (2016) Planck Collaboration, Ade, P. A. R., Aghanim, N., et al. 2016, A&A, 594, A13
- Ritter et al. (2012) Ritter, J. S., Safranek-Shrader, C., Gnat, O., Milosavljević, M., & Bromm, V. 2012, ApJ, 761, 56
- Ritter et al. (2015) Ritter, J. S., Sluder, A., Safranek-Shrader, C., Milosavljević, M., & Bromm, V. 2015, MNRAS, 451, 1190
- Ritter et al. (2016) Ritter, J. S., Safranek-Shrader, C., Milosavljević, M., & Bromm, V. 2016, MNRAS, 463, 3354
- Ryan et al. (1996) Ryan, S. G., Norris, J. E., & Beers, T. C. 1996, ApJ, 471, 254
- Schaerer (2002) Schaerer, D. 2002, A&A, 382, 28
- Schneider et al. (2003) Schneider, R., Ferrara, A., Salvaterra, R., Omukai, K., & Bromm, V. 2003, Nature, 422, 869
- Schaye et al. (2010) Schaye, J., Dalla Vecchia, C., Booth, C. M., et al. 2010, MNRAS, 402, 1536
- Schneider et al. (2006) Schneider, R., Omukai, K., Inoue, A. K., & Ferrara, A. 2006, MNRAS, 369, 1437
- Schneider et al. (2012) Schneider, R., Omukai, K., Bianchi, S., & Valiante, R. 2012a, MNRAS, 419, 1566
- Shapiro & Kang (1987) Shapiro, P. R., & Kang, H. 1987, ApJ, 318, 32
- Sluder et al. (2016) Sluder, A., Ritter, J. S., Safranek-Shrader, C., Milosavljević, M., & Bromm, V. 2016, MNRAS, 456, 1410
- Smith et al. (2015) Smith, B. D., Wise, J. H., O’Shea, B. W., Norman, M. L., & Khochfar, S. 2015, MNRAS, 452, 2822
- Springel (2005) Springel, V. 2005, MNRAS, 364, 1105
- Stacy et al. (2012) Stacy, A., Greif, T. H., & Bromm, V. 2012, MNRAS, 422, 290
- Stacy et al. (2012) Stacy, A., Greif, T. H., & Bromm, V. 2012, MNRAS, 422, 290
- Suda et al. (2008) Suda, T., Katsuta, Y., Yamada, S., et al. 2008, PASJ, 60, 1159
- Suda et al. (2017) Suda, T., Hidaka, J., Aoki, W., et al. 2017, PASJ, 69, 76
- Susa (2006) Susa, H. 2006, PASJ, 58, 445
- Susa (2013) Susa H., 2013, ApJ, 773, 185
- Susa et al. (2014) Susa, H., Hasegawa, K., & Tominaga, N. 2014, ApJ, 792, 32
- Tominaga et al. (2014) Tominaga, N., Iwamoto, N., & Nomoto, K. 2014, ApJ, 785, 98
- Tornatore et al. (2007a) Tornatore, L., Ferrara, A., & Schneider, R. 2007, MNRAS, 382, 945
- Tornatore et al. (2007b) Tornatore, L., Borgani, S., Dolag, K., & Matteucci, F. 2007, MNRAS, 382, 1050
- Truelove et al. (1997) Truelove, J. K., Klein, R. I., McKee, C. F., et al. 1997, ApJ, 489, L179
- Umeda & Nomoto (2002) Umeda, H., & Nomoto, K. 2002, ApJ, 565, 385
- Umeda & Nomoto (2003) Umeda, H., & Nomoto, K. 2003, Nature, 422, 871
- Whalen et al. (2008) Whalen, D., van Veelen, B., O’Shea, B. W., & Norman, M. L. 2008, ApJ, 682, 49
- Wise et al. (2012) Wise, J. H., Turk, M. J., Norman, M. L., & Abel, T. 2012, ApJ, 745, 50
- Xu et al. (2013) Xu, H., Wise, J. H., & Norman, M. L. 2013, ApJ, 773, 83
- Yoshida et al. (2003) Yoshida, N., Abel, T., Hernquist, L., & Sugiyama, N. 2003, ApJ, 592, 645