Singlet state formation and its impact on magnetic structure in tetramer system SeCuO3
Abstract
We present an experimental investigation of the magnetic structure in a tetramer system SeCuO3 using neutron diffraction and nuclear resonance techniques. We establish a non-collinear, commensurate antiferromagnetic ordering with a propagation vector . The order parameter follows a critical behavior near K, with a critical exponent in agreement with a 3D universality class. Evidence is presented that a singlet state starts to form on tetramers at temperatures as high as 200 K, and its signature is preserved within the ordered state through a strong renormalization of the ordered magnetic moment on two non-equivalent copper sites, and at 1.5 K.
I Introduction
Classical, 3-dimensional magnetic systems tend to order in a long-range magnetic structure due to the presence of interaction between magnetic moments. Their behavior around the ordering temperature is well understood in terms of thermally induced fluctuations. More interesting behavior is found when the system is subject to quantum fluctuations, governed by an external parameter other than temperature. Quantum effects become especially important when the geometrical arrangement of magnetic moments induces frustration in selection of a unique ground-state via competing interactions and/or the effective dimensionality is reduced to . Recent investigations of triangular- and kagome-based systems Li et al. (2016); Han et al. (2012) with signatures of a potential quantum spin-liquid phase reveal how quantum effects can completely prevent long-range order from occurring.
The ultimate limit of low-dimensional reduction is reached when a local cluster of spins is separated from other clusters around it. Significant attention has been devoted to single-molecule magnets, with strong single-ion anisotropy governing macroscopic quantum tunneling of magnetization Sessoli et al. (1993). In these metal-organic compounds the interaction between clusters is negligible due to large separation by organic ligands. On the other hand, in recent years several compounds have been discovered where the inter-cluster interaction allows the observation of subtle effects that govern the transition from local quantum states towards delocalized spin-waves. For instance in TlCuCl3 pressure can be used as a tuning parameter for inter-cluster interaction, allowing the observation of closing the singlet-triplet gap and the emergence of long-range AFM order Rüegg et al. (2004). In other compounds, where the interactions are not easily modified, it remains an outstanding question of how the specific ratio of intra- to inter-cluster interaction(s) influences magnetic properties of a given compound. This becomes especially interesting when clusters are composed of more than just two AFM-coupled spins, increasing the number of local quantum states. With three spins in the cluster the ground state has a non-zero spin state and a divergent magnetic susceptibility when . The 4-spin AFM-based clusters, called tetramers, again exhibit a singlet ground state but now the excited states comprise additional singlet state, three triplets and a quintet. Their relative order is determined by the geometry of the cluster and the relative strength of intra-cluster interactions Haraldsen et al. (2005).
Several compounds have been reported that adhere to the weakly-coupled tetramer model. A tetrahedron configuration of S=1/2 spins have been found in Cu2Te2O5Cl2 and Cu2Te2O5Br2, with intra-cluster interactions only twice larger than inter-cluster ones Prester et al. (2004). A diamond-shape cluster has been found in Cu2PO4OH, with intra-cluster interaction around 140 K and without long-range order down to 2 K Kuo and Lue (2008). A linear tetramer system has been found in Cu2CdB2O6 Hase et al. (2005), SeCuO3 Živković et al. (2012) and CuInVO5 Hase et al. (2016), all showing strong intra-cluster interactions of 100-300 K, with long-range order occurring below 10 K, suggesting inter-cluster interactions two orders of magnitude smaller.
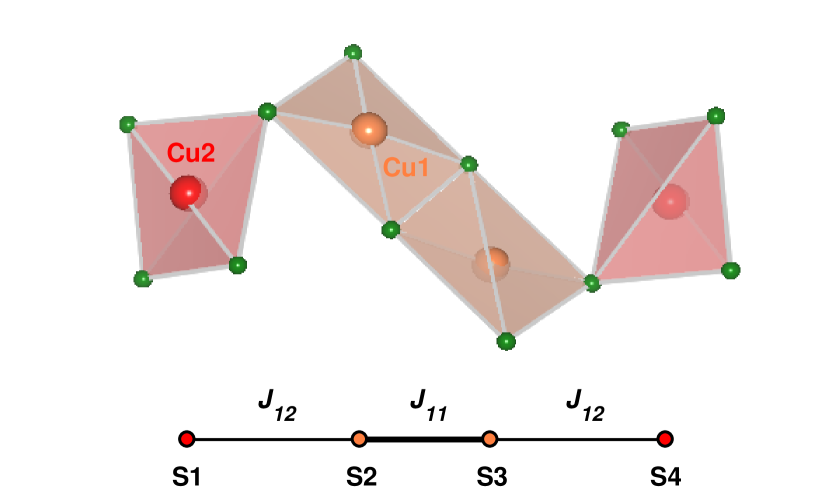
In this article we focus our attention on SeCuO3 and the peculiarities of its magnetic ground state. SeCuO3 crystallizes in a monoclinic unit cell with the space group P21/ as reported in Ref Effenberger, 1986. It has two crystallographically inequivalent copper sites, Cu1 and Cu2. Each copper is surrounded by six oxygen atoms which form elongated octahedrons: the four nearest oxygen ions (distance around ) form CuO4 plaquettes, with apical oxygens further away (). This crystal configuration places the -dominated orbital highest in energy, with a single magnetically active electron Živković et al. (2012). Each Cu1 site is connected via two oxygens to another Cu1 site (interaction ), and with a single oxygen to the Cu2 site (interaction ), effectively forming a Cu2 – Cu1 – Cu1 – Cu2 linear tetramers (Fig. 1). The Hamiltonian of a spin tetramer is expressed through the Heisenberg interactions:
| (1) |
Previous results Živković et al. (2012); Herak et al. (2014) showed that magnetic moments in SeCuO3 form isolated tetramers, so the system behaves like a quasi zero-dimensional antiferromagnet. The tetramer Hamiltonian (Eq. 1) was used to explain experimental results down to K, determining and to be approximately 225 K and 160 K, respectively. The system remains disordered down to K where a 3D antiferromagnetic (AFM) order sets in. The magnetically ordered ground state emerges when the singlet ground state hybridizes with the excited states due to mixing by intertetramer interactions and/or anisotropy terms. No clear model exists to explain the experimental results in the intermediate phase (8 K – 90 K). The tetramer model is not able to reproduce the steep increase in magnetic susceptibility but a broad maximum around 20 K suggests low-dimensional behavior. An interesting aspect has been revealed by ESR and torque magnetometry Herak et al. (2014) where a strong rotation of magnetic axes in the intermediate temperature range was observed. Recent magnetization measurements at high magnetic field, ESR and 77Se NMR reported a magnetic anomaly in the ordered phase below K which supposedly occurs due to a spin reorientation (Ref. Lee et al., 2017).
In this paper we address the aspects of the magnetic structure within the ordered state using neutron diffraction and 63,65Cu NQR resonance measurements. We found no trace of the anomaly or spin reorientation reported in Ref. Lee et al., 2017 and present evidence of the Cu1-Cu1 spin singlet formation below K.
II Experimental details
Single crystals of SeCuO were grown by a standard chemical vapor phase method. Mixture of analytical grade purity CuO and SeO powders in molar ratio 4:3 was sealed in the quartz tubes with electronic grade HCl as the transport gas for the crystal growth. The ampules were then placed horizontally into a tubular two-zone furnace and heated very slowly by to . The optimum temperatures at the source and deposition zones for the growth of single crystals were and , respectively, and after four weeks many green SeCuO3 crystals were obtained. The phase purity was verified using x-ray powder diffraction.
Neutron powder diffraction patterns were collected on the Cold Neutron Powder Diffractometer (DMC) at SINQ, Paul Scherrer Institute, Switzerland. The 4.2 g SeCuO sample was sealed in a 8 mm diameter cylindrical vanadium can under helium and cooled down in the Orange ILL type cryostat. Neutron wavelength of was used and about was needed for one temperature point within the 1.5 K-15 K range.
Single crystal neutron diffraction was performed on thermal single crystal neutron diffractometer (TriCS) at SINQ, PSI, Switzerland. A large single crystal () was mounted on an Al ”T”-shaped sample holder using Al wire and placed inside an ILL Orange type cryostat. Diffraction was measured in the temperature range from to using a wavelength of in the normal beam geometry. Both the powder and single crystal data were analyzed and refined using the FullProf suiteRodriguez-Carvajal (1993).
To get a better insight into the local spin behavior, nuclear magnetic resonance (NMR) and quadrupolar resonance (NQR) techniques were used. These techniques locally probe interactions with an observed nuclei, being sensitive to external magnetic field and to electric field gradient (EFG) on the nuclei. Since the magnetically active electrons reside on the Cu sites, 63,65Cu NMR/NQR was chosen for this experiment, as it provides direct insight into the local spin behavior.
The NMR/NQR experiment was conducted in a superconducting Oxford Instruments variable-field magnet. The sample was a single-crystal (), with the longest axis along the -axis. A copper coil was tightly wound around the longest axis of the sample, which was mounted on a single axis rotator with the axis of rotation within from the -axis. Spectra were acquired with a Tecmag Apollo spectrometer by the standard Hahn echo sequence , followed by Fourier transform of the echo signal. The duration of the pulse was 1.4 s, and the time between the pulses was varied from s at low temperatures to s at K and above. Multiple spectra were added together to obtain a broadband spectra by the usual variable offset cumulative spectroscopy method.
III Experimental results
III.1 Neutron powder diffraction
Fig. 2(a) shows the powder neutron diffraction pattern of SeCuO measured at . Refinement was performed against the model presented in Ref. Živković et al., 2012. The agreement between the published and refined unit cell parameters, a=, b=, c= and =, is very good.
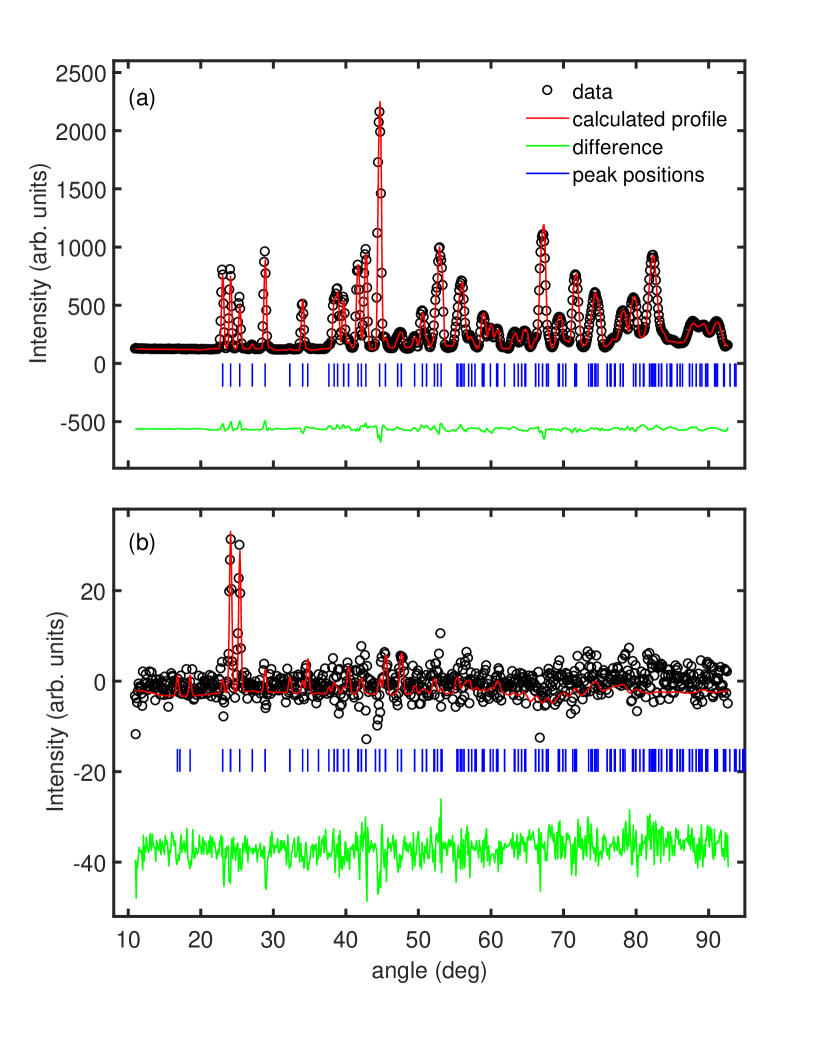
The difference between the patterns collected at and is shown in Fig. 2(b). The difference pattern contains only two magnetic reflections, since the structural changes between the two temperatures are negligible. The magnetic peaks are found on top of nuclear ones making separation of the purely magnetic signal challenging.
Using the K-SEARCH program from the FullProf suite we determined the magnetic propagation vector . This reveals commensurate antiferromagnetic ordering. To constrain the possible magnetic structures, we have performed irreducible representation analysis using the program BASIREPS from the FullProf suite. The symmetry analysis for the propagation vector and space group P21/ yielded only four nonzero one-dimensional irreducible representations (IRs), each with the multiplicity of 3. The magnetic representation is thus composed of:
| (2) |
where superscript 1 is omitted for clarity. The basis vectors for these IRs are listed in Table 1.
| IRs | Site: | Cu1 | Cu2 | Cu3 | Cu4 |
|---|---|---|---|---|---|
Two solutions: 1) for the Cu1 site and for the Cu2 site and 2) IR for both sites, gave equally good agreement with the data. As the transition from the paramagnetic state to the magnetically ordered state is of the second order, we conclude that both copper sites must order with the same IR.
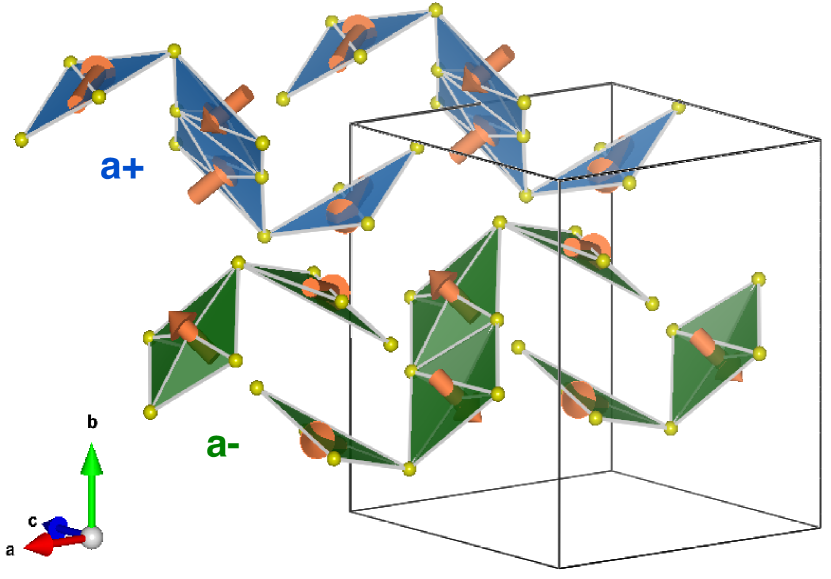
The best agreement for both, powder and single crystal diffractions, is found for the moment configuration presented in Fig. 3. As shown in Ref. Živković et al., 2012, the active orbitals for the magnetic exchange in SeCuO3 are . Accordingly, the structure can be represented as a network of weakly coupled tetramers. Each tetramer has a shape of a ’sea-horse’, forming a one-dimensional chain of tetramers along the -axis with a ’head-over-tail’ coupling between the neighbours (weak inter-tetramer interaction between two Cu2 moments mediated by an almost perpendicular Cu – O – Cu bridge). There are two chains, one running along the ’’ direction and one along the ’’ direction, in Fig. 3 these chains are shown by blue and green, respectively. Tetramers from different chains are symmetry related by the 180∘ rotation, followed by the translation. The coupling across the chains is mediated through the network of SeO3 tetrahedra (not shown).
Several features of the magnetic structure presented in Fig. 3 are worth emphasizing. We see that an anti-parallel arrangement of spins is formed on the equivalent copper sites, – and – . On the other hand, spins on the neighbouring Cu1 and Cu2 ions have an angle of , indicative of a significant Dzyaloshinskii-Moriya interaction due to the lack of the inversion center between the Cu1 and Cu2 ions. Additionally, due to the rotational symmetry between the ’’ and ’’ chains (see Fig. 3), the overall magnetic structure is highly non-collinear.
Among the most important results of our analysis is the magnitude of magnetic moments on the copper ions. They amount to and , indicating a strong renormalization from the nominal value. The fact that the inner copper sites (Cu1) have smaller ordered moments than the outer ones (Cu2) supports the initial model based from the susceptibility analysis Živković et al. (2012); Herak et al. (2014), where the coupling is notably stronger than . This induces stronger quantum fluctuations from the singlet state.
III.2 Nuclear quadrupolar resonance – paramagnetic phase
The NMR and NQR methods probe nuclear spins and their coupling to the local magnetic field and EFG, respectively. EFG is a tensor defined as , usually expressed with principal axes following the standard convention . Within SeCuO3, copper nuclei have nonvanishing EFG that give rise to an NQR signal. The local symmetry of the copper sites implies that is oriented perpendicular to the plane defined by the 4 oxygens in each CuO4 plaquette.
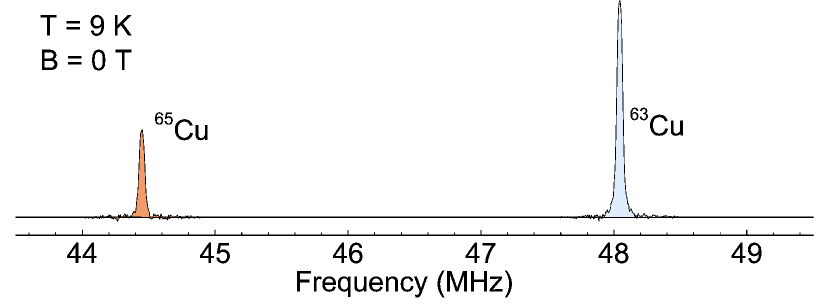
Above the NQR spectra show two distinct lines that correspond to two copper isotopes, 65Cu and 63Cu, shown in Fig. 4. The lines can be fit to a Gaussian function, with FWHM of 40 kHz. The line width is constant in the temperature range from to K, indicating no onset of short range order.
With two inequivalent crystallographic sites (Cu1 and Cu2), one would expect different EFG values for each of them, so that four NQR lines should be visible, two for each isotope. A second pair of lines was searched for in a broad frequency range, from 16 to 60 MHz. Lack of the second pair of lines, even with short interpulse time (s), implies that one copper site has too fast relaxation rate to be detected by NQR.
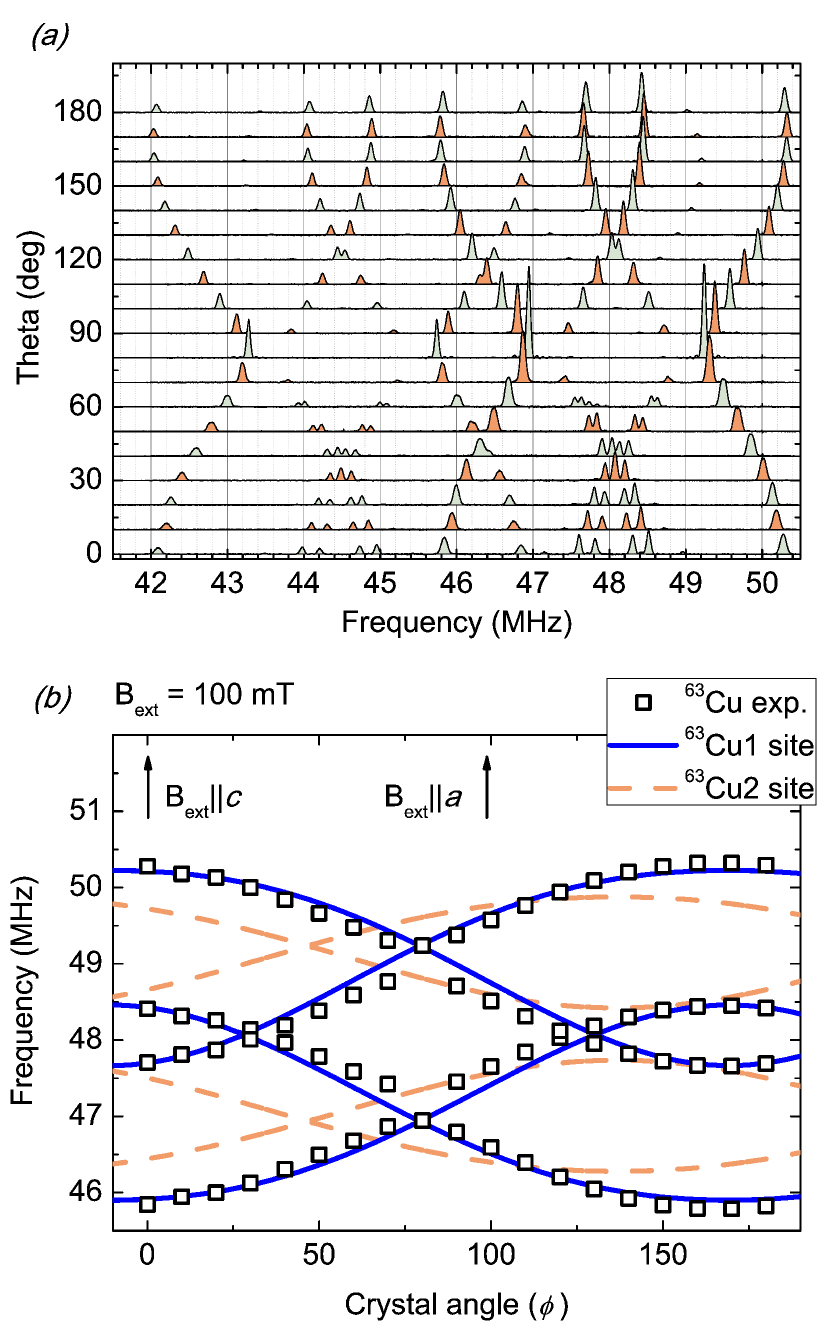
To determine which Cu site is observed by NQR, we measured an angle dependence of Zeeman perturbed NQR of SeCuO3 (Fig. 5 (a)). By applying an external field the single NQR line splits into four lines, whose positions depend on the angle of the external magnetic field with respect to the principal axis . The sample rotation was performed around the -axis, while the magnetic field was applied within the -plane.
The complete NMR/NQR Hamiltonian Slichter (1990) is:
| (3) |
where is the asymmetry parameter, is the angle between the local -axis and the local magnetic field , is the nuclear spin (for copper ), and and are the quadrupole moment and the gyromagnetic ratio of the nucleus, respectively. Numerical diagonalization of the Hamiltonian was used to explain the spectra. Four lines instead of two arise due to mixing of nuclear spin states that is beyond first-order perturbation theory.
Free parameters are the asymmetry and the angle . and are interdependent, and their relation can be deduced from NQR at T (Fig. 4). In that case, the line position is given as . Since two crystallographic sites (Cu1 and Cu2) will have different angles, consequentially they will have different line positions which allows us to determine which site is visible in the experiment.
The calculated line positions for mT and experimental results for rotation spectra around the crystal axis are shown in (Fig. 5(b)). Two distinct features are clearly visible. The crossing of inner lines at angles 30 and 120 implies to be equal to the magic angle mag . Analysing the crystallographic data and the direction of rotation we find that only the NQR signal of the Cu1 site can reproduce this crossing.Therefore, the observed signal comes from the Cu1 site. Other feature of the NQR spectrum is the existence of a single line at , which implies . Thus, all parameters of the Hamiltonian are determined.
III.3 Nuclear quadrupolar resonance – AFM phase
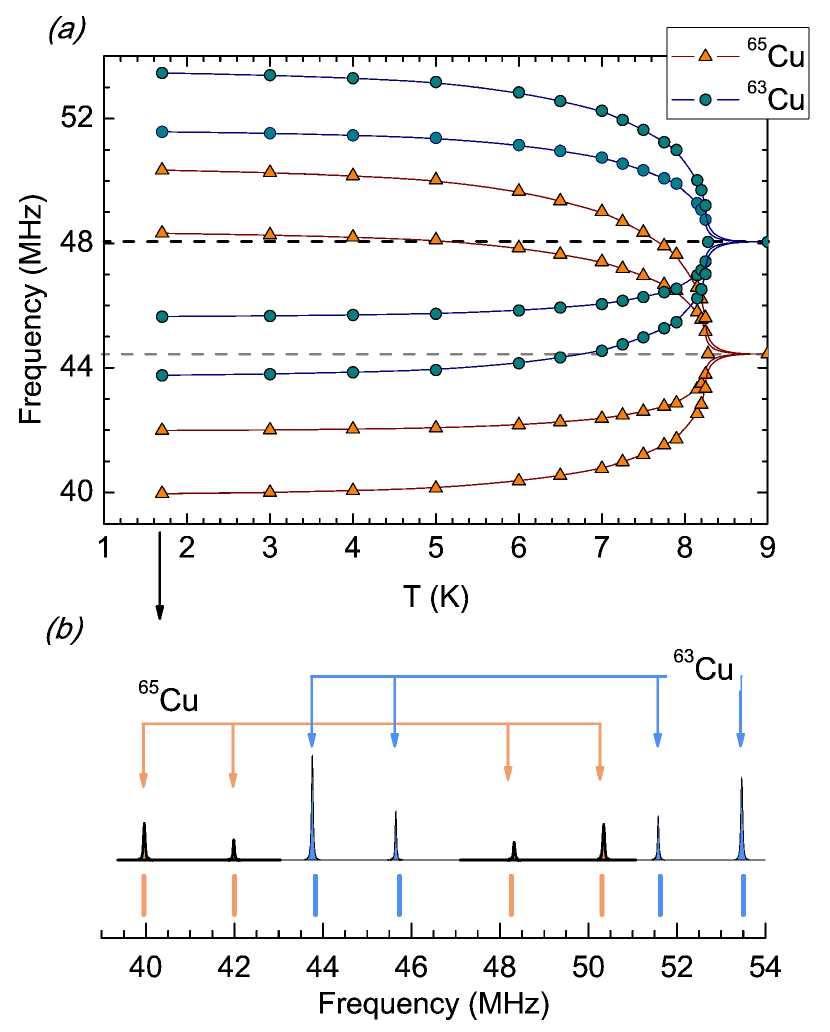
Below temperature , the system enters a magnetically ordered state and each NQR line splits into four lines without external field, indicating the existence of the local magnetic field (staggered antiferromagnetic field). In Fig. 6(a) we plot the line positions with respect to temperature. By lowering temperature the staggered field intensity increases thus shifting the lines further apart. This behavior is still governed by the same Hamiltonian (Equation 3), but the magnetic field and its angle are now governed by spin interactions. We can determine the line position for each temperature, with free parameters and . Latter parameter is expected to remain constant since it depends only on the crystal electric field , and neutron scattering shows negligible variation of the crystal parameters in this temperature region.
Fig. 6(b) presents the NQR fit for the lowest temperature, where the local magnetization is completely developed. Here we obtain T and . To fit the data at other temperatures it was sufficient to vary only the intensity of magnetic field , while the angle remained constant. Thus, we can determine that there is no rotation of the magnetic moments in the ordered state within the sensitivity of our measurements. This is consistent with the previous ESR results which found only a minor rotation (close to ) of the magnetic axes.Herak et al. (2014)
We can relate the magnetization vector on the Cu1 site with hyperfine field:
| (4) |
where is the hyperfine tensor. Since the hyperfine tensor is governed by the same crystal symmetries as the EFG tensor, it is justified to presume that their principal axes are the same. We take the hyperfine tensor T/, T/. This result is from Ref. Itoh et al., 1995 on compound CuGeO3, but similar hyperfine tensor can be found in CuO and other insulators that have a Cu2+ ion in an octahedral environment (e.g. in azurite Aimo et al. (2009)). Inverting equation 4 and using data obtained from the NQR experiments, we can deduce the value of the magnetic moment residing on the Cu1 site to be , which is slightly smaller than moment extracted from neutron measurements ( ). This is to be expected, since the time scale of neutron measurements is much shorter than the NQR time scale and a larger influence of quantum fluctuations can be expected.
Additionally, analysis suggests that the spin on the Cu1 site lies almost completely inside the CuO4 plaquette with . This differs from the value deduced from neutron measurements (Fig. 3), where the Cu1 moments are tilt approximately by from the plaquette. Since the magnetic neutron intensity is relatively weak, the uncertainty of the direction of moment(s) is relatively large. Thus, the determined orientation of the moment on Cu1 should be more accurate from the NQR measurements. It is worth mentioning that, if the Cu1 magnetic moment direction is fixed to lie inside the plaquette, the resulting fit is noticeably worse than for the configuration presented in Fig. 3. This small controversy might be resolved with a future polarized neutron scattering experiment.
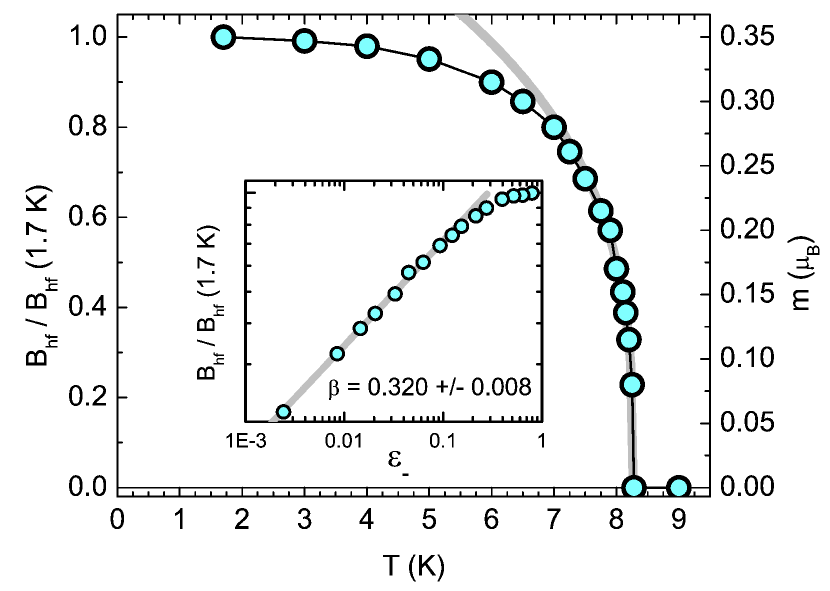
Since the staggered field is proportional to the order parameter of the AFM phase transition (Fig. 7), we can deduce a critical behavior below the transition () as follows:
| (5) |
The critical exponent was extracted from a fit in the range (inset, Fig. 7). The fitted value is shown in Table 2, together with predictions for several other universality classes. It is obvious that the extracted critical exponent is consistent with the 3D phase transition. A similar -value was found by Lee et al. in Ref. Lee et al., 2017.
| SeCuO3 | 2D-Ising | 3D-Ising | 3D-Heisenberg | Mean field | |
|---|---|---|---|---|---|
| 0.32 | 0.13 | 0.33 | 0.35 | 1/2 |
III.4 Cu1 spin-lattice relaxation
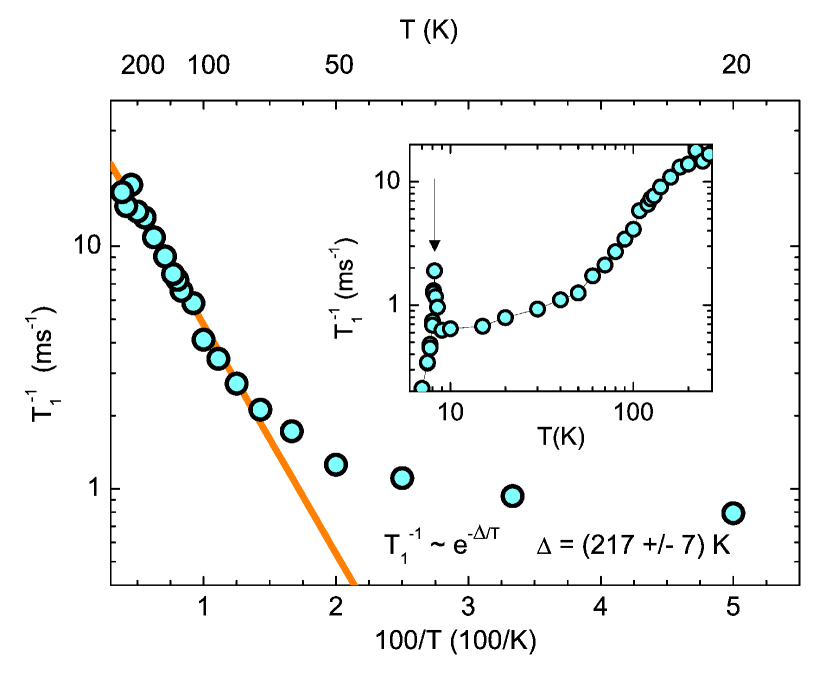
To get a better insight into the spin dynamics above ordering temperature, the spin-lattice relaxation rate () was recorded with saturation recovery method and is shown in Fig. 8. What can be clearly seen is the activated behavior. Relaxation increases by an order of magnitude from K to K above which the temperature dependence saturates and remains almost constant. This is expected in the paramagnetic state of antiferromagnetic insulators Moriya (1956), and shows that the truly paramagnetic state exists only at high temperatures. From the Arrhenius plot we can fit the activation energy of K, which is close to value determined from the susceptibilty.Živković et al. (2012) Large error bars in relaxation at high temperatures are caused by the loss of signal due to shortening of spin-spin relaxation time (). The activation behaviour indicates that an energy gap opens in the system. Since the ground state of an isolated tetramer system is singlet, the observed temperature dependence most likely originates from a singlet-triplet gap, which means that below 200 K singlets form at the Cu1 sites (dimer), as was proposed in an earlier work.Živković et al. (2012) At temperatures lower than 70 K, additional parts of the isolated-tetramer Hamiltonian start to contribute to the relaxation process, and the dependence deviates from activated.
IV Discussion
In earlier papers Živković et al. (2012); Herak et al. (2014) it was suggested that the unusual behavior of the spin susceptibility arises from the rotation of the macroscopic magnetic axes as the temperature is lowered. This was additionally supported by the EPR and torque measurements, which mapped the temperature dependence of the magnetic axis shift.Herak et al. (2014) The authors hypothesized that this behavior is related to the formation of a singlet state on the inner Cu1 – Cu1 pair, where the contribution from the Cu1 site’s local axes of anisotropy to the total magnetic anisotropy diminishes and the net magnetization axes rotate towards those defined by the Cu2 site.
The evidence accumulated from two microscopic techniques presented in this article strongly supports this hypothesis. Additional possibilities included a dynamic Jahn-Teller effect, or a structural transition but the smooth temperature dependence of the NQR line (not shown) excludes this possibility. At high temperatures the relaxation data measured at the Cu1 site show a clear exponential decay that indicates a singlet-triplet gap. On the other hand, below , when the system enters an ordered state driven by inter-tetramer interactions, both neutron diffraction and NQR indicate greatly reduced value of the ordered magnetic moment residing on the Cu1 site (% of fully polarized spin even at K). Even , although less strongly coupled to the central pair, shows its value significantly renormalized (). With this evidence we can establish SeCuO3 as a prime example for further studies of the influence of strong quantum fluctuations on the formation of long-range magnetic order.
The singlet formation at Cu1 sites is also consistent with magnetization measurements Lee et al. (2017) that show magnetization plateau at half the total magnetization, indicating only Cu2 spin site contribution to total magnetization. Similar dimerisation is reported in spin-tetramer compound CuInVO5 Hase et al. (2016) and in spin system Azurite (Cu3(CO3)2(OH)2) that has two copper sites, with innermost site experiencing only 10% of fully polarized spin.Aimo et al. (2009)
We would also like to address the fact that the observed exponential dependence of is visible down to approximately 60 K below which it starts to saturate. Around the same temperature a simple tetramer model of susceptibility breaks down Živković et al. (2012). This shows that some other energy scale starts contributing to , most probably the anisotropic DM interaction. The deviation from activated behavior so high in temperature cannot originate from critical fluctuations of AF order, since it onsets only below K, and the increase of is visible only 1 K above . The influence of DM interaction is in agreement with the additional EPR data Herak et al. (2014) where the rotation of the magnetic axis below K was ascribed to the DM interaction between Cu1 and Cu2. Lack of Cu2 signal in NQR can then be explained, as Cu2 coupling is weaker and acts as an almost free spin with strong magnetic fluctuations that cause short time. On the other hand, the spin singlet on Cu1 greatly increases the relaxation time thus making that site visible in magnetic resonance experiments.
In summary, we have determined the magnetic structure of the tetramer compound SeCuO3 by combining neutron diffraction with NQR measurements. We found a highly non-collinear spin configuration with the inner Cu1 spins being antiparallel to each other but forming an angle to the Cu2 spins, indicating an influence of the Dzyaloshinskii-Moriya interaction. Both neutron and NQR measurements detected unexpectedly low ordered moment on the Cu1 site. Combining the spin-lattice relaxation we propose a picture that qualitatively agrees with all the observations. Our results are consistent with strongly-coupled Cu1-Cu1 spins in a tetramer which below form a spin singlet state. Meanwhile, the Cu2 spins are only weakly coupled to the central pair.
V Acknowledgements
T.C. and M.S.G. are thankful to M. Horvatić for suggestions and discussion of NMR results. T.C., M.S.G. and M.P. acknowledge the Croatian Science Foundation (HRZZ) for funding the NMR/NQR studies under Grant No. IP-11-2013-2729. This work has been carried out within the framework of the EUROfusion Consortium and has received funding from the Euratom research and training programme 2014-2018 under grant agreement No 633053. The views and opinions expressed herein do not necessarily reflect those of the European Commission. Neutron diffraction experiments have been carried out at SINQ PSI, Villigen, Switzerland.
References
- Li et al. (2016) Y. Li, D. Adroja, P. K. Biswas, P. J. Baker, Q. Zhang, J. Liu, A. A. Tsirlin, P. Gegenwart, and Q. Zhang, Physical Review Letters 117, 097201 (2016).
- Han et al. (2012) T.-H. Han, J. S. Helton, S. Chu, D. G. Nocera, J. A. Rodriguez-Rivera, C. Broholm, and Y. S. Lee, Nature 492, 406 (2012).
- Sessoli et al. (1993) R. Sessoli, D. Gatteschi, A. Caneschi, and M. A. Novak, Nature 365, 141 (1993).
- Rüegg et al. (2004) C. Rüegg, A. Furrer, D. Sheptyakov, T. Strässle, K. W. Krämer, H.-U. Güdel, and L. Mélési, Physical Review Letters 93, 257201 (2004).
- Haraldsen et al. (2005) J. T. Haraldsen, T. Barnes, and J. L. Musfeldt, Phys. Rev. B 71, 064403 (2005).
- Prester et al. (2004) M. Prester, A. Smontara, I. Živković, A. Bilušić, D. Drobac, H. Berger, and F. Bussy, Phys. Rev. B 69, 180401(R) (2004).
- Kuo and Lue (2008) C. N. Kuo and C. S. Lue, Phys. Rev. B 78, 212407 (2008).
- Hase et al. (2005) M. Hase, M. Kohno, H. Kitazawa, O. Suzuki, K. Ozawa, G. Kido, M. Imai, and X. Hu, Phys. Rev. B 72, 172412 (2005).
- Živković et al. (2012) I. Živković, D. M. Djokić, M. Herak, D. Pajić, K. Prša, P. Pattison, D. Dominko, Z. Micković, D. Cinčić, L. Forró, H. Berger, and H. M. Rønnow, Physical Review B 86, 054405 (2012).
- Hase et al. (2016) M. Hase, M. Matsumoto, A. Matsuo, and K. Kindo, Phys. Rev. B 94, 174421 (2016).
- Effenberger (1986) H. Effenberger, Z. Kristallogr. , 61 (1986).
- Herak et al. (2014) M. Herak, A. Grubišić Čabo, D. Žilić, B. Rakvin, K. Salamon, O. Milat, and H. Berger, Physical Review B 89, 1 (2014).
- Lee et al. (2017) S. Lee, W.-J. Lee, J. van Tol, P. L. Kuhns, A. P. Reyes, H. Berger, and K.-Y. Choi, Physical Review B , 054405 (2017).
- Rodriguez-Carvajal (1993) J. Rodriguez-Carvajal, Physica B: Condensed Matter 192, 55 (1993).
- Momma and Izumi (2011) K. Momma and F. Izumi, Journal of Applied Crystallography 44, 1272 (2011).
- Slichter (1990) C. P. Slichter, Principles of magnetic resonance, 3rd ed. (Springer-Verlag Berlin ; New York, 1990) Chap. 10.
- (17) Magic angle is a root of second order Legendre polynomial P, . At this angle first order quadrupolar interaction vanishes, i.e. two inner NQR lines merge.
- Itoh et al. (1995) M. Itoh, S. Hirashima, and K. Motoya, Physical Review B 52, 3410 (1995).
- Aimo et al. (2009) F. Aimo, S. Krämer, M. Klanjšek, M. Horvatić, C. Berthier, and H. Kikuchi, Phys. Rev. Lett. 102, 127205 (2009).
- Moriya (1956) T. Moriya, Prog. Theor. Phys. 16, 23 (1956).