History of Globulettes in the Milky Way
Abstract
Globulettes are small (radii kAU) dark dust clouds, seen against the background of bright nebulae. A majority of the objects have planetary mass. These objects may be a source of brown dwarfs and free floating planetary mass objects in the galaxy. In this paper we investigate how many globulettes could have formed in the Milky Way and how they could contribute to the total population of free floating planets. In order to do that we examine H-alpha images of 27 H II regions. In these images, we find 778 globulettes.
We find that a conservative value of the number of globulettes formed is . If 10 % of the globulettes form free floating planets then they have contributed with free floating planets in the Milky Way. A less conservative number of globulettes would mean that the globulettes could contribute free floating planets. Thus the globulettes could represent a non-negligible source of free floating planets in the Milky Way.
Keywords Free Floating Planets; Globulettes; H II Regions; ISM; Milky Way
1 Introduction
H II regions, surrounding young stellar clusters are driven by massive O and early B stars. These regions are associated with dusty gas formations, such as pillars, ’elephant-trunks’ and isolated dark clouds seen in different sizes and shapes, from large irregular blocks and fragments to smaller more roundish objects. These small-sized globules within H II regions were first observed by Bok & Reilly [1947], followed by Thackeray [1950] and Herbig [1974]. They are dense, cold and neutral clouds with dark appearance in optical images. The pillars of gas and dust are pointing towards the ionizing sources and are usually connected to the molecular shell.
In such H II regions, a new distinct class of objects, globulettes, was noted by Gahm et al. [2007] and Grenman [2006]. The globulettes are seen as silhouettes against the background of bright nebulae in optical images. Typically, they are roundish objects that are much smaller ( kAU) than normal globules with a mass of [Gahm et al., 2007]. The globulettes can also have tails, bright rims and halos. Many globulettes are quite isolated, located far from the molecular shells and dust pillars associated with the regions. However, some of the objects are connected by thin filaments to large molecular blocks or even each other. This suggests that they can either form separately, or via fragmentation of large structures. The calculated lifetime of globulettes suggests that they may survive in this harsh environment for a long time, yrs [Gahm et al., 2007, Haworth et al., 2015].
In the Carina Nebula (NGC 3372), a giant H II region, the globulettes are smaller, more dense and less massive [Grenman & Gahm, 2014] than those recognized in Gahm et al. [2007] and De Marco et al. [2006]. This group of globulettes may represent a more advanced evolutionary state in globulette evolution. Schneider et al. [2016] suggested that the pillars may evolve first into a globule and then into a globulette when the lower density gas has photevaporated and left behind a dense and cold core. However, it is also speculated that globulettes might collapse in situ to form free floating planets (FFPs with , where Jupiter mass) or brown dwarfs (13-75 ), triggered by external forces from gas and turbulent pressure in the surrounding warm plasma and radiation pressure from stellar photons. In fact, the result by Gahm et al. [2013] from near-infrared imaging of the Rosette Nebula, revealed very dense cores in some of the largest globulettes that might collapse to form FFPs. They also pointed out that these objects accelerate outwards from the nebula and eventually ends up in the interstellar environment.
A more recent example, where globulettes may have formed planetary mass objects was found in the Orion Nebula [M42/43, Fang et al., 2016]. This nebula stands out by having both dark silhouette disks and bright compact knots. They are known as proplyds [O’Dell et al., 1993, O’Dell & Wong, 1996, Bally et al., 2000].
| H II region | Instrument | ID |
|---|---|---|
| Gum 29 | ACS/WFC | 13038 |
| Gum 31 | WFPC2, ACS/WFC | 10475, 9857 |
| Gum 38b | WFC3/UVIS | 11360 |
| IC 434 | WFPC2, ACS/WFC | 8874, 9741, 12812 |
| IC 2177 | ALFOSC | N/A, see Gahm et al. [2007] |
| IC 2944 | WFPC2 | 7381 |
| M 8 | WFPC2, ACS/WFC | 6227, 11981, 9857 |
| M 16 | WFPC2, ACS/WFC | 10393,13926, 9091, 5773 |
| M 17 | WFPC2, ACS/WFC | 6574, 8992 |
| M 20 | WFPC2 | 9104, 11121 |
| M 42/43 | WFPC2, ACS/WFC | 5469, 9825,10246 |
| NGC 281 | WFPC2, ACS/WFC | 8713, 10713, 9857 |
| NGC 1977 | ACS/WFC | 12250 |
| NGC 2174 | WFPC2, ACS/WFC | 9091,13623, 9091 |
| NGC 2467 | WFPC2, ACS/WFC | 9857 |
| NGC 3372 | WFPC2, ACS/WFC | 6042, 11501, 13390, 13391, 13791, 10241, 10475 |
| NGC 6357 | WFPC2, ACS/WFC | 9091, 9857 |
| NGC 6820 | ALFOSC | N/A, see Gahm et al. [2007] |
| NGC 7635 | WFPC2, ACS/WFC, WFC3/UVIS | 7515,14471 |
| NGC 7822 | ALFOSC | N/A, see Gahm et al. [2007] |
| S106 | WFPC2, WFC3/UVIS | 5963, 12326 |
| S155 | WFPC2 | 5983 |
| S190 | ALFOSC | N/A, see Gahm et al. [2007] |
| S199 | ALFOSC | N/A, see Gahm et al. [2007] |
| S273 | WFPC2, ACS/WFC, ALFOSC | 8992, 5983 |
| S277 | WFPC2, ACS/WFC | 5983, 8992, 9424 |
| Rosette Nebula | ALFOSC | N/A, see Gahm et al. [2007] |
| 30 Doradus | ACS/WFC, WFC3/UVIS | 11360, 12939 |
The first reports of populations of substellar objects in interstellar space came in 1995 [Rebolo et al., 1995, Nakajima et al., 1995]. Since then, a number of Jupiter-mass FFPs and FFP candidates have been found in young clusters and star formation regions [see Lucas & Roche, 2000, Bihain et al., 2009, Luhman, 2012, Liu et al., 2013, Peña Ramírez et al., 2016, 2012, Clanton & Gaudi, 2017, and references therein]. Planetary mass objects have also been found in the galactic field [Cushing et al., 2014]. Since these substellar objects are both brighter and warmer at young ages [less than 10 Myr, Chabrier et al., 2000], these objects with masses of a few Jupiter masses can be seen e.g. in deep optical and near-infrared photometric surveys [Zapatero Osorio et al., 2000, 2017, Quanz et al., 2010].
Another method to find objects below the deuterium-burning-mass-limit (Jupiter-sized) that are not bound to a host star is through gravitational microlensing. This type of study has been done by the Microlensing Observation in Astrophysics group [MOA-2; Sumi et al., 2003, 2011, Freeman et al., 2015] and the Optical Gravitational Lensing Experiment [OGLE-III; Wyrzykowski et al., 2015].
The origin of these unbound objects is unclear. They may have formed in situ from a direct collapse of a molecular cloud by fragmentation, similar to star formation [e.g. Silk, 1977, Bowler et al., 2011]. In fact, Fang et al. [2016], Luhman et al. [2005], Boucher et al. [2016], Joergens et al. [2015], Bayo et al. [2017] have found four FFPs with accretion disk. Furthermore, planetary-mass binaries, which would be almost impossible to from through planetary formation mechanisms, have also be found by e.g. Jayawardhana & Ivanov [2006], Best et al. [2017].
FFPs may also have been formed from stellar embryos that are fragmented and photoevaporated from nearby stars [see e.g. Kroupa & Bouvier, 2003, Padoan & Nordlund, 2004, Whitworth & Zinnecker, 2004]. They may also have been ejected after they were formed in circumstellar protoplanteray disks through gravitational instabilities [e.g. Boss, 2009, Stamatellos & Whitworth, 2009, Li et al., 2015]. Such instabilities can be caused by a triplet star system [Reipurth & Mikkola, 2015] or by passage through the center of a dense star cluster [Wang et al., 2015].
In this work, we present results based on available images of H II-regions from the Hubble Space Telescope (HST) archive and taken with the Nordic Optic Telescope (NOT). We create a model of how many globulettes may have formed in the Milky Way over time and how many of these that contribute to the total FFPs population. We have organized the paper as follows. In Sect. 2, we present the result of both old and new H II regions investigated in the context of globulettes. We also present mean radii of histograms of globulettes for those H II regions, which contain many globulettes. In Sect. 3, the parameters that are used in our model are presented. The results and discussion regarding FFPs can be found in Sect. 4 and we conclude the paper in Sect. 5.
| H II region | RA | Dec | Main Cluster | Distance | Ref. | Nebula | Obs. | Number | Detection |
| (J2000.0) | (J2000.0) | (kpc) | Area | Area | of | limit****The minimum detection size (diameter in AU) of an object, defined as 3 pixels in this article. | |||
| arcmin2 | arcmin2 | globulettes | (AU) | ||||||
| Gum 29 | 10 24 | -57 46 | Westerlund 2 | 4.2 | 1 | 707 | 11 | 10 | 630 |
| Gum 31 | 10 37 | -58 39 | NGC 3324 | 2.3 | 2 | 177 | 43 | 7 | 345 |
| Gum 38b | 11 15 | -61 15 | NGC 3603 | 6.0 | 3 | 94 | 7 | 5 | 720 |
| IC 434 | 05 41 | -02 30 | Sigma Orionis | 0.4 | 4 | 471 | 86 | - | 60 |
| IC 2177**H II regions from Gahm et al. [2007] | 07 04 | -10 27 | N/A | 1.3 | 5 | 314 | 33 | - | 733 |
| IC 2944 | 11 38 | -63 22 | Collinder 249 | 2.3 | 6 | 1 866 | 5 | 34 | 690 |
| M 8 | 18 03 | -24 23 | NCC 6530, 6523 | 1.3 | 7 | 1 374 | 43 | 18 | 195 |
| M 16 | 18 18 | -13 48 | NGC 6611 | 1.8 | 7 | 825 | 53 | 46 | 270 |
| M 17 | 18 20 | -16 10 | NGC 6618 | 2.0 | 7 | 806 | 16 | 23 | 300 |
| M 20 | 18 02 | -22 58 | NGC 6514 | 2.7 | 7 | 361 | 21 | - | 810 |
| M 42/43 | 05 35 | -05 23 | NGC 1976, 1982 | 0.41 | 7 | 1 689 | 639 | 9 | 61 |
| NGC 281 | 00 52 | +56 34 | IC 1590 | 2.8 | 8 | 589 | 32 | 18 | 420 |
| NGC 1977 | 05 35 | -04 49 | NGC 1973, 75 | 0.41 | 9 | 314 | 44 | - | 61 |
| NGC 2174 | 06 09 | +20 30 | NGC 2175, 75s | 2.2 | 12 | 589 | 35 | 15 | 330 |
| NGC 2467 | 07 52 | -26 25 | Haffner18ab,19 | 5.0 | 10 | 467 | 16 | 59 | 750 |
| NGC 3372 | 10 44 | -59 53 | Tr14/15/16, | 2.9 | 11 | 10 179 | 953 | 343 | 435 |
| Bo10/11,Cr232, | |||||||||
| Cr234/228 | |||||||||
| NGC 6357 | 17 26 | -34 12 | Pis 24, ESO 392-11 | 1.7 | 7 | 911 | 17 | 11 | 255 |
| ESO 393-13 | |||||||||
| NGC 6820**H II regions from Gahm et al. [2007] | 19 42 | +23 05 | NGC 6823 | 1.9 | 13 | 707 | 53 | 1 | 1072 |
| NGC 7635 | 23 20 | +61 12 | [BDS2003]44 | 2.4 | 14 | 94 | 37 | 4 | 288 |
| NGC 7822**H II regions from Gahm et al. [2007] | 00 01 | +67 25 | Berkeley 59 | 0.91 | 12 | 1 884 | 72 | 9 | 513 |
| S106 | 20 27 | +37 22 | S106 IR | 1.7 | 15 | 3 | 13 | - | 204 |
| S155 | 22 58 | +62 31 | CepIII | 0.84 | 12 | 1 178 | 10 | - | 252 |
| S190**H II regions from Gahm et al. [2007] | 02 32 | +61 27 | IC 1805 | 2.0 | 12 | 5 281 | 189 | 18 | 1128 |
| S199**H II regions from Gahm et al. [2007] | 02 51 | +60 24 | IC 1848, Cl34 | 1.8 | 12 | 5 089 | 66 | - | 1015 |
| S273**H II regions from Gahm et al. [2007] | 06 41 | +09 53 | NGC 2264 | 0.91 | 7 | 2 672 | 126 | - | 136 |
| S277 | 05 42 | -01 55 | NGC 2024 | 0.41 | 7 | 491 | 107 | 3 | 61 |
| Rosette Nebula**H II regions from Gahm et al. [2007] | 06 31 | +04 57 | NGC 2244 | 1.4 | 16 | 5 281 | 570 | 145 | 790 |
| LMC: | |||||||||
| 30 Doradus | 06 31 | +04 57 | NGC 2070 | 50 | 17 | 176 | 132 | 176 | 2 000 |
2 Archival Data and Measurements
In this work, we used archival H-alpha images of 16 H II regions included in earlier studies by De Marco et al. [2006], Gahm et al. [2007] and Grenman & Gahm [2014]. The observations in these studies are from the HST archive and the NOT. Most images were taken with the HST instruments such as ACS/WFC, WFPC2, WFPC3/UVIS, while the NOT images were taken with the ALFOSC instrument. A brief description of these instruments is given below.
-
1.
The Wide Field and Planetary Camera 2 (WFPC2) field of view is covered by four cameras, each of which span pixels in size. Three of them are arranged in an L-shaped field and operated at a pixel scale of . The fourth one is referred to as the Planetary Camera (PC) and operates at a pixel scale of .
-
2.
The Wide Field Camera 3 (WFC3) replaced the WPFC2 camera in 2009. The Ultraviolet-Visible channel (UVIS) use a mosaics of two CCDs, with 0.04 arcsec/pixel, covering a field of view. The 2 CCDs are butted together but have a gap between the two chips.
-
3.
The Advanced Camera for Surveys (ACS/WFC) camera contains two CCDs of pixels glued together with a small gap of approximately 50 pixels in between. The pixel size corresponds to per pixel and the field of view is .
-
4.
The Andalucia Faint Object Spectrograph and Camera (ALFOSC) has a field of view of 6.5’, and the effective scale of the CCD detector is 0.188” per pixel.
The respective areas for the instruments WFPC2, WFC3, ACS and ALFOSC are estimated to 5, 7, 11 and 33 arcmin2. More information about each of these instruments can be found in the manuals on the HST Web site111http://www.stsci.edu/hst/HST_overview/instruments and in the NOT manual222http://www.not.iac.es/instruments/alfosc. All images in the current study are analyzed using the F656N and F658N filters, which allow for mapping circumstellar matter and detecting the dark silhouette objects, even though the F658N filter includes more nebular emission from [N II]. The HST and NOT observations from these regions are presented in Table 1.
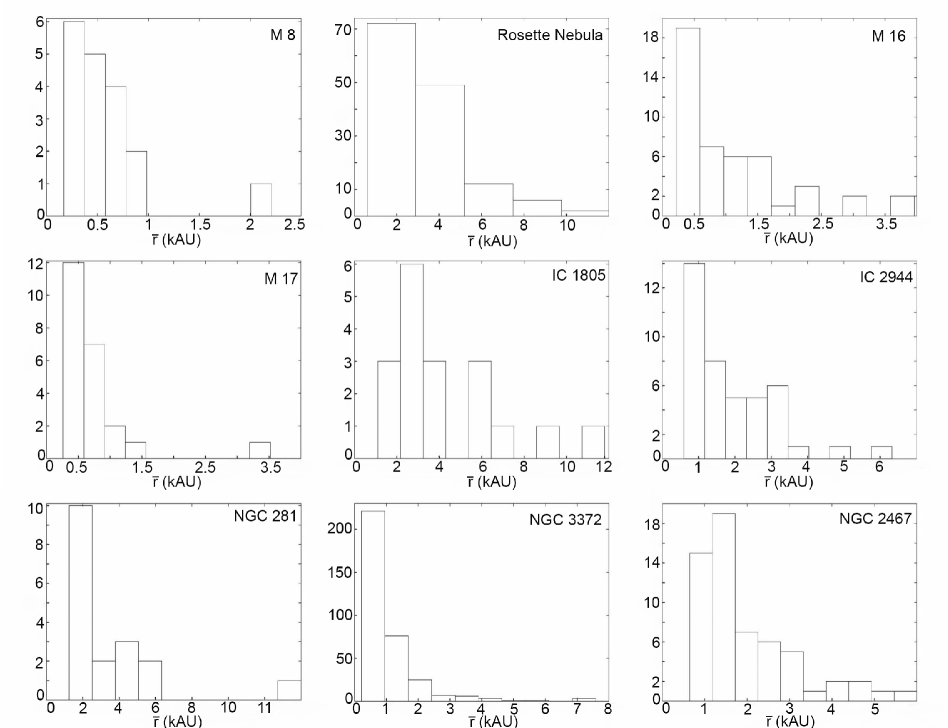
We characterize the angular size of the globulettes by using the SAOImage DS9 program, where we fit an ellipse to each object. Then we estimate the radius , the mean of the semi-major and semi-minor axes, expressed in kAU. In order to get a representative size distribution, a certain number of globulettes are needed. We have set the cutoff at 17 globulettes per region, and made histograms. Figure 1 shows the distributions of average radii in kAU for these H II regions. The average radii distribution of the all globulettes seems to fall off approximately exponentially.
Using catalogues, such as Sharpless [1959, hereafter Sharpless = S] and Gum [1955], we have investigated 319 optically visible nebulae and found 28 H II regions that have been imaged using an H-alpha filter. These regions are listed in Table 2, Column 1, in alphabetical order with the coordinates (Columns 2 and 3) from the Simbad database333The SIMBAD database, operated at CDS, Strasbourg, France . The main cluster designation is given in Column 4, and the distances from the Sun is given in Column 5, and the references in Column 6. The calculation of the H II nebula areas in Column 7 is described in Sect. 3.2 and the calculation of the observed areas in Column 8 is described in Sect. 3.3. The next to last Column in Table 2, lists the number of globulettes found in the observed area. In the last Column the minimum detection size of an object (in AU) is given. Objects with dimensions 3 pixels across are too small to be of interest [De Marco et al., 2006]. For the NOT observations, there are no objects with a diameter of less than 9 pixels, which means that they are also clearly resolved. The Carina Nebula, Rosette Nebula and 30 Doradus contain the most globulettes. 30 Doradus is an example of a low metallicity region in the Large Magellinic Cloud (LMC) and we do not consider it in our calculation of globulettes within the Milky Way.
Some of the nebulae are giant H II regions, like Carina Nebula and 30 Doradus. In these regions, the Lyman continuum flux is photons per second [Moisés et al., 2011]. There is also a young ultracompact H II region, S106 [Crowther & Conti, 2003] in our list, where the ionized star is a pre-main sequence star embedded in its molecular cloud [Noel et al., 2005]. Most of the regions are relatively nearby ( kpc) and they are relatively young ( 5 Myr). The distances are based on the references cited below in Table 2.
3 Model Parameters
In this section we define the different parameters needed to model the number of globulettes as shown in Table 3. To illustrate the methodology of this work we chose the Rosette Nebula as a representative example, because it contains only one main cluster, is symmetric and hold a large amount globulettes. An overview of the Rosette Complex can be found in Román-Zúñiga & Lada [2008].
3.1 Young Universe and H II Formation Rate
From model calculations we know that within the first relic H II regions, the massive metal free Population III (Pop III) stars evacuated the primordial gas from their minihalos [Kitayama et al., 2004, Alvarez et al., 2006, Abel et al., 2007]. As the Pop III stars ended in supernova explosions, the Universe’s intergalactic medium got progressively enriched with heavy metals [i.g. Greif et al., 2007, Wise & Abel, 2008] and dust.
Cosmological simulations suggest that once the gas reaches the minimum or ‘critical’ metallicity in the range - which allows for more efficient cooling. An example of a low metallicity Pop II environment is the Large Magellanic Cloud (LMC), where the metallicity is 0.5 [Rolleston et al., 2002].
In Som et al. [2015, Figure 11] these different metallicity values correspond to Gyr, which we set as our starting point for the calculations of the number of globulettes in the Milky Way.
In the early Universe, the formation rate of the H II regions was higher than it is now. We assume that it is proportional to the Star Formation Rate (SFR), which combined with the present day gives us the formation rate of H II regions in the early Universe. Marasco et al. [2015, Figure 1], show an overview of the SFR evolution as a function of time, where the current SFR is about /yr. We estimate the total area under the curve, which gives us the average SFR between now and 10 Gyrs ago, which is twice as big as the H II production is today. We call this correction factor , see Table 3.
3.2 Shapes and Areas of H II Regions
H II regions vary in their morphology and the nebulae examined here are either roughly circular, elliptical or irregular. The angular sizes for each H II region were measured from large scale DDS images (POSS II/UKSTU) taken through the red filter, with a plate scale of ” per pixel, available in Aladin, an interactive software Sky Atlas444http://aladin.u-strasbg.fr/aladin.gml . Thereafter, the area, in arcmin2, for each H II region was estimated, see Table 2 (Column 7), where the radii were defined as the geometric mean, , where and are half the apparent major and minor axes. Here, the shape of the Rosette Nebula is assumed to be circular with an area of 5 281 arcmin2. The total area of the 27 H II regions was estimated to = 44 413 arcmin2.
3.3 Observed Areas of the H II Regions
The DDS images of the 28 H II regions from the HST archive AstroView were overlaid with the HST apertures while the survey done with the NOT is described in Gahm et al. [2007]. The observed area (Column 8 in Table 2) was calculated in arcmin2 for each nebula. For the Rosette Nebula the area was estimated to be 570 arcmin2 and the total observation area of the 27 regions, is about 3 297 arcmin2.
3.4 Objects behind the H II regions
We can only detect globulettes in front of the H II regions, while objects on the remote side are covered by nebular emission or hidden behind the foreground obscuring shell. Therefore, we assume that the backside of the nebula contains as many globulettes as we observe in front of the nebula. This gives a correction factor of .
3.5 Age Estimate of the H II Regions and Globulettes
An H II region lasts only as long as the main sequence lifetimes of its ionizing star(s), i.e. 2-4 million years, before the radiation pressure from the hot young stars eventually drives most of the gas away and the nebula disperses. However, H II regions can live longer either in large star forming regions, involving multiple clusters, progressive star formation (e.g. the Carina Nebula, Smith et al. 2010) or when there is a spread in stellar ages, with co-existing younger ( 1 Myr) and older (10 Myr) stars. Two examples are Gum 38b [Beccari et al., 2010] and M 16, which have cluster mean ages of about 2 Myrs but where one of the massive members is about 6 Myrs old [Hillenbrand et al., 1993]. Thus by taking these conditions into account, the mean life time, , for H II regions is assumed to be 5 Myrs.
The lifetimes of globulettes can be estimated to 4 Myrs, see Sect.1.
3.6 Spatial Resolution and Distance Correction
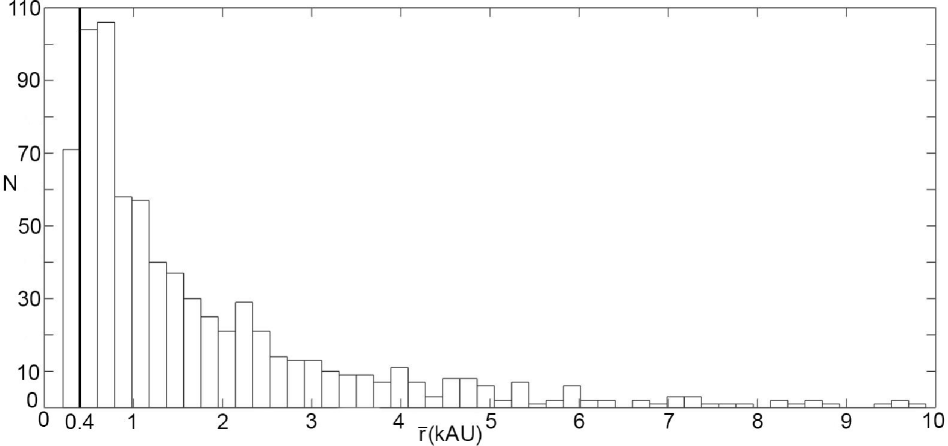
The spatial resolution of the ground based instrument NOT is lower than that of the HST. The practical globulette observation limit for the NOT telescope is about 0.8”, whereas the observation limit for the HST is about 0.15”. Thus we need to compensate for the objects that are below the resolution treshold for the NOT telescope. A histogram of the distributions of radii observed with the different instruments is shown in Figure 2. The most significant NOT region is the Rosette nebula, which has an observation limit of kAU. The are about as many objects above this limit in the figure as there are objects below. Therefore, the correction factor for the Rosette nebula is . For the other NOT regions, the correction factor would be only slightly different. An approximate value for the total number of globulettes within the NOT regions is =. Furthermore, some H II regions lie closer to us than others which means that we need to compensate for the missing objects at large distances. From Figure 2, we see that the detection limit radii is AU for the more nearby regions. The only regions that are further away are NGC 2467 and Gum 38b. If we assume that doubling the distance, doubles the detection limit, the limit would be at 400 AU. In Figure 2, we see that this correction between 200 to 400 AU would correspond to 12% if we assume that the distribution is similar. This factor also only applies to the two regions further away. Thus, this correction factor is negligible for the current data set.
| Parameters/ | Numerical | Description | Section |
|---|---|---|---|
| Symbols | Values | ||
| 27 | Number of analyzed Galactic H II regions | Table 2 | |
| 12 | Starting point in time for the model (Gyrs) | 3.1 | |
| 2 | Correction for more H II regions in the early Milky Way | 3.1 | |
| 44 413 | Total area of 27 H II regions (arcmin2) | 3.2 | |
| 3 297 | Total observed area of 27 H II regions (arcmin2) | 3.3 | |
| 2 | Correction factor for globuletter on the backside of the nebula | 3.4 | |
| 5 | Lifetime of H II regions (Myrs) | 3.5 | |
| 4 | Lifetime of a globulette (Myrs) | 3.5 | |
| 2 | Correction factor between HST and NOT instruments | 3.6 | |
| 346 | Corrected number of globulettes observed with NOT | 3.6 | |
| 605 | Total number of HST globulettes | Table 2 | |
| 10 000 | Number of H II regions (present time) | 3.7 | |
| 951 | Total corrected number of globulettes | 4 |
3.7 Number of H II Regions in the Milky Way
H II regions evolve with time; from hypercompact [linear size pc; e.g. Kurtz & Franco, 2002] to ultracompact [ pc; e.g. Kim & Koo, 2003] to compact [0.1-1 pc Wood & Churchwell, 1989] and then finally to extended H II regions [ pc; Mellema et al., 2006]. The evolutionary stage of a region is inferred from observations in several spectral windows. The most complete catalog today is compiled by Anderson et al. [2014, 2015], where about 8 000 H II regions and H II region candidates in the Milky Way are registered. A round figure on the total number of H II regions can be 10 000 (L. D. Andersson, personal communication, 2016).
4 Results and Discussion
In this section, we establish a model equation for the number of globulettes that have been formed in the history of the Milky Way. We also discuss how many FFPs may form from globulettes by taking account different parameters. In addition, we also discuss briefly the role played by giant H II regions, like the Carina nebula and 30 Doradus, for producing globulettes in the early Milky Way.
In our scenario, the first globulettes were formed roughly 12 Gyr ago, when there was enough metallicity to create dust, (cf. Sect. 3.1). We estimate that H II regions were 2 times more abundant in the early Milky Way than they are now (cf. Sect. 3.1) and that the number of H II regions, , today is about 10 000 (cf. Sect. 3.7). Globulette production can take place when the H II region is still young, 5 Myrs (cf. Sect. 3.5) and we assume that we can find a similar amount of objects also on the backside of the nebulae (cf. Sect. 3.4). The lifetime of globulettes was estimated to 4 Myrs. The spatial resolution was lower in seven of the H II regions and according Sect. 3.6, the actual number of globulettes, present in these regions, was estimated to 346 objects.
We list 27 H II regions, where the total area was estimated to 44 413 arcmin2 and an observed area of 3 297 arcmin2. The total number of gloublettes was calculated as and the average number of globulettes per H II region was estimated to be about 35. According to our model, the number of globulettes that have formed in the history of the Milky Way (MW) is
| (1) |
Using the numerical values from Table 3 we get a total number of globulettes formed in the Milky Way over time, which can be considered a conservative value. It is currently not known what fraction of the globulettes that form FFPs. Their mass and density are likely to affect this fraction but to what extent is currently unknown. Neverthless, if we assume that 1 % or 10 % of the globulettes form FFPs, then the number of FFPs originating from globulettes is and , respectively.
The MOA-2 Galaxtic bulge microlensing survey [Sumi et al., 2011] found that the Jupiter-sized FFPs are about 1.8 times as common as main-sequence stars. These planets are unbound or bound but very distant 100 AU from any star. It is unclear if some of these objects are low-mass brown dwarfs or super-Jupiters. The difference between these classes of objects is not well defined [Luhman, 2012, Giannini & Lunine, 2013]. However the population of these objects is expected to arise from a variety of processes, such as in situ formation or from the core accretion theory, see Veras & Raymond [2012] and Sect. 1. However, the number of Jupiter-sized FFPs by Sumi et al. [2011] may be overestimated, due to blending or red noise in the data [Bachelet et al., 2015] or the distribution of the timescale of mircolensing events [Di Stefano, 2012]. Furthermore, Clanton & Gaudi [2017] also found a slightly lower value (-) of FFPs per main sequence star. Recently, Mróz et al. [2017] found, using microlensing, 0.25 per star as an upper limit on the number of Jupiter sized planets.
A more conservative estimate of the number of Jupiter-sized planets has been calculated by Tutukov & Fedorova [2012] and more recently by Ma et al. [2016], where the FFP population is found to be of the stellar population, which corresponds to a total number of FFPs. However, these FFPs candidates originate in protoplanetary disks, while the FFPs considered here are formed in situ. Their value is less than the observed value of Sumi et al. [2011] but it is comparable to our result if 1% of the globulettes form FFPs.
If we increase the factors , and , equation (1) would yield about globulettes. Then by assuming that 10 % of the globulettes form FFPs, the globulettes would then contribute to about 11 % of all FFPs, as estimated by Sumi et al. [2011].
A number of candidates of brown dwarfs and Jupiter mass objects have been found in several nearby, young star clusters and star-forming regions. Drass et al. [2016] have found 160 isolated planetary mass object candidates in the Orion Nebula. However, we only observe 9 dark objects in this H II region. This can be compared to the Rosette Nebula, where we have 16 times more objects in a smaller area.
We note that the total observed area of the H II regions is only 7 % of the total nebula area, and in the 27 H II regions there are 18 nebulae with observed globulettes and 8 nebulae with no observed globulettes. In these nebulae, the surveys could simply have missed them or the enivronment might not be favorable for globulette formation.
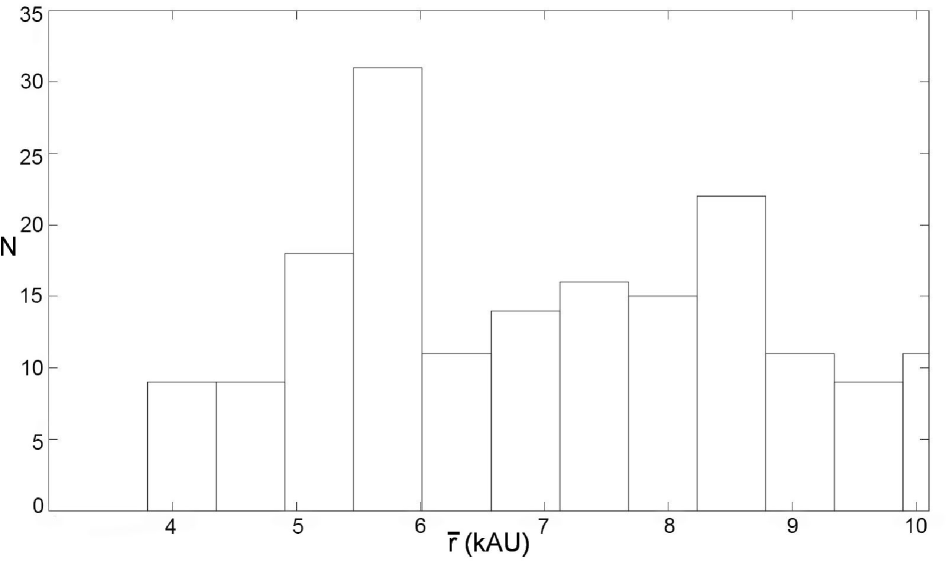
In 30 Doradus, which is the closest extragalactic source, many filaments and dust clumps in different sizes have been observed [Indebetouw et al., 2013, Chevance et al., 2016]. In this nebula, we discovered 176 globulettes with mean radii less than 10 kAU. Their size distribution is shown in Figure 3 with a peak at about 5.7 kAU. Compared to the globulettes in H II regions within the Milky Way, these globulettes are rather large. Due to its far distance, the detection limit of the objects in the 30 Doradus is about 4 kAU, which means that all smaller globulettes have escaped detection.
5 Conclusions
In this paper we have examined 319 H II regions, whereof 28 were observed with a narrowband H-alpha filter. In these H II regions, we have identified small roundish objects, globulettes, which appear dark in the H-alpha images. We summarize the present work as follows;
-
1.
The total area and observed area of the 27 H II regions was estimated to 44 413 armin2 and to 3 297 arcmin2, respectively.
-
2.
We estimated the mean radii for each globulette found in the H II regions. The majority of objects have radii kAU but most seem concentrated around kAU.
-
3.
Amongst the 27 H II regions, there are 18 nebuale with observed globulettes and 8 nebula with no observed globulettes.
-
4.
In the 30 Doradus, the mean radii had a peak at 5.7 kAU, which was higher than the regions within the Milky Way.
-
5.
The total amount of globulettes was estimated to 778 and by correcting for the factor (resolution difference between HST and NOT), the number of globulettes was estimated to 951, which gives an average of 35 globulettes per H II region.
-
6.
Our model gives a conservative estimate on the number of globulettes formed in the history of the Milky Way to about . A less conservative estimate gives globulettes.
-
7.
The globulettes could therefore represent a non-negligible source of the FFPs in the Milky Way. For example, if 10 % of the globulettes of our less conservative estimate form FFPs, then the globulettes would contribute to about 11 % of all FFPs, as estimated by Sumi et al. [2011].
Acknowledgements We wish to thank professor Gösta Gahm for many fruitful discussions. We also wish to aknowledge the data provided by the NASA/ESA Hubble Space Telescope (HST), obtained at the Space Telescope Science Institute as well as the Nordic Optical Telescope (NOT).
References
- Abel et al. [2007] Abel, T., Wise, J. H., & Bryan, G. L.: Astrophys. J. Lett. 659, L87 (2007)
- Anderson et al. [2014] Anderson, L. D., Bania, T. M., Balser, D. S., et al.: Astrophys. J. Suppl. Ser. 212, 1 (2014)
- Anderson et al. [2015] Anderson, L. D., Armentrout, W. P., Johnstone, B. M., et al.: Astrophys. J. Suppl. Ser. 221, 26 (2015)
- Alvarez et al. [2006] Alvarez, M. A., Bromm, V., & Shapiro, P. R.: Astrophys. J. 639, 621 (2006)
- Bachelet et al. [2015] Bachelet, E., Bramich, D. M., Han, C., et al.: Astrophys. J. 812, 136 (2015)
- Bally et al. [2000] Bally, J., O’Dell, C. R., & McCaughrean, M. J.: Astron. J. 119, 2919 (2000)
- Bayo et al. [2017] Bayo, A., Joergens, V., Liu, Y., et al.: Astrophys. J. Lett. 841, L11, (2017)
- Beccari et al. [2010] Beccari, G., Spezzi, L., De Marchi, G., et al.: Astrophys. J. 720, 1108 (2010)
- Best et al. [2017] Best, W. M. J., Liu, M. C., Dupuy, T. J., & Magnier, E. A.: arXiv:1706.01883 (2017)
- Bica et al. [2003] Bica, E., Dutra, C. M., Soares, J., & Barbuy, B.: Astron. Astrophys. 404, 223 (2003)
- Bihain et al. [2009] Bihain, G., Rebolo, R., Zapatero Osorio, M. R., et al.: Astron. Astrophys. 506, 1169 (2009)
- Bok & Reilly [1947] Bok, B. J., & Reilly, E. F.: Astrophys. J. 105, 255 (1947)
- Boss [2009] Boss, A. P.: Astrophys. J. 694, 107 (2009)
- Boucher et al. [2016] Boucher, A., Lafrenière, D., Gagné, J., et al.: Astrophys. J. 832, 50 (2016)
- Bowler et al. [2011] Bowler, B. P., Liu, M. C., Kraus, A. L., Mann, A. W., & Ireland, M. J.: Astrophys. J. 743, 148 (2011)
- Brandner et al. [2000] Brandner, W., Grebel, E. K., Chu, Y.-H., et al.: Astron. J. 119, 292 (2000)
- Chabrier et al. [2000] Chabrier, G., Baraffe, I., Allard, F., & Hauschildt, P.: Astrophys. J. Lett. 542, L119 (2000)
- Chevance et al. [2016] Chevance, M., Madden, S. C., Lebouteiller, V., et al.: Astron. Astrophys. 590, A36 (2016)
- Clanton & Gaudi [2017] Clanton, C., & Gaudi, B. S.: Astrophys. J. 834, 46 (2017)
- Crowther & Conti [2003] Crowther, P. A., & Conti, P. S.: Mon. Not. R. Astron. Soc. 343, 143 (2003)
- Cushing et al. [2014] Cushing, M. C., Kirkpatrick, J. D., Gelino, C. R., et al.: Astron. J. 147, 113 (2014)
- De Marco et al. [2006] De Marco, O., O’Dell, C. R., Gelfond, P., Rubin, R. H., & Glover, S. C. O.: Astron. J. 131, 2580 (2006)
- Di Stefano [2012] Di Stefano, R.: Astrophys. J. Suppl. Ser. 201, 20 (2012)
- Drass et al. [2016] Drass, H., Haas, M., Chini, R., et al.: Mon. Not. R. Astron. Soc. 461, 1734 (2016)
- Fang et al. [2016] Fang, M., Kim, J. S., Pascucci, I., Apai, D., & Manara, C. F.: Astrophys. J. Lett. 833, L16 (2016)
- Feigelson et al. [2013] Feigelson, E. D., Townsley, L. K., Broos, P. S., et al.: Astrophys. J. Suppl. Ser. 209, 26 (2013)
- Foster & Brunt [2015] Foster, T., & Brunt, C. M.: Astron. J. 150, 147 (2015)
- Freeman et al. [2015] Freeman, M., Philpott, L. C., Abe, F., et al.: Astrophys. J. 799, 181 (2015)
- Gahm et al. [2007] Gahm, G. F., Grenman, T., Fredriksson, S., & Kristen, H.: Astron. J. 133, 1795 (2007)
- Gahm et al. [2013] Gahm, G. F., Persson, C. M., Mäkelä, M. M., & Haikala, L. K.: Astron. Astrophys. 555, A57 (2013)
- Giannini & Lunine [2013] Giannini, E., & Lunine, J. I.: Reports on Progress in Physics. 76, 056901 (2013)
- Greif et al. [2007] Greif, T. H., Johnson, J. L., Bromm, V., & Klessen, R. S.: Astrophys. J. 670, 1 (2007)
- Grenman [2006] Grenman,T.: “Globulettes – a new class of very small and dense intersteller clouds”, Licentiate Thesis, Luleå Univ. of Tech (2006)
- Grenman & Gahm [2014] Grenman, T., & Gahm, G. F.: Astron. Astrophys. 565, A107 (2014)
- Gum [1955] Gum, C. S.: Mem. R. Astron. Soc. 67, 155 (1955)
- Haworth et al. [2015] Haworth, T. J., Facchini, S., & Clarke, C. J.: Mon. Not. R. Astron. Soc. 446, 1098 (2015)
- Hensberge et al. [2000] Hensberge, H., Pavlovski, K., & Verschueren, W.: Astron. Astrophys. 358, 553 (2000)
- Herbig [1974] Herbig, G. H.: Publ. Astron. Soc. Pac. 86, 604 (1974)
- Hillenbrand et al. [1993] Hillenbrand, L. A., Massey, P., Strom, S. E., & Merrill, K. M.: Astron. J. 106, 1906 (1993)
- Hur et al. [2012] Hur, H., Sung, H., & Bessell, M. S.: Astron. J. 143, 41 (2012)
- Indebetouw et al. [2013] Indebetouw, R., Brogan, C., Chen, C.-H. R., et al.: Astrophys. J. 774, 73 (2013)
- Joergens et al. [2015] Joergens, V., Bonnefoy, M., Liu, Y., Bayo, A., & Wolf, S.: 18th Cambridge Workshop on “Cool Stars, Stellar Systems, and the Sun”, 18, 1019 (2015)
- Jayawardhana & Ivanov [2006] Jayawardhana, R., & Ivanov, V. D.: Science 313, 1279 (2006)
- Kharchenko et al. [2005] Kharchenko, N. V., Piskunov, A. E., Roeser, S., Schilbach, E., & Scholz, R.-D.: VizieR Online Data Catalog. 343 (2005)
- Kim & Koo [2003] Kim, K.-T., & Koo, B.-C.: Astrophys. J. 596, 362 (2003)
- Kitayama et al. [2004] Kitayama, T., Yoshida, N., Susa, H., & Umemura, M.: Astrophys. J. 613, 631 (2004)
- Kroupa & Bouvier [2003] Kroupa, P., & Bouvier, J.: Mon. Not. R. Astron. Soc. 346, 369 (2003)
- Kurtz & Franco [2002] Kurtz, S., & Franco, J.: Revista Mexicana de Astronomia y Astrofisica Conference Series. 12, 16 (2002)
- Li et al. [2015] Li, Y., Kouwenhoven, M. B. N., Stamatellos, D., & Goodwin, S. P.: Astrophys. J. 805, 116 (2015)
- Liu et al. [2013] Liu, M. C., Magnier, E. A., Deacon, N. R., et al.: Astrophys. J. Lett. 777, L20 (2013)
- Lucas & Roche [2000] Lucas, P. W., & Roche, P. F.: Mon. Not. R. Astron. Soc. 314, 858 (2000)
- Luhman et al. [2005] Luhman, K. L., Adame, L., D’Alessio, P., et al.: Astrophys. J. Lett. 635, L93 (2005)
- Luhman [2012] Luhman, K. L.:Annu. Rev. Astron. Astrophys. 50, 65 (2012)
- Ma et al. [2016] Ma, S., Mao, S., Ida, S., Zhu, W., & Lin, D. N. C.: Mon. Not. R. Astron. Soc. 461, L107 (2016)
- Marasco et al. [2015] Marasco, A., Debattista, V. P., Fraternali, F., et al.: Mon. Not. R. Astron. Soc. 451, 4223 (2015)
- Mellema et al. [2006] Mellema, G., Arthur, S. J., Henney, W. J., Iliev, I. T., & Shapiro, P. R.: Astrophys. J. 647, 397 (2006)
- Menten et al. [2007] Menten, K. M., Reid, M. J., Forbrich, J., & Brunthaler, A.: Astron. Astrophys. 474, 515 (2007)
- Moisés et al. [2011] Moisés, A. P., Damineli, A., Figuerêdo, E., et al.: Mon. Not. R. Astron. Soc. 411, 705 (2011)
- Mookerjea et al. [2009] Mookerjea, B., Sandell, G., Jarrett, T. H., & McMullin, J. P.: Astron. Astrophys. 507, 1485 (2009)
- Moore et al. [2002] Moore, B. D., Walter, D. K., Hester, J. J., et al.: Astron. J. 124, 3313 (2002)
- Mróz et al. [2017] Mróz, P., et al.: Nature 548, 183 (2017)
- Nakajima et al. [1995] Nakajima, T., Oppenheimer, B. R., Kulkarni, S. R., et al.: Nature 378, 463 (1995)
- Noel et al. [2005] Noel, B., Joblin, C., Maillard, J. P., & Paumard, T.: Astron. Astrophys. 436, 569 (2005)
- Ohlendorf et al. [2013] Ohlendorf, H., Preibisch, T., Gaczkowski, B., et al.: Astron. Astrophys. 552, A14 (2013)
- O’Dell et al. [1993] O’Dell, C. R., Wen, Z., & Hu, X.: Astrophys. J. 410, 696 (1993)
- O’Dell & Wong [1996] O’Dell, C. R., & Wong, K.: Astron. J. 111, 846 (1996)
- Padoan & Nordlund [2004] Padoan, P., & Nordlund, Å.: Astrophys. J. 617, 559 (2004)
- Peña Ramírez et al. [2012] Peña Ramírez, K., Béjar, V. J. S., Zapatero Osorio, M. R., Petr-Gotzens, M. G., & Martín, E. L.: Astrophys. J. 754, 30 (2012)
- Peña Ramírez et al. [2016] Peña Ramírez, K., Béjar, V. J. S., & Zapatero Osorio, M. R.: Astron. Astrophys. 586, A157 (2016)
- Pietrzyński et al. [2013] Pietrzyński, G., Graczyk, D., Gieren, W., et al.: Nature 495, 76 (2013)
- Quanz et al. [2010] Quanz, S. P., Goldman, B., Henning, T., et al.: Astrophys. J. 708, 770 (2010)
- Rebolo et al. [1995] Rebolo, R., Zapatero Osorio, M. R., & Martín, E. L.: Nature 377, 129 (1995)
- Rolleston et al. [2002] Rolleston, W. R. J., Trundle, C., & Dufton, P. L.: Astron. Astrophys. 396, 53 (2002)
- Román-Zúñiga & Lada [2008] Román-Zúñiga, C. G., & Lada, E. A.: “Handbook of Star Forming Regions, Volume I, The Northern Sky”, 4, 928 (2008)
- Reipurth & Mikkola [2015] Reipurth, B., & Mikkola, S.: Astron. J. 149, 145 (2015)
- Sana et al. [2011] Sana, H., James, G., & Gosset, E.: Mon. Not. R. Astron. Soc. 416, 817 (2011)
- Sato et al. [2008] Sato, M., Hirota, T., Honma, M., et al.: Publ. Astron. Soc. Jpn. 60, 975 (2008)
- Schneider et al. [2007] Schneider, N., Simon, R., Bontemps, S., Comerón, F., & Motte, F.: Astron. Astrophys. 474, 873 (2007)
- Schneider et al. [2016] Schneider, N., Bontemps, S., Motte, F., et al.: Astron. Astrophys. 591, A40 (2016)
- Sharpless [1959] Sharpless, S.: Astrophys. J. Suppl. Ser. 4, 257 (1959)
- Silk [1977] Silk, J.: Astrophys. J. 211, 638 (1977)
- Smith et al. [2010] Smith, N., Povich, M. S., Whitney, B. A., et al.: Mon. Not. R. Astron. Soc. 406, 952 (2010)
- Som et al. [2015] Som, D., Kulkarni, V. P., Meiring, J., et al.: Astrophys. J. 806, 25 (2015)
- Stamatellos & Whitworth [2009] Stamatellos, D., & Whitworth, A. P. 2009, Mon. Not. R. Astron. Soc., 400, 1563
- Sumi et al. [2003] Sumi, T., Abe, F., Bond, I. A., et al.: Astrophys. J. 591, 204 (2003)
- Sumi et al. [2011] Sumi, T., Kamiya, K., Bennett, D. P., et al.: Nature 473, 349 (2011)
- Thackeray [1950] Thackeray, A. D.: Mon. Not. R. Astron. Soc. 110, 524 (1950)
- Tutukov & Fedorova [2012] Tutukov, A. V., & Fedorova, A. V.: Astronomy Reports. 56, 305 (2012)
- Vargas Álvarez et al. [2013] Vargas Álvarez, C. A., Kobulnicky, H. A., Bradley, D. R., et al.: Astron. J. 145, 125 (2013)
- Veras & Raymond [2012] Veras, D., & Raymond, S. N.: Mon. Not. R. Astron. Soc. 421, L117 (2012)
- Wang et al. [2015] Wang, L., Kouwenhoven, M. B. N., Zheng, X., Church, R. P., & Davies, M. B.: Mon. Not. R. Astron. Soc. 449, 3543 (2015)
- Whitworth & Zinnecker [2004] Whitworth, A. P., & Zinnecker, H.: Astron. Astrophys. 427, 299 (2004)
- Wise & Abel [2008] Wise, J. H., & Abel, T.: Astrophys. J. 685, 40-56 (2008)
- Wood & Churchwell [1989] Wood, D. O. S., & Churchwell, E.: Astrophys. J. Suppl. Ser. 69, 831 (1989)
- Wyrzykowski et al. [2015] Wyrzykowski, Ł., Rynkiewicz, A. E., Skowron, J., et al.: Astrophys. J. Suppl. Ser. 216, 1 (2015)
- Yadav et al. [2015] Yadav, R. K., Pandey, A. K., Sharma, S., et al.: New Astron. 34, 27 (2015)
- Zapatero Osorio et al. [2000] Zapatero Osorio, M. R., Béjar, V. J. S., Martín, E. L., et al.: Science 290, 103 (2000)
- Zapatero Osorio et al. [2017] Zapatero Osorio, M. R., Béjar, V. J. S., & Peña Ramírez, K.: Astrophys. J., 842, 1 (2017)