Vol.0 (200x) No.0, 000–000
22institutetext: Graduate University of Science and Technology, Vietnam Academy of Science and Techonology, 18 Hoang Quoc Viet, Cau Giay, Hanoi, Vietnam
33institutetext: Laboratoire d’astrophysique de Bordeaux, Université de Bordeaux, CNRS, B18N, Allée Geoffroy Saint-Hilaire, F-33615 Pessac
44institutetext: IRAM, 300 rue de la piscine, F-38406 Saint Martin d’Hères Cedex, France
55institutetext: Academia Sinica, Institute of Astronomy and Astrophysics, Taipei, Taiwan
Morphology of the 13CO(3-2) millimeter emission across the gas disc surrounding the triple protostar GG Tau A using ALMA observations
Abstract
Observations by the Atacama Large Millimeter/sub-millimeter Array of the dust continuum and 13CO(3-2) millimeter emissions of the triple stellar system GG Tau A are analysed, giving evidence for a rotating gas disc and a concentric and coplanar dust ring. The present work complements an earlier analysis (Tang et al. [2016]) by exploring detailed properties of the gas disc. A 95% confidence level upper limit of 0.24 arcsec (34 au) is placed on the disc scale height at a distance of 1 arcsec (140 au) from the central stars. Evidence for Keplerian rotation of the gas disc is presented, the rotation velocity reaching 3.1 km s-1 at 1 arcsec from the central stars, and a 99% confidence level upper limit of 9% is placed on a possible in-fall velocity relative contribution. Variations of the intensity across the disc area are studied in detail and confirm the presence of a hot spot in the south-eastern quadrant. However several other significant intensity variations, in particular a depression in the northern direction, are also revealed. Variations of the intensity are found to be positively correlated to variations of the line width. Possible contributions to the measured line width are reviewed, suggesting an increase of the disc temperature and opacity with decreasing distance from the stars.
keywords:
protoplanetary disks, stars: low-mass, stars: individual (GG Tau A)1 Introduction
GG Tau A is a triple stellar system, 1 to 5 million years old, located at 140 pc in a hole of the Taurus-Auriga star forming region. The separation between the main star GG Tau Aa and the close binary GG Tau Ab (Ab1-Ab2) is 35 au while the separation between GG Tau Ab1 and Ab2 is only 4.5 au (Di Folco et al. [2014]). GG Tau A is surrounded by an envelope of gas and dust with a ring extending from 180 to 260 au and an outer disc extending up to 800 au from the central stars with an estimated mass of 0.15 solar masses (Dutrey et al. [1994]). There is neither known molecular outflow nor jets associated with GG Tau A. Additional information about the system can be found in the review by Dutrey et al. ([2016]) and from references therein. In particular high resolution Atacama Large Millimeter/sub-millimeter Array (ALMA) observations of 12CO(6-5) emission and underlying continuum (Dutrey et al. [2014]) have suggested possible planet formation. The present article uses ALMA data of the 13CO(3-2) emission and underlying continuum that have been presented earlier by Tang et al. ([2016]) together with 12CO(3-2) observations. Contrary to 12CO(3-2) emission, which extends down to small distances from the central stars, 13CO(3-2) emission is limited to an outer ring having an inner edge radius of 1 arcsec. The present analysis aims at complementing that of Tang et al. ([2016]) by providing new detailed information on the properties of the gas disc.
2 OBSERVATIONS AND DATA REDUCTION
The observations used in the present article were made in cycle 1 of ALMA operation (2012.1.00129.S) on November 18 and 19, 2013 in three blocks (Tang et al. [2016]). The time spent on source was 1.84 hours. The number of antennas was 28, the longest baseline being 1284.3 m. The three blocks of continuum data have been merged and calibrated by the ALMA staff and the 13CO(3-2) data have been calibrated using CASA111http://casa.nrao.edu and GILDAS222https://www.iram.fr/IRAMFR/GILDAS. The origin of coordinates at RA=4h 32m 30.3s and DEC= corresponds to year 2000. Between 2000 and the time of observation, the source has moved by 0.24 arcsec east and 0.26 arcsec south (proper motion of [17, 19] mas per year taken from SIMBAD333http://simbad.harvard.edu/simbad/sim-fbasic database); the data have been corrected accordingly.
The continuum emission was observed at 0.9 mm wavelength over frequencies covering from 330.655 to 344.426 GHz. The beam size (FWHM) is arcsec2 with a position angle (measured from north to east) of . The 13CO(3-2) emission was self-calibrated. The beam size (FWHM) is arcsec2 with a position angle of 80∘. The present analysis is performed in the image plane and we evaluate the uncertainty on position measurements due to noise to be typically below 0.01 arcsec, depending on the signal to noise ratio. However, it is often dominated by systematics and needs to be evaluated for each case separately. The spectral resolution (channel) has been smoothed to 0.11 km s-1 and the Doppler velocity covers between and 15 km s-1. Here, Doppler velocities are defined as the difference between the measured velocity and a systemic velocity of km s-1 as used by Dutrey et al. ([2014]) for 12CO(6-5) about which the profile is well symmetric.
3 GENERAL FEATURES
3.1 Continuum data
Figure 1 (left) maps the brightness of the continuum emission. It shows an elliptical ring surrounding a central source. The right panels show the projections on the (right ascension offset) and (declination offset) axes of the central source intensity integrated over and respectively. Gaussian fits give mean values of 0.06 and 0.13 arcsec and FWHM values of 0.40 and 0.33 arcsec in and respectively, similar to the beam size: the central source is unresolved.
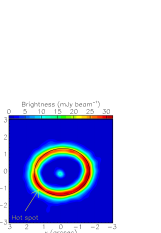


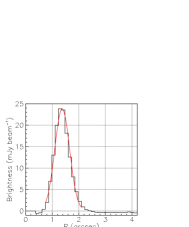
Figure 2 (left) displays the and projections of the continuum brightness integrated over and respectively. It requires the distance to the central source to exceed 0.5 arcsec, thereby excluding its contribution. The corresponding mean values of and are and arcsec respectively, showing that the ring is shifted north-west by 0.12 arcsec with respect to the central source. The position and width measurements illustrated in Figure 1 and Figure 2 are accurate to be better than 0.02 arcsec, using the residual of the fits to estimate measurement errors. They are dominated by systematics rather than simply by thermal noise. However, the angular separation between GG Tau Aa and Ab is 0.25 arcsec: depending on what is being talked about, the position of the ”centre” may vary by some 0.1 arcsec. Figure 2 (right) displays the dependence on of the continuum brightness averaged over position angle (measured from north to east), again excluding the central source by requiring arcsec. A Gaussian fit to the peak gives a mean of arcsec and a of arcsec depending on the interval of over which the fit is performed. Retaining a value of 0.266 arcsec and subtracting the beam size in quadrature gives a de-convolved FWHM of arcsec. Tang et al. ([2016]) quote a value of 0.54 arcsec for the de-projected and de-convolved width of a uniform ring. The effect of de-projection is negligible and the correcting factor for Gaussian to square box fit is , bringing the Tang et al. ([2016]) value down to 0.51 arcsec to be compared with the present result of arcsec. This is a very good agreement given that the ring is neither uniform nor perfectly Gaussian and that possible wings of faint emission beyond 1.8 arcsec would affect differently the two fitting procedures.
Figure 3 (left) displays the mean value of , , weighted by the radial average of the brightness across the ring over the interval arcsec. A fit of the dependence of on as an ellipse of semi-major and semi-minor axes and and offset by and has been made to first order in the offsets and in the ellipticity:
| (1) |
It gives arcsec and arcsec, position angle of the major axis and small offsets and arcsec, at the level of measurement uncertainties. This confirms the good centering of the ring on the origin of coordinates and the aspect ratio corresponds to a tilt with respect to the sky plane of a circular ring about the rotated (by ) axis.
These results confirm the values quoted by Tang et al. ([2016]): 1.63 arcsec instead of 1.62 arcsec for , 7.5∘ instead of 7.0∘ for the position angle and 36.4∘ instead of 32∘ for the tilt with respect to the sky plane, the latter being measured to no better than . The values quoted for the tilt by Dutrey et al. ([2014]) are for 12CO(6-5) and for the dust. Figure 3 (right) displays the dependence on position angle of the continuum brightness averaged over in the interval arcsec. Here we have used the fact that the ratio between the beam area in the sky plane and its de-projected value in the disc plane is equal to . In the disc plane the brightness is uniform over the disc circumference and equal to 16.0 mJy beam-1 to within 8.5% (rms).
3.2 13CO(3-2) line emission
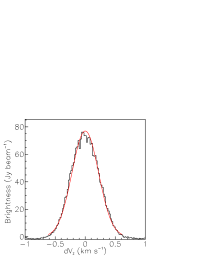
Figure 4 (left) displays the brightness distribution over the data cube. A Gaussian fit to the noise peak gives a mean of mJy beam-1 and a of 7.2 mJy beam-1 (0.56 K). Figure 4 (right) displays the Doppler velocity () spectrum integrated over arcsec2, with a double-horn profile typical of a rotating volume. It is centred to better than 0.1 km s-1. In what follows, throughout the article, we restrict the Doppler velocity range to km s-1 unless specified otherwise.
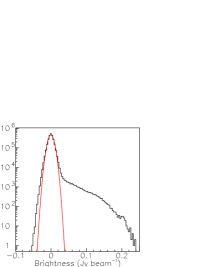
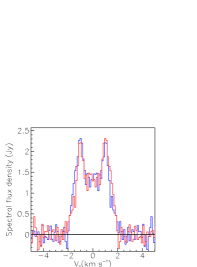
Figure 5 displays the sky maps of the velocity-integrated brightness, or integrated intensity, and of the mean Doppler velocity. The map of the integrated intensity shows a clear ring of gas surrounding the central stars and having morphology similar to the dust morphology, indicating a concentric circular gas disc having the same inclination as the dust ring on the sky plane. It displays no central emission, with an abrupt inner cut-off at 1 arcsec; there is no significant emission inside an ellipse scaled down from the dust ellipse by a factor 3, meaning a de-projected radius of arcsec. The velocity map excludes the region inside the scaled-down ellipse where noise dominates. It displays a clear velocity gradient along the major axis of the ellipse, as expected from rotation of the tilted disc about its axis. Note that an in-falling (rather than rotating) disc would display instead a gradient along the minor axis of the ellipse. In general adding some in-fall motion to rotation would cause the axis of the velocity gradient to deviate from the major axis, the more so the larger the relative contribution of in-fall.
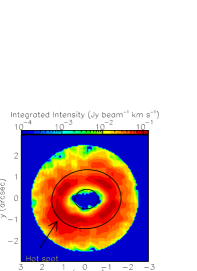
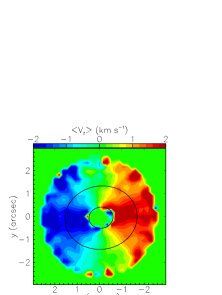
Figure 6 is the equivalent for the line of Figure 2 for the continuum: projections on the and axes and -dependence, averaged over , of the integrated intensity, where is now the de-projected value of in the disc plane (see Figure 8). Here, de-projection assumes a tilt angle of and a position angle of the disc axis of , as for the dust. In all panels we exclude the central region where noise dominates by requiring arcsec. When compared with the dust (continuum) ring, the gas (line) ring is broader and peaks at smaller radii. The mean values of and are 0.02 and arcsec respectively. A fit to the integrated intensity distribution as a function of as a sum of three Gaussians is shown in the right panel of the figure. The means and widths of the Gaussians are fixed to the values obtained by Tang et al. ([2016]) when fitting the western half of the gas disc.
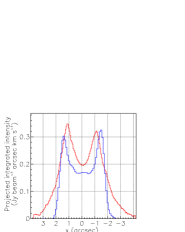

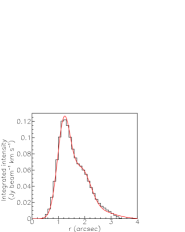

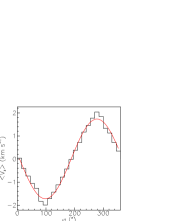

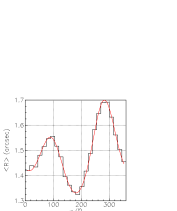
Figure 7 (left) displays the mean value of , , weighted by the radial average of the brightness across the ring over the interval arcsec. A fit of the dependence of on as an ellipse gives semi-major and semi-minor axes arcsec and arcsec, position angle of the major axis and small offsets and arcsec. The position angle and aspect ratio (0.82 instead of 0.85) are very similar to the dust result, but the size of the ellipse is scaled down by a factor 87%. The tilt angle is now 35∘, compared with 32∘ for the dust.
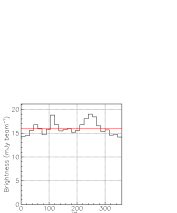
Another estimate of the tilt geometry is obtained from the map of the mean Doppler velocity (Figure 7, middle). In a ring defined as arcsec, a fit of the form gives km s-1, km s-1 and , again in excellent agreement with the value obtained from the dust fit, ; this provides evidence against a significant in-fall contribution. The values quoted by Dutrey et al. ([2014]) are for 12CO(6-5) and for the dust. The value of , 1.73 km s-1 corresponds to a mean rotation velocity of km s-1. Figure 7 (right) displays the dependence on of the disc plane integrated intensity averaged across the ring in the interval arcsec. It has a mean value of 0.39 Jy beam-1 km s-1 and fluctuates around it with an rms of 17%. We summarise the geometry parameters of the dust and 13CO(3-2) emission in Table 1.
| Projection on and | Ellipse fitted to the vs | ||||||||
| (arcsec) | (arcsec) | (arcsec) | (arcsec) | (∘) | (arcsec) | (arcsec) | (∘) | ||
| Dust | Central source Ring | 0.06 | - 1.62 | - 1.38 | - 97.0 | - | - | - 32 | |
| 13CO(3-2) | Disc | 0.02 | 1.45 | 1.19 | 97.8 | 0.02 | 0.07 | 35 | |
4 DETAILED PROPERTIES OF THE GAS DISC
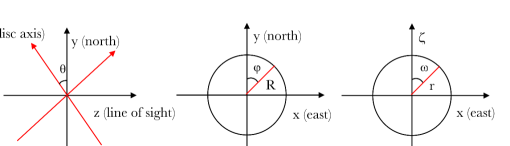
In the present section we use new coordinates obtained from those of the preceding sections by a rotation of angle about the axis. To within , this brings the new axis on the major axes of the ellipses found in the preceding sections as best describing the dependences of both and the Doppler velocity. Moreover, unless otherwise explicitly specified, we assume a tilt of the disc plane as a reasonable compromise between values obtained in both earlier and the present studies, for both gas and dust observations. In practice, we use pixels of arcsec2 on the sky map, covering ()() arcsec2 in the disc plane (). To each pixel () we associate disc coordinates , and . Here disc plane and disc coordinates are simply defined by this transformation, implying no assumption on the disc being actually thin and flat.
4.1 Estimate of the disc thickness obtained from the sharpness of the disc inner edge
Tang et al. ([2016]) have commented on the sharpness of the inner edge of the 13CO(3-2) emission and on the smallness of the vertical temperature gradient, the inner edge of the disc being directly exposed to stellar light and casting a shadow on the outer disc. Here, we compare the value of the smearing of the inner edge of the disc map near the major axis of the ellipse with its value near the minor axis. To a good approximation, the effect of disc thickness essentially cancels for the former while, for the latter, it scales with the product of the disc thickness by the sine of the tilt angle. The optical thickness of the line is not expected to strongly affect this result. We consider four angular sectors in the disc plane, each wide and centred on the axes of the ellipse. In each sector, we study the radial dependence of the integrated intensity, both in the disc plane () and in the sky plane (). The result is displayed in Figure 9. In order to evaluate the sharpness of the inner edge of the gas disc, we fit a Gaussian to the rise of each distribution, between 0.5 and 1.5 arcsec in . In , we use the same interval of 0.5 to 1.5 arcsec for the sectors centred on the major axis of the ellipse but a scaled-down (by a factor =0.82) interval of 0.41 to 1.23 arcsec for the sectors centred on the minor axes in order to account for the effect of the tilt. The mean and values (dispersions, a factor 2.35 smaller than FWHM values also commonly quoted in the literature) obtained for the Gaussian best fits are listed in Table 2.


| North | East | South | West | ||
| fit | 1.15 0.32 | 1.31 0.34 | 1.24 0.33 | 1.34 0.32 | |
| fit | 0.99 0.28 | 1.29 0.34 | 1.08 0.28 | 1.32 0.32 | |
| fit, beam subtracted | 0.24 | 0.31 | 0.24 | 0.29 | |
| fit, de-projected | Scaling factor | 0.86 0.29 | 0.98 0.31 | 0.87 0.29 | 0.99 0.29 |
The distributions as a function of show identical values, to within mas, in the four angular sectors. A contribution from the disc thickness would cause these values to be larger in the minor-axis sectors than in the major-axis sectors: it is already clear that a significant contribution from the disc thickness is excluded. At variance with the distributions as a function of , the distributions as a function of show significantly different values for the major-axis sectors, 0.33 arcsec, and the minor-axis sectors, 0.28 arcsec, a factor 85% smaller. Similarly, the ratio between the mean values of the Gaussians (listed as “scaling factor” in the table) are equal for the two sectors of a same axis of the ellipse, but again 85% smaller for sectors centred on the minor axis than for those centred on the major axis. The latter are very slightly smaller than unity, as expected from the angular widths of the sectors. The consistency between these numbers suggests an interpretation of the values measured in the distributions as the sum of three terms added in quadrature: i) a beam contribution of 0.14 arcsec on both the minor- and major-axis sectors (calculated from the known beam parameters); ii) a contribution from the intrinsic smearing of the disc emission, , caused by effects such as density variations and contributing in each sector a value scaled down by the scaling factors listed in the table; iii) an additional contribution due to the disc thickness and contributing only to the minor-axis sectors. After subtraction of the beam contribution and correction for de-projection, one obtains values of of 0.29 arcsec for the minor-axis sectors and 0.30 arcsec for the major-axis sectors. A contribution due to the disc thickness would cause the former to exceed the latter, at variance with what is observed. From the consistency between the numbers, we estimate an uncertainty of 0.02 arcsec on the Gaussian s. To 95% confidence level () we obtain an upper limit for of arcsec, corresponding to a scale height arcsec (34 au) at arcsec (140 au) where the Keplerian velocity is km s-1; at 30 K, the sound velocity is km s-1 and hydrostatic equilibrium implies arcsec compared with the 0.24 arcsec upper limit obtained above. We have checked that this result is independent of the width of the angular sectors (using instead of lowers the Gaussian ’s by arcsec). Depending on the interval chosen to calculate the Gaussian ’s lower values of the upper limit may be obtained, as low as 0.10 arcsec instead of 0.14 arcsec. We conservatively prefer to retain the latter value as our final result.
4.2 Integrated intensity variations across the disc
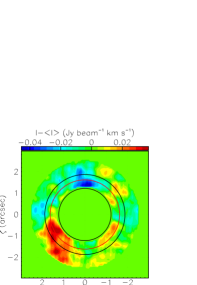
In order to better understand the nature of the integrated intensity variations displayed in Figure 7 (right), we display in Figure 10 the map in the disc plane of the difference between the measured integrated intensity and its value averaged over at the same value of (as obtained from Figure 6, right). This map provides a measure of the lack of rotational symmetry of the integrated intensity in the disc plane. It gives strong evidence for an excess associated with the hot spot observed by Dutrey et al. ([2014]) and Tang et al. ([2016]) and for a northern depression of similar amplitude. Both excess and depression reach their maxima at a distance from the central stars corresponding to the gap between the maxima of the two first Gaussians describing the mean radial distribution of the integrated intensity (these Gaussians peak at =1.22 and 1.87 arcsec respectively). It is also in this gap that the continuum dust emission peaks (at =1.62 arcsec). However, both excess and depression extend to larger values of , particularly the former that extends out to arcsec.
4.3 Gas kinematics
Calling and the components of the disc plane velocity respectively perpendicular and parallel to the disc radius, the Doppler velocity reads () for each data-cube element (). To a good approximation, can be neglected and we can calculate for each data-cube element, leaving for later the task to reveal a possible small contribution. becomes trivially singular along the axis. We require accordingly to exceed 0.3 when calculating . As , this is not much of a loss.
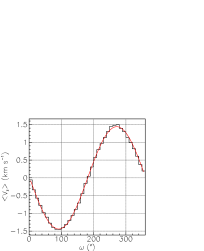
Figure 11 displays the dependence on and of averaged (using brightness as weight) over arcsec and over respectively. Averaging requires some care in dealing with the noise: the interval used for averaging must be symmetric with respect to the mean value obtained as a result, which requires relaxing the condition km s-1 usually applied in the analysis. The -dependence is perfectly described by a sine wave of amplitude km s-1. Adding a cosine term does not change the coefficient of the sine term and insignificantly improves the value of . Its amplitude is km s-1, only 2.6% of the amplitude of the term, corresponding to a shift of in . As a check of the correctness of the procedure, we compare this result with what is obtained when requiring a 3- cut on each data-cube element; the amplitudes of the sine and cosine waves become and km s-1 respectively.
The negative sign of the best-fit cosine term means radial expansion, in-fall would give a positive sign. Assuming a 3∘ uncertainty on , corresponding to half a beam sigma at a distance of 1.3 arcsec, we obtain a 3- upper limit (99% confidence level) of 9% on the ratio . As a function of , averaging over would cause to cancel if symmetry with respect to the axis were perfect. It is indeed found very small, at the level of km s-1 as soon as exceeds the peak of the radial integrated intensity distribution at arcsec.
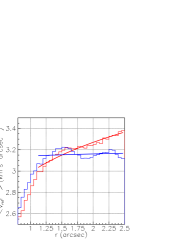
Similarly, the dependence on and of averaged respectively (using brightness as weight) over arcsec and over () is displayed in Figure 12. The left panel shows the distribution of on , which would be constant if the rotation were Keplerian. A fit in the interval arcsec gives a power index of instead of the Keplerian and km s-1 at arcsec. The middle panel illustrates the difficulty to measure reliably due to its singularity on the axis. As remarked earlier, the binarity of the central star prevents the position of the “centre” to be defined to better than some arcsec (more exactly such a definition requires modelling properly the binary configuration). Shifting the origins of and on the sky map by pixel size ( arcsec) changes the value of and therefore of . The result displayed in the middle panel shows the importance of the effect. As a result, increasing the cut from 0.3 to 0.707 () makes the distribution Keplerian with a power index of instead of , the rotation velocity at arcsec increasing from 3.0 to 3.1 km s-1 (left panel). We show in the right panel the map of in the disc plane. It is uniform except for increases near the limits in the north-west and south-east directions. These are largely artefacts due to the difficulty of calculating reliably near the axis. Note that Dutrey et al. ([2014]) quote a value of km s-1 for 12CO(6-5) emission with an index of at au; this corresponds to 2.9 km s-1 at arcsec, consistent with the 3.0 km s-1 observed here for 13CO(3-2) emission.


4.4 Line width
Figure 13 displays the dependence of the brightness on the difference between the values of measured in a given pixel and their mean values in that same pixel. The mean is calculated using brightness as a weight and the histogram is summed over all pixels in the interval arcsec. A Gaussian fit gives a -value of 0.23 km s-1.
Several quantities, added in quadrature, are expected to contribute to : Keplerian shear associated with both beam size and disc thickness, the instrumental resolution and the thermal broadening , possibly including a turbulence contribution (Teague et al., [2016]), and opacity broadening, .
Averaged over , the Keplerian shear at arcsec reads, from the derivative of a power law, where 0.6 stands for the power index of the radial distribution (it would be 0.5 in a pure Keplerian case). Here, is the sum in quadrature of the ’s of beam, arcsec, and of the disc thickness multiplied by , arcsec. Hence, arcsec and km s-1. Taking the FWHM of the instrumental resolution as one velocity bin gives km s-1. Thermal broadening proper reads where is Boltzmann constant, the temperature and the mass of the 13CO molecule; at K (Tang et al. [2016]) it amounts again to some 0.10 km s-1. Opacity tends to flatten the line profile and its effect is an effective broadening of , where is the line opacity (Piétu et al. [2007]). Tang et al., ([2016]) show that 13CO(3-2) and 12CO(3-2) have similar brightness, implying that (13CO) is significantly above unity. Using both 13CO(3-2) and 12CO(3-2), we estimate its value to be , meaning an effective broadening of 1.5 and a joint contribution of km s-1 for thermal and opacity broadening. A possible additional source of broadening could be the effect of noise. However, using a 3- cut to select the data, which must underestimate the measured value of , we obtain 0.20 instead of 0.23 km s-1, showing that noise can be neglected within our estimated uncertainty of km s-1.
Adding the estimated contributions in quadrature gives a total contribution of km s-1 compared with km s-1 measured: there is not much room left for additional contributions and turbulence is small (highly subsonic) in this disc.
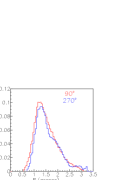
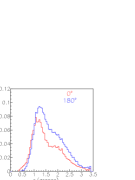
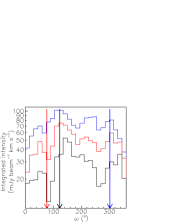
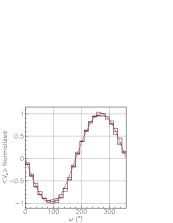
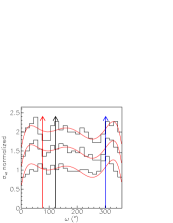
Important additional information on the line width can be obtained from a study of the variations of over the disc plane. To this end we consider three intervals, 0.4 arcsec wide, covering between 1.3 and 2.5 arcsec and 24 -intervals, wide, covering between 0 and 360∘. The dependence on of the integrated intensity is shown in Figure 14 (left) for each -interval separately. The hot spot sticks out at values of that increase from in the low -interval to in the high -interval. The middle panel shows the dependence on of the normalized value of averaged in each - bin separately; more precisely a fit of the form is performed in each - bin separately and the normalization is made by dividing each of the three distributions by the corresponding value of (respectively 1.46, 1.27 and 1.18 km s-1, namely km s-1 divided by ). The values of are between 0.02 and 0.03 km s-1 and can be neglected. All three normalized histograms are well described by a sine wave. The right panel displays the dependence on of : in each - interval the of a Gaussian fit to the peak of the Doppler velocity spectrum is plotted after normalization to its value averaged over in the corresponding -interval (0.258, 0.210, and 0.181 km s-1 respectively).
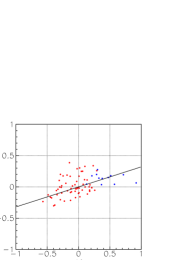
As a function of , the line width fluctuates relatively less than the integrated intensity. Moreover, there is no sign of a sine wave contribution that would signal the effect of Keplerian shear, confirming the conclusion that was reached above. While the hot spot dominates the variations of the integrated intensity, its presence is barely visible as an increase of the line width; conversely, sharper line width excesses at and are visible on the velocity-integrated distribution as less marked excesses. The depressions at , and are also associated with lower values of the line width. The correlation between and fluctuations of the integrated intensity is illustrated in Figure 15. In each () bin we define and as the difference between the values of and and their mean in the interval: and . A clear positive correlation is evidenced from the best linear fit, . Note that the correlation is even slightly stronger if one excludes the hot spot region, the corresponding Pearson coefficients being respectively 0.25 and 0.32. From the low- interval to the high- interval the -averaged line width () decreases by a factor 0.70 while the amplitude of the sine wave decreases only by a factor 0.81. A possible explanation may be an increase of the temperature and opacity with decreasing . An increase of temperature and opacity from ()=(18 K, 5) at arcsec to (36 K, 10) at arcsec would imply an effective thermal broadening increasing from km s-1 to about 0.21 km s-1. Adding in quadrature and contributions of respectively 0.09 and 0.05 km s-1 would give respectively 0.15 and 0.23 km s-1, compared with 0.18 and 0.26 km s-1 being measured.
The fact that the -dependence of is very well described by a simple sine wave in each of the three intervals implies that the observations are consistent with being independent of . It shows again that the fluctuations of observed in Figure 11 are affected by very large uncertainties. Indeed, very good fits to the measured sky map are obtained by assuming a purely Keplerian rotation velocity. On the contrary, we estimate that the uncertainty attached to both and is of the order of only 0.02 km s-1, making the discussion of the line width in terms of more reliable than in terms of dispersion.
5 Summary
In summary, the present analysis confirms the results obtained earlier by Tang et al. ([2016]). It reveals the presence of concentric dust and gas rings sharing a same axis projecting on the sky plane east of north. In the approximation where both rings are flat and thin, their inclination angles with respect to the sky plane are respectively and . The gas ring is broader than the dust ring and peaks at smaller distance (typically 87%) to the central stars. The de-projected radial dependence of the line emission displays maxima at and 1.9 arcsec from the central stars, bracketing the mean dust ring radius of arcsec. It cuts-off sharply at a mean distance of arcsec, cancelling completely below arcsec. Azimuthal rms variations of the dust and gas emissions in the disc planes are measured at the respective levels of and . Strong evidence is obtained for the rotation of the tilted gas disc about its axis dominating the kinematics.
A detailed study of the properties of the gas disc has been presented, adding significant new contributions to the earlier analysis of Tang et al. ([2016]). From the azimuthal dependence of the sharpness of the inner edge of the disc, a 95% confidence level upper limit of 0.24 arcsec (34 au) has been placed on its scale height at a distance of 1 arcsec (140 au) from the central stars. At 30 K, hydrostatic equilibrium would imply , consistent with this observation.
Variations of the integrated intensity across the disc area have been studied in detail and found to confirm the presence of a hot spot in the south-eastern quadrant. However several other significant fluctuations, in particular a depression in the northern direction, have also been revealed. On average, the rms relative variation of the integrated intensity reaches only . The radial dependence of the integrated intensity is modulated with enhancements at and 1.9 arcsec, bracketing the dust ring ( arcsec). It is also between these radial integrated intensity enhancements that both the hot spot and the northern depression are observed to peak (their effects nearly cancelling each other when averaged over ).
The study of the gas kinematics has given evidence for a strong dominance of rotation about the disc axis. The Doppler velocity gradient being perpendicular to the projection of the disc axis on the sky plane allows placing a 99% confidence upper limit of 9% on the ratio between a possible in-fall velocity and the rotation velocity. The difficulty of evaluating reliably the rotation velocity close to the sky plane projection of the disc axis has been illustrated and commented upon. Taking this in proper account, the rotation is observed to be Keplerian with a power index of across most of the disc area. At arcsec, the rotation velocity reaches km s-1 in agreement with the value measured by Dutrey et al. ([2014]) for 12CO(6-5). No significant anomaly can be revealed in regions of important integrated intensity variation such as the hot spot and the northern depression.
Finally, the dependence of the line width on and has been studied. It shows little dependence on and increases as decreases: the of the line, , increases from km s-1 to km s-1 when decreases from 2.3 to 1.5 arcsec. As the contributions of Keplerian shear and instrumental spectral resolution taken together should not exceed some 0.11 km s-1, a possible explanation may be a factor decrease of the disc surface temperature and opacity, reaching respectively 36 K and 10 at arcsec. Relative variations of the line width over the disc area have been found to be strongly correlated with relative variations of the integrated intensity, the former being about a third of the latter. At least qualitatively, this result would also support the presence of a temperature gradient, the CO(3-2) emission ladder peaking at temperatures higher than the average disc temperature.
These new results contribute significant additional information and complement the earlier conclusions reached by Dutrey et al. ([2014]) and Tang et al. ([2016]). However, considerations on optical thickness, which are discussed in detail by Tang et al. ([2016]), are not repeated here. Moreover, interpretations of the observed variations of the integrated intensity as signalling the formation of a planet or of a new companion star remain valid suggestions that would require detailed modelling to be validated. However, this is beyond the scope of the present work.
Acknowledgements.
This paper makes use of the following ALMA data: ADS/JAO.ALMA#2012.1.00129.S. ALMA is a partnership of ESO (representing its member states), NSF (USA) and NINS (Japan), together with NRC (Canada), NSC and ASIAA (Taiwan), and KASI (Republic of Korea), in cooperation with the Republic of Chile. The Joint ALMA Observatory is operated by ESO, AUI/NRAO and NAOJ. This research has made use of the SIMBAD database, operated at CDS, Strasbourg, France, and of the NASA ADS Abstract Services. We thank the anonymous referee for useful comments that helped improving the presentation of this work. We thank the members of the initial “GG Tau team” for early contributions, Jeff Bary, Tracy Beck, Hervé Beust, Yann Boehler, Frederic Gueth, Jean-Marc Huré, Vincent Piétu, Arnaud Piérens and Michal Simon. This research is funded by Vietnam National Foundation for Science and Technology Development (NAFOSTED) under grant number 103.99-2016.50. Department of Astrophysics (VNSC/VAST) acknowledges support from the World Laboratory, Rencontres du Viet Nam, the Odon Vallet fellowships, Vietnam National Space Center and Graduate University of Science and Technology. Anne Dutrey and Stéphane Guilloteau thank the French CNRS programs PNP, PNPS and PCMI.References
- [2014] Di Folco, E., Dutrey, A., Le Bouquin, J.-B. et al., 2014, A&A, 565L, 2D
- [1994] Dutrey, A., Guilloteau, S. and Simon, M., 1994, A&A, 286, 149D
- [2014] Dutrey, A., Di Folco, E., Guilloteau, S. et al., 2014, Nature, 514, 600D
- [2016] Dutrey, A., Di Folco, E., Beck, T. and Guilloteau, S., 2016, A&ARv, 24, 5D
- [2007] Piétu, V., Dutrey, A., Guilloteau, S., et al., 2007, A&A, 467, 163P
- [2016] Tang, Y.-W., Dutrey, A., S. Guilloteau et al., 2016, ApJ, 820, 19T
- [2016] Teague, R., Guilloteau, S., Semenov, D., et al., 2016, A&A, 592, 49T