EXAFS and electrical studies of new narrow-gap semiconductors:
InTe1-xSex and In1-xGaxTe
Abstract
The local environment of Ga, Se, and Tl atoms in InTe-based solid solutions was studied by EXAFS technique. It was shown that all investigated atoms are substitutional impurities, which enter the In(1), Te, and In(2) positions in the InTe structure, respectively. The electrical measurements revealed that In1-xGaxTe and InTe1-xSex solid solutions become semiconductors at and , respectively.
DOI: 10.1016/S0022-3697(00)00196-7
I Introduction
Narrow-gap semiconductors have attracted considerable interest due to their wide application in infrared optoelectronics. Among these materials, solid solutions in which the band gap is controlled by the crystal composition have received particular attention. Our interest to InTe-based solid solutions is stimulated by a possibility of obtaining new narrow-gap semiconductors as a result of semimetal–semiconductor transition, which can occur at isoelectronic substitution in these crystals. In1-xTlxTe is an example of such a solid solution, in which the substitution of indium by thallium results in appearance of semiconductor properties at . Gaw and Kannewurf (1981); Akimov et al. (1986) In this work we investigate two other solid solutions, In1-xGaxTe and InTe1-xSex, which crystallize in the same TlSe-type tetragonal structure with the space group and can be regarded as candidates for narrow-gap semiconductors.
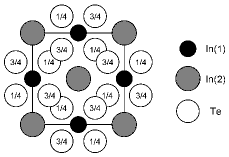
The metal atoms in InTe occupy two positions (see Fig. 1). The In(1) atoms in position 4() are tetrahedrally coordinated by four chalcogen atoms and form chains going along the axis. The bonding in these chains is predominantly covalent. The In(2) atoms in position 4() also form chains, but are surrounded by eight chalcogen atoms occupying the position 8() and two In(2) atoms from the same chain. The metal atoms in the In(1) position are positively charged (valence +3) and the atoms in the In(2) position are negatively charged (valence +1).
The purpose of this work was to substitute the atoms in all lattice sites of InTe and to establish conditions, under which the solid solutions acquire semiconductor properties. One could suppose that Se atoms would substitute for those of Te. According to the known crystal structure of InTlTe2111The InTlTe2 compound is isostructural to InTe and is the limiting case of the In1-xTlxTe solid solution, in which all In(2) positions are occupied by Tl and all In(1) positions are occupied by In (Ref. Müller et al., 1973). and the valence +1 typical for the Tl atom, one could expect Tl to substitute for In in the In(2) position. The Ga atoms, which have typical valence +3 and small size, should probably enter the In(1) position.
To determine the location of Ga, Se, and Tl atoms in the solid solutions we used EXAFS technique, which is based on the analysis of the extended fine structure in X-ray absorption spectra. Lee et al. (1981) EXAFS studies were complemented by X-ray diffraction studies, which enabled to establish the solubility of the impurities in InTe and to determine the variation of the lattice parameters in the solid solutions.
II Samples
In this work, polycrystalline samples and single crystals of InTe1-xSex, In1-xGaxTe, and In1-xTlxTe solid solutions were studied. Polycrystalline samples were prepared by alloying the appropriate amounts of InTe, InSe, GaTe, and TlTe in evacuated silica ampoules and were annealed at a temperature by 30∘C below the solidus one for 7 days. The lattice parameters and for InTe1-xSex and In1-xGaxTe solid solutions were measured on the samples with compositions 0, 0.1, 0.2, 0.3, 0.4, 0.5. The In1/2Ga1/2Te sample () appeared to be two-phase and was not taken into consideration. The dependence of and on can be approximated by linear curves,
| (1) |
| (2) |
for InTe1-xSex and In1-xGaxTe, respectively.
Single crystals of the solid solutions were grown by the Bridgman method. As the composition of the crystals changed along the ingot, samples with different were cut from different parts of the crystal. The composition of the samples was calculated from the parameter, which depended on stronger than the parameter. The error in determination of did not exceed 0.02. According to the X-ray data, in InTe1-xSex crystals the value increased along the ingot, while in In1-xGaxTe crystals it slowly decreased.
Before EXAFS measurements the samples were powdered, the powders were sifted through a sieve and then rubbed into the surface of adhesive tape. The optimum thickness of the absorbing layer was achieved by folding the tape (typically 8–16 layers).
Electrical measurements were carried out on the needle-shaped samples cleaved from the ingots along the axis. The current and potential contacts to the samples with characteristic sizes of 115 mm were soldered using indium under the NH4Cl flux. The contacts appeared to be non-ohmic.
III Experiment
III.1 EXAFS studies
The method of EXAFS-spectroscopy is based on the study of the extended fine structure appearing above the X-ray absorption edge and resulting from the interference of the out-going photoelectron wave exited from one of the core levels of a central atom under investigation with the waves scattered by neighboring atoms. In the single-scattering approximation, the function that describes the dependence of an oscillatory part of the absorption coefficient on the photoelectron wave vector is
| (3) | ||||
where the sum runs over a few nearest shells surrounding the central atom, and , , and are radius, coordination number, and Debye–Waller factor for the th shell, respectively. Lee et al. (1981) The parameter describes the reduction of the oscillation amplitude resulting from multi-electron and inelastic scattering effects. The backscattering amplitude and phase shift , the phase shift of the central atom , and the mean free path of a photoelectron can be calculated theoretically. By minimizing the deviation between the theoretical and experimental EXAFS curves, it is possible to find parameters , , and , which describe the position of atoms in several nearest shells about the investigated atom.
EXAFS measurements were carried out on station 7.1 of the Daresbury synchrotron radiation source operating at an electron beam energy of 2 GeV and a maximum stored current of 240 mA. EXAFS data were collected at the edges of Ga (10.367 keV) and Se (12.658 keV), and at the edge of Tl (12.658 keV) in transmission mode using ion chambers. The sample temperature was 80 K. A double Si(111) crystal monochromator was used without the harmonics rejection, which was not necessary in the above energy range. For each sample at least two spectra were taken.
The function was extracted from the absorption curve in the normal way. Lee et al. (1981) After removing the pre-edge background, splines were used to extract the smooth atomic part of the absorption, , and the dependence was calculated as a function of the photoelectron wave vector . The energy origin, , was taken to be at the inflection point on the absorption edge. The edge steps ranged from 0.06 to 0.41.
| Sample | InTe111EXAFS data at the In edge for InTe were collected on station X23A2 at NSLS. The presented coordination numbers correspond to averaged number of neighbors per In atom. | In0.8Ga0.2Te | InTe0.9Se0.1 | InTe0.8Se0.2 | InTe0.7Se0.3 | In0.8Tl0.2Te222It was assumed that eight Te and two metal atoms in the first shell of thallium are at the same distance and have equal Debye–Waller factors. | InTlTe2222It was assumed that eight Te and two metal atoms in the first shell of thallium are at the same distance and have equal Debye–Waller factors. |
|---|---|---|---|---|---|---|---|
| Standard | InSb | Ga2Te3 | InSe | InSe | InSe | TlI | TlI |
| , Å | 2.821(2) | 2.643(4) | 2.608(4) | 2.607(3) | 2.605(3) | 3.525(12) | 3.564(11) |
| 2.1(1) | 4.2(3) | 1.7(2) | 1.8(1) | 1.7(1) | 10.2(15) | 13.0(18) | |
| , Å2 | 0.0021(3) | 0.0043(5) | 0.0009(5) | 0.0016(4) | 0.0013(4) | 0.0124(19) | 0.0143(16) |
| , Å | 3.541(8) | 3.497(28) | 3.557(35) | 3.526(43) | 3.528(53) | 4.271(34) | 4.262(23) |
| 6.4(4) | 2.1(2) | 3.4(3) | 3.5(2) | 3.3(2) | 4.1(6) | 5.2(7) | |
| , Å2 | 0.0117(10) | 0.0038(40) | 0.030(7) | 0.049(10) | 0.055(13) | 0.0180(68) | 0.0168(44) |
| , Å | 4.215(12) | 4.272(28) | 3.834(17) | 3.823(15) | 3.821(16) | 5.664(32) | 5.698(30) |
| 6.4(4) | 4.2(3) | 1.7(2) | 1.8(1) | 1.7(1) | 8.2(12) | 10.4(14) | |
| , Å2 | 0.0136(19) | 0.0179(56) | 0.0031(17) | 0.0027(14) | 0.0015(15) | 0.0139(52) | 0.0165(48) |
Direct and inverse Fourier transforms with modified Hanning windows were used to extract the information about the first three shells from the experimental curve . The ranges of extraction in space are presented in the captions for Figs. 2–4. The parameters , , and for each shell as well as the energy origin correction were simultaneously varied to obtain the minimum root-mean-square deviation between the experimental and calculated curves. The FEFF software Mustre de Leon et al. (1991) was used to calculate the , , , and functions needed for Eq. (3). The number of the fitting parameters (8) was usually less than a half of the number of independent data points 16–21. The accuracy of determination of fitting parameters was estimated from the correlation matrix; the errors presented in Table 1 are the 95% confidence intervals for variation in the parameters resulting from statistical errors in experimental data. To increase the accuracy, the energy corrections for all shells was assumed to be the same, and known relation between coordination numbers for the InTe structure was used.
For each absorption edge the values, which are necessary for determination of coordination numbers, were obtained from the studies of reference compounds (InSe for the Se edge, Ga2Te3 for the Ga edge, and TlI for the Tl edge).
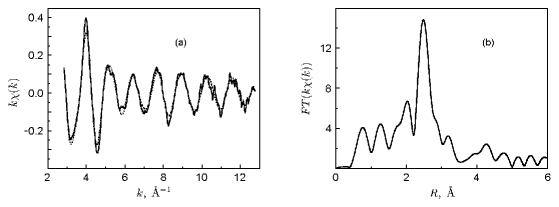
A typical curve obtained at the Ga edge for In0.8Ga0.2Te sample is shown in Fig. 2(a), and its Fourier transform is shown in Fig. 2(b). An analysis of the data reveals that in the first shell the Ga atom is surrounded by four Te atoms located at a distance of 2.64 Å (Table 1). It indicates that the Ga atoms occupy the In(1) position in the solid solution. The obtained Ga–Te distance is close to that found by us in Ga2Te3 (2.61 Å), in which Ga is tetrahedrally coordinated by tellurium; this can indicate the covalent character of the Ga–Te bond in the solid solution. The position of Ga atoms is confirmed by the observation of two metal atoms from the same chain (shifted along the axis) and four metal atoms lying in the perpendicular direction (the second and third shells, see Table 1). The distances to these atoms, determined from EXAFS, agree well with the X-ray diffraction data; they are slightly shorter than the In–In distances in InTe. The Ga–Te bond is 0.18 Å shorter than the In(1)–Te bond in InTe.
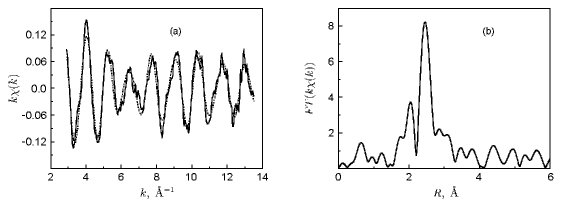
A typical EXAFS spectrum obtained at the Se edge for InTe0.8Se0.2 sample and its Fourier transform are presented in Fig. 3. An analysis of these data reveals that the Se atoms are surrounded by two In atoms at 2.61 Å (Table 1). The length of this bond is close to that of the In–Se covalent bond in InSe (2.615 Å); this enables to conclude that the In–Se bond in the solid solution is also covalent. The obtained coordination number and the bond length indicate that Se atoms substitute for Te in the solid solution. The Se–In(1) distance is 0.22 Å shorter than the Te–In(1) distance in InTe. The second shell of the Se atom (four atoms in the In(2) position) is strongly distorted and is characterized by an unexpectedly large Debye–Waller factor, which increases with increasing (Table 1). However, the analysis reveals an appreciable contribution from the atoms in the third shell (two closest chalcogen atoms in a distorted square antiprism).
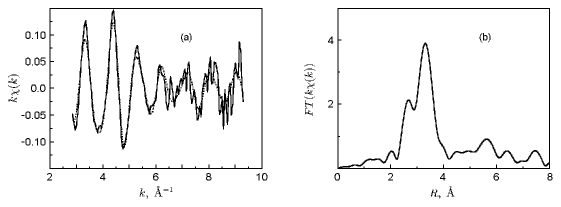
A typical EXAFS spectrum obtained at the Tl edge for In0.8Tl0.2Te sample and its Fourier transform are shown in Fig. 4. An analysis reveals that the Tl atoms substitute for In in the In(2) position. It is interesting that the Tl–Te distances in In0.8Tl0.2Te and InTlTe2 are very close to the In(2)–Te distance in InTe (Table 1). Another feature of these crystals is a rather high Debye–Waller factor for the Tl–Te bond in the first shell.
III.2 Electrical properties
To study possible band structure changes we have measured the temperature dependence of specific resistivity on InTe1-xSex and In1-xGaxTe solid solutions.222Electrical properties of the In1-xTlxTe solid solution were studied in detail in Refs. Gaw and Kannewurf, 1981; Akimov et al., 1986, 1987. According to the sign of the Seebeck coefficient, all the samples were -type.
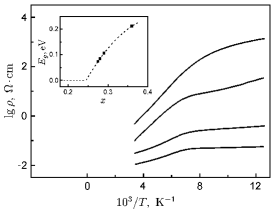
Typical plots for In1-xGaxTe samples are shown in Fig. 5. For all investigated samples, the curves had an activation (semiconductor) character. Two regions with different slopes and a break at about 140 K are clearly seen on the curves. We associated the high-temperature region with intrinsic conductivity, and the low-temperature one with the impurity or hopping conductivity. The forbidden energy gap , calculated as the doubled activation energy in the high-temperature region, is plotted as a function of in the insert to Fig. 5. The extrapolation of this dependence to gives the composition , above which the In1-xGaxTe crystals become semiconductors.
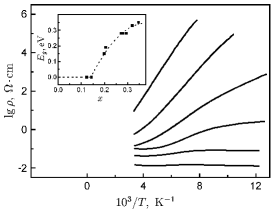
Typical plots for InTe1-xSex samples are presented in Fig. 6. Among these crystals there were the samples, for which the curves had the semiconductor or the metallic character. The energy gap , calculated as the doubled activation energy in the region with the greatest slope, is plotted as a function of in the insert to Fig. 6. It is seen that the InTe1-xSex crystals are semiconductors at .
IV Discussion
We use the obtained EXAFS and X-ray diffraction data to estimate the position of all atoms in the InTe structure.
As follows from the EXAFS data, the Ga and Tl atoms occupy, respectively, highly symmetric In(1) and In(2) positions in InTe.
The position of the chalcogen atom in the structure is described by the position parameter . Unfortunately, in solid solutions the determination of this parameter is impossible because of the random character of atomic substitution. That is why we considered the end-point compounds, on the base of which the solid solutions are formed. These were: the hypothetical In1/2Ga1/2Te compound,333An attempt to determine the structure of this compound was undertaken in Ref. Deiseroth et al., 1985. However, the authors themselves noted that their samples were not single-phase. in which all In(1) positions are occupied by Ga, and the hypothetical InSe compound with the InTe structure. To determine , we used the lattice parameters and the shortest interatomic distances (Ga–Te or In(1)–Se) obtained from the EXAFS measurements. The lattice parameters for hypothetical compounds were estimated from Eqs. (1) and (2). The shortest interatomic distances in the compounds were assumed to be the same as in solid solutions. This assumption is based on the well-known fact of a weak dependence of the chemical bond length on the composition of solid solution, which is partly confirmed by our experimental data.
It was found that in In1/2Ga1/2Te the position parameter of the Te atom is , and the calculated In(2)–Te distance is 3.55 Å, which remains nearly the same as in InTe. In hypothetical InSe compound with the InTe structure, the parameter is 0.172, and the calculated In(2)–Se distance is 3.46 Å. It should be noted that the substitution of Te by Se results in contraction of the In(1)–chalcogen distance by 0.22 Å, whereas the In(2)–chalcogen distance shortens by only 0.1 Å.
Our EXAFS data for InTlTe2 agree well with the X-ray structure data (Ref. Müller et al., 1973).444Small difference between the Tl–Te distances obtained from the EXAFS data (3.56 Å) and X-ray data (3.595 Å) can be explained, as in Ref. Lebedev et al., 1997, by a systematic error in calculation of the phase shifts in the FEFF program for heavy atoms. For Pb, which is adjacent to Tl in the Periodic Table, the EXAFS distances were by 0.025 Å shorter than the X-ray ones (Ref. Lebedev et al., 1997). As was mentioned above, in In1-xTlxTe the distance between the metal in the In(2) position and Te atoms changes a little when substituting In atoms by Tl. In any case, the observed change is notably less than the difference in ionic radii of Tl+ and In+ (0.12 Å according to Ref. Lange and Dean, 1973).
The obtained parameters for the chalcogen atom enable to estimate the distortions of structure of the solid solutions. It is known that the tetrahedron that surrounds the In(1) atom in InTe is slightly stretched along the axis, and the Te–In(1)–Te angle is 101∘ 15′. Our calculations show that in all studied solid solutions the distortion of the tetrahedron increases compared to that in InTe: it is minimal in In1/2Tl1/2Te (101∘ 1′), more appreciable in In1/2Ga1/2Te (99∘ 31′), and is maximal in hypothetical InSe with the InTe structure (99∘ 2′).
Our results enable to understand the role of the In(2) position in the InTe structure. Large Debye–Waller factors for the In(2)–Te distance in InTe and InTe1-xSex and for the Tl–Te distance in In1-xTlxTe (Table 1), unexpectedly small change of the distance between the metal atoms in the In(2) position and the chalcogen atoms when substituting In Tl (0.04 Å) and Te Se (about 0.1 Å) are evidences of a weak chemical bond between the metal atoms in this position and neighboring atoms. This can indicate that the In(2) position in the structure plays a role of a “cavity” for single-charged ions, necessary to maintain the electrical neutrality of a sample. This explains why the InTe structure remains unchanged when substituting the In(2) atoms by various single-charged ions with strongly different radii (Na, K, Tl).
Strong increase in the Debye–Waller factor for the In(2)–chalcogen distance in InTe1-xSex is apparently associated with appreciable displacement of the In(2) atoms from highly symmetric position as a result of a reduced symmetry of their environment (random arrangement of the chalcogen atoms). As follows from smaller Debye–Waller factors for the In(1)–Se and Se–chalcogen distances, the displacements of the In(1) and chalcogen atoms in the solid solution are not so large.
A comparison of the electrical properties of different InTe-based solid solutions revealed a peculiarity in the behavior of curves in the semiconductor samples of InTe1-xSex: in the high-temperature region they appreciably deviated from the expected activation dependence. Such a deviation was not observed in In1-xTlxTe (Ref. Akimov et al., 1986) and In1-xGaxTe. We suppose that this deviation is due to a combined effect of a weak chemical bonding characteristic for the atoms in the In(2) position and of increased In(2)–Se distance in the hypothetical InSe compound. They can lead to an appreciable increase in the size of a cavity for In(2) in InTe1-xSex. As a consequence, the anharmonicity of the motion of the In(2) atoms increases and the temperature variation of the band gap becomes non-linear, thus resulting in the deviation of curves from the activation dependence.
In conclusion, we would like to note that the appearance of semiconductor properties as a result of atomic substitution in all lattice sites is a common feature of all studied InTe-based solid solutions. We can offer the following qualitative explanation of this fact. The character of filling of the energy bands in InTe is close to that in semiconductors, but owing to individual features of its atomic components, the bottom of the conduction band appears slightly below the top of the valence band, thus forming a semimetal band structure. In the case of In1-xGaxTe and InTe1-xSex, the strengthening of the covalent bond (as a consequence of reduction of interatomic distances in tetrahedra) increases the splitting of hybridized orbitals, thus causing the appearance of a gap in the electronic spectrum and the onset of semiconductor behavior. In the case of In1-xTlxTe, the covalent bond length remains unchanged, and the cause of the appearance of semiconductor properties is different. As the contribution of states to the valence band is usually higher than to the conduction band, and the Tl states lie deeper than the In states due to strong relativistic corrections, the valence band moves downwards when substituting In Tl. As a result, the energy gap arises in the electronic spectrum, and the solid solution becomes a semiconductor.
References
- Gaw and Kannewurf (1981) C. A. Gaw and C. R. Kannewurf, Appl. Phys. Lett. 38, 634 (1981).
- Akimov et al. (1986) B. A. Akimov, A. V. Albul, A. V. Davydov, V. P. Zlomanov, L. I. Ryabova, and M. E. Tamm, Fiz. Tverd. Tela 28, 2680 (1986).
- Note (1) The InTlTe2 compound is isostructural to InTe and is the limiting case of the In1-xTlxTe solid solution, in which all In(2) positions are occupied by Tl and all In(1) positions are occupied by In (Ref. \rev@citealpnumZAnorgAllgChem.398.207).
- Lee et al. (1981) P. A. Lee, P. H. Citrin, P. Eisenberger, and B. M. Kincaid, Rev. Mod. Phys. 53, 769 (1981).
- Mustre de Leon et al. (1991) J. Mustre de Leon, J. J. Rehr, S. I. Zabinsky, and R. C. Albers, Phys. Rev. B 44, 4146 (1991).
- Note (2) Electrical properties of the In1-xTlxTe solid solution were studied in detail in Refs. \rev@citealpnumApplPhysLett.38.634,FizTverdTela.28.2680,FizTverdTela.29.16.
- Note (3) An attempt to determine the structure of this compound was undertaken in Ref. \rev@citealpnumZAnorgAllgChem.525.163. However, the authors themselves noted that their samples were not single-phase.
- Müller et al. (1973) D. Müller, G. Eulenberger, and H. Hahn, Z. Anorg. Allg. Chem. 398, 207 (1973).
- Note (4) Small difference between the Tl–Te distances obtained from the EXAFS data (3.56 Å) and X-ray data (3.595 Å) can be explained, as in Ref. \rev@citealpnumPhysRevB.55.14770, by a systematic error in calculation of the phase shifts in the FEFF program for heavy atoms. For Pb, which is adjacent to Tl in the Periodic Table, the EXAFS distances were by 0.025 Å shorter than the X-ray ones (Ref. \rev@citealpnumPhysRevB.55.14770).
- Lange and Dean (1973) N. A. Lange and J. A. Dean, eds., Lange’s Handbook of Chemistry (McGraw-Hill, N.Y., 1973).
- Akimov et al. (1987) B. A. Akimov, A. V. Albul, N. B. Brandt, L. I. Ryabova, and M. E. Tamm, Fiz. Tverd. Tela 29, 16 (1987).
- Deiseroth et al. (1985) H.-J. Deiseroth, D. Müller, and H. Hahn, Z. Anorg. Allg. Chem. 525, 163 (1985).
- Lebedev et al. (1997) A. I. Lebedev, I. A. Sluchinskaya, V. N. Demin, and I. H. Munro, Phys. Rev. B 55, 14770 (1997).