Probing the Ionic Dielectric Constant Contribution in the Ferroelectric Phase of the Fabre-Salts
Abstract
In strongly correlated organic materials it has been pointed out that charge-ordering could also achieve electronic ferroelectricity at the same critical temperature . A prototype of such phenomenon are the quasi-one dimensional (TMTTF) Fabre-salts. However, the stabilization of a long-range ferroelectric ground-state below requires the break of inversion symmetry, which should be accompanied by a lattice deformation. In this work we investigate the role of the monovalent counter-anion in such mechanism. For this purpose, we measured the quasi-static dielectric constant along the -axis direction, where layers formed by donors and anions alternate. Our findings show that the ionic charge contribution is three orders of magnitude lower than the intra-stack electronic response. The dielectric constant () probes directly the charge response of the monovalent anion , since the anion mobility in the structure should help to stabilize the ferroelectric ground-state. Furthermore, our measurements show that the dielectric response is thermally broaden below if the ferroelectric transition occurs in the temperature range where the anion movement begin to freeze in their methyl groups cavity. In the extreme case of the PF6-H12 salt, where occurs at the freezing point, a relaxor-type ferroelectricity is observed. Also, because of the slow kinetics of the anion sub-lattice, global hysteresis effects and reduction of the charge response upon successive cycling are observed. In this context, we propose that anions control the order-disorder or relaxation character of the ferroelectric transition of the Fabre-salts. Yet, our results show that x-ray irradiation damages change the well-defined ferroelectric response of the AsF6 pristine salt into a relaxor.
I Introduction
Currently, there is a considerable interest both for fundamental and application purposes in the study of electronic systems exhibiting strong electron-electron interactions. Electronic correlations lead to subtle interplay between charge, lattice and spin degrees of freedom, whose most illustrative examples can be found among organic metals Lebed . As a consequence, the phase diagram of such organic metals exhibits a subtle competition between spin or charge modulated ground-states and superconductivity Lebed ; reviewdressel ; MdS2013 . Among the various charge modulated ground-states, a ferroelectric phase has been recently discovered in several families of organic materials Review1 ; Review2 ; Ishihara . This discovery has boosted the study of ferroelectric materials because the origin of ferroelectricity in the organics is basically electronic Brazo ; BrazoII ; BrazoIII , in contrast to the ionic origin in conventional ferroelectric systems studied for decades.
Among the organic materials a special attention has been devoted to the Fabre-salts (TMTTF), whose structure is shown in Fig. 1 and where electronic ferroelectricity has been first observed Monceau (TMTTF is tetramethyltetrathiafulvalene and a monovalent counter-anion such as PF6, AsF6 and SbF6). Fabre-salts are composed of well decoupled donor stacks sizeably dimerized in regard of the anions (see Fig. 1) newJPref . In these one-dimensional (1D) electronic systems, ferroelectricity follows a 1D charge-ordering (CO) transition, revealed by the detection of a charge disproportion () between successive donors in the stack direction ChowPRL2000 ; DummJ.Phys.IV2004 , occurring at the same temperature as the dielectric constant diverges (below it is noted the common critical temperature ). Both phenomena are driven by electronic correlation effects, which are particularly enhanced in the 1D quarter-filled organic materials built with the TMTTF donor molecule Bourbon ; JPP2012 ; JPP2015 . As the TMTTF stack is made of TMTTF dimers (outlined in Figs. 1 and 2), the charge disproportion breaks all the inversion symmetry of the stack, which bears an electronic polarization ( in Fig. 2a)). Since at all the stack polarizations are in phase, the material should be a ferroelectric. The detection of a strong dielectric response at , when the electric field is applied along the stack direction , 105 106 in the regime of low frequencies NadMonceauJPSJ2006 ; Staresinic is taken as a good indication that ferroelectricity comes primarily from the electronic sub-system BrazoII ; BrazoIII . Note that the CO/ferroelectric transition breaks also the symmetry of the magnetic degrees of freedom forming localized 1/2 magnetic chains newJPref2 .
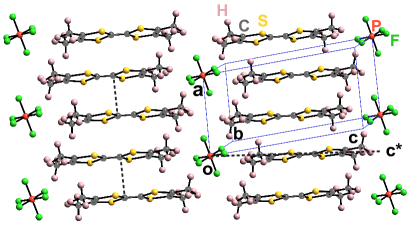
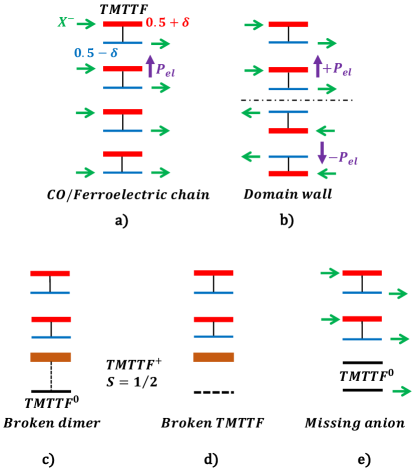
However, since the first detection of a conductivity anomaly at Laversanne1984 , it is found that strongly depends upon the nature of the anion (from 60 K, 100 K and 155 K for = PF6, AsF6 and SbF6 salts, respectively). This clearly indicates that structural effects has to be incorporated in the CO/ferroelectricity mechanism (for a recent review see, e.g., Ref. PougetCrystal2012 ). Also by their easy shift from the inversion centers of the methyl group cavities, anion degrees of freedom are an important ingredient to choose and to stabilize the 3D long-range order formed below BrazoII ; BrazoIII . Such assertion was recently verified by various spectroscopic investigations showing a strengthened interaction of the anion SbF6 Medjanik2014 and AsF6 Medjanik2015 with the hole-rich donor molecule TMTTF below . Nevertheless, evidence for a lattice deformation below was only recently obtained by neutron Pascale2010 and x-ray diffraction Kitou2017 studies of deuterated and hydrogenated (TMTTF)2PF6 (labelled PF6-D12 and PF6-H12 hereafter, respectively). In particular, the x-ray study was able to prove the break of inversion symmetry, to determine the amount of charge disproportion between donors and to reveal asymmetric interactions between anions and methyl groups of charge-rich and charge-poor donors (schematically represented by green arrows in Fig. 2a)).
The pertinence of anion translation and rotation degrees of freedom is assessed by uniaxial lattice thermal expansion measurements exhibiting a sizeable singularity at , which is more particularly revealed for measurements performed along the interlayer -direction MdS2008 ; MdS2013 (defined in Fig. 1). The counter-anions should also control the kinetic of the transition and lead, if is low enough, to an incomplete ferroelectric order exhibiting the typical charge response of a relaxor, as observed for the PF6-H12 Nad2000 . The frequency dependence of the longitudinal dielectric constant exhibits a smoothing of its divergence together with a shift of its maximum above when the frequency of measurement is increased, proving that the pre-transitional dynamics has an intrinsic relaxation character Review2 . Also, as expected for a typical order-disorder transition, there is a slowing down of the mean-relaxation time at the ferroelectric transition Staresinic . In this work, we provide evidence that the anion sub-lattice is responsible for such behavior. In this framework the order-disorder type transition can be simply rationalized if it is assumed that each anion is localized in a double-well potential where each minima corresponds to the anion position to form H-bonds with its methyl group environment PougetCrystal2012 . In presence of such a potential kinetics and dynamics are controlled by the ability of the anion to thermally overcome the double-well potential barrier height in order to change its direction of displacement. Also, anions should be also an intrinsic source of disorder limiting the long-range development of ferroelectricity, which should give rise to a relaxor dielectric response if is low enough.
In order to complete previous dielectric measurements performed along the stack direction , we present the first measurements of the dielectric constant () in the transverse inter-layer direction, which is also the direction of contact between anions and the methyl groups of donors. Furthermore, our 1 kHz low-frequency measurements allows to probe the quasi-static dielectric constant. Thus, measurements allow to investigate directly the charge response of the monovalent counter-anions at the difference of measurements which should mix electronic and ionic contributions. In addition, we have investigated the effect of controlled disorder on the dielectric charge response by investigating well-characterized Coulon2007 ; Coulon2015 x-ray irradiated samples.
II Experimental Aspects
Single crystals of pristine hydrogenated Fabre-salts with the monovalent anions = PF6, AsF6 and SbF6 were recently synthesized by A. Moradpour† in the Laboratoire de Physique des Solides (Orsay) employing the standard procedure. Such samples are from the same batches as those investigated in the Electron Spin Resonance (ESR) of Ref. Coulon2007 . The 97.5% deuterated Fabre-salts with = PF6 have been also synthesized in Orsay according to the procedure described in Ref. Langlois . They are of the same batch as those investigated in the microwave dielectric and ESR studies of Refs. Langlois ; Coulon2007 , respectively. The samples have a needle-like shape with typical dimensions of (2 1 0.5) mm3 respectively along the , (perpendicular to the -axis in the (,) layer) and directions.
Two samples of AsF6-H12, three samples of SbF6-H12 and PF6-H12 and one sample of PF6-D12 were measured. One 12 h and one 3 days irradiated AsF6-H12 samples corresponding to the ones probed by ESR in Ref. Coulon2007 were also studied.
The x-ray irradiation procedure and the determination of the number of irradiation defects by counting the number of localized spin (see Figs. 2c) and d)) created as a function of the irradiation time are given in Ref. Coulon2015 . Following the notation used in Ref. Coulon2015 , the number of irradiation defects is expressed in of localized spin per mole of TMTTF, a quantity denoted mol of irradiation defects. The calibration performed in Ref. Coulon2015 indicates that the 12 hours irradiated AsF6 sample contains 0.035 mol defect, while the 3 days irradiated AsF6 sample contains 0.2 mol defect.
In order to perform dielectric measurement along the -axis, the (, ) surfaces of each single-crystal were covered with carbon paste supplied by SPI supplies. Tempered gold wires provided by Cryogenic with 0.02 mm diameter were attached on the surface of the single-crystals already covered with carbon paste.
The capacitance of the investigated single-crystals was then measured along the -axis using the standard two-points probe method employing an Andeen-Hagerling 2550A capacitance bridge with resolution of 10-6 pF, operating in the fixed frequency of 1 kHz. The quasi-static dielectric constant could be determined by employing the parallel plates capacitor textbook expression, namely , where is the capacitance of the sample, is the capacitor’s plates area and is the distance between them. Hence, the dimensionless dielectric constant was obtained, where is the vacuum permittivity. A Teslatron-PT cryostat supplied by Oxford Instruments was employed in all experiments in the Solid State Physics Lab (Rio Claro).
Before dielectric measurements, the samples were characterized by conductivity measurements along the -axis. The resistivity is found to be activated over the whole temperature range. Its thermal dependence, as well as the magnitude of the resistivity, agrees with previous d.c. resistivity measurements reported in Ref. Kohler2011 .
Dielectric constant measurements were performed both upon warming and cooling with a temperature rate variation between 6 and 12 K/h and with an applied electric field between 50 and 150 mV/cm. Note that our 1 kHz dielectric measurements provide a good estimate of the quasi-static dielectric constant.
III Results and Analysis of the Data
III.1 Pristine salts
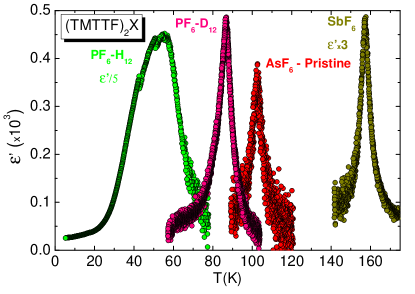
Figure 3 shows the thermal dependence of the dielectric constant for the SbF6-H12, AsF6-H12, PF6-D12 and PF6-H12 salts measured upon cooling. For all investigated salts, exhibits a well-defined peak-like anomaly at the ferroelectric transition of the Fabre-salts, as previously observed for the dielectric constant measured in the stack direction NadMonceauJPSJ2006 . As can be directly determined from the data set shown in Fig. 3, the maximum of occurs at = 160 K, 105 K, 86.6 K and 57 K for the SbF6-H12, AsF6-H12, PF6-D12 and PF6-H12 salts, respectively. The values of SbF6-H12 and AsF6-H12 are in good agreement with those reported by previous dielectric constant NadMonceauJPSJ2006 ; Staresinic ; Nad2000 and local spectroscopic measurements ChowPRL2000 ; Yu2004 ; Dress . Also SbF6-H12 coincides with a net change of slope in the thermal dependence of the resistivity measured on the same sample. The dielectric measurements on PF6-D12 complete an earlier microwave dielectric measurement of performed in samples of the same batch Langlois . The value for the PF6-D12 salt ( = 86.6 K) is close to = 84 K obtained from microwave and agrees with = (84 3) K obtained for the onset of the lattice deformation transition accompanying the CO and detected in an earlier neutron scattering investigation for PF6-D12 Pascale2010 . In PF6-D12 of the same batch, an enhancement of the gap of charge is detected at 85 K by ESR measurements Coulon2007 . In the PF6-H12, the maximum of observed at 57 K in Fig. 3 is significantly lower than the of 67 K reported in the literature from local measurements techniques ChowPRL2000 ; Dress . Note that the thermal dependence of the 1 kHz dielectric constant exhibits a maximum at 50 K Nad2000 .


The amplitude of the maximum of at was found to be strongly sample-dependent. The maximum was found to be at:
50, 350 and 150 in the three SbF6-H12 samples investigated,
350 and 150 in the two AsF6-H12 samples investigated,
400 in the PF6-D12 sample investigated.
Unlike the others salts, where a well-defined sharp peak anomaly is observed at , a broad rounded dielectric response is observed for the PF6-H12 salt. For Sample #2 (Fig. 4a)) a sizeable dielectric response was measured with a main peak-like response up to 2000 at 57 K followed by two secondary peak-like responses at 40 K and 52 K before the vanishing of below 25 K. For Sample #1 (Fig. 4b)) an even broader dielectric response reaching a much weaker intensity of 50 around 55 K was observed. Below its broad maximum the response continuously decreases until 10 K. A behavior similar to the one of Sample #1 is exhibited by a third sample (not shown here) where exhibits a broad maximum of 90. Note that a somewhat similar broad response strongly frequency-dependent is exhibited by the longitudinal dielectric constant of PF6-H12 investigated in Ref. Nad2000 .
Figure 4 shows also that there is a significant global hysteresis between of PF6-H12 measured upon heating and cooling. Also decreases upon successive thermal cycling (Fig. 5).

III.2 Irradiated AsF6-H12 salts
Figure 6 depicts the thermal dependence of , normalized to of pristine AsF6-H12 and for two AsF6-H12 samples irradiated for 12 h and 3 days. The dielectric response of the irradiated samples broadens pronouncedly in temperature and shifts to lower temperatures. A comparison between the thermal dependence of pristine and 12 h irradiated AsF6-H12 show that the broadening is basically due to the enhancement of the dielectric response below . An extreme situation occurs for the 3 days irradiated AsF6-H12 with the growth of a very broad and non-symmetric dielectric response. The latter grows slowly below , presenting a broad maxima centered at 40 K, vanishing rapidly below 20 K.
The peak anomaly of pristine AsF6-H12 rounds and clearly shifts under irradiation. For the 12 h irradiated AsF6-H12 containing 0.035 mol% defect was shifted by 3.7 K. This gives a 1 K shift of for 0.01 mol% defect. The sensitivity of the CO transition to irradiation defect is similar to that found in the SbF6 and ReO4 salts, where a 1 K shift of occurs between 0.017mol % defect and 0.007mol % defect respectivelyCoulon2015 .
measurements clearly show that irradiation damages change the well-defined peak anomaly of the 1 kHz (i.e. quasi-static) dielectric constant of the pristine salt into a typical broad one of a dielectric relaxor. However, frequency measurements were not performed in order to probe the dynamics of the dielectric response.

IV Discussion of the results
IV.1 Anisotropy of the dielectric constant
All the dielectric measurements presented in Section III show that the transverse dielectric constant is lower by several orders of magnitude than the longitudinal dielectric constant . This proves, as expected for a 1D electronic system, that the charge response is very anisotropic. More quantitatively, if one compares the average transverse measured at 1 kHz with the longitudinal measured at 10 kHz in Ref. Staresinic for the AsF6-H12, one obtains a / ratio of 400 at . A similar / ratio of 103 at is obtained in PF6-H12 from the ratio of the 1 kHz longitudinal dielectric constant of Ref. Nad2000 to the average transverse dielectric constant. In these salts the anisotropy of is comparable to the anisotropy of electrical conductivity between and directions at Kohler2011 .
Among the ionic species a special attention must be devoted to the anions, which are the most mobile charged constituents of the Fabre-salts and thus should exhibit a strong dielectric response Review2 . 19F NMR probe of SbF6-H12 and SbF6-D12 salts shows that the anion begins to rotate in their methyl group cavity above 7580 K Yu2004 and undergoes successive reorientation with thermally activated jumps movements above 135 and 210 K Furukawa2005 . In addition, rotation and translational degrees of freedom of the anions are taken as responsible for the negative thermal expansion of lattice parameters detected above 100 K, this onset temperature being slightly dependent on the nature of the anion, see Refs. MdS2013 ; MdS2008 . Such anomalous behavior is found to be the strongest in the direction, along which the donors and anions layers alternate. Hence, dielectric measurements performed in the direction should mostly probe the anion contribution at the dielectric response. The detection of a critical divergence of at , which will be more quantitatively analyzed in the next section, means that anions collectively participate at the onset of the ferroelectric ground-state. In particular, its displacement from the inversion centers of the high temperature lattice is essential to break the inversion lattice symmetry and to stabilize the 3D electronic charge-pattern below .
Note that it is also expected, due to the isotropic nature of the anion cavity, an ionic contribution at which should be of the same order of magnitude as . Nevertheless, if the ionic contribution scales with the anion mobility giving rise to the anomalous thermal dependence of the lattice expansion coefficient above 100 KMdS2013 ; MdS2008 , one expects a larger ionic contribution for .
IV.2 Thermal dependence of the dielectric response
Figure 3 clearly shows that the thermal broadening of the quasi-static dielectric response of the different Fabre-salts increases upon decreasing . More quantitatively, if one defines as the full-width at half-maximum temperature range of the dielectric response, one gets / of 3%, 5.5% and 8% for the SbF6-H12, AsF6-H12 and PF6-D12 salts, respectively. Much larger / values of 0.47 and of 0.66 are obtained for PF6-H12 Sample #2 and #1, cf. Figs. 4a) and 4b), respectively.
Except for the PF6-H12, this systematic broadening effect is less apparent in measured at higher frequency for the various Fabre-salts investigated in Ref. NadMonceauJPSJ2006 . This observation indicates that , which mostly probes the anion response, is more sensitive to the structural disorder. Such observation is not surprising as the anions themselves are the source of the disorder. In order to test this assertion, the dielectric response of irradiated AsF6-H12 was similarly analyzed. Figure 6 shows that their dielectric response significantly broadens upon increasing irradiation. More quantitatively, one obtains / of 0.15 and 1.25 for AsF6-H12 irradiated 12 hours (0.035 mol% defect) and 3 days (0.2 mol% defect), respectively.
If one assumes that the / broadening is roughly proportional to the amount of defect, one estimates that PF6-H12 intrinsically contains the equivalent of 0.1 mol% defect. This is 5 times larger than the estimated amount of intrinsic defects in PF6-D12, which should contain the equivalent of 0.02 mol% defect.
The thermal divergence of at can be quantitatively analyzed by the Curie-Weiss plots of 1/ as a function of (Figs. 7a) and b)). In the mean-field approximation it is predicted that in both sides of :
with a slope ratio / of 2. The criteria employed for the Curie-Weiss analysis, depicted in Figs. 7a) and 7b), was to fix the right solid line, obtained from a mean least square fit of the raw data above , and draw the left solid line in accordance with the slope ratio in the mean-field approximation (/ = 2), as shown in Ref. Staresinic . This mean-field dependence is only observed for 1/ of the SbF6-H12. In the other Fabre-salts one observes a deviation from the linear dependence below , which increases upon going from AsF6-H12, PF6-D12 to PF6-H12. In contrast, this linear behavior is found in both sides of for 1/ reported in Refs. Monceau ; Nad2000 in SbF6-H12, AsF6-H12 and PF6-H12. However, a deviation of the linear dependence of 1/ below , similar to the one exhibited by 1/ in Fig. 7, is found in a recent reinvestigation of of AsF6-H12 Staresinic .
Figure 7 shows that the deviation from the linear dependence of 1/ below is dramatically enhanced in the 12 hours irradiated AsF6-H12 sample. Such a behavior is also visible in the measurements shown in Fig. 6. Based on such observation, one can thus ascribes the deviation from the mean-field divergence of the dielectric constant to the formation of structural disorders, regardless of their origin. A similar conclusion was achieved from the study of in AsF6-H12 Staresinic .


IV.3 Sources of disorder
Figures 2b) to 2e) give schematic illustrations of the various sources of disorder, which can be present in the Fabre-salts. As a matter of fact, recent Raman scattering investigations have detected ionized TMTTF+ and neutral TMTTF0 species in pristine SbF6-H12, AsF6-H12 and PF6-H12 Swietlik2017 , which were assigned to ferroelectric domain-walls. Since in a dimer the average charged donor is TMTTF, neutral and ionized species indicates the existence of broken dimers (Fig. 2c)). It is known that the photo-induced local chemistry caused by x-ray irradiation leads to the break of both donor and anion species Coulon2015 . This also induces molecular displacements in the surroundings of a defect. The break of a donor molecule should prevent the pairing of donors into dimers, leading to the formation of TMTTF+ species (Fig. 2d)). The break of an anion in turn will prevent the transfer of one electron from the TMTTF stack to the anion. This will provide TMTTF0 species instead of two TMTTF, which usually pair into a dimer (in Fig. 2e) there are two TMTTF0).
Another important source of disorder arise from the reversal direction of displacement of the anions. As shown in Fig. 2b), this will interchange the position of charge-rich and charge-poor donors along the stack direction. Such interchange can be viewed as the introduction of a phase shift of in the CO stack modulation Brazo . This phase shift changes the direction of the electronic polarization, introducing a ferroelectric domain-wall. As the transverse displacement of the anions fixes the longitudinal direction of the electronic polarization, and vice-versa, such defects should affect both and .
Except for the irradiated samples, where TMTTF+ and TMTTF0 defects (Figs. 2d) and 2e)) are directly created by the x-ray irradiation local chemistry, it appears that a change of direction in the uniform anion shift should be easily achieved in the pristine Fabre-salts. The presence of such defects is most likely frequent, since the anions are less mobile and begin to freeze in the methyl group cavities when the temperature is decreased. For the SbF6-H12 ( = 160 K), the ferroelectric transition occurs in the temperature range, where the presence of mobile anions is assessed by NMR Yu2004 ; Furukawa2005 together with a negative lattice thermal expansion above 80 K MdS2013 . Thus, SbF6-H12 is not expected to exhibit important disorder effects, modifying the Curie-Weiss dependence of the dielectric constant. This is not the case for the AsF6-H12 ( = 105 K) because the ferroelectric transition occurs when the anions just begin to freeze with the saturation of the negative lattice thermal expansion regime around 125 K MdS2013 ; JPP2015 . Compared to the SbF6-H12 salt, a longer tail of the dielectric response develops below in the AsF6-H12 salt. A somewhat similar observation can be done for the PF6-D12 salt ( = 86.6 K). A very drastic effect occurs in the PF6-H12 salt, since occurs below the temperature 75 K at which the anion movements freeze, according to the thermal expansion measurements reported in Refs. MdS2013 ; MdS2008 .
The thermally broadened dielectric response of PF6-H12 exhibits clear characteristics of a ferroelectric relaxor Samara2003 . First, the dielectric response is broad and does not exhibit a clear peak-like anomaly at a well-defined . Second, the maxima of depends on the frequency of the measurement Nad2000 . In the low-frequency regime, i.e. in quasi-static conditions, the maxima of occurs at 50 K Nad2000 and the maxima of occurs around 55 K and 57 K for the two samples measured in Fig. 4. All the values obtained from the maximum of are significantly lower than = 67 K obtained from local detection, i.e. from spectroscopic techniques ChowPRL2000 ; Dress . Our measurements show also that the charge response is sample dependent. A broad response with a low value of is observed in Sample #1 (Fig. 4b)), while a narrower response of a larger accompanied by several secondary peaks is observed in Sample #2 (Fig. 4a)). This behavior suggests that Sample #2 is composed of ferroelectric clusters with different . Third, one observe a global hysteresis between the heating and cooling curves (Fig. 4), and a reduction of upon successive cycling (Fig. 5). The global hysteresis point out the presence of disorder, which pins ferroelectric domains and prevents their thermal evolution. Each cycle creates defects, which limit the extent of ferroelectric domains in the subsequent cooling processes because they are not completely resorbed after the heating cycle above .
In agreement with the observation of a slowing down of the mean-relaxation time at Staresinic , it takes a long time to establish the long-range thermodynamic ferroelectric order. Thus, the slow kinetics associated with the anion displacement process limit the ferroelectric ordering process. Then, the difficulties to achieve the long-range uniform anion shift should be taken as responsible for the fragmentation of the ferroelectric order into domains. If one assumes that PF6-H12 contains 0.1 mol defect, there is one defect every 1000 TMTTF molecules or every 500 unit cells (there are two TMTTF per unit cell). If one defect pins one ferroelectric domain, the average volume of the domain should be of (3.5 105) . This volume is close to the average volume of the CO domain, namely (8.7 105) , estimated for irradiated (TMTTF) Coulon2015 from the defect concentration at which the singular decay of conductivity at the CO transition vanishes. If the ferroelectric domains pinned on defects are isotropic, its average size is about 70 Å.
V Conclusion
We have measured the quasi-static transverse dielectric constant of the Fabre-salts allowing to probe the ionic charge response, which is the lattice counterpart of the electronic ferroelectricity associated with the CO transition. Measurements along the direction give directly access to the counter-anion response, which is a key ingredient to choose and to stabilize the 3D long-range order below . Our measurements, conjugated with earlier investigations of the lattice thermal expansion, show that the dielectric response is thermally broaden below if the transition occurs in the temperature range where the anion movement begin to freeze in the methyl group cavities. In the case of PF6-H12, where occurs in the freezing regime, a relaxor-type ferroelectricity is observed. For the latter, because of the slow kinetics of the anion sub-lattice, global hysteresis effects and reduction of the charge response upon successive thermal cycling is observed. Finally, measurements of x-ray irradiated AsF6-H12 show that irradiations damages change the well-defined dielectric response of the pristine salts into a relaxor one. In this context, we have proposed that anions control the order-disorder or relaxation character of the ferroelectric transition of the Fabre-salts.
VI Acknowledgements
M. de S. acknowledges financial support from the São Paulo Research Foundation – Fapesp (Grants No. 2011/22050-4), National Council of Technological and Scientific Development – CNPq (Grants No. 305472/2014-3) and CAPES for granting the M. Sc. scholarships for L. S. and C. S..
References
- [1] Physics of Organic Conductors and Superconductors, edited by A.G. Lebed, Springer Series in Materials Sciences (Springer-Verlag, Berlin, Heidelberg, 2008), Vol. 110.
- [2] M. Dressel, Naturwissenschaften 94, 527 (2007).
- [3] M. de Souza and J.-P. Pouget, J. Phys.: Condens. Matter 25, 343201 (2013).
- [4] S. Tomic and M. Dressel, Rep. Prog. Phys. 78, 096501 (2015).
- [5] P. Lunkenheimer and A. Loidl, J. Phys.: Condens. Matter 27, 373001 (2015).
- [6] Sumio Ishihara, J. Phys.: Condens. Matter 26, 493201 (2014).
- [7] S. Brazovskii in Ref. [1] p. 313.
- [8] S. Brazovskii, J. Phys. IV France 12, Pr9-149 (2002).
- [9] S. Brazovskii, Synth. Metals 133-134, 301 (2003).
- [10] P. Monceau, F. Ya Nad, S. Brazovskii, Phys. Rev. Lett. 86, 4080 (2001).
- [11] J.-P. Pouget and S. Ravy, J. Phys. I France 6, 1501 (1996).
- [12] D. S. Chow, F. Zamborszky, B. Alavi, D. J. Tantillo, A. Baur, C. A. Merlic, and S. E. Brown, Phys. Rev. Lett. 85, 1698 (2000).
- [13] M. Dumm, B. Salameh, M. Abaker, L. K. Montgomery, and M. Dressel,J. Phys. IV (France) 114, 57 (2004).
- [14] C. Bourbonnais and D. Jérome in Ref. [1] p. 357.
- [15] J.-P. Pouget, Physica B 407, 1762 (2012).
- [16] J.-P. Pouget, Physica B 460, 45 (2015).
- [17] F. Nad and P. Monceau, J. Phys. Soc. Japan 75, 051005 (2006).
- [18] D. Starešinić, K. Biljaković, P. Lunkenheimer and A. Loidl, Solid State Commun. 137, 241 (2006).
- [19] S. Yasin, B. Salameh, E. Rose, M. Dumm, H.-A. Krug von Nidda, A. Loidl, M. Ozerov, G. Untereiner, L. Montgomery, and M. Dressel, Physical Review B 85, 144428 (2012).
- [20] R. Laversanne, C. Coulon, B. Gallois, J. P. Pouget, and R. Moret, J. Phys. (Paris) Lett. 45, L393 (1984).
- [21] J.-P. Pouget, Crystals 2, 466 (2012).
- [22] K. Medjanik, M. de Souza, D. Kutnyakhov, A. Gloskovskii, J. Muller, M. Lang, J.-P. Pouget, P. Foury-Leylekian, A. Moradpour, H.-J. Elmers, et al. Eur. Phys. J. B 87, 256 (2014).
- [23] K. Medjanik, A. Chernenkaya, S. A. Nepijko, G. Ohrwall, P. Foury-Leylekian, P. Alemany, E. Canadell, G. Schonhense, J.-P. Pouget, Phys. Chem. Chem. Phys. 17, 19202 (2015).
- [24] P. Foury-Leylekian, S. Petit, G. Andre, A. Moradpour and J.-P. Pouget, Physica B 405, S95 (2010).
- [25] S. Kitou, T. Fujii, T. Kawamoto, N. katayama, S. Maki, E. Nishibori, K. Sugimoto, M. Takata, T. Nakamura and H. Sawa, Phys. Rev. Lett. 119, 065701 (2017).
- [26] M. de Souza, P. Foury-Leylekian, A. Moradpour, J.-P. Pouget and M. Lang, Phys. Rev. Lett. 101, 216403 (2008).
- [27] F. Nad, P. Monceau, C. Carcel, J. M. Fabre, Phys. Rev. B 62, 1753 (2000).
- [28] C. Coulon, G. Lalet, J.-P. Pouget, P. Foury-Leylekian, A. Moradpour and J. M. Fabre, Phys. Rev. B 76, 085126 (2007).
- [29] C. Coulon, P. Foury-Leylekian, J. M. Fabre and J.-P. Pouget, Eur. Phys. J. B 88, 85 (2015).
- [30] A. Langlois, M. Poirier, C. Bourbonnais, P. Foury-Leylekian, A. Moradpour and J.-P. Pouget, Phys. Rev. B 81, 125101 (2010).
- [31] B. Khler, E. Rose, M. Dumm, G. Untereiner, and M. Dressel, Phys. Rev. B 84, 035124 (2011).
- [32] W. Yu, F. Zhang, F. Zamborszky, B. Alavi, A. Baur, C. A. Merlic, and S. E. Brown, Phys. Rev. B 70, 121101(R) (2004).
- [33] M. Dressel, M. Dumm, T. Knoblauch, M. Masino, Crystals 2, 528 (2012).
- [34] K. Furukawa, T. Hara, and T. Nakamura, J. Phys. Soc. Jpn. 74, 3288 (2005).
- [35] R. Świetlik, B. Barszcz, A. Pustogow, M. Dressel, Phys. Rev. B 95, 085205 (2017).
- [36] G. A. Samara, J. Phys.: Condens. Matter 15, R367 (2003).