A new distribution for multiplicities in leptonic and hadronic collisions at high energies
Abstract
Charged particles production in the , and collisions in full phase space as well as in the restricted phase space slices, at high energies are described with predictions from shifted Gompertz distribution, a model of adoption of innovations. The distribution has been extensively used in diffusion theory, social networks and forecasting. A two-component model in which PDF is obtained from the superposition of two shifted Gompertz distributions has been introduced to improve the fitting of the experimental distributions by several orders. The two-components correspond to the two subgroups of a data set, one representing the soft interactions and the other semi-hard interactions. Mixing is done by appropriately assigning weights to each subgroup. Our first attempt to analyse the data with shifted Gompertz distribution has produced extremely good results. It is suggested that the distribution may be included in the host of distributions more often used for the multiplicity analyses.
keywords:
Charged multiplicities, Probability Distribution Functions, scaling violation1 Introduction
The shifted Gompertz distribution was introduced by Bemmaor [1] in 1994 as a model of adoption of innovations. It is the distribution of the largest of two independent random variables one of which has an exponential distribution with parameter and the other has a Gumbel distribution, also known as log-Weibull distribtion, with parameters and . Several of its statistical properties have been studied by Jiménez and Jodrá [2] and Jiménez Torres [3]. In machine learning, the Gumbel distribution is also used to generate samples from the generalised Benoulli distribution, which is a discrete probability distribution that describes the possible results of a random variable that can take on one of the K-possible elementary events, with the probability of each elementary event separately specified. The shifted Gompertz distribution has mostly been used in the market research and diffusion theory, social networks and forecasting. It has also been used to predict the growth and decline of social networks, on-line services and shown to be superior to the Bass model and Weibull distribution [4]. It is interesting to study the statistical phenomena in high energy physics in terms of this distribution. Recently, Weibull distribution has been used to understand the multiplicity distributions in various particle-particle collisions at high energies and more recently [5] to explain LHC data. Weibull models studied in the literature were appropriate for modelling a continuous random variable which assumes that the variable takes on real values over the interval [0, ]. In situations where the observed data values are very large, a continuous distribution is considered an adequate model for the discrete random variable, for example in case of a particle collider, the luminosity during a fill decreases roughly exponentially. Therefore, the mean collision rate will likewise decrease. That decrease will be reflected in the number of observed particles per unit time. In the same way a photon detector that counts photons in a continuous train of time bins. If the photons are anti-bunched in time, that is, they tend to be separated from each other, one will get a different distribution of photon counts than if the photons are bunched, that is, bunched together in time. By analyzing the photon counting statistics one can infer information about the continuous underlying distribution of the temporal spacing of photons. The shifted Gompertz distribution with non-negative fit parameters identified with the scale and shape parameters, can in this way be used for studying the distributions of particles produced in collisions at accelerators. One of the studies in statistics is when the variables take on discrete values. The idea was first introduced by Nakagawa and Osaki [6], as they introduced discrete Weibull distribution with two shape parameters and where and . Models which assume only non-negative integer values for modelling discrete random variables, are useful for modelling the kind of problems mentioned above.
The charged-particle multiplicity is one of the simplest observables in collisions of high energy particles, yet it imposes important constraints on the dynamics of particle production. The particle production has been studied in terms of several theoretical, phenomenological and statistical models. Each of these models has been reasonably successful in explaining the results from different experiments and useful for extrapolations to make predictions. Although Weibull distribution has been studied recently, no attempt has been made so far to analyze the high energy collision data in terms of shifted Gompertz distribution. Our first attempt to analyse the data produced good results and encouraged us for a comprehensive analysis.
The aim of the present work is to introduce a statistical distribution, the shifted Gompertz distribution to investigate the multiplicity distributions of charged particles produced in , and collisions at different center of mass energies in full phase space as well as in restricted phase space windows. Energy-momentum conservation strongly influences the multiplicity distribution for the full phase space. The distribution in restricted rapidity window however, is less prone to such constraints and thus can be expected to be a more sensitive probe to the underlying dynamics of QCD, as inferred in references [7, 8].
In Section II, details of Probability Distribution Function (PDF) of the shifted Gompertz distribution is discussed. For collisions a two component model has been used and modification of distributions done in terms of these two components; one from soft events and another from semi-hard events. Superposition of distributions from these two components, by using appropriate weights is done to build the full multiplicity distribution. When multiplicity distrbution is fitted with the weighted superposition of two shifted Gompertz distributions, we find that the agreement between data and the model improves considerably. The fraction of soft events, for various energies have been taken from references [9, 10] which use the clustering algorithm, the most extensively used algorithm for LEP data analyses. The corresponding fractions for and are not available in different rapidity bins. For data at all energies under study, the values for full phse space are taken from reference [11]. We also tried to fit the multiplicity distribution to find the best fit alpha value. It is found that, the fit values agree very closely with values obtained from reference [11]. We thus fitted distributions in restricted rapidity windows for and data in terms of soft and semi-hard components to get the best fit values.
In a recent publication, Wilk and Wĺodarczyk [12] have developed a method of retrieving additional information from the multiplicity distributions. They propose, in case of a conventional Negative Binomial Distribution fit [11], to make the parameters dependent on the multiplicity in place of having a 2-component model. They demonstrated that the additional valuable information from the MDs, namely the oscillatory behaviour of the counting statistics can be derived. In a future extension of the present work, we shall analyse the shifted Gompertz distribution, using the approach proposed and described by the authors [12].
Section III presents the analysis of experimental data and the results obtained by the two approaches. Discussion and conclusion are presented in Section IV.
2 Shifted Gompertz distribution
The dynamics of hadron production can be probed using the charged particle multiplicity distribution. Measurements of multiplicity distributions provide relevant constraints for particle-production models. Charged particle multiplicity is defined as the average number of charged particles, produced in a collision . Hadron production depends upon the center of mass energy available for particle production nearly independent of the types of particles undergoing collisions. Subsequently, it is the fragmentation of quarks and gluons which produce hadrons non-perturbatively. Thus the same PDFs can be used to describe behaviour of multiplicity distributions. In numerous works in the past, the most popular Negative Binomial Distribution has been successfully used for a wide variety of collisions [13]. Universality of multiparticle production in , and have been discussed in several papers, a detailed paper amongst these is [14].
We briefly outline the probability density function (PDF) of the shifted Gompertz distribution used for studying the multiplicity distributions. Equation (1-3) define the PDF and the mean value of the distribution;
| (1) |
Mean of the distribution is given by
| (2) |
and
| (3) |
Where is a scale parameter and is a shape parameter. Similar to the Weibull distribution, shifted Gompertz distributions is also a two parameter distribution, in terms of its shape and scale.
2.1 Two-Component Approach
It is well established that at high energies, charged particle multiplicity distribution in full phase space becomes broader than a Poisson distribution. This behaviour has been successfully described by a two parameters negative binomial (NB) distribution defined by;
| (4) |
where is related to the dispersion by
| (5) |
parameter of the distribution is negative in the lower energy domain where the distribution is binomial like. is positive in the higher energy domain and the distribution is truly NB, the two particle correlations dominate and is closely related to the integral over full phase space of the two particle correlation function. NB distribution was very successful until the results from UA5 collaboration [15] showed a shoulder structure in the multiplicity distribution on collisions. To expain this NB regularity violations, C. Fuglesang [16], suggested the violations as the effect of the weighted superposition of soft events (events without mini-jets) and semi-hard events (events with mini-jets), the weight being the fraction of soft events. The multiplicity distribution of each component being NB. This idea was successfully implemented in several analyses at high energies to fit the multiplicity distributions with superposed NB functions.
Adopting this suggestion for the multiplicity distributions in , and collisions at high energies, we have used a superposition of two shifted Gompertz components. The two components are interpreted as soft and hard components, as explained above. The Multiplicity distribution is produced by adding weighted superposition of multiplicity in soft events and multiplicity distribution in semi-hard events. This approach combines two classes of events, not two different particle-production mechanisms in the same event. Therefore, no interference terms are needed to be introduced. The final distribution is the sum of the two independent distributions, henceforth called modifed shifted Gompertz distribuion.
| (6) |
In this approach, the multiplicity distribution depends on five parameters as given below;
| (7) |
As described by A. Giovannini et al [11], that the superimposed physical substructures in the cases of annihilation and hadron-hadron interactions, are different, the weighted superposition mechanism is the same.
3 The Data
The data from different experiments and three collision types are considered;
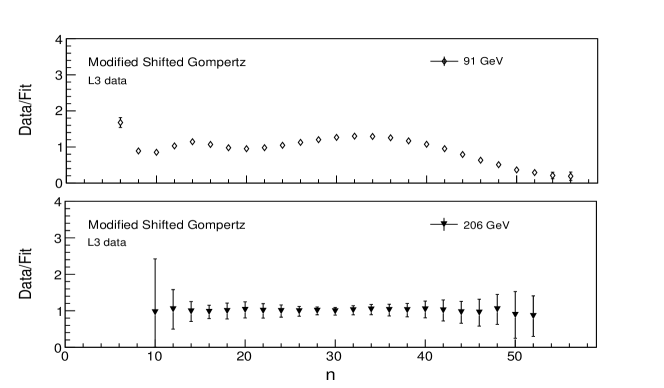
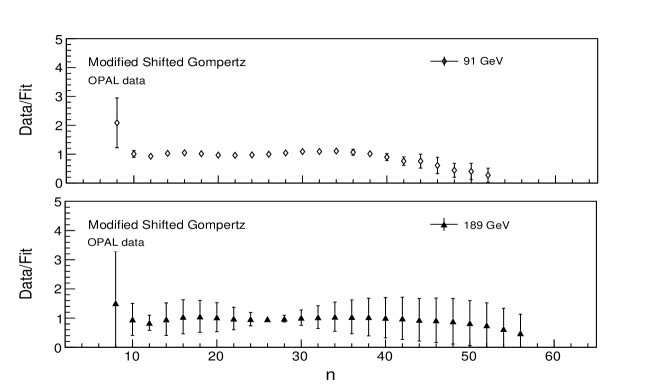
i) annihilations at different collision energies, from 91 GeV up to the highest energy of 206.2 GeV at LEP2, from two experiments L3 [17] and OPAL [18, 19, 20, 21] are analysed.
ii) collisions at LHC energies from 900 GeV, 2360 GeV and 7000 GeV [22] are analysed in five restricted rapidity windows, = 0.5, 1.0, 1.5, 2.0 and 2.4.
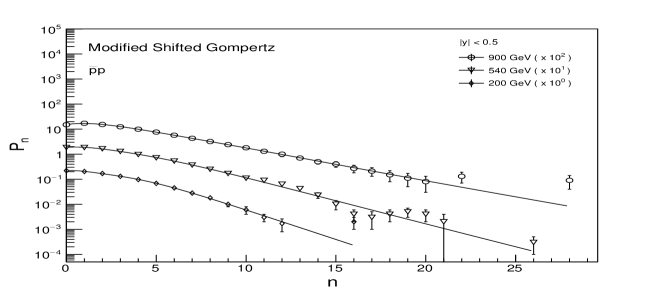
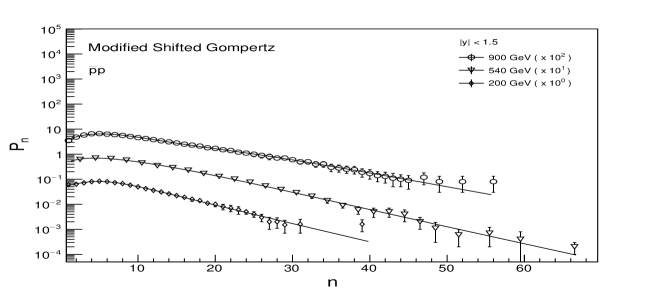
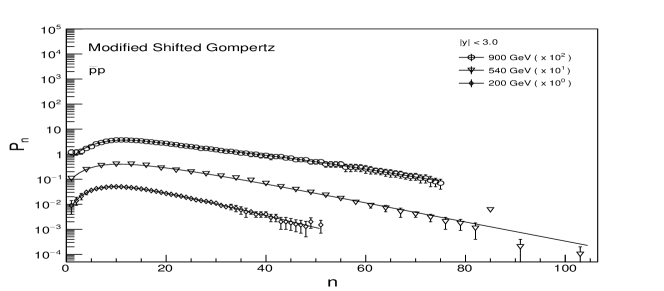
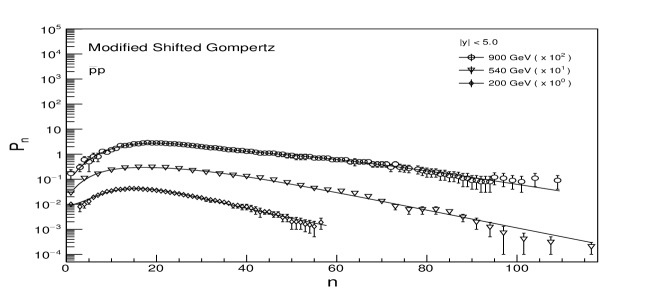
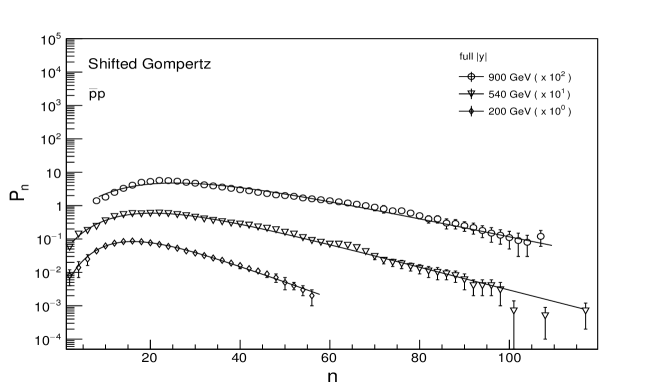
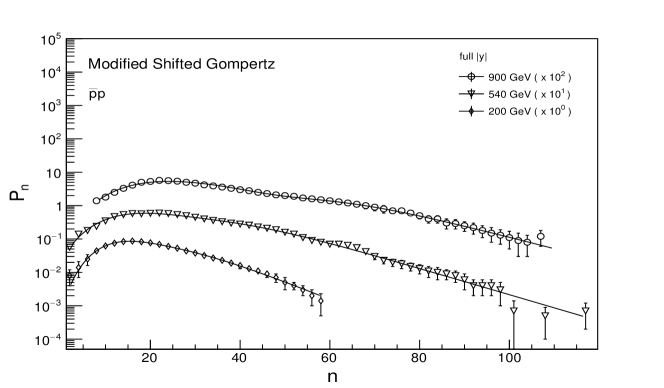
iii) collisions at energies from 200 GeV, 540 GeV and 900 GeV [15, 23] are analysed in full phase space as well as in restricted rapidity windows, = 0.5, 1.5, 3.0 and 5.0.
3.1 Results and discussion
The PDF defined by equations (1,6) are used to fit the experimental data. Figures 1-2 show the shifted Gompertz function and the modified (two-component)shifted Gompertz function fits to the data from L3 and OPAL experiments. Parameters of the fits, and the p-values are documented in Table I. Figure 3 shows the ratio of data over modified shifted Gompertz fit plots for collisions at two energies. The plots correspond to the worst and the best fits depending upon the maximum and minimum values and show that fluctuations between the data and the fits are acceptably small, as the ratio is nearly one.
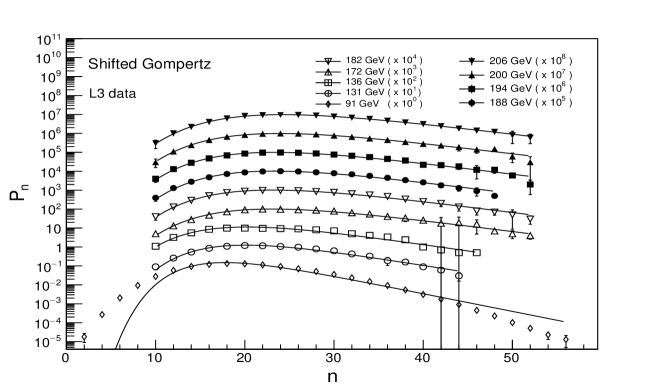
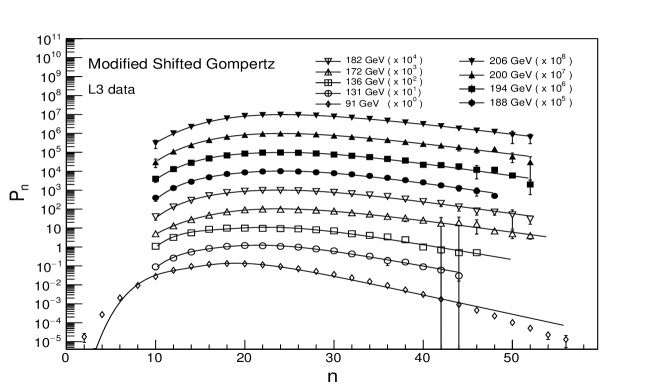
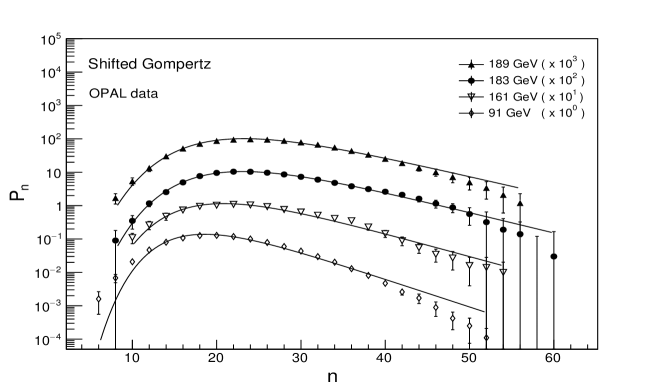
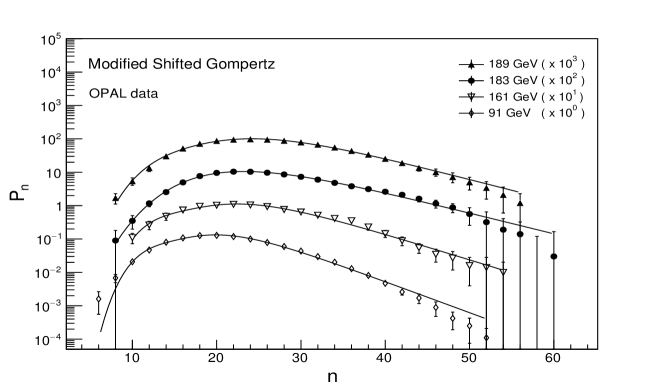
shifted Gompertz Modified shifted Gompertz Energy b p value b1 b2 p value (GeV) OPAL 91 0.191 0.001 33.920 1.133 190.90/21 0.0001 0.213 0.003 91.100 7.541 0.265 0.012 46.890 8.189 0.657 51.88/19 0.0001 161 0.159 0.004 26.590 3.120 16.72/20 0.6711 0.178 0.008 67.240 16.290 0.244 0.040 45.310 24.960 0.716 7.13/18 0.9890 183 0.142 0.003 25.370 1.773 7.49/24 0.9995 0.145 0.010 30.810 6.324 0.143 0.039 20.470 9.522 0.675 7.06/22 0.9989 189 0.135 0.002 21.930 1.265 22.62/22 0.4234 0.149 0.005 47.490 8.789 0.177 0.017 25.960 6.152 0.662 8.68/20 0.9863 L3 91 0.215 0.001 45.170 0.563 3989.00/25 0.0001 0.234 0.001 103.100 1.989 0.244 0.003 28.330 0.870 0.651 1094.00/23 0.0001 131 0.173 0.004 31.430 3.157 12.66/15 0.6285 0.194 0.009 87.480 27.270 0.242 0.031 50.250 21.510 0.654 5.32/13 0.9675 136 0.157 0.004 23.140 2.185 27.42/16 0.0370 0.183 0.009 82.870 25.990 0.258 0.025 56.730 19.510 0.657 19.73/14 0.1389 172 0.138 0.003 22.760 1.427 4.82/19 0.9996 0.146 0.008 36.660 12.880 0.169 0.055 22.680 16.590 0.767 2.61/17 1.0000 182 0.138 0.003 23.120 1.469 8.07/19 0.9860 0.148 0.008 46.180 12.560 0.192 0.023 35.170 11.900 0.668 5.25/17 0.9970 188 0.138 0.002 23.860 1.179 26.16/17 0.0716 0.156 0.006 58.890 10.230 0.199 0.016 38.780 9.268 0.670 10.77/15 0.7687 194 0.136 0.003 22.900 1.479 11.83/19 0.8928 0.149 0.008 25.140 3.422 0.164 0.016 114.500 67.31 0.772 6.59/17 0.9883 200 0.132 0.003 22.220 1.356 3.96/19 0.9999 0.134 0.009 29.340 12.030 0.169 0.059 26.260 17.710 0.779 3.73/17 0.9997 206 0.129 0.003 22.320 1.233 1.42/19 1.0000 0.135 0.013 25.170 5.682 0.114 0.050 14.700 12.630 0.790 1.32/17 1.0000
Shifted Gompertz Modified shifted Gompertz Energy b p value b1 b2 p value (GeV) 200 0.5 0.455 0.013 0.652 0.061 11.66/11 0.3897 0.518 0.041 0.584 0.105 0.572 0.061 8.898 4.092 0.850 3.79/9 0.9247 200 1.5 0.194 0.005 1.570 0.099 9.11/29 0.9998 0.171 0.007 1.064 0.127 0.338 0.052 6.284 2.489 0.812 5.39/27 1.0000 200 3.0 0.123 0.003 2.606 0.179 12.60/47 1.0000 0.159 0.010 3.455 0.332 0.108 0.015 9.180 5.148 0.800 2.98/45 1.0000 200 5.0 0.101 0.002 3.381 0.175 35.33/52 0.9628 0.133 0.013 4.921 0.774 0.097 0.016 10.430 7.851 0.760 3.48/46 1.0000 200 full 0.111 0.003 5.033 0.353 3.96/25 1.0000 0.107 0.004 4.830 0.641 0.197 0.054 15.400 12.430 0.900 4.59/26 1.0000 540 0.5 0.397 0.005 0.682 0.033 26.90/20 0.1381 0.490 0.029 0.674 0.074 0.407 0.019 5.363 1.598 0.810 21.29/18 0.2650 540 1.5 0.162 0.002 1.387 0.049 17.22/26 0.0370 0.224 0.012 1.504 0.109 0.155 0.006 5.071 1.088 0.700 11.04/24 0.9887 540 3.0 0.097 0.001 2.308 0.055 176.40/28 0.0001 0.089 0.003 3.070 0.389 0.158 0.008 2.794 0.205 0.640 21.29/23 0.5634 540 5.0 0.080 0.001 3.489 0.069 69.33/33 0.0002 0.081 0.001 7.072 0.566 0.126 0.005 3.579 0.165 0.580 48.50/31 0.0236 540 full 0.079 0.001 4.088 0.094 59.83/49 0.0226 0.079 0.002 5.932 0.649 0.116 0.012 3.633 0.345 0.730 58.97/47 0.1130 900 0.5 0.327 0.008 0.616 0.063 10.16/20 0.9652 0.431 0.033 0.798 0.116 0.284 0.041 4.561 2.874 0.845 5.13/18 0.9986 900 1.5 0.129 0.003 1.083 0.087 35.85/46 0.8593 0.191 0.007 1.834 0.155 0.127 0.011 12.530 3.698 0.841 5.77/44 1.0000 900 3.0 0.076 0.002 1.834 0.103 59.90/71 0.8234 0.129 0.005 3.256 0.274 0.075 0.004 10.320 2.117 0.725 8.01/69 1.0000 900 5.0 0.063 0.001 3.226 0.125 89.95/95 0.6272 0.104 0.004 5.355 0.492 0.057 0.003 10.370 2.132 0.660 17.98/93 1.0000 900 full 0.063 0.001 4.043 0.195 67.16/47 0.0283 0.101 0.003 7.852 0.618 0.061 0.003 18.170 3.879 0.710 13.46/45 1.0000
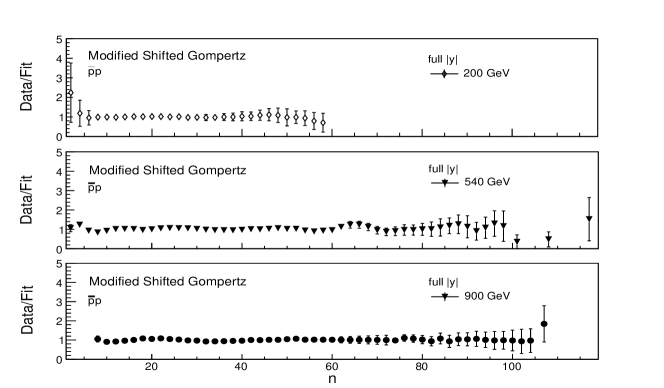
Figure 4 shows the modified shifted Gompertz distribution, equation (6) fitted to the data at energies from 200 GeV to 900 GeV in four rapidity windows. To avoid cluttering of figures, the plots for shifted Gompertz are not shown. Figure 5 shows the shifted Gompertz and modified shifted Gompertz distributions, fitted to the collisions in full phase space for the same energies. The comparison can be seen from the parameters of the fits, and the p-values documented in Table II. Figure 6 shows the ratio plots of the data over modified shifted Gompertz fit for collisions at different energies in full phase space. The plots show acceptable fluctuations with the ratio values around unity.
Shifted Gompertz Modified Shifted Gompertz Energy b p value b1 b2 p value (GeV) 900 0.5 0.320 0.005 0.719 0.113 3.57/19 1.0000 0.327 0.007 1.250 0.243 0.949 0.370 1.259 2.089 0.840 2.24/17 1.0000 900 1.0 0.193 0.002 1.307 0.109 84.97/36 0.0001 0.198 0.002 2.260 0.159 0.667 0.079 3.366 1.286 0.810 63.32/34 0.0017 900 1.5 0.131 0.001 1.320 0.092 66.98/48 0.0364 0.136 0.002 2.553 0.169 0.397 0.036 3.114 0.866 0.760 44.22/46 0.5471 900 2.0 0.101 0.001 1.431 0.084 55.41/58 0.5722 0.104 0.001 2.660 0.169 0.283 0.024 3.123 0.756 0.750 33.43/56 0.9928 900 2.4 0.087 0.001 1.585 0.081 72.26/64 0.2239 0.088 0.001 2.662 0.162 0.250 0.021 3.816 1.020 0.780 48.03/62 0.9036 2360 0.5 0.242 0.005 0.516 0.099 8.13/19 0.9853 0.424 0.042 1.148 0.433 0.253 0.011 5.447 1.320 0.720 5.70/17 0.9950 2360 1.0 0.133 0.002 0.700 0.091 24.30/34 0.8904 0.139 0.003 2.472 0.270 0.352 0.033 1.823 0.550 0.620 14.03/32 0.9975 2360 1.5 0.092 0.002 0.819 0.090 28.08/45 0.9773 0.099 0.002 3.089 0.303 0.249 0.019 2.195 0.499 0.590 10.03/43 1.0000 2360 2.0 0.071 0.001 0.917 0.088 39.83/55 0.9383 0.076 0.002 3.342 0.321 0.190 0.013 2.526 0.487 0.580 12.70/53 1.0000 2360 2.4 0.062 0.001 1.122 0.089 59.55/66 0.6993 0.137 0.006 2.699 0.379 0.070 0.002 8.042 0.832 0.610 14.49/64 1.0000 7000 0.5 0.184 0.002 0.580 0.073 117.50/37 0.0001 0.387 0.013 1.376 0.248 0.202 0.003 7.402 0.599 0.710 24.08/35 0.9178 7000 1.0 0.101 0.001 0.846 0.068 223.70/66 0.0001 0.229 0.007 1.778 0.250 0.110 0.001 6.826 0.409 0.650 48.85/64 0.9195 7000 1.5 0.068 0.001 0.854 0.062 247.90/88 0.0001 0.192 0.006 2.419 0.336 0.074 0.001 4.459 0.241 0.520 60.87/86 0.9817 7000 2.0 0.049 0.001 0.667 0.053 164.60/108 0.0004 0.136 0.005 2.111 0.276 0.055 0.001 4.306 0.229 0.530 27.79/106 1.0000 7000 2.4 0.042 0.001 0.693 0.051 179.70/123 0.0007 0.046 0.001 3.871 0.195 0.122 0.004 2.396 0.304 0.510 30.92/121 1.0000
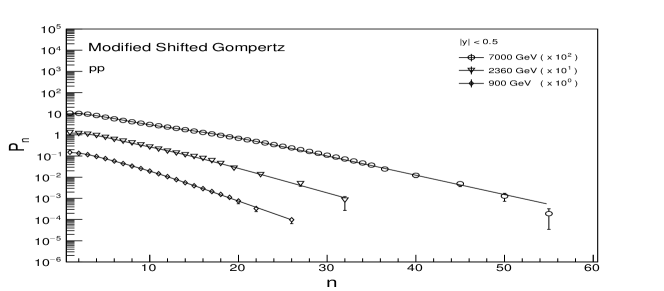
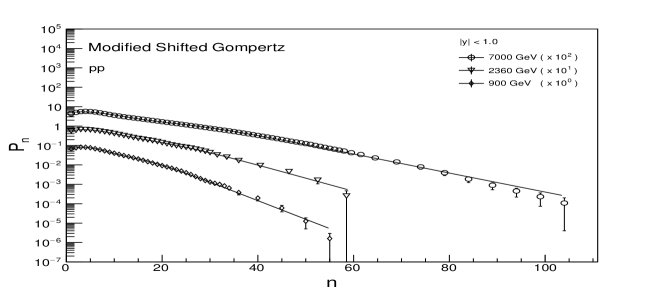
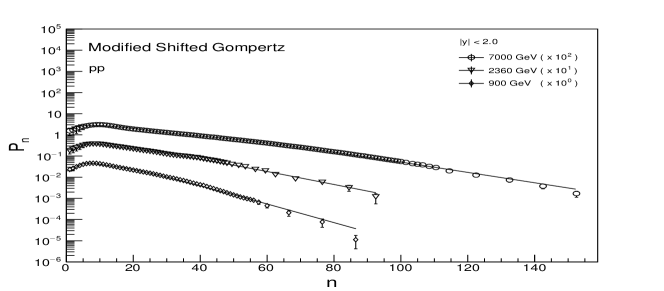
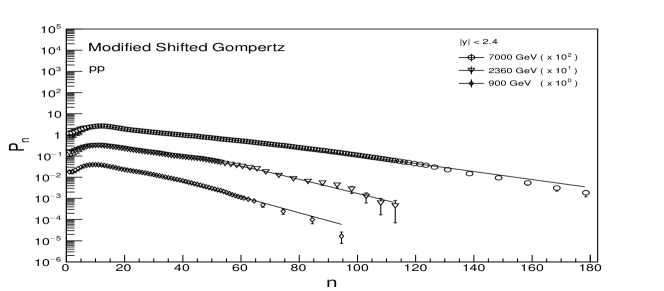
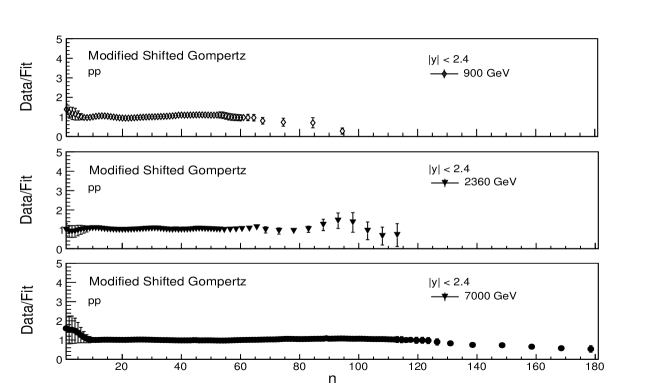
Figure 7 shows the modified shifted Gompertz distribution, equation (6) fitted to the collisions at LHC energies from 900 GeV to 7000 GeV in four rapidity windows. Again for restricting the number of figures, only the modified distributions are shown. Comparison between the two types of distributions can be seen from the parameters of the fits, and the p-values documented in Table III. Figure 8 shows the ratio plots of data over modified shifted Gompertz fit for the collisions at different energies in full phase space. The plots show acceptable fluctuations with the ratio values around unity.
Comparison of the fits and the parameters shows that overall shifted Gompertz distribution is able to reproduce the data at most of the collision energies in full phase space as well as in the restricted rapidity windows for , and collisions. It does fail and is excluded statistically for some energies where p-value is , in particular for 540 GeV data for some rapidity intervals and for LHC data at the highest energy of 7000 GeV. However, comparison of the fits and the parameters from the (two-component) modified shifted Gompertz distribution shows that though the data are very well reproduced in full phase space as well as in all rapidity intervals for all collision energies in , and collisions, the distribution does fail for the collisions at 91 GeV. The value in each case reduces enormously, when modified shifted Gompertz fit is used. In each case the fit is accepted with p-value .
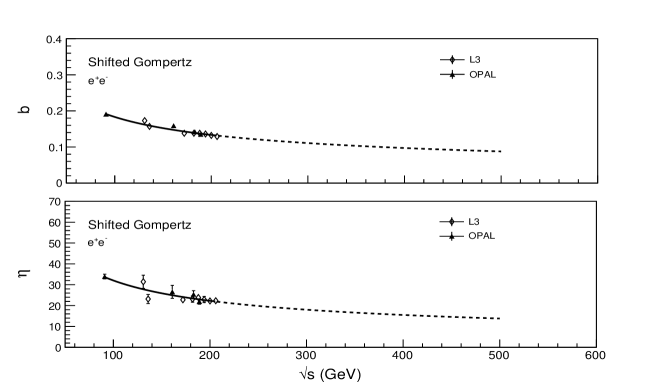
For shifted Gompertz distribution, the scale parameter and the shape parameter values are plotted in figure 9 for interactions for LEP data from L3 and OPAL experiments. A power law is fitted to the data. It is observed that both and values decrease with increase in collision energy and are parametrised as;
| (8) |
| (9) |
For minimisation of for the fits, CERN library MINUIT2 has been used. In case of modified shifted Gompertz, the fit parameters are doubled while introducing the modification. This causes large error limits on the parameters resulting in the very large values, particularly close to 1. In addition, the LEP data for collisions suffer from very small sample size at some energies, thereby adding to the errors on the fit parameters.
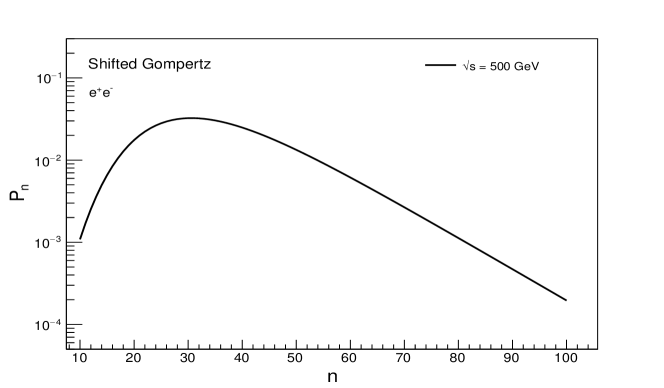
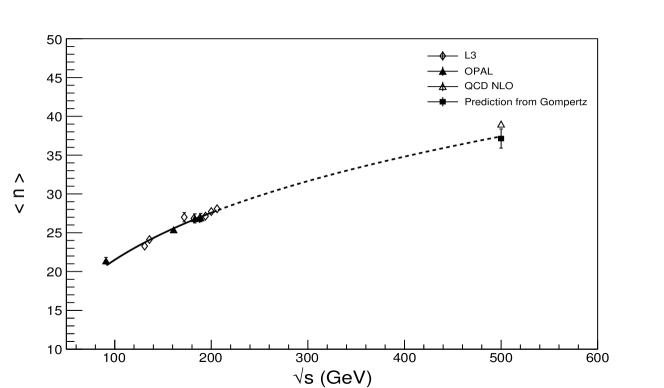
Using shifted Gompertz distribution, the multiplicity distribution for 500 GeV collisions at a future Collider is predicted, as shown in figure 10. The value of mean multiplicity is predicted to be the 37.14 1.12. Figure 11 shows the dependence of mean multiplicity from experimental data on energy . The fitted curve in equation (10) represents Fermi-Landau model [24, 25] and fits the data reasonably well with = -10.609 2.003 and = 10.156 0.561
| (10) |
It may be observed that the value of predicted from shifted Gompertz distribution at 500 GeV fits well on the curve, as shown in the figure 11. A parameterization of the multiplicity data in collisions at the next-to-leading-order QCD was done by D.E. Groom et al [26, 14] and is given in equation (9) of the reference:
| (11) |
where and are constants and is defined in equation (9.4b). The versus dependence was shown in reference [27]. Parameters and were fitted to the experimental data and a very good agreement was shown. It is observed that both formulae, equations (10, 11), provide excellent extrapolations for . The mean multiplicity at 500 GeV is predicted to be 39.18 by NLO QCD equation. In the present work, the mean value predicted by the shifted Gompertz distribution as 37.14 1.23 agrees very closely with the value derived from NLO QCD. This is good test of the validity of the proposed distribution.
An interesting description of universality of multiplicity in and has been discussed by Grosse-Oetringhaus et al [14]. It is shown that although the multiplicity distributions differ between and collisions, their average multiplicities as a function of show similar trends that can be unified using the concepts of effective energy and inelasticity. It is also shown that the Fermi-Landau form fails to describe the multiplicity data. But the data is well described by . The universality appears to be valid at least up to Tevatron energies. The multiplicities in and collisions become strikingly similar when the effective energy in collisions, available for particle production is used.
| (12) |
where is the energy of the leading particle and the inelasticity is defined as . is estimated in collisions by comparing with collisions. Given a parameterization of the dependence of the charged multiplicity in collisions, one can fit the data with
| (13) |
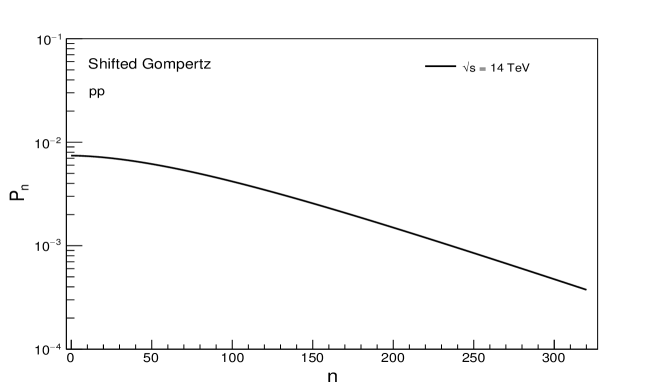
The parameter corresponds to the contribution from the two leading protons to the total multiplicity and is expected to be close to =2. One can use this fit of data to predict the multiplicities at the LHC. As described in reference [14], using a fit with equation(13), Jan Fiete Grosse-Oetringhaus et al have estimated = 0.35 0.01 and = 2.2 0.19. Under the assumptions that inelasticity remains constant at about 0.35 at LHC energies and that the extrapolation of the data with the QCD form is still reliable, authors fit the data to predict the multiplicities at the LHC. They find =88.9. We use these values of inelasticity and average multiplicity to build the multiplicity distribution at =14 TeV using shifted Gompertz function.
Figure 12 shows the multiplicity distribution predicted from shifted Gompertz PDF for collisions at = 14 TeV at LHC. The mean value of the multiplicity is predicted to be 89.2. It is observed that in general, at all energies for different types of collisions, the multiplicity distributions can be described by shifted Gompertz function. However the LHC data at 7000 GeV in the lower rapidity windows are an exception, whereby the fits are statistically excluded with . At all energies, both the scale parameter and the shape parameter decrease with the collision energy in the center of momentum. In the rapidity windows, decreases with the increase in the rapidity. The shape parameter increases with rapidity as it determines the width of the distribution.
The fact that multiplicity distributions at higher energies show a shoulder structure is well established. In order to improve upon shifted Gompertz fits to the data, the multiplicity distribution is reproduced by a weighted superposition of two shifted Gompertz distributions corresponding to the soft component and the semi-hard component. It is observed that this modified shifted Gompertz distribution improves the fits excellently and the values diminish by several orders. However, distributions fail for 91 GeV data.
The data for collisions at 7 TeV fail for shifted Gompertz distribution in three rapidity windows. But the modified shifted Gompertz distribution shows a very good agreement with the data for all rapidities, as shown in table III. For each of the rapidity bins, /dof values are reduced manifold with .
Using the shifted Gompertz function and the analysis, the multiplicity distributions at future collider and the mean multiplicity predicted for 500 GeV , agrees very well with the predictions from NLO QCD prediction and also with the Fermi-Landau model of particle production.
4 Conclusion
The aim of this paper is to propose the use of a new statistical distribution for studying the multiplicity distributions in high energy collisions; shifted Gompertz distribution function often used in model of adoption of innovations, describes the multiplicity data extremely well. A detailed analysis of data from , and collisions at high energies in terms of shifted Gompertz distribution shows that, in general the distribution fits the data very well at most of the energies and in various rapidity intervals with the exception of a very few. Very similar to the Weibull distribution, which recently has been extensively used, it determines two non-negative parameters measuring the scale and shape of the distribution. A power law dependence of the scale parameter and shape parameter on the collision energy is established for the data. The parametrisation as a power law is inspired by the observation that single particle energy distribution obeys a power law behaviour.
The occurrence of a shoulder structure in the multiplicity distribution (MD) of charged particles at high energy is well established. This affects the shape of the distribution fit. To improve upon the fits to the data, a weighted superposition of the distributions using shifted Gompertz function for the soft events (events with mini-jets) and the semi-hard events (events without mini-jets) is done. The concept of superposition originates from purely phenomenological and very simple considerations. The two fragments of the distribution suggest the presence of the substructure. The two-component shifted Gompertz distribution fits the data from different types of collisions at different energies, extremely well. Describing the MD in terms of soft and semi-hard components, allows one to model, under simple assumptions the new energy domain. While predicting the multiplicity distribution using shifted Gompertz Distribution at 14 TeV, it remains interesting to determine the dependence of fraction of minijet events, upon the rapidity windows compared to the events without mini-jets. To predict the more accurate multiplicity distributions in different rapidity windows at 14 TeV, modified shifted Gompertz PDF is required, for which value in each rapidity window is needed. The analysis presented for 7 TeV data shows that the minijet fraction of events decreases with energy as well as with the increasing size of rapidity window. This trend has also been shown in reference [11] where the fraction for full rapidity range of collisions at 14 TeV has been estimated as 0.30. When multiplicity distributions in full phase space at higher energies like 7 TeV, become available, the extrapolations from the lower energy domain to the highest energies can be well established, as predicted in other works also, using different approaches [28, 29].
A good agreement between the mean multiplicity and the multiplicity dependence on energy, predicted by NLO QCD and the Fermi-Landau model of particle production, with the predictions made by shifted Gompertz distribution, serves as a good test of the validity of the proposed distribution.
The future extension of the present work shall focus on analysis of multiplicities from lower energy domains, in hadron-nucleus interactions and nucleus-nucleus interactions using shifted Gompertz distribution and to derive the additional information from the oscillatory behaviour of the counting statistics, as suggested by Wilk and Wĺodarczyk [12].
Acknowledgement
The author M. Kaur is thankful to Harrison Prosper of Florida State University, US for discussion on the distributions suitable to describe the collision data from the high energy accelerators. The author Ridhi Chawla is grateful to the Department of Science and Technology, Government of India for the Inspire-Fellowship grant.
References
-
[1]
A.C. Bemmaor. In G. Laurent, G.L. Lilien, B. Pras, Editors, Research Traditions in Marketing, 201 (1994).
- [2] F. Jiménez, P. Jodrá, Commun. Stat. Theory Methods, 38, 75 (2009).
- [3] F. Jiménez Torres, J. Comput. Appl. Math., 255, 867 (2014).
- [4] Christian Bauckhage, Kristian Kersting, arXiv:1406.6529 (2014).
- [5] S. Dash et. al, Phys. Rev. D94, 074044 (2016).
- [6] T. Nakagawa and S. Osaki, IEEE, Transactions on Reliability, R-24, 5, 300 (1975).
- [7] K. Urmossy, G.G. Barnafoldi and T.S. Biro, Phys.Lett. B701, 111 (2011).
- [8] S. Hegyi, Phys. Lett. B467, 126 (1999).
- [9] S. Catani et al, Nucl.Phys. B406, 187 (1993).
- [10] G. Dissertori et al., Phys. Lett. B361, 167(1995).
- [11] A. Giovannini and R. Ugoccioni, Int. J. Mod. Phys. A20, 3897. (2000);Proceedings of Int. Symp. on Multiparticle Dynamics, Italy., Sept. 8-12, (1997).
- [12] Grzegorz Wilk and Zbigniew Wĺłodarczyk, J. Phys. G, Nucl. Part. Phys. 44, 015002 (2017).
- [13] P. Carruthers et al., Int. J. Mod. Phys. A2, 1447(1987).
- [14] Jan Fiete Grosse-Oetringhaus and Klaus Reygers J. Phys. G, Nucl. Part.Phys. 37, 083001 (2010).
- [15] R.E. Ansorge, B. Asman et al., Z. Phys., C43, 357 (1989).
- [16] C. Fuglesang in Multiparticle Dynamics, World Scientific, Singapore, 193 (1990).
- [17] P. Achard et al., Phys.Rep. 399, 71 (2004).
- [18] P.D. Acton et al., Z.Phys. C53, 539 (1992).
- [19] G. Alexander et al., Z. Phys. C72, 191 (1996).
- [20] K. Ackerstaff et al., Z. Phys. C75, 193 (1997).
- [21] G. Abbiendi et al., Eur.Phys.J. C16, 185 (2000);Eur.Phys.J. C17, 19 (2000).
- [22] V. Khachatryan, A. M. Sirunyan et al., CMS Collaboration, J. High Energy Phys. JHEP01, 79 (2011).
- [23] G.J. Alner et al., Phys.Lett. B160, 193 (1985).
- [24] E. Fermi, Prog. Theor. Phys., 5, 570 (1950
- [25] Cheuk-Yin Wong, Phys. Rev., C78, 054902 (2008)
- [26] D.E. Groom et al. (Particle Data Group), The European Phys. Journal C 15, 1 (2000).
- [27] O. Biebel, P. Nason, B.R. Webber, arXiv:hep-ph/0109282v2, (2001)
- [28] A. Capella and E.G. Ferreiro, arXiv:1301.3339v1A.
- [29] C. Fuglesang in Multiparticle Dynamics, Italy (1989) World Scientific, Singapore, 193 (1997). (2013).
- [2] F. Jiménez, P. Jodrá, Commun. Stat. Theory Methods, 38, 75 (2009).