Enormous Li-enhancement preceding red giant phases in low-mass stars in the Milky Way halo111This work is based on data collected at the Subaru Telescope, which is operated by the National Astronomical Observatory of Japan.
Abstract
Li abundances in the bulk of low-mass metal-poor stars are well reproduced by stellar evolution models adopting a constant initial abundance. However, a small number of stars have exceptionally high Li abundances, for which no convincing models have been established. We report on the discovery of 12 very metal-poor stars that have large excesses of Li, including an object having more than 100 times higher Li abundance than the values found in usual objects, which is the the largest excess in metal-poor stars known to date. The sample is distributed over a wide range of evolutionary stages, including five unevolved stars, showing no clear abundance anomaly in other elements. The results indicate the existence of an efficient process to enrich Li in a small fraction of low-mass stars at the main-sequence or subgiant phase. The wide distribution of Li-rich stars along the red giant branch could be explained by dilution of surface Li by mixing that occurs when the stars evolve into red giants. Our study narrows down the problem to be solved to understand the origins of Li-excess found in low-mass stars, suggesting the presence of unknown process that affects the surface abundances preceding red giant phases.
1 Introduction
Lithium (Li) abundances in the bulk of unevolved low-mass stars with low metallicity are almost constant, which is recognized as a result of the Big Bang nucleosynthesis (Spite & Spite, 1982), although a problem that the value is systematically lower than that expected from standard models remains (e.g., Cyburt et al., 2016). Li is, on the other hand, destroyed by nuclear reactions inside stars with temperatures higher than 2.5 million K. The surface Li is diluted by more than one order of magnitude by mixing with the layers in which Li is already depleted when a star evolves into a red giant. This is the feature found by systematic observations for globular cluster stars (Lind et al., 2009), demonstrating the overall success of the structure and evolution models for low-mass stars.
There is, however, a small fraction of low-mass stars that show extremely high Li abundances (Kumar et al., 2011), including globular cluster stars (Kraft et al., 1999), and field metal-poor stars (Ruchti et al., 2011). Whereas the Li production by the so-called Cameron-Fowler mechanism (Cameron & Fowler, 1971) in the hot-bottom burning phase of AGB stars is identified as the source of Li-excess found in highly evolved, luminous objects (Smith & Lambert, 1989), no models have been established to explain this phenomenon for less luminous stars, making this problem a challenge to the theory of low-mass star evolution.
Scenarios proposed to explain the Li-excess in low-mass stars include i) extra mixing in red giants, in particular at the so-called red giant branch (RGB) bump (Sackmann & Boothroyd, 1999; Charbonnel & Balachandran, 2000), ii) accretion of rocky planets that contain Li (Ashwell et al., 2005), iii) mass transfer from Li-enhanced AGB or highly evolved red giants. Other Li production processes in a variety of sites and phenomena, e.g., novae (José & Hernanz, 1998) and supernovae (Woosley et al., 1990), are included in models of the Galactic chemical evolution, no quantitative models that explain Li-rich objects by such processes have been established. To examine such possibilities, observational studies of very metal-poor stars have advantages. One is that metal-poor stars are generally low-mass objects with long lifetimes, in contrast to metal-rich stars with Li-excess that include intermediate-mass objects (Kumar et al., 2011), which could make the discussion complicated. Another advantage is that the ‘normal’ Li abundance in main-sequence and subgiant phases is well defined for metal-poor stars, which is the so-called Spite plateau value (Spite & Spite, 1982; Ryan et al., 1999). Moreover, chemical composition of metal-poor stars is sensitive to the additional contribution of nucleosynthesis that caused Li-enhancement. Correlation of Li-excess and abundance anomaly of other elements, if any, could be a strong constraint on proposed scenarios.
Observational studies of very metal-poor stars with Li-excess are, however, still quite limited because of the low frequency of these objects. Ruchti et al. (2011) report six Li-rich giants with [Fe/H]. Roederer et al. (2008) report a Li-enhanced star, HKII 17435-00532, around the RGB bump, showing enhancements of both r- and s-process elements. Another Li-enhanced giant, CS 22893-010, is reported by Roederer et al. (2014). On the other hand, five Li-enhanced stars (not in the AGB phase) have been reported in very metal-poor star clusters. In NGC 6397, a very Li-rich star, up to , located near the main sequence turn-off point was found by Koch et al. (2011). Other four stars are red giants found in M 68, NGC 5053, and NGC 5897 (Kirby et al., 2016).
Here we report on discoveries of very metal-poor stars with large enhancement of Li in the Milky Way halo, and discuss their chemical properties and evolutionary stages.
2 Observations
Li-rich stars have been found in our program to study metal-poor stars by the low-resolution spectroscopy with the Large sky Area Multi-Object fiber Spectroscopic Telescope (LAMOST: Cui et al., 2012; Zhao et al., 2012) and high-resolution follow-up observation with the Subaru Telescope. Candidates of metal-poor stars are selected based on the results of a pipeline analysis and visual inspection of the spectra (Li et al., 2015). Li-enhanced objects are then selected by visual inspection for the wavelength region around the Li 6708 Å line. The sample consists of both red giants and unevolved stars, i.e. main-sequence turn-off stars and subgiants.
High-resolution spectroscopy was carried out for the candidates using the Subaru Telescope High Dispersion Spectrograph (HDS: Noguchi et al., 2002). The spectra cover 4030–6760 Å with 60,000 and signal-to-noise ratios from 50 to 200, sufficient to determine abundance ratios of elements including Li. Table 1 lists the 12 stars that are observed with sufficient quality and turn out to be extremely Li-rich according to our analysis, as described below. Here, we select objects that have for red giants and for main-sequence turn-off stars and subgiants, which are at least about one order of magnitude higher than the Li abundances of typical metal-poor stars at similar evolutionary status (see below)222Abundance data are presented by for Li, and [X/Y] for elements X and Y.. For comparison purposes, high-resolution spectra of bright stars for which Li abundances are measured by previous studies are analyzed with the same technique (the four objects from the bottom in Table 1). Spectra of Li lines are shown in Figure 1. These were found in a sample of about 950 candidates of very metal-poor stars, indicating that the fraction of Li-rich objects is on the order of 1% in metal-poor stars, which is similar to the estimate by Ruchti et al. (2011).
High-resolution spectra are obtained at two or more epochs for most of the targets to investigate variations of radial velocities. A time variation of the radial velocity is detected for only one object (J1314+3741). Hence, no signature of high binary frequency has been found for Li-rich stars. Spectral line widths are also investigated for the high-resolution spectra. No significant excess of line widths due to stellar rotation is detected in our sample, except for J0554+5235 of which spectral lines suggest the rotation as rapid as 7 km s-1. The strong Li absorption features show no detectable changes between different exposures.
Ten stars in our sample are included in the photmetry data of Catalina Survey333http://nesssi.cacr.caltech.edu/DataRelease/. Except for J0302+1356, which shows a variation of 0.5 magnitude in the -band, our objects show no variation within the measurement errors ( magnitude) in the past decade. Namely, no clear anomaly is found in photometry monitoring for most of our sample.
3 Analysis and results
Stellar parameters, i.e., effective temperature (), surface gravity (), metallicity and micro-turbulent velocity, are determined by standard abundance analysis for spectral lines of neutral and singly ionized Fe, adopting the line list of Fe I and Fe II of Aoki et al. (2013) supplemented by data of O’Brian et al. (1991) and Fuhr et al. (1988). The results are given in Table 1. We also estimate from colors using temperature scales of Alonso et al. (1996, 1999), Casagrande et al. (2010), and Ramírez & Meléndez (2005). The values derived from the APASS (Henden et al., 2016) and 2MASS (Cutri et al., 2003) photometry data and reddening corrections from the dust map (Schlafly & Finkbeiner, 2011) available in the NASA/IPAC website are given in the table. For the five objects with higher than 5500 K, in which the Balmer line profiles are sensitive to the changes of and , these parameters are also estimated by the profile fitting for the Balmer lines following the procedure of Barklem et al. (2002) and Matsuno et al. (2017). The results are given in Table 2. The ’s obtained by these methods well agree with the values obtained by spectroscopic analysis of Fe lines.
The values of comparison stars are also estimated based on the parallax provided by Tycho-Gaia Astrometric Solution (TGAS; Lindegren et al., 2016). The values of the two warm comparison stars (HD 84937 and HD 140283) agree with those from the Balmer line analysis, whereas they are larger than those obtained by the spectroscopic analysis by 0.3–0.4 dex. Similar discrepancy is found between the values from spectroscopic analysis and from Balmer line analysis for the five warm Li-rich stars. This could be due to the non-NLTE (NLTE) effects in the analysis of Fe lines. The NLTE effect on estimates is reported to be 0.2–0.5 dex by Lind et al. (2012) for the evolutionary status and metallicity ranges of our sample.
The typical uncertainty of the , , microturbulent velocity, and [Fe/H] for very metal-poor stars are 150 K, 0.3 dex, 0.3 km s-1, and 0.3 dex, respectively. We adopt the and obtained in the LTE analysis of Fe lines in the following abundance measurements. The changes of values by 0.3 dex, suspected from the estimates by other methods, do not significantly affect the results of elemental abundances.
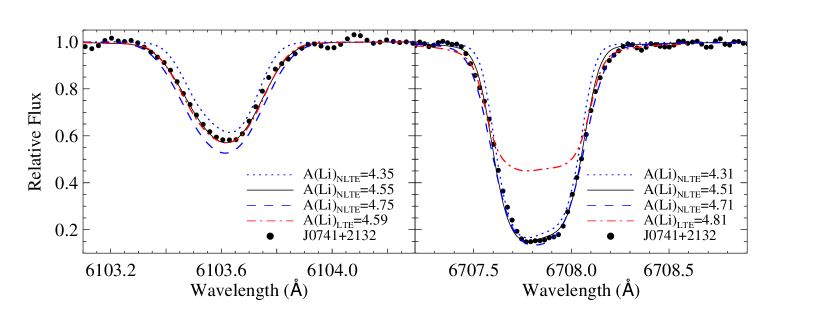
A standard abundance analysis is carried out using the local thermodynamic equilibrium (LTE) model stellar photospheres (Castelli et al., 1997). The Li subordinate line at 6103.6 Å is detected in nine out of the 12 objects in our sample (Table 2), in which the Li resonance line at 6707.8 Å is highly saturated (Figure 2). The LTE and NLTE Li abundances are determined from the subordinate line for these objects. The abundances are also determined from the resonance line for all targets including comparison stars. The NLTE analysis is based on the method from Shi et al. (2007). Results are given in Table 2. The LTE abundance derived from the subordinate line well agrees with the NLTE result, while the resonance line would require NLTE analysis for desaturation. The NLTE abundances from the two Li lines agree quite well. We adopt the average of the NLTE results from the two lines as the final Li abundance whenever available (Table 2).
Abundances of other key elements, C, Na, Mg and Ba, are determined by standard analysis for equivalent widths of atomic lines and by the spectrum synthesis method for the CH molecular band at 4315 Å and for species with only one atomic line. The line lists of Aoki et al. (2013) for atoms and Masseron et al. (2014) for CH molecule are adopted. The results are given in Table 2. The Na abundances are determined from the subordinate lines at 5682 and 5688 Å for 10 out of the 12 objects, which are not sensitive to NLTE effects. For J0554+5235 and J1455+1251, for which subordinate lines are not detected, the Na abundances are estimated from the resonance lines at 5890 and 5896 Å. For metal-poor stars with similar parameters, NLTE corrections are estimated to be as large as dex (Andrievsky et al., 2007). Excluding the Na abundances for these two stars, the typical uncertainties of elemental abundance ratios are 0.12 dex, 0.31 dex, 0.13 dex, 0.15 dex and 0.18 dex for Li, C, Na, Mg and Ba, respectively.
The abundance ratios of C, Mg, and Ba determined for the Li-rich stars are typical values in very metal-poor stars. Na is overabundant in some objects, but its abundance is within the scatter found for very metal-poor stars with normal Li abundances. Hence, no signature of peculiarity of abundance ratios for elements other than Li is found in our sample. The exception is the most metal-poor object J0705+2552 that shows excesses of C, Na, and Mg. Such objects are, however, often found in extremely metal-poor stars with no Li-excess (Aoki et al., 2002). We exclude this object from the following discussion and will report on the detailed properties separately.
4 Discussion
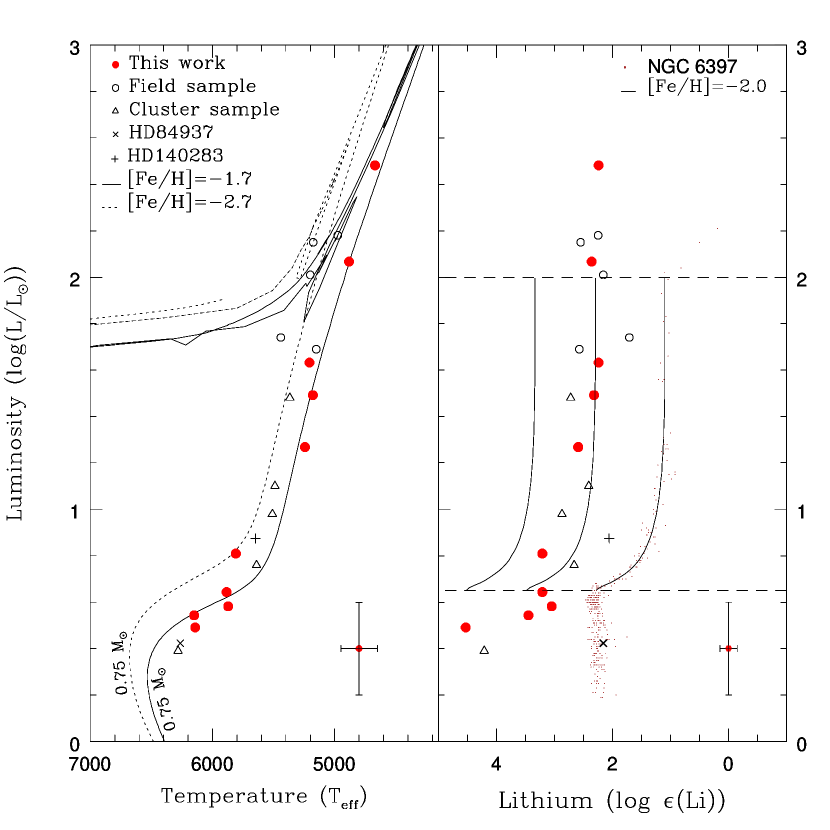
Figure 3 shows the stellar parameters and Li abundances of the Li-rich objects studied in the present work. The luminosity () in the left panel is estimated from and assuming a stellar mass of 0.8 M⊙. For this purpose, we adopt a NLTE correction for estimated by Lind et al. (2012) mentioned in §3. Li-rich metal-poor stars appear over a wide range of evolutionary stages in low-mass stars. In particular, our sample includes five subgiants, which should not have experienced significant mixing that occurs when a star evolves into a red giant (the first dredge-up). Only one warm Li-rich object was previously known in the globular cluster NGC 6397 (Koch et al., 2011). A few other objects with less significant excess of Li have been found near the bottom of the red giant branch in globular clusters (Kirby et al., 2016). Our study reveals that Li-excess in low-mass objects below the RGB bump, having luminosity lower than 100 L⊙, is not a unique phenomenon in clusters, but is also found in field metal-poor stars.
The metallicity range in which Li-excess appears is also quite wide, although all our targets are very metal-poor ([Fe/H]).
The highest Li abundance, , is found in the subgiant J0741+2132. The Li excesses in other subgiants and red giants below the RGB bump are not as significant as in J0741+2132. The surface Li is diluted by the first dredge-up that mixes the Li-containing layer (0.03 ) with Li-free layer of the envelope ( M⊙). An example of model predictions is depicted in the right panel of Figure 3. If a very large Li excess up to is assumed as an initial value, the Li excess of stars with below the RGB bump can be explained by the dilution due to the first dredge-up. This is a natural explanation for the presence of Li-rich objects at any evolutionary status, which was speculated by a previous study for globular cluster stars (Kirby et al., 2016). This hypothesis now has observational support for the first time with our systematic search for Li-rich very metal-poor stars. The probability of finding red giants with K is several times higher than that of finding subgiants with K in a magnitude-limited sample, according to stellar evolution models (e.g., Kim et al., 2002). This is because of the higher luminosity of red giants, even though the time scale of their evolution is shorter. Hence, if the frequency of Li-rich stars is similar among both subgiants and red giants, it is no wonder that Li-rich giants have been observed before our discovery of Li-rich subgiants. We note that there are some very Li-rich objects with higher luminosity, some of which are quoted to be AGB stars in literature. There could be another origin of Li-excess for these highly evolved stars.
If the above interpretation is correct, the essential problem is the source of the extremely large Li-excess in main-sequence turn-off stars or subgiants like J0741+2132. Since no significant internal mixing (with short timescale) is expected in such unevolved stars, at least within the framework of standard stellar evolution theory, Li production by the Cameron-Fowler mechanism in a single star is very unlikely. Hence, interaction with other objects would be necessary.
Engulfment of planets having a high Li abundance (e.g. rocky planets) is proposed as a possible origin of Li excess (Siess & Livio, 1999). This is, however, also unlikely as efficient planet formation is not expected in very metal-poor stars. Moreover, the amount of Li contained in J0741+2132 is too high to be explained by this scenario. Assuming 0.03 M⊙ for the surface convective layer with , the Li mass contained in the layer is about M⊙. To provide this amount of Li from material with primordial abundance (), the total mass of original material required is larger than 1 M⊙. Formation of planets in which Li is concentrated from material with such large mass, and subsequent accretion to the stellar surface, is highly improbable.
A remaining scenario is accretion of matter affected by Li production in a companion star in the AGB or highly evolved red giant phase. The companion could be an unseen white dwarf at present. There is, however, no signature of high binary frequency in our sample from radial velocity monitoring nor from photometry. Moreover, there is no signature of excess in carbon and neutron-capture elements, which are usually regarded as a signature of mass transfer from an AGB companion.
Recently, nova explosions have been identified as a promising source of Li in the universe by the measurement of Li and 7Be in nova spectra (Tajitsu et al., 2015; Izzo et al., 2015). No significant excesses of other elements have been found in such observations for novae. Accretion of material ejected from a nova to a low-mass star is an attractive idea to explain the Li-rich stars (Gratton & D’Antona, 1989). There is, however, no model of mass accretion from a nova to a low-mass star at present. Hence, this is still a speculation just from the abundance properties.
Another scenario to be investigated is an extra mixing caused by merging events with planets or other small mass objects, which might induce the Cameron-Fowler mechanism even in stars before the RGB bump (Denissenkov & Herwig, 2004). Such merging events could result in high rotation velocity of the surface of stars by additional angular momentum brought by the small objects. No signature of rapid rotation is found in our sample. However, this does not exclude the above possibility, because the objects could be sufficiently old so that the rotation has already become slow after the merging event. Another possible signature of a merging event is the increase in total stellar mass as suggested for the formation of blue straggler stars. Accurate mass estimates for these objects by high precision luminosity (i.e., distance) measurement or by stellar seismology are highly desirable to examine this possibility.
5 Summary and concluding remarks
This work reports elemental abundances of 12 very metal-poor stars with large excess of Li. This is the largest sample of such objects covering a wide range of evolutionary stages. The existence of Li-rich stars indicates that there are still unknown processes in low-mass star evolution, even in the phase before they evolve into red giants, the study of which is usually regarded as a well-established field in astrophysics. Solving the mystery of their origin will provide new insight into the structure and evolution of low-mass stars, which could propagate in the studies of planetary systems and of Galaxy formation based on observations of low-mass stars.
| ID | Object | (K) | (K) | (K) | ||||||||||
|---|---|---|---|---|---|---|---|---|---|---|---|---|---|---|
| spectroscopic | A96/99 | C10 | RM05 | Balmer | parallax | |||||||||
| J0302+1356 | LAMOST J030209.33+135656.3 | 2.048 | 5206 | 2.30 | 5041 | 4998 | ||||||||
| J0554+5235 | LAMOST J055408.54+523559.0 | 1.799 | 5638 | 1.80 | 5367 | 5319 | ||||||||
| J0626+6032 | LAMOST J062647.91+603254.0 | 1.467 | 5885 | 3.45 | 5876 | 5987 | 5844 | 5873 | 3.55 | |||||
| J0705+2552 | LAMOST J070542.30+255226.6 | 1.798 | 5269 | 2.50 | 5432 | 5400 | ||||||||
| J0714+1600 | LAMOST J071422.66+160042.5 | 1.895 | 5179 | 2.40 | 5243 | 5197 | ||||||||
| J0741+2132 | LAMOST J074102.07+213246.6 | 1.270 | 6142 | 3.65 | 6181 | 6365 | 6299 | 6150 | 3.91 | |||||
| J0758+4703 | LAMOST J075816.39+470343.3 | 1.498 | 6151 | 3.65 | 5760 | 5924 | 5786 | 6093 | 3.99 | |||||
| J0852+2627 | LAMOST J085208.07+262730.1 | 1.604 | 5872 | 3.55 | 5597 | 5750 | 5591 | 5713 | 3.74 | |||||
| J1314+3741 | LAMOST J131457.78+374110.7 | 1.564 | 5809 | 3.15 | 5752 | 5825 | 5715 | 5699 | 3.83 | |||||
| J1414+0016 | LAMOST J141412.27+001618.7 | 2.133 | 4882 | 1.55 | 4955 | 4936 | ||||||||
| J1455+1251 | LAMOST J145500.04+125106.2 | 2.360 | 4670 | 1.05 | 4708 | 4713 | ||||||||
| J2146+2732 | LAMOST J214610.13+273200.8 | 1.916 | 5243 | 2.75 | 5205 | 5153 | ||||||||
| HD84937 | HD 84937 | 1.262 | 6263 | 3.75 | 6195 | 6382 | 6318 | 6208 | 4.21 | 4.07 | ||||
| HD140283 | HD 140283 | 1.624 | 5647 | 3.10 | 5590 | 5723 | 5562 | 5596 | 3.65 | 3.52 | ||||
| HD186478 | HD 186478 | 2.504 | 4648 | 1.15 | 4574 | 4578 | 1.18 | |||||||
| HD2796 | HD 2796 | 2.174 | 4832 | 1.05 | 4906 | 4888 | 1.78 | |||||||
| ID | Abundances | |||||||||||||
|---|---|---|---|---|---|---|---|---|---|---|---|---|---|---|
| [Fe/H] | 6103.6 Å | 6707.8 Å | [C/Fe] | [Na/Fe] | [Mg/Fe] | [Ba/Fe] | ||||||||
| LTE | NLTE | LTE | NLTE | (adopted) | ||||||||||
| J0302+1356 | -1.74 | 2.34 | 2.24 | 2.24 | -0.29 | -0.22 | 0.31 | 0.19 | ||||||
| J0554+5235 | -2.03 | 3.33 | 3.42 | 4.05 | 3.45 | 3.44 | 0.30 | 0.75* | 0.22 | 0.05 | ||||
| J0626+6032 | -2.29 | 3.19 | 3.21 | 3.43 | 3.20 | 3.21 | 0.36 | 0.27 | 0.12 | 0.10 | ||||
| J0705+2552 | -3.19 | 3.09 | 3.15 | 3.54 | 3.15 | 3.15 | 1.76 | 1.37 | 1.04 | 0.48 | ||||
| J0714+1600 | -2.16 | 2.28 | 2.32 | 2.42 | 2.32 | 2.32 | 0.03 | -0.39 | 0.32 | -0.31 | ||||
| J0741+2132 | -2.33 | 4.55 | 4.51 | 4.85 | 4.55 | 4.53 | 0.65 | 0.10 | 0.35 | -0.41 | ||||
| J0758+4703 | -1.84 | 3.40 | 3.44 | 3.79 | 3.45 | 3.45 | 0.36 | 0.45 | 0.40 | 0.06 | ||||
| J0852+2627 | -2.13 | 3.04 | 3.07 | 3.16 | 3.02 | 3.05 | 0.20 | 0.21 | 0.30 | 0.34 | ||||
| J1314+3741 | -2.70 | 3.16 | 3.21 | 3.48 | 3.21 | 3.21 | 0.55 | 0.68 | 0.37 | -0.43 | ||||
| J1414+0016 | -2.56 | 2.42 | 2.36 | 2.36 | 0.03 | -0.39 | 0.32 | -0.31 | ||||||
| J1455+1251 | -2.68 | 2.31 | 2.24 | 2.24 | -0.40 | 0.34* | 0.35 | -2.37 | ||||||
| J2146+2732 | -1.73 | 2.55 | 2.56 | 2.85 | 2.61 | 2.59 | -0.20 | 0.81 | 0.22 | 0.47 | ||||
| HD84937 | -2.31 | 2.21 | 2.16 | 2.16 | 0.38 | -0.30 | 0.31 | -0.08 | ||||||
| HD140283 | -2.64 | 2.08 | 2.06 | 2.06 | 0.61 | -0.37 | 0.26 | -1.01 | ||||||
| HD186478 | -2.55 | -0.33 | -0.32 | 0.52 | -0.08 | |||||||||
| HD2796 | -2.49 | -0.54 | -0.37 | 0.35 | -0.31 | |||||||||
Note. — Na abundances with asterisk are determined from the resonance lines whereas those of other stars are determined from the subordinate lines.

References
- Alonso et al. (1996) Alonso, A., Arribas, S., & Martinez-Roger, C. 1996, A&A, 313, 873
- Alonso et al. (1999) Alonso, A., Arribas, S., & Martínez-Roger, C. 1999, A&AS, 140, 261
- Andrievsky et al. (2007) Andrievsky, S. M., Spite, M., Korotin, S. A., et al. 2007, A&A, 464, 1081
- Aoki et al. (2013) Aoki, W., Beers, T. C., Lee, Y. S., et al. 2013, AJ, 145, 13
- Aoki et al. (2002) Aoki, W., Norris, J. E., Ryan, S. G., Beers, T. C., & Ando, H. 2002, ApJ, 576, L141
- Ashwell et al. (2005) Ashwell, J. F., Jeffries, R. D., Smalley, B., et al. 2005, MNRAS, 363, L81
- Barklem et al. (2002) Barklem, P. S., Stempels, H. C., Allende Prieto, C., et al. 2002, A&A, 385, 951
- Cameron & Fowler (1971) Cameron, A. G. W., & Fowler, W. A. 1971, ApJ, 164, 111
- Casagrande et al. (2010) Casagrande, L., Ramírez, I., Meléndez, J., Bessell, M., & Asplund, M. 2010, A&A, 512, A54
- Castelli et al. (1997) Castelli, C. M., Ashton, J. E., & Pool, P. J. 1997, Proc. SPIE, 3149, 92
- Charbonnel & Balachandran (2000) Charbonnel, C., & Balachandran, S. C. 2000, A&A, 359, 563
- Choi et al. (2016) Choi, J., Dotter, A., Conroy, C., et al. 2016, ApJ, 823, 102
- Cui et al. (2012) Cui, X.-Q., Zhao, Y.-H., Chu, Y.-Q., et al. 2012, Research in Astronomy and Astrophysics, 12, 1197
- Cutri et al. (2003) Cutri, R. M., Skrutskie, M. F., van Dyk, S., et al. 2003, VizieR Online Data Catalog, 2246,
- Cyburt et al. (2016) Cyburt, R. H., Fields, B. D., Olive, K. A., & Yeh, T.-H. 2016, Reviews of Modern Physics, 88, 015004
- Denissenkov & Herwig (2004) Denissenkov, P. A., & Herwig, F. 2004, ApJ, 612, 1081
- Dotter (2016) Dotter, A. 2016, ApJS, 222, 8
- Fuhr et al. (1988) Fuhr, J. R., Martin, G. A., & Wiese, W. L. 1988, Journal of Physical and Chemical Reference Data, 17,
- Gratton & D’Antona (1989) Gratton, R. G., & D’Antona, F. 1989, A&A, 215, 66
- Henden et al. (2016) Henden, A. A., Templeton, M., Terrell, D., et al. 2016, VizieR Online Data Catalog, 2336,
- Izzo et al. (2015) Izzo, L., Della Valle, M., Mason, E., et al. 2015, ApJ, 808, L14
- José & Hernanz (1998) José, J., & Hernanz, M. 1998, ApJ, 494, 680
- Kirby et al. (2016) Kirby, E. N., Guhathakurta, P., Zhang, A. J., et al. 2016, ApJ, 819, 135
- Kim et al. (2002) Kim, Y.-C., Demarque, P., Yi, S. K., & Alexander, D. R. 2002, ApJS, 143, 499
- Koch et al. (2011) Koch, A., Lind, K., & Rich, R. M. 2011, ApJ, 738, L29
- Kraft et al. (1999) Kraft, R. P., Peterson, R. C., Guhathakurta, P., et al. 1999, ApJ, 518, L53
- Kumar et al. (2011) Kumar, Y. B., Reddy, B. E., & Lambert, D. L. 2011, ApJ, 730, L12
- Li et al. (2015) Li, H., Aoki, W., Zhao, G., et al. 2015, PASJ, 67, 84
- Lindegren et al. (2016) Lindegren, L., Lammers, U., Bastian, U., et al. 2016, A&A, 595, A4
- Lind et al. (2009) Lind, K., Primas, F., Charbonnel, C., Grundahl, F., & Asplund, M. 2009, A&A, 503, 545
- Lind et al. (2012) Lind, K., Bergemann, M., & Asplund, M. 2012, MNRAS, 427, 50
- Martell & Shetrone (2013) Martell, S. L., & Shetrone, M. D. 2013, MNRAS, 430, 611
- Masseron et al. (2014) Masseron, T., Plez, B., Van Eck, S., et al. 2014, A&A, 571, A47
- Matsuno et al. (2017) Matsuno, T., Aoki, W., Suda, T., & Li, H. 2017, PASJ, 69, 24
- Noguchi et al. (2002) Noguchi, K., Aoki, W., Kawanomoto, S., et al. 2002, PASJ, 54, 855
- O’Brian et al. (1991) O’Brian, T. R., Wickliffe, M. E., Lawler, J. E., Whaling, W., & Brault, J. W. 1991, Journal of the Optical Society of America B Optical Phys ics, 8, 1185
- Ramírez & Meléndez (2005) Ramírez, I., & Meléndez, J. 2005, ApJ, 626, 465
- Roederer et al. (2008) Roederer, I. U., Frebel, A., Shetrone, M. D., et al. 2008, ApJ, 679, 1549-1565
- Roederer et al. (2014) Roederer, I. U., Preston, G. W., Thompson, I. B., Shectman, S. A., & Sneden, C. 2014, ApJ, 784, 158
- Ruchti et al. (2011) Ruchti, G. R., Fulbright, J. P., Wyse, R. F. G., et al. 2011, ApJ, 743, 107
- Ryan et al. (1999) Ryan, S. G., Norris, J. E., & Beers, T. C. 1999, ApJ, 523, 654
- Sackmann & Boothroyd (1999) Sackmann, I.-J., & Boothroyd, A. I. 1999, ApJ, 510, 217
- Schlafly & Finkbeiner (2011) Schlafly, E. F., & Finkbeiner, D. P. 2011, ApJ, 737, 103
- Shi et al. (2007) Shi, J. R., Gehren, T., Zhang, H. W., Zeng, J. L., & Zhao, G. 2007, A&A, 465, 587
- Siess & Livio (1999) Siess, L., & Livio, M. 1999, MNRAS, 308, 1133
- Smith & Lambert (1989) Smith, V. V., & Lambert, D. L. 1989, ApJ, 345, L75
- Spite & Spite (1982) Spite, M., & Spite, F. 1982, Nature, 297, 483
- Tajitsu et al. (2015) Tajitsu, A., Sadakane, K., Naito, H., Arai, A., & Aoki, W. 2015, Nature, 518, 381
- Woosley et al. (1990) Woosley, S. E., Hartmann, D. H., Hoffman, R. D., & Haxton, W. C. 1990, ApJ, 356, 272
- Zhao et al. (2012) Zhao, G., Zhao, Y.-H., Chu, Y.-Q., Jing, Y.-P., & Deng, L.-C. 2012, Research in Astronomy and Astrophysics, 12, 723