Dual frequency comb spectroscopy in the molecular fingerprint region
Abstract
Spectroscopy in the molecular fingerprint spectral region (6.5-20 m) yields critical information on material structure for physical, chemical and biological sciences. Despite decades of interest and effort, this portion of the electromagnetic spectrum remains challenging to cover with conventional laser technologies. In this report, we present a simple and robust method for generating super-octave, optical frequency combs in the fingerprint region through intra-pulse difference frequency generation in an orientation-patterned gallium phosphide crystal. We demonstrate the utility of this unique coherent light source for high-precision, dual-comb spectroscopy in methanol and ethanol vapor. These results highlight the potential of laser frequency combs for a wide range of molecular sensing applications, from basic molecular spectroscopy to nanoscopic imaging.
Infrared molecular spectroscopy is a powerful technique for measuring the chemical make-up and structure of matter. In particular, the inter-atomic degrees of freedom within a molecule lead to series of discrete, vibrational states whose resonances are unique identifiers in the long-wave infrared (LWIR) fingerprint wavelength range that spans 6.5-20 m (1500-500 cm-1). For the past fifty years, Fourier transform infrared spectroscopy (FTIR) Griffiths and de Haseth (2007) using thermal light sources has been a primary tool for determining molecular structure in this spectral region, imparting a wide ranging impact in the physical, chemical, biological, and medical sciences. While laser spectroscopy in this region has been pursued over a similar epoch, widely tunable LWIR laser sources remain challenging. More recently, optical frequency comb spectroscopy Schiller (2002); Keilmann et al. (2004); Ideguchi et al. (2013); Coddington et al. (2016) has been introduced as a compelling alternative to FTIR by providing a unique combination of large spectral bandwidth, high frequency precision, and rapid data acquisition that can be integrated with cavity enhancement techniques Bernhardt et al. (2009); Spaun et al. (2016) or long-distance propagation Rieker et al. (2014) to enhance sensitivity.
Significant effort has gone into the development and spectroscopic application of infrared frequency combs Schliesser et al. (2012), with techniques including difference frequency generation (DFG) Erny et al. (2007); Cruz et al. (2015); Lee et al. (2017), optical parametric oscillation (OPO) Adler et al. (2010); Leindecker et al. (2011); Maidment et al. (2016), mode-locked quantum cascade lasers Wang et al. (2009); Hugi et al. (2012), super-continuum generation Hudson et al. (2017), and Kerr micro-resonator technology Yu et al. (2016). However, to-date most frequency comb sources have been restricted to wavelengths below 6 m or have only been able to access discrete portions of the fingerprint region with limited resolution and accuracy. In parallel, there has also been ongoing research to generate broadband multi-terahertz pulses extending up to the LWIR region through intra-pulse DFG using mode-locked oscillators based on both Ti:Sapphire Bonvalet et al. (1995); Huber et al. (2000); Keilmann et al. (2004) and Er:fiber platforms Riek et al. (2015, 2017). However, reported infrared powers from such optically rectified pulses at MHz repetition rates have been limited to the W scale.
In this report, we introduce a solution for bright, stabilized LWIR frequency combs based on intra-pulse DFG using a few-cycle pulse derived from commonplace and robust Er:fiber laser technology. The parametric conversion occurs within a quadratic non-linear crystal employing quasi-phasematching to enhance the light conversion efficiency into the LWIR regime. In this manner, we generate spectra containing W of power and spanning 4-12 m (2500-830 cm-1), with a clear pathway to coverage across the full fingerprint region. The present super-octave bandwidth, consists of 500,000 frequency comb modes providing a spectral resolution down to 100 MHz (0.0033 cm-1). We illustrate the capabilities of this unique spectroscopic tool by measuring mode-resolved spectra of methanol and ethanol molecules using a second comb source for readout in a dual-comb spectroscopy (DCS) configuration Coddington et al. (2016). Our results realize improvements in resolution that are a factor of 500 beyond the only previously reported frequency comb spectroscopy in the fingerprint region Keilmann et al. (2004). Additionally, the frequency axis of the spectra we recover is precisely calibrated with respect to absolute microwave standards at fractional uncertainties below . Finally, the acquisition rate of 20 ms and favorable signal-to-noise ratio allows us to demonstrate dynamic sampling and tracking of gas concentrations on the second time scale. The simplicity of our source and the potential for achieving still broader spectral coverage should be enabling for a wide-range of diagnostics of chemical and biological samples in gas, liquid, or solid phase. Extension of the laser and nonlinear techniques introduced here could facilitate applications in astronomical heterodyne spectroscopy Hale et al. (2000), pump-probe and nonlinear microscopy Kukura et al. (2007); Ideguchi et al. (2013), and scanning probe techniques Pollard et al. (2015); Dazzi and Prater (2017) for laboratory spectro-imaging at the nano-scale.
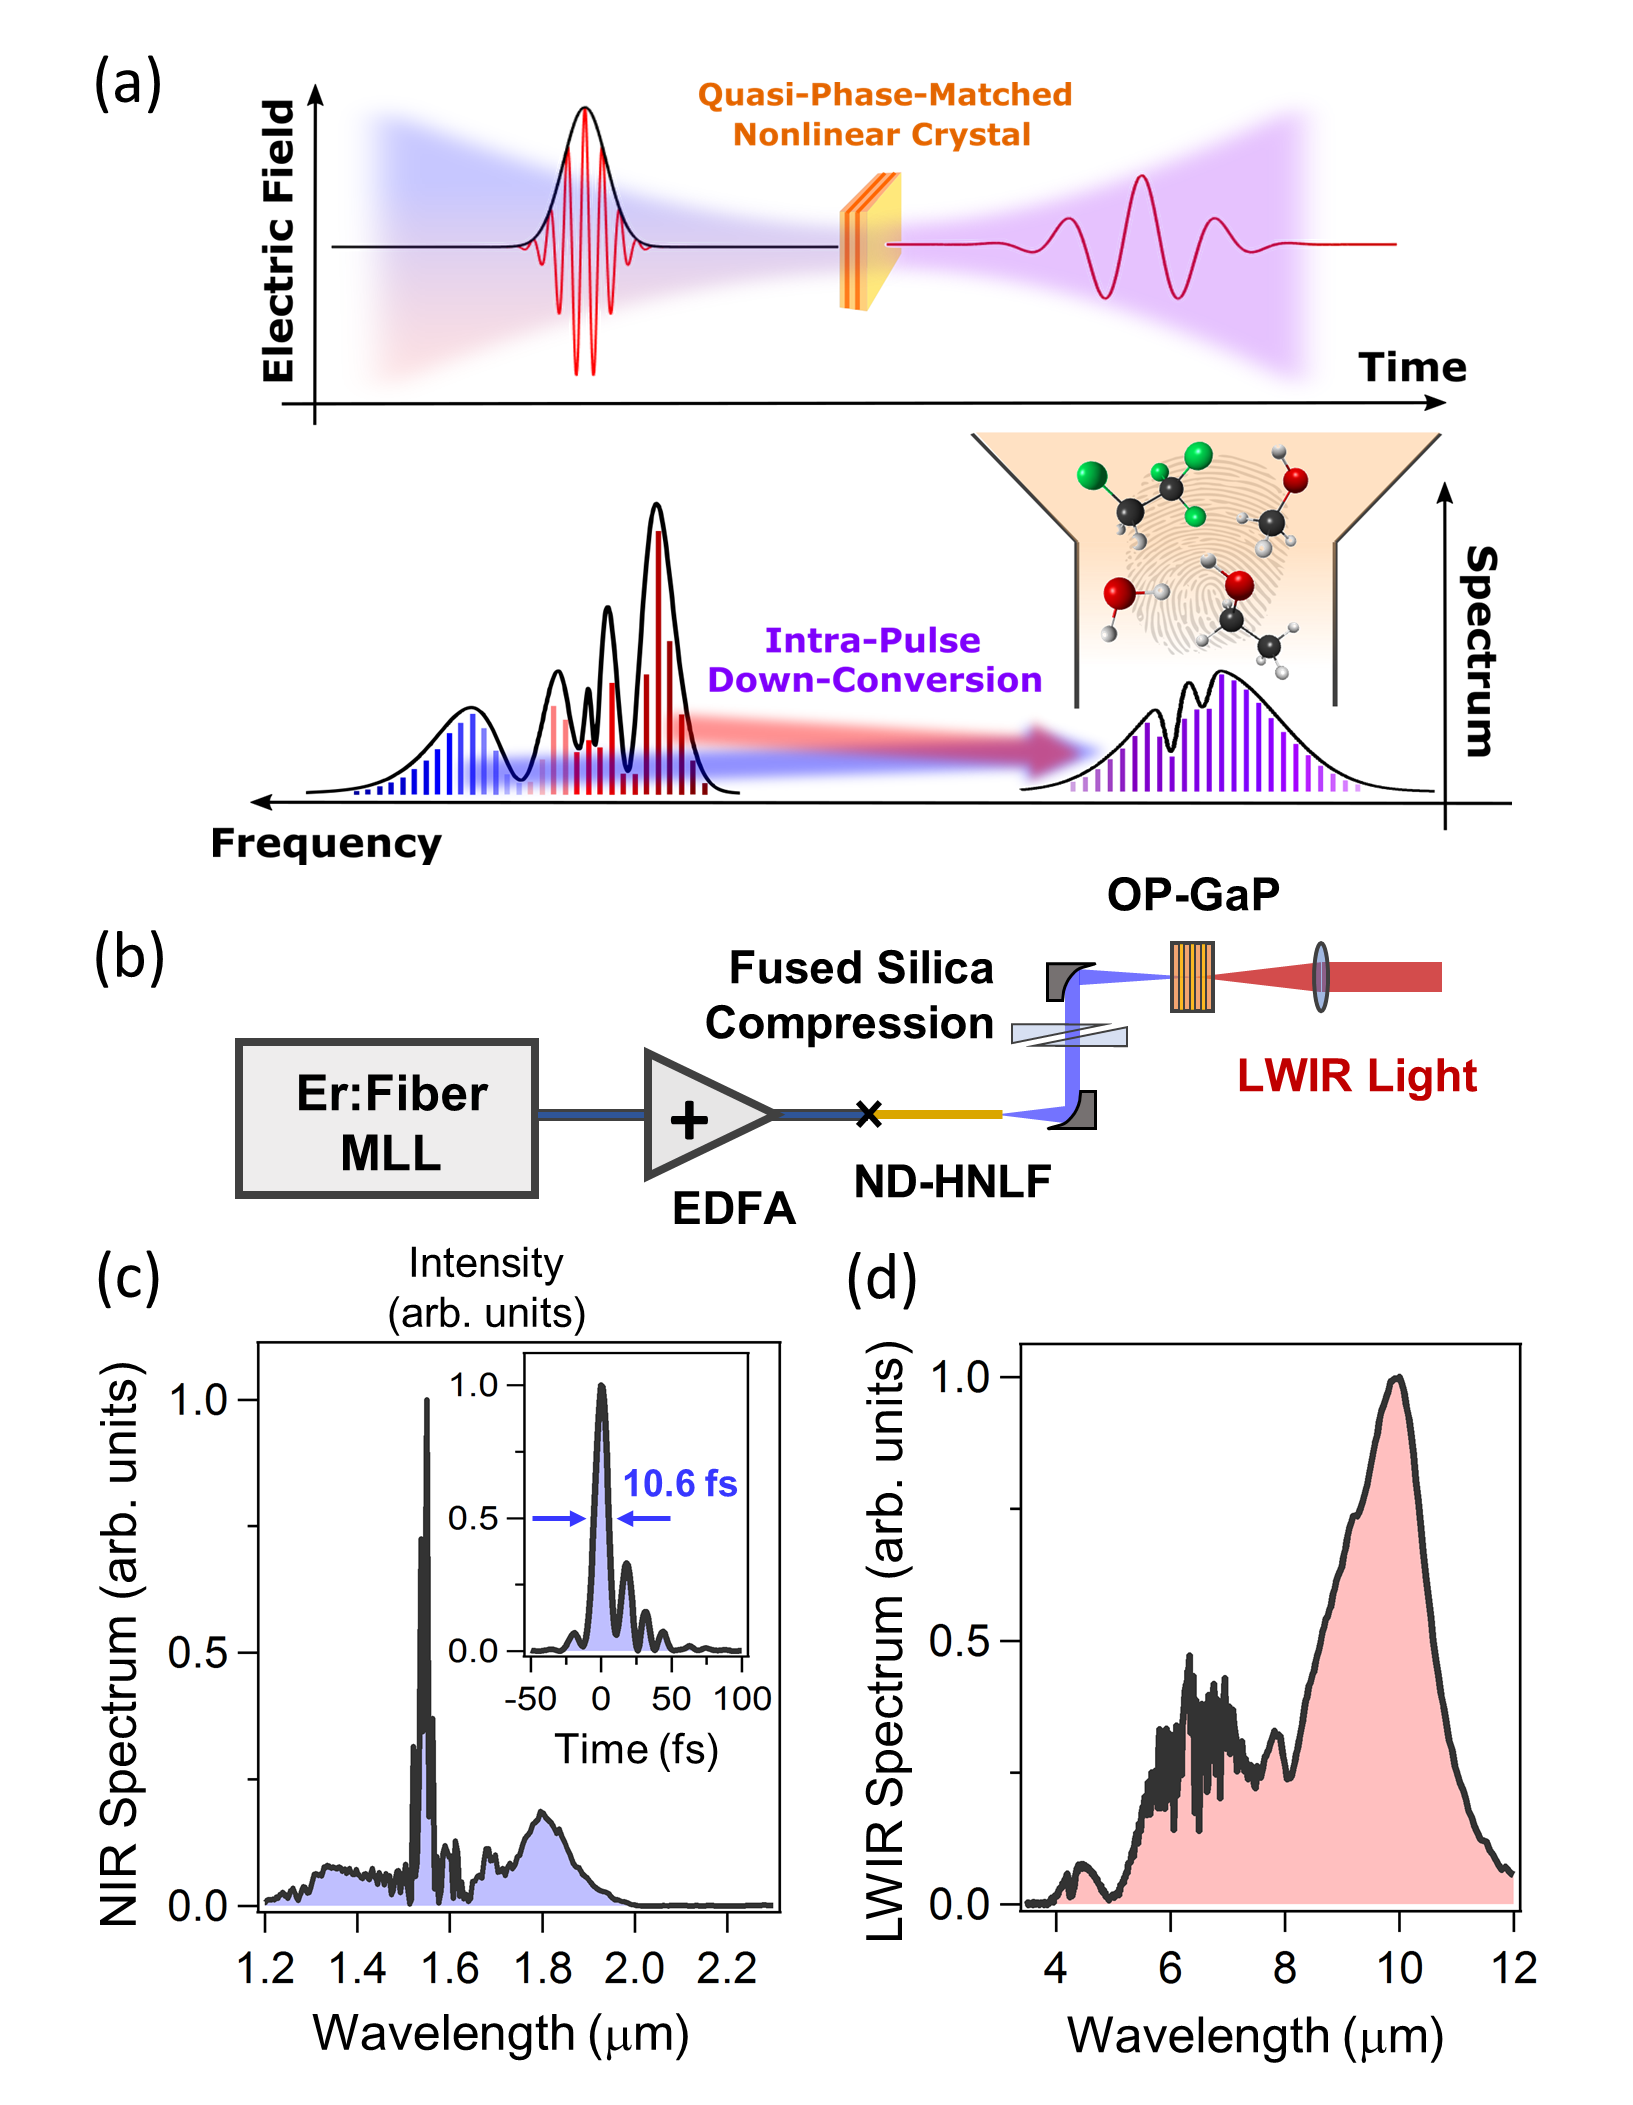
The concept and implementation of our frequency comb source is depicted in Fig. 1. In the time-domain [Fig. 1(a), top panel], a few-cycle pulse is focused into the nonlinear crystal, resulting in a nonlinear polarization and forward emission of LWIR light having an optical period on the order of the temporal duration of the pump pulse. In the frequency domain [Fig. 1(a), lower panel], this corresponds to DFG between the spectral components within the few-cycle, near-infrared pump spectrum. Since the few-cycle pulses occur as a phase-stable pulse train, the pump spectrum actually consists of a comb of frequency modes given by , where is the carrier-envelope offset frequency and is the repetition rate of the pulse train. The pairwise difference between the and pump modes yields a LWIR comb with frequencies, , given by . A critical and advantageous aspect of the intra-pulse difference frequency is that is subtracted out from the pump field, providing an offset free LWIR comb consisting of exact harmonics of .
The experimental layout used to implement the broadband, few-cycle Er comb is shown in Fig. 1 (b), with complete experimental details given in the Supplement Sup . Briefly, femtosecond pulses generated from a commercial, 100 MHz Er:fiber mode-locked oscillator are amplified to a pulse energy of 3.5 nJ, corresponding to an average power of 350 mW. The compressed output of the amplifier is spliced directly to a normal dispersion highly nonlinear fiber (ND-HNLF, 4 cm), where the pulse undergoes spectral broadening to generate a bandwidth of nm [Fig. 1 (c)]. The normal dispersion of the HNLF provides the accumulation of positive chirp as the pulse propagates through the fiber that can be easily compressed using a variable length of anomalous dispersion fused silica wedges. The compressed pulse is characterized using frequency resolved optical gating Sup , and the reconstructed pulse profile [inset of Fig. 1 (c)] yields a temporal duration of 10.6 fs, corresponding to a 2-cycle pulse. After compression, the pulse energy is measured to be 2.5 nJ, yielding a peak power of 250 kW.
After compression, the few-cycle pulse is focused into an orientation-patterned gallium phosphide (OP-GaP) crystal with an orientation patterning period of m and a thickness of 1 mm. The OP-GaP crystal exhibits a high non-linear coefficient ( pm/V) and broad transparency across the pump and generated LWIR wavelength regime, making it an ideal crystal for LWIR light conversion Lee et al. (2017); Maidment et al. (2016); Schunemann et al. (2016). The generated LWIR light is collected after the OP-GaP crystal and filtered using a long-pass filter at 3.6 m. Using this simple set-up, we generate LWIR spectra spanning across both infrared atmospheric transmission bands (3-5 m and 8-12 m) and containing up to 0.25 mW of power. A typical spectrum optimized for bandwidth is shown in Fig. 1 (d), exhibiting over 1.5 octaves of bandwidth from 4 to 12 m. While our measurements are limited by the 12 m cutoff of the HgCdTe (MCT) detectors employed, additional simulations indicate that the spectrum can extend up to 25 m Sup .
To demonstrate the utility of our LWIR frequency comb, we preform high-resolution DCS of vapor phase methanol and ethanol, two commonly used solvents relevant to chemical synthesis, fuel alternatives, and commercial alcohol production. In DCS, a second frequency comb with a slight offset in its repetition rate, , is used. The LWIR light from the two combs is combined, passes through a 15 cm molecular absorption cell, and is then photodetected. The time-dependent interference between the two combs gives rise to a periodic interferogram with a recurrence of , which is analogous to FTIR, but generated without the need for meter-scale mechanical delay.
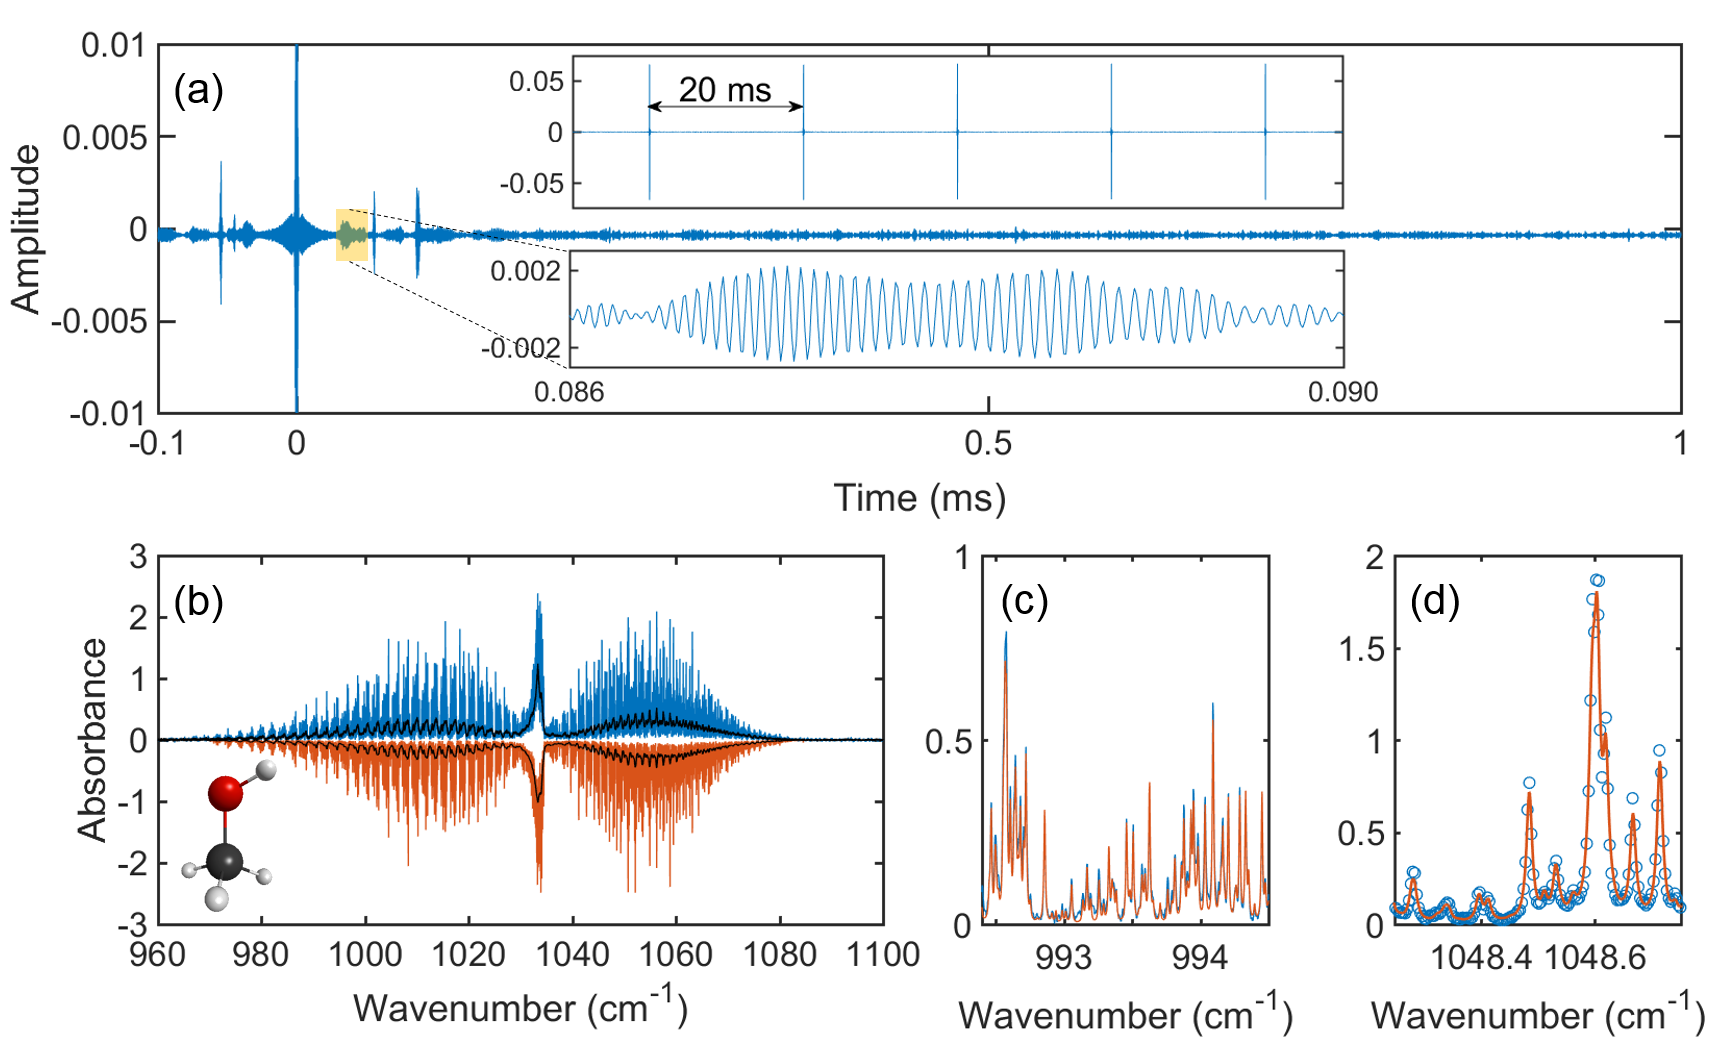
The DCS interferogram measured from methanol vapor is shown in Fig. 2 (a). In this experiment, we use a Hz and a temporal acquisition window of ms to achieve a frequency resolution of 100 MHz. Most of the molecular information is contained in long tails and revivals following the central burst [bottom insets in Fig. 2 (a)]. The DCS absorbance spectrum of methanol, , is presented in Fig. 2 (b) and is measured as
| (1) |
where and are the DCS spectra with and without an absorption cell respectively and a DCS spectrum is calculated by taking a Fourier transform of the interferogram, or . The spectrum in Fig. 2 (b) corresponds to the P, Q, and R branches of the C-O stretch transition in methanol centered at 1033 cm-1 (9.7 m). We collect the methanol absorption spectrum at both atmospheric pressure (methanol partial pressure of 3 mbar, black curve), where the ro-vibrational lines are pressure broadened to 10 GHz, and at a lower background pressure of 50 mbar (methanol partial pressure of 3 mbar, blue curve), where we can resolve sub-GHz linewidths. These collected spectra are in agreement with the methanol spectra calculated from the HITRAN2012 database Rothman et al. (2013) (black and red curve reflected about origin, corresponding to spectra at atmospheric pressure and 50 mbar respectively). To exemplify this agreement, we present a zoom into a subset of data at 993.5 cm-1 in Fig. 2 (c). Further, to demonstrate the low phase noise between the two LWIR combs, we additionally collect 5 interferograms in a 100 ms window, and average 5000 recurrences [upper inset of Fig. 2 (a)]. With multiple interferograms, we resolve the individual comb teeth, which are indicated by the circle markers in Fig. 2 (d). It should be noted that the disagreement with HITRAN2012 could arise from the imprecision of the database itself, for which methanol spectra were recorded with known discrepancies Harrison et al. (2012). Techniques such as ours could therefore be invaluable to resolving such issues.
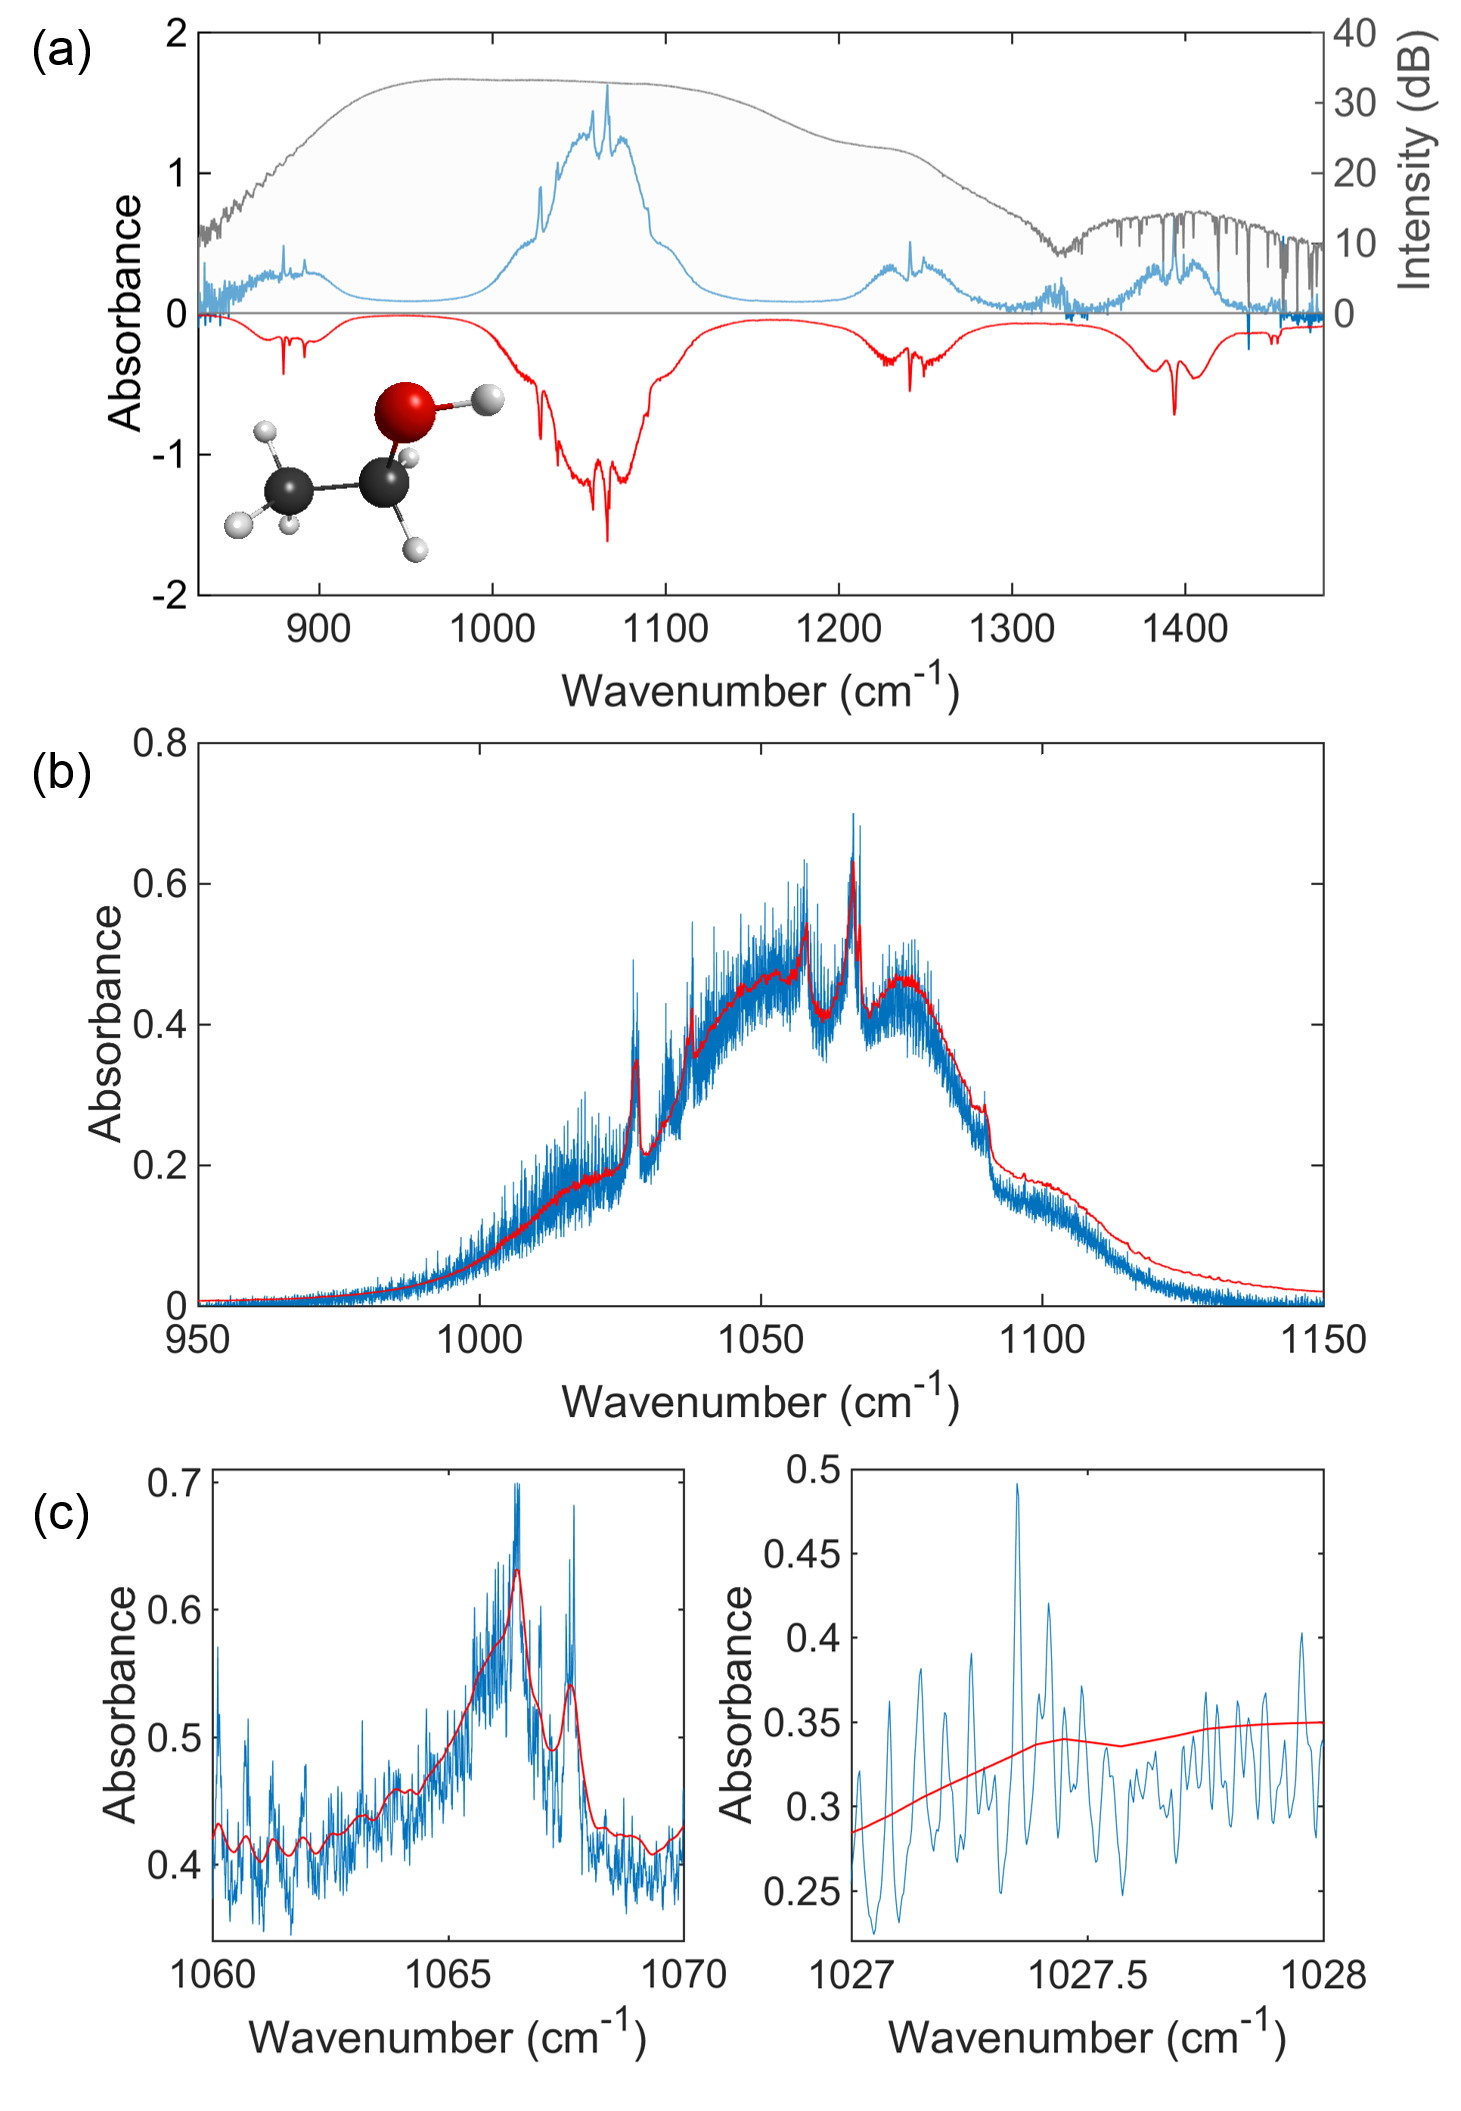
While the C-O stretch transition of methanol has been largely studied using high-resolution FTIR Xu et al. (2004); Harrison et al. (2012), we have found no high-resolution molecular fingerprint spectrum existing for ethanol, which exhibits four broad absorption bands across the fingerprint window. At atmospheric pressure, we can clearly resolve these four bands over a 700 cm-1 window, as shown in Fig. 3 (a) (blue spectrum). The measured absorbance spectrum agrees well with the low-resolution FTIR spectrum from the PNNL infrared database Sharpe et al. (2004) (red curve). To further resolve the individual ro-vibrational lines, we lower the background pressure to 10 mbar. This high resolution spectrum for the strongest absorption band at 1050 cm-1 is shown in Fig. 3 (b) (blue curve) along with the reference PNNL spectrum (red curve). Numerous ro-vibrational lines with sub-GHz linewidths become visible at this pressure and resolution. Fig. 3 (c) presents two spectral windows that contrast the level of resolution provided by the DCS technique in comparison to previous measurements. Furthermore, by characterizing the noise on the reference spectrum [black curve in 3 (a)] we estimate a signal-to-noise ratio of SNR=14 Hz1/2 for the modes within the central 300 cm-1 spectral width Sup . This yields a quality factor of , which is unparalleled for the fingerprint region and competitive with other DCS measurements performed in the near- and mid-infrared Coddington et al. (2016).
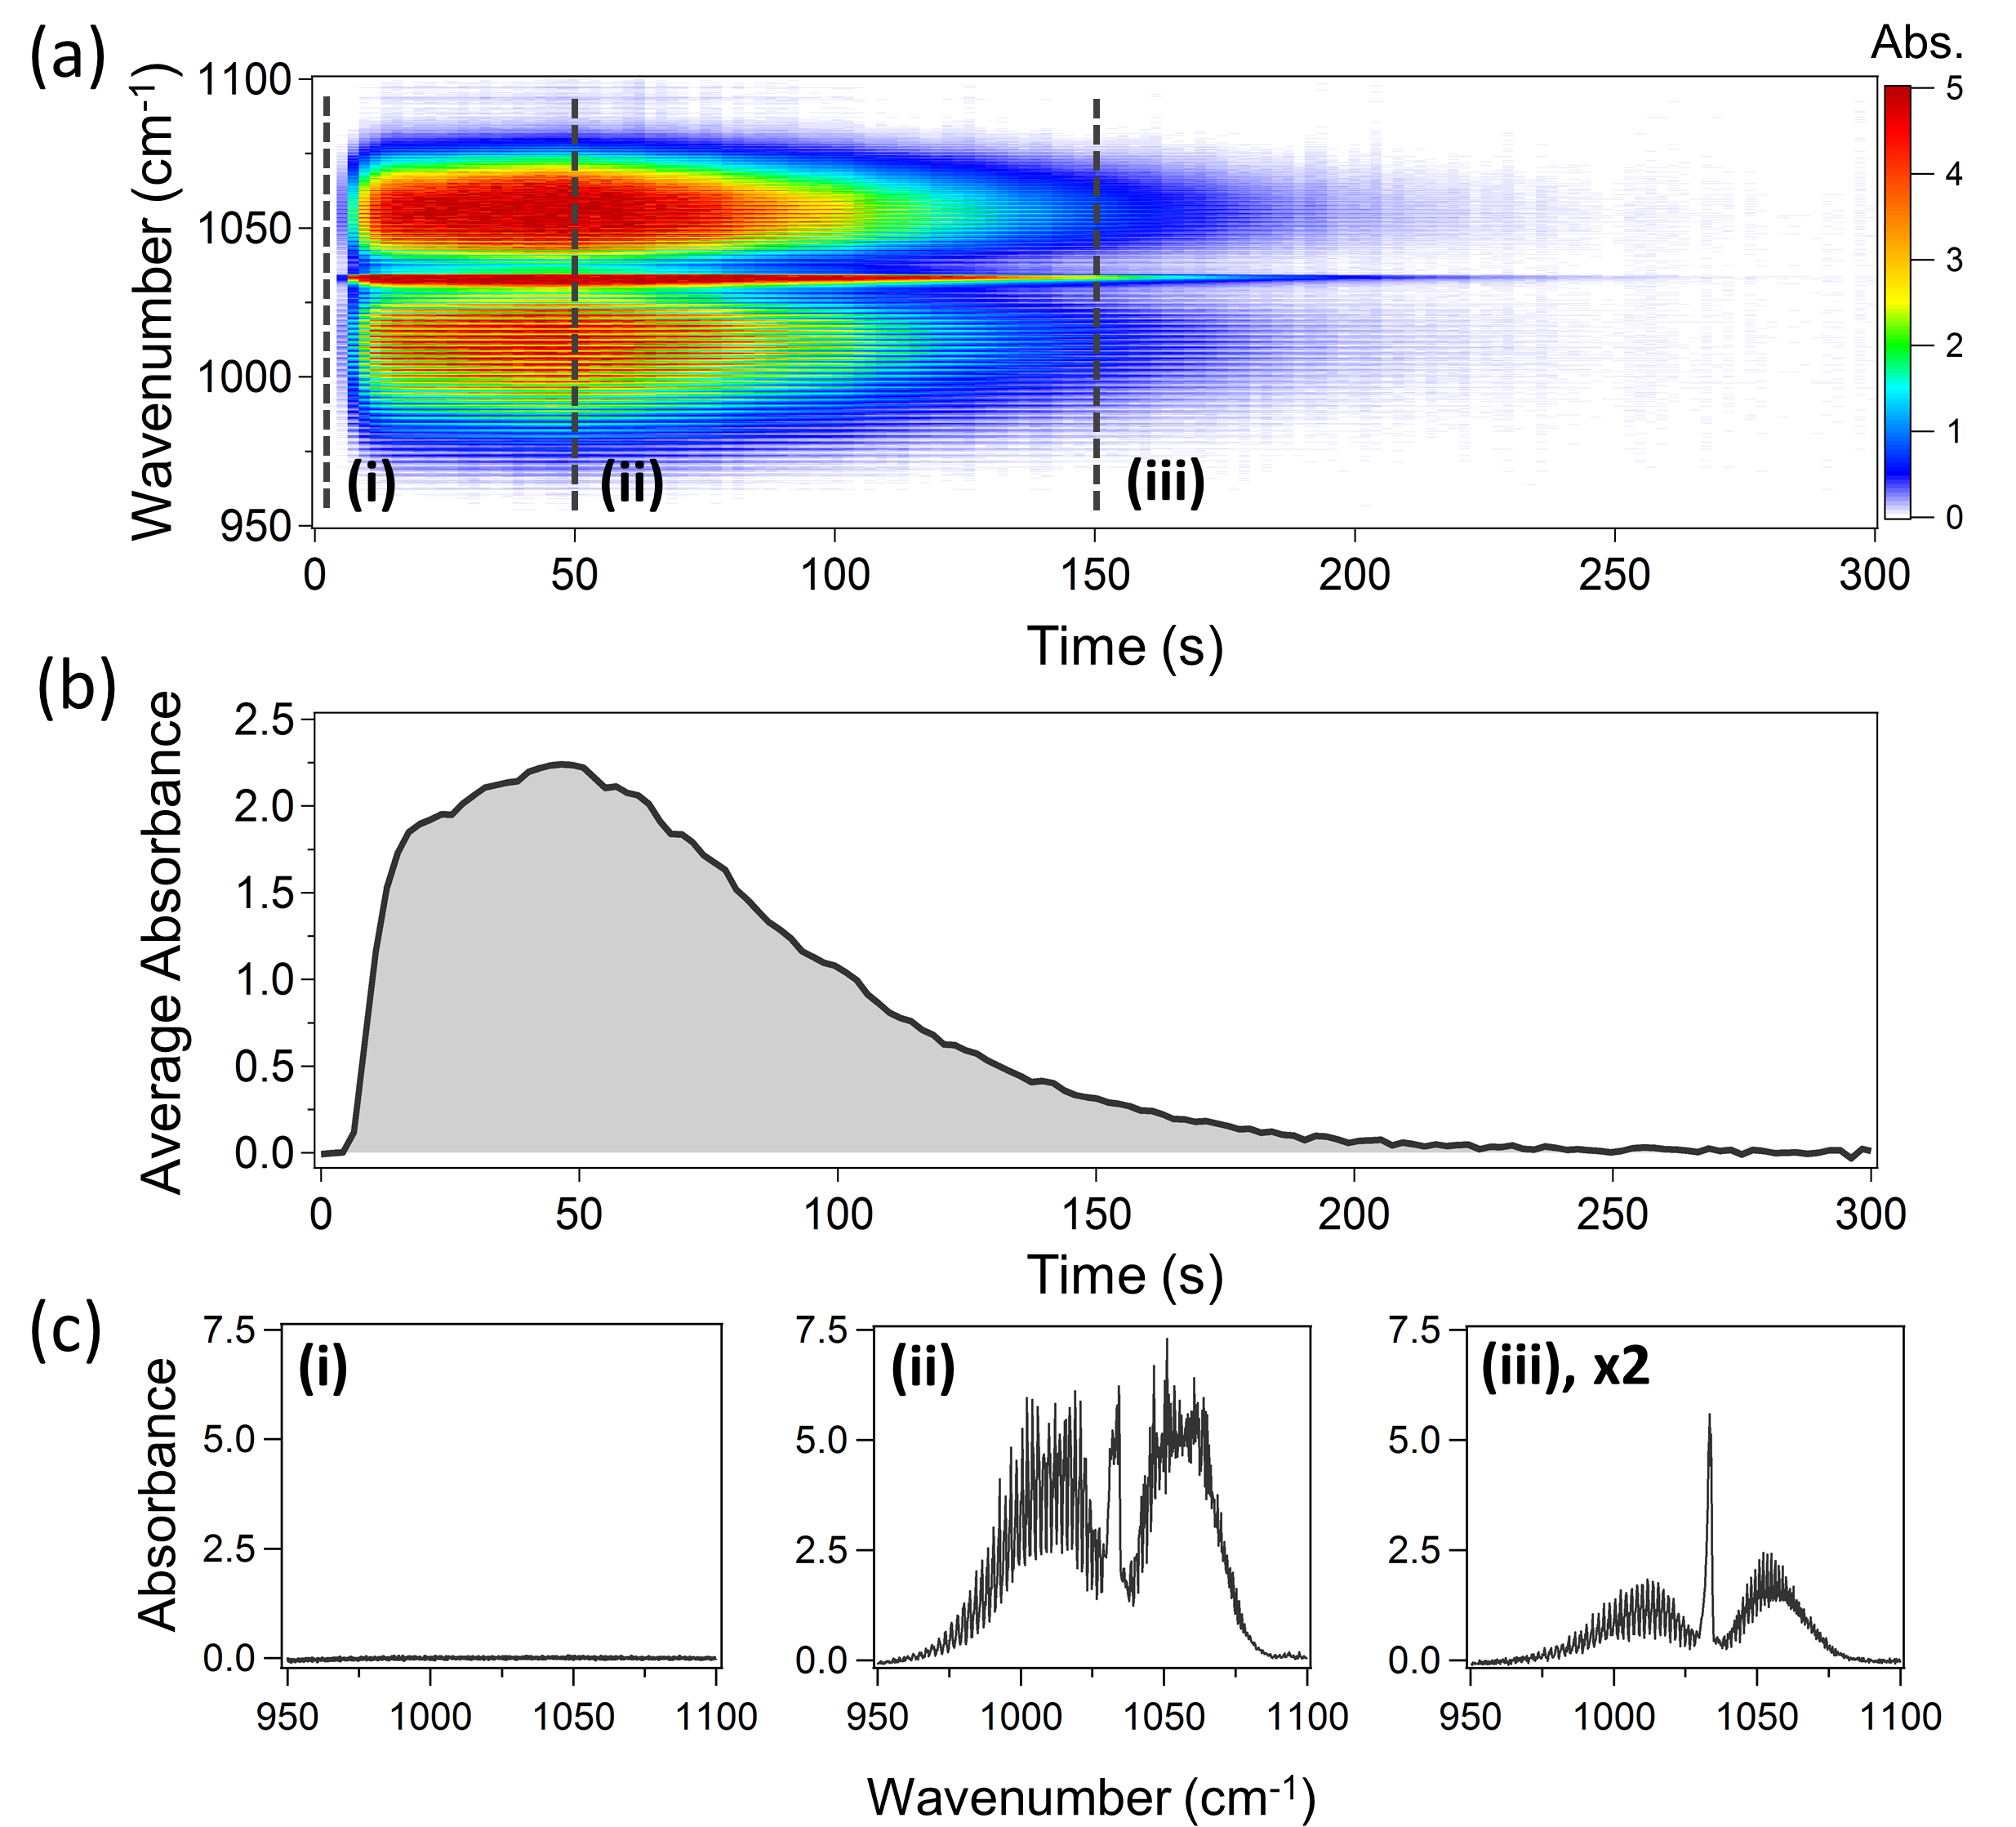
Due to the good SNR of the LWIR combs, DCS can be performed over fairly short averaging times. To demonstrate this, we collect a time series of DCS spectra averaged over 100 interferograms ( s averaging time) in Fig. 4 (a). We again use Hz, however, we reduce the DCS acquisition window to 285 s, corresponding to a spectral resolution of 7 GHz. In contrast to the static measurements of Fig. 2, here we place a drop of methanol into the open gas cell and record the methanol absorption spectrum as it evaporates. The total time series window is 350 s, during which we can capture the initial evaporation of the methanol leading to a local increase in the partial pressure of methanol as well as the slow diffusion of the vapor into the atmosphere. These dynamics are captured in the average absorbance plot in Fig. 4 (b). From this plot, we measure the time constants for the initial evaporation and the ensuing diffusion events to be s and s, respectively. This demonstrates that LWIR DCS can be used to monitor transient changes in absorption spectra on reaction timescales corresponding to a few seconds. Fig. 4 (c) plots absorbance spectra at various time points depicted by the dashed lines in Fig. 4 (b). Despite the fast acquisition time, we can still resolve the narrow absorption features of methanol with a signal-to-noise ratio of up to 100.
In conclusion, we present a robust scheme for generating super-octave spanning LWIR frequency combs driven by a robust, few-cycle Er-pump infrastructure. The combination of high resolution and fast acquisition DCS demonstrates the potential of these robust, low-noise LWIR combs for a wide range of molecular fingerprint applications, both in lab-based and field-based instruments. Going forward, we envision optically up-converting the LWIR combs via an electro-optical sampling scheme Huber et al. (2000); Pupeza et al. (2015); Riek et al. (2015, 2017), to implement LWIR spectroscopy without the need for cryogenically cooled HgCdTe photo-detectors.
This research was supported in part by the DARPA SCOUT program and the NIST Greenhouse Gas and Climate Science program. H. Timmers acknowledges support from the National Research Council. We thank J. Biegert, I. Coddington, F. Giorgetta, D. Hickstein, and N. Newbury for valuable comments and discussions. This work is a contribution of the U.S. Government and is not subject to copyright in the U.S.A.
References
- Griffiths and de Haseth (2007) P. Griffiths and J. de Haseth, Fourier Transform Infrared Spectrometry (John Wiley & Sons, Inc., 2007), 2nd ed.
- Schiller (2002) S. Schiller, Opt. Lett. 27, 766 (2002).
- Keilmann et al. (2004) F. Keilmann, C. Gohle, and R. Holzwarth, Opt. Lett. 29, 1542 (2004).
- Ideguchi et al. (2013) T. Ideguchi, S. Holzner, B. Bernhardt, G. Guelachvili, N. Picqué, and T. W. Hänsch, Nature 502, 355 (2013).
- Coddington et al. (2016) I. Coddington, N. Newbury, and W. Swann, Optica 3, 414 (2016).
- Bernhardt et al. (2009) B. Bernhardt, A. Ozawa, P. Jacquet, M. Jacquey, Y. Kobayashi, T. Udem, R. Holzwarth, G. Guelachvili, T. W. Hänsch, and N. Picqué, Nature Photonics 4, 55 (2009).
- Spaun et al. (2016) B. Spaun, P. B. Changala, D. Patterson, B. J. Bjork, O. H. Heckl, J. M. Doyle, and J. Ye, Nature 533, 517–520 (2016).
- Rieker et al. (2014) G. B. Rieker, F. R. Giorgetta, W. C. Swann, J. Kofler, A. M. Zolot, L. C. Sinclair, E. Baumann, C. Cromer, G. Petron, C. Sweeney, et al., Optica 1, 290 (2014).
- Schliesser et al. (2012) A. Schliesser, N. Picqué, and T. W. Hänsch, Nat. Photon. 6, 440 (2012).
- Erny et al. (2007) C. Erny, K. Moutzouris, J. Biegert, D. Kühlke, F. Adler, A. Leitenstorfer, and U. Keller, Opt. Lett. 32, 1138 (2007).
- Cruz et al. (2015) F. C. Cruz, D. L. Maser, T. Johnson, G. Ycas, A. Klose, F. R. Giorgetta, I. Coddington, and S. A. Diddams, Opt. Express 23, 246685 (2015).
- Lee et al. (2017) K. F. Lee, C. J. Hensley, P. G. Schunemann, and M. E. Fermann, Opt. Express 25, 17411 (2017).
- Adler et al. (2010) F. Adler, P. Maslowski, A. Foltynowicz, K. C. Cossel, T. C. Briles, I. Hartl, and J. Ye, Opt. Express 18, 21861 (2010).
- Leindecker et al. (2011) N. Leindecker, A. Marandi, R. L. Byer, and K. L. Vodopyanov, Opt. Ex. 19, 6296 (2011).
- Maidment et al. (2016) L. Maidment, P. G. Schunemann, and D. T. Reid, Opt. Lett. 41, 4261 (2016).
- Wang et al. (2009) C. Y. Wang, L. Kuznetsova, V. M. Gkortsas, L. Diehl, F. X. Kärtner, M. A. Belkin, A. Belyanin, X. Li, D. Ham, H. Schneider, et al., Opt. Ex. 17, 12929 (2009).
- Hugi et al. (2012) A. Hugi, G. Villares, S. Blaser, H. C. Liu, and J. Faist, Nature 492, 229 (2012).
- Hudson et al. (2017) D. D. Hudson, S. Antipov, L. Li, I. Alamgir, T. Hu, M. E. Amraoui, Y. Messaddeq, M. Rochette, S. D. Jackson, and A. Fuerbach, Optica 4, 1163 (2017).
- Yu et al. (2016) M. Yu, Y. Okawachi, A. G. Griffith, M. Lipson, and A. L. Gaeta, Optica 3, 854 (2016).
- Bonvalet et al. (1995) A. Bonvalet, M. Joffre, J. L. Martin, and A. Migus, Appl. Phys. Lett. 67, 2907 (1995).
- Huber et al. (2000) R. Huber, A. Brodschelm, F. Tauser, and A. Leitenstorfer, Appl. Phys. Lett. 76, 3191 (2000).
- Riek et al. (2015) C. Riek, D. V. Seletskiy, A. S. Moskalenko, J. F. Schmidt, P. Krauspe, S. Eckart, S. Eggert, G. Burkard, and A. Leitenstorfer, Science 350, 420 (2015).
- Riek et al. (2017) C. Riek, P. Sulzer, M. Seeger, A. S. Moskalenko, G. Burkard, D. V. Seletskiy, and A. Leitenstorfer, Nature 541, 376 (2017).
- Hale et al. (2000) D. D. S. Hale, M. Bester, W. C. Danchi, W. Fitelson, S. Hoss, E. A. Lipman, J. D. Monnier, P. G. Tuthill, and C. H. Townes, Astrophys. J. 537, 998 (2000).
- Kukura et al. (2007) P. Kukura, D. W. McCamant, and R. A. Mathies, Annu. Rev. Phys. Chem. 58, 461 (2007).
- Pollard et al. (2015) B. Pollard, F. C. B. Maia, M. B. Raschke, and R. O. Freitas, Nano Lett. 16, 55 (2015).
- Dazzi and Prater (2017) A. Dazzi and C. B. Prater, Chem. Rev. 117, 5146 (2017).
- (28) Online Supplementary Material.
- Rothman et al. (2013) L. S. Rothman, I. E. Gordon, Y. Babikov, A.Barbe, D. C. Benner, P. F. Bernath, M. Birk, L. Bizzocchi, V. Boudon, L. R. Brown, et al., J. Quant. Spectrosc. Radiat. Transfer 130, 4 (2013).
- Schunemann et al. (2016) P. G. Schunemann, K. T. Zawilski, L. A. Pomeranz, D. J. Creeden, and P. A. Budni, J. Opt. Soc. Am. B 33, D36 (2016).
- Harrison et al. (2012) J. J. Harrison, N. D. C. Allen, and P. F. Bernath, J. Quant. Spectrosc. Radiat. Transfer 113, 2189 (2012).
- Sharpe et al. (2004) S. W. Sharpe, T. J. Johnson, R. L. Sams, P. M. Chu, G. C. Rhoderick, and P. A. Johnson, Appl. Spectrosc. 58, 1452 (2004).
- Xu et al. (2004) L.-H. Xu, R. M. Lees, P. Wang, L. R. Brown, I. Kleiner, and J. W. C. Johns, J. Mol. Spectrosc. 228, 453 (2004).
- Pupeza et al. (2015) I. Pupeza, D. Sánchez, J. Zhang, N. Lilienfein, M. Seidel, N. Karpowicz, T. Paasch-Colberg, I. Znakovskaya, M. Pescher, W. Schweinberger, et al., Nature Photonics 9, 721–724 (2015).