139La and 63Cu NMR investigation of charge order in La2CuO4+y ( K)
Abstract
We report 139La and 63Cu NMR investigation of the successive charge order, spin order, and superconducting transitions in super-oxygenated La2CuO4+y single crystal with stage-4 excess oxygen order at K. We show that the stage-4 order induces tilting of CuO6 octahedra below , which in turn causes 139La NMR line broadening. The structural distortion continues to develop far below , and completes at K, where charge order sets in. This sequence is reminiscent of the the charge order transition in Nd co-doped La1.88Sr0.12CuO4 that sets in once the low temperature tetragonal (LTT) phase is established. We also show that the paramagnetic 63Cu NMR signals are progressively wiped out below due to enhanced low frequency spin fluctuations in charge ordered domains, but the residual 63Cu NMR signals continue to exhibit the characteristics expected for optimally doped superconducting CuO2 planes. This indicates that charge order in La2CuO4+y does not take place uniformly in space. In addition, unlike the typical second order magnetic phase transitions, low frequency Cu spin fluctuations as probed by 139La nuclear spin-lattice relaxation rate do not exhibit critical divergence at ()=42 K. These findings, including the spatially inhomogeneous nature of the charge ordered state, are qualitatively similar to the case of La1.885Sr0.115CuO4 [T. Imai et al., Phys. Rev. B 96 (2017) 224508, and A. Arsenault et al., Phys. Rev. B (submitted)], but both charge and spin order take place more sharply in the present case.
I Introduction
Recent success in detecting the charge order Bragg peaks in many different classes of high cuprates based on modern x-ray scattering techniques Comin and Damascelli (2016) has led to renewed interest in the charge order in La2CuO4-based cuprates. In the case of Nd3+ co-doped La1.48Nd0.4Sr0.12CuO4, in which Tranquada et al. initially discovered the charge order phenomenon Tranquada et al. (1995), charge order sets in at K only after the structural phase transition from the low temperature orthorhombic (LTO) to the low temperature tetragonal (LTT) phase takes place at K.
The LTT structure induced by Nd3+ severely suppresses from K to K. Accordingly, many researchers speculated early on that charge order is a byproduct of the LTT structure with low and hence absent in the superconducting CuO2 planes, despite our early NMR reports that even superconducting La1.885Sr0.115CuO4 ( K) with the LTO structure exhibits nearly identical NMR anomalies observed at the charge order transition of La1.48Nd0.4Sr0.12CuO4 Hunt et al. (1999); Singer et al. (1999); Hunt et al. (2001); Service (1999). Recent confirmation of the existence of charge order Bragg peaks in La1.885Sr0.115CuO4 Croft et al. (2014); Thampy et al. (2014); He et al. (2017) finally settled the two decades old controversy.
On the other hand, these latest x-ray scattering work on La1.885Sr0.115CuO4 also revealed that charge order sets in gradually starting from as high as K Croft et al. (2014); Thampy et al. (2014); He et al. (2017), indicating that our initial NMR report of K Hunt et al. (1999) overlooked the gradual onset. Therefore, we recently revisited 63Cu Imai et al. (2017) and 139La NMR Arsenault et al. (2018) evidence for charge order in La1.885Sr0.115CuO4. We demonstrated that the normal 63Cu NMR signals is gradually wiped out below K, and the lost spectral weight is transferred to a wing-like anomalous 63Cu NMR signal with extremely fast NMR relaxation rates. The transverse relaxation time of the wing-like signal is so short that one can detect it only with the NMR pulse separation time shorter than s. Our NMR results confirmed that charge order does not proceed uniformly in space in La2CuO4-based cuprates Hunt et al. (1999), and a diminishing fraction of CuO2 planes remains unaffected by charge order even at K.
These recent developments raised a new question. Why is K in orthorhombic La1.885Sr0.115CuO4 even higher than K of La1.48Nd0.4Sr0.12CuO4? Do the LTT structure and/or disorder induced by Nd3+ substitution play a role? Clearly, we need more investigations to understand the structural effects on charge order.
The latest addition in the growing list of charge ordered cuprates is the super-oxygenated La2CuO4+y () with K as determined by x-ray diffraction Zhang et al. ; He et al. (2017). La2CuO4+y undergoes simultaneous superconducting and spin density wave (SDW) order at K Lee et al. (1999); Savici et al. (2002) within the charge ordered state, similarly to La1.885Sr0.115CuO4 with K Kimura et al. (1999) and K Croft et al. (2014); Thampy et al. (2014); He et al. (2017). Unlike the La2CuO4-based materials substituted by Sr2+ or Ba2+, it is the excess O2- ions located at the interstitial sites that donate holes into CuO2 planes Jorgensen et al. (1988); Chou et al. (1992); Wells et al. (1996, 1997); Lee et al. (1999); Khaykovich et al. (2002, 2003); Jorge et al. (2004). These O2- ions are highly mobile near room temperature, and form a stage-4 superstructure below K Wells et al. (1996, 1997). In the stage-4 ordered phase, interstitial O2- ions occupy LaO layers separated by four CuO2 planes, and create anti-phase domain boundaries for the tilting direction of CuO6 octahedra Wells et al. (1997). Upon further cooling, O2- ions lose mobility around K Kremer et al. (1993) and develop a superstructure within the plane Wells et al. (1997). Unlike the quenched disorder induced by Sr2+ or Ba2+ substitution, super-oxygenated La2CuO4+y therefore possesses unique, annealed disorder Wells et al. (1997).
In this paper, we report 139La and 63Cu NMR study of a La2CuO4+y () single crystal, taking full advantage of the unique characteristics of NMR as a local probe. We identify NMR anomalies associated with the stage-4 oxygen order at K and K. We show that, at the slow observation time scale of NMR, some 139La sites remain unaffected by the stage-4 order down to K. This may be an indication that the stage-4 order plays an analogous role as the LTT structural transition in La1.48Nd0.4Sr0.12CuO4 Tranquada et al. (1995) and La1.88Ba0.12CuO4 Fujita et al. (2004), in which charge order does not set in until the LTT structure is established below . We also show that charge order does not proceed homogeneously in space. Nearly 1/3 of the volume fraction of the CuO2 planes is still unaffected by charge order at , and exhibits NMR properties expected for canonical superconducting CuO2 planes.
II Experimental
We super-oxygenated a single crystal of La2CuO4 using the electrochemical doping technique Chou et al. (1992); Lee et al. (1999). We determined the superconducting critical temperature K of our crystal with the Superconducting Quantum Interference Device (SQUID). Both elastic neutron scattering Lee et al. (1999) and SR Savici et al. (2002) measurements found the onset of the spin density wave order at () K for a different piece of crystal cut from the same boule. Unlike the case of lower excess O2- composition Hammel et al. (1993), we did not find evidence for a phase separation into antiferromagnetic and superconducting domains in the 139La NMR lineshape nor the bulk susceptibility data.
We used a piece of single crystal with the approximate dimensions of mm for our NMR measurements. We conducted all the NMR measurements at M.I.T. between 1997 and 1999 using the NMR spectrometer built with a Tecmag Aries console. The Aries was a state-of-the-art NMR system at the time, but the spectrometer dead time to 10 s caused by the ring down was very long in today’s standard. Accordingly, we conducted all the NMR measurements with s or longer, and hence we were unable to detect the wing-like 63Cu NMR signals that we recently discovered in the charge ordered state of La1.885Sr0.115CuO4 Imai et al. (2017); the wing-like NMR signal has extremely fast and relaxation rates, and its detection requires much shorter spectrometer dead time ( to 4 s).
III Results and Discussions
III.0.1 Stage-4 order as probed by 139La NMR
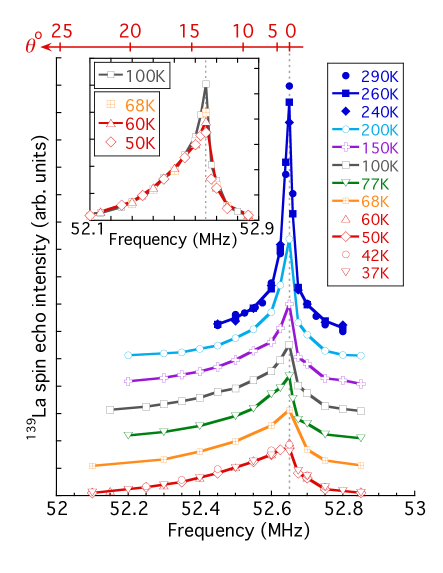
In Fig. 1, we summarize 139La NMR lineshape observed for the nuclear spin to -1/2 central transition in an external magnetic field T applied along the crystal c-axis. At 295 K, the peak frequency is MHz and the linewidth is as narrow as MHz. Using the nuclear gyromagnetic ratio MHz/T, we estimate the apparent NMR frequency shift to be as small as %, as expected for non-magnetic ions with closed shells and with a negligibly small second order nuclear quadrupole shift by the electric field gradient (EFG). The latter implies that CuO6 octahedra are not statically tilted away from the main principal axis of the EFG tensor along the c-axis above . These 139La NMR results are also generic in the high temperature tetragonal (HTT) structure of La2-xSrxCuO4 Thurber et al. (1997); Imai and Hirota ; Arsenault et al. (2018).
The 139La NMR lineshape gradually broadens below the stage-4 order at K Wells et al. (1997). In such a stage-4 structure, the elongated axis of the CuO6 octahedra are statically tilted away from the crystal c-axis with a significant distribution in the tilting angle. This tilting results in negative values of the second order nuclear quadrupole shift , and hence the line broadening. The NMR lineshape remains fairly narrow down to K, presumably due to the motional narrowing effect caused by the slow motion of O2- ions. As the excess O2- ions lose their mobility Kremer et al. (1993) and develop a superstructure within the plane Wells et al. (1997); Xiong et al. (1996) near and below K, a broad, sawtooth shaped NMR line emerges underneath the narrow peak at with a distribution up to MHz.
Ignoring the small asymmetry in the EFG tensor (because the first order quadrupole satellite peaks do not split when we apply within the ab-plane), we may write ), where the nuclear quadrupole frequency MHz as determined from the splitting between the first order quadrupolar satellite peaks at 45 K, and represents the angle between the external field applied along the crystal c-axis and the main principal axis of the EFG tensor at the 139La sites. Thus the saw-tooth shaped NMR lineshape observed below K may be considered as a histogram of the static tilting angle , as shown by the upper horizontal axis of Fig. 1. We find that the most probable remains 0∘ but reaches for the low frequency end of the spectrum.
Another important point to notice is that the needle-like, sharp central peak located at at 295 K remains visible on top of the broad, saw-tooth shaped lineshape down to K. This means that, when averaged over the NMR measurement time scale, CuO6 octahedra in some domains remain untilted far below and down to K. The half-width of the lineshape observed at the onset of charge order at 60 K, MHz, is nearly identical with that of La1.885Sr0.115CuO4 ( MHz) observed at its charge order temperature K Arsenault et al. (2018). This means that the tilting angle distribution is comparable between La2CuO4+y and La1.885Sr0.115CuO4. The 139La NMR lineshape in the latter, however, is nearly symmetrical with a Gaussian shape below K, and its peak is shifted from . The central value of the tilting angle is therefore non-zero in the case of La1.885Sr0.115CuO4.
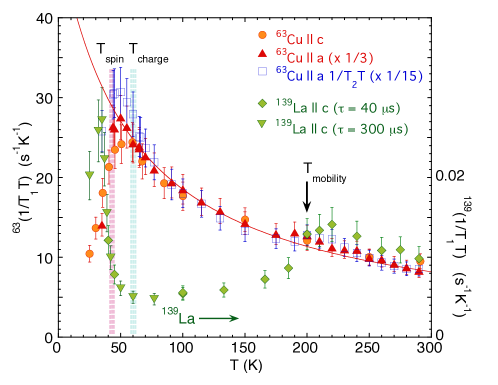
In Fig. 2, we summarize the temperature dependence of the nuclear spin-lattice relaxation rate divided by temperature measured at . The relaxation process showed a noticeable distribution due to the quadrupole relaxation effects induced by the motion of O2- ions as well as by the distribution of Cu spin fluctuation frequency scales. Accordingly, we estimated based on the force fit of the recovery data to the appropriate fitting function with multiple normal modes Narath (1967). thus deduced generally captures the volume averaged behavior of spin dynamics of La2CuO4-based cuprates very well. exhibits a broad hump centered somewhat above K. We attribute the enhancement of to the slow fluctuations of the EFG caused by the motion of O2- and dynamic distortion of the lattice. The EFG contribution to takes the maximum value when the fluctuation frequency of the EFG slows down and becomes comparable to the NMR frequency. continues to decrease below as the fluctuation gradually diminishes. Analogous enhancement of NMR relaxation rates are commonly observed in ionic conductors. For example, the slow motion of Na+ ions in the battery material Na1-xCoO2 enhances at Na+ sites dramatically near room temperature Weller et al. (2009).
III.0.2 Low frequency Cu spin dynamics
In general, probes the wave vector q integral of the dynamical electron spin susceptibility at the NMR frequency . begins to grow rather sharply below . Since a magnetic long range order is known to set in at K at the time scale of elastic neutron scattering Lee et al. (1999) and SR measurements Savici et al. (2002), our results indicate that charge order triggers enhancement of low frequency Cu spin fluctuations, as noted before Hunt et al. (1999, 2001). This enhancement is commonly observed for the charge ordered La2CuO4-based superconductors Hunt et al. (1999); Imai and Hirota ; Hunt et al. (2001); Mitrović et al. (2008); Baek et al. (2015); Imai et al. (2017); Arsenault et al. (2018). Inelastic neutron scattering measurements with low energy transfer also provide additional evidence for enhanced spin excitations below in La2CuO4+y Lee et al. (1999), as well as in La1.48Nd0.4Sr0.12CuO4 Tranquada et al. (1999), La1.88Ba0.12CuO4 Fujita et al. (2004), and La1.885Sr0.115CuO4 Rømer et al. (2013). Neutron scattering, however, probes only the bulk averaged behavior of spin excitations by integrating the signals from the entire volume of the samples. We will come back to this point below.
In Fig. 2, we also present measured at the peak of the 63Cu NMR lineshape observed for the nuclear spin to -1/2 central transition in Fig. 3(a) and (b). Since the magnetic hyperfine interaction of the 63Cu nuclear spin with Cu electron spins Tsuda et al. (1988); Mila and Rice (1989) is nearly two orders of magnitude larger than that of 139La nuclear spins Nishihara et al. (1987), the overall magnitude of at K is greater by four orders of magnitude. Accordingly, the contribution of the fluctuating EFG to the spin-lattice relaxation process is relatively small. We observed only a small hump of near .
Turning our attention to the low temperature region deep inside the stage-4 ordered state, we note that increases smoothly down to obeying a Curie-Weiss law, which is indicative of the growth of antiferromagnetic spin correlations commonly observed in superconducting cuprates Imai et al. (1988); Barrett et al. (1990); Millis et al. (1990); Ohsugi et al. (1994); Imai et al. (2017). begins to dive down at without exhibiting a Hebel-Slichter coherence peak. This behavior is also prototypical of the d-wave superconductors Imai et al. (1988); Ishida et al. (1989).
Thus, the results (except for a small hump near ) are representative of the canonical behavior expected for optimally doped high superconductors both above and below with no hints of anomalies associated with charge and spin orders. In contrast, begins to increase below and shows a maximum at K. This indicates that Cu spin fluctuations averaged over the entire volume of the sample are slowing down to the time scale of NMR measurements at K. How can we reconcile the apparent contradiction between and results?
The key to understanding the dichotomy is that and do probe the same parts of the CuO2 plane. As noted earlier Hunt et al. (1999); Singer et al. (1999); Hunt et al. (2001); Imai et al. (2017); Arsenault et al. (2018) and explained in detail in the next section, the 63Cu NMR signal intensity is gradually wiped out below , and hence in Fig. 2 reflects only the behavior of Cu electrons in a shrinking volume fraction of CuO2 planes which has not been affected by charge order. In contrast, the 139La NMR signal intensity is conserved through owing to the very small hyperfine interactions with Cu electron spins, and hence probes the average behavior of the entire CuO2 planes.
III.0.3 NMR signal intensity anomaly below
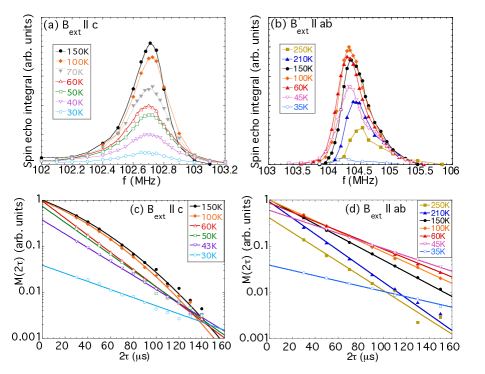
In Fig. 3(a), we summarize the representative 63Cu NMR lineshapes observed for the to -1/2 central transition in T applied along the c-axis. We multiplied the spin echo intensity with temperature to account for the effect of the Boltzmann factor on the overall intensity. The c-axis 63Cu NMR linewidth grows with decreasing temperature, similarly to the Curie-Weiss behavior of observed for La1.885Sr0.115CuO4 Imai et al. (2017). The integrated intensity is proportional to the number of nuclear spins detected, and conserved between 150 K and 100 K.
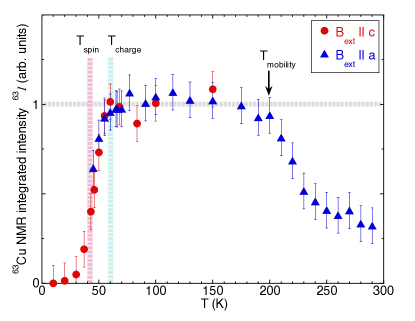
The integrated intensity of the lineshape appears to decrease progressively below 100 K down to K, but it is simply because the transverse nuclear spin-spin relaxation becomes faster toward . As shown in Fig. 3(c), the Gaussian curvature of the spin echo decay observed at 100 K and 150 K disappears, and the spin echo decay observed above s becomes Lorentzian (i.e. exponential) at Tou et al. (1992); Hunt et al. (1999). For this reason, when we measure the 63Cu NMR lineshape using the same pulse separation time s, the intensity appears smaller at than at 100 K. We can eliminate the influence of the transverse relaxation process on the integrated intensity, by extrapolating the spin echo decay curves in Fig. 3(c) to . The integrated intensity in the limit of maintains a constant value down to , as summarized in Fig. 4.
Below , however, the situation is very different. Even if we extrapolate the spin echo decay to and eliminate the transverse relaxation effect in the intensity, sharply decreases in the charge ordered state. We confirmed that the integrated intensity of 139La NMR lineshape is conserved even below , and hence the reduction of below down to is not an experimental artifact.
In our recent comprehensive 63Cu NMR study of La1.885Sr0.115CuO4, we used our state-of-the-art NMR spectrometer to investigate the NMR properties for a wide range of between 2 s and 30 s Imai et al. (2017). We demonstrated that 63Cu NMR properties show unprecedentedly strong dependence on below K. We also confirmed that the 63Cu NMR integrated intensity of the narrow central peak is gradually wiped out below , because the missing spectral weight is transferred to a very broad, wing-like 63Cu NMR signal that appears symmetrically on both sides of the narrow central peak. The wing-like signal from the charge ordered segments of the CuO2 planes has very fast and , and can be detected only with extremely short s.
Also summarized in Fig. 3(b) are the 63Cu NMR lineshapes observed in T applied along the crystal a-axis. The spin echo decay is always Lorentzian in this field geometry as summarized in Fig. 4(d), because the Gaussian term induced by the indirect nuclear spin-spin coupling effect is motionally narrowed Pennington et al. (1989). We plot the temperature dependence of the Lorentzian divided by in Fig. 2 for comparison with . Since the Redfield contribution of the longitudinal relaxation process to the Lorentzian term is proportional to Pennington et al. (1989) and the contribution of the indirect spin-spin coupling term to in the scaling limit, where is the spin-spin correlation length Sokol and Pines (1993), the observed temperature dependence of is very similar to that of .
We extrapolated the exponential spin echo decay to in Fig. 3(d), and estimated the temperature dependence of for in Fig. 4. decreases above , because the hopping motion of oxygen ions wipe out the 63Cu NMR signals. This is typical for ionic conductors. In addition, decreases below , in agreement with the results for the geometry. In our recent measurements of La1.885Sr0.115CuO4 with the geometry (see Appendix B in Imai et al. (2017)), we were able to observe initial quick spin echo decay from to 10 s arising from the nuclear spins that appear as the wing-like signal for the geometry. It is their contribution that is missing below in Fig. 4.
Since the configuration has one less fitting parameters in the extrapolation of the spin echo decay curves to , the data for are less scattered than . Moreover, the geometry is free from the uncertainties in the extrapolation caused by the residual Gaussian curvature that manifests itself only for extremely short Imai et al. (2017). In fact, the onset of charge order K in Fig. 4 agrees very well with the recent x-ray scattering reports He et al. (2017); Zhang et al. . The downside of the geometry is that the large superconducting critical field makes NMR signal detection nearly impossible below . Overall, our results of below are very similar to the case of La1.885Sr0.115CuO4 Imai et al. (2017), except that charge order in the present case takes place more quickly once it sets in.
To understand the origin of the intensity anomaly in Fig. 4, it is useful to recall that 63Cu NMR signals in typical high cuprates has a large s-1. Enhancement of spin correlations by a factor of is sufficient to make 63Cu NMR spin echo signals nearly unobservable due to extremely fast relaxation rates, unless we resort to s using modern NMR spectrometers. That is why, for example, our earlier 63Cu NQR measurements in the paramagnetic state of La2CuO4 covered the temperature range only down to K, where reaches s-1 Imai et al. (1993a, b); the spin echo signal cannot be detected when , and hence , becomes so fast. In fact, our recent 63Cu NMR study of La1.885Sr0.115CuO4 showed that measured for the aforementioned wing-like NMR signal arising from charge ordered domains is times enhanced compared with the normally behaving residual 63Cu NMR signals below .
Our consideration in the previous paragraph provides the key to reconciling the dichotomy exhibited by qualitatively different and in Fig. 2. The former reflects only the diminishing volume fraction of CuO2 planes that has not been affected by charge order below . In other words, our NMR results imply that charge order makes the CuO2 planes extremely inhomogeneous in La2CuO4+y as well as in La1.885Sr0.115CuO4. The charge ordered segments of CuO2 planes have enhanced NMR relaxation rates, and they no longer contribute to the 63Cu NMR lineshapes nor measured for the observable signals. In contrast, 139La NMR intensity is conserved except below , where superconducting shielding effects limit the overall signal intensity. Therefore, probes the average behavior of the entire CuO2 planes. Likewise, the enhancement of the inelastic neutron scattering signals with low energy transfer below probably originates from enhanced spin correlations in charge ordered domains.
IV Summary and Conclusions
In this paper, we described the previously unpublished NMR data to shed a new light on the interplay between the stage-4 excess O2- order, charge order, spin order, and superconductivity in La2CuO4+y. Our NMR results show that La2CuO4+y exhibit very peculiar NMR anomalies at K, which we identified first at the charge order transition of the Nd co-doped La1.48Nd0.4Sr0.12CuO4 Hunt et al. (1999). Recent x-ray scattering experiments indeed detected the charge order Bragg peaks successfully below K. We note that we had pointed out the possibility of a charge order transition in La2CuO4+y in Lee et al. (1999) based on the present NMR data.
We demonstrated that the structural distortion associated with the spatial order of the mobile O2- ions slow down to the NMR measurement time scale below K and alter the 139La NMR lineshape. The static distortion of the lattice, however, does not complete down to K. Once charge order sets in, the transition reflected on NMR data is sharp, similarly to the case of charge order in La1.48Nd0.4Sr0.12CuO4 and La1.88Ba0.12CuO4 that sets in immediately after the LTT structure is established Hunt et al. (1999); Singer et al. (1999); Hunt et al. (2001). In contrast, charge order transition that takes place in the LTO structure of La1.885Sr0.115CuO4 is much more gradual, although the onset temperature is as high as K. It suggests that the static LTT structure is not essential for charge order in La2CuO4-based cuprates. We recall that conventional charge density wave order in NbSe2 nucleates near the defects at much higher temperatures than the bulk charge density wave transition Arguello et al. (2014). La1.885Sr0.115CuO4 must be less disordered than La1.48Nd0.4Sr0.12CuO4 and possibly La2CuO4+y, and defects and/or domain boundaries in the cleaner CuO2 planes may be playing analogous roles as those in NbSe2.
139La and 63Cu NMR properties in La2CuO4+y observed near and below are qualitatively the same as those previously observed for other charge ordered La2CuO4-based cuprates Hunt et al. (1999); Singer et al. (1999); Hunt et al. (2001); Imai et al. (2017); Arsenault et al. (2018). We emphasize that charge order in this and other La2CuO4-based cuprates does not take place uniformly in space; the fact that 63Cu NMR signals from some segments are observable yet other segments become unobservable due to enhanced spin correlations in this and other La2CuO4-based cuprates implies that the charge ordered state is electronically very inhomogeneous. Even far below , some segments of CuO2 planes remain unaffected by charge order and subsequent spin order at K. The NMR properties in these domains are similar to those observed for optimally doped superconducting CuO2 planes. It is important to note that when the superconducting transition and spin order set in simultaneously at 42 K, of 63Cu NMR signals are still observable with properties very similar to those of optimally doped superconducting phase La1.85Sr0.15CuO4. We recently reported detailed characterization of the analogous two component behavior of the CuO2 planes for La1.885Sr0.115CuO4 Imai et al. (2017); Arsenault et al. (2018), in which the volume fraction under the influence of enhanced spin correlations reach % at K. We refer readers to Kivelson et al. (2001) for possible theoretical implications of these experimental findings, in particular the relation between the competing order and the volume fractions of the competing phases.
Unlike the typical second order magnetic phase transitions, does not diverge at K, where elastic neutron scattering detect the onset of spin order. This means that the spin fluctuations do not slow down to the NMR measurement time scale at K in most of the sample volume. exhibits a broad hump at K instead, signaling that on average, spin fluctuations slow down to the NMR frequency at a temperature much lower than the onset of spin order. We note that peaks at much lower temperature, K, in the case of La1.885Sr0.115CuO4. Thus both the charge and spin orders in the present case take place much more sharply than in La1.885Sr0.115CuO4. Finally, we recall that earlier SR measurements detected the onset of static spin order at K in some volume of the sample, but the volume fraction of the statically spin density wave ordered phase at the SR time scale is less than % even at K Savici et al. (2002). Thus our finding does not contradict with the SR results.
V Acknowledgement
T. I. thanks K. M. Shen and A. W. Hunt for their assistance in NMR data acquisition in the early stage of this work, and B. O. Wells and S. A. Kivelson for their helpful communications during the course of preparing the manuscript. All the NMR measurements were conducted at M.I.T. between 1997 and 1999 with the financial support by NSF DMR 96-23858 and NSF DMR 98-08941. The work at McMaster was financially supported by NSERC and CIFAR. The work at Stanford and SLAC was supported by the U.S. Department of Energy (DOE), Office of Science, Basic Energy Sciences, Materials Sciences and Engineering Division, under Contract No. DE-AC02-76SF00515.
References
- Comin and Damascelli (2016) R. Comin and A. Damascelli, Ann. Rev. of Cond. Matt. Phys. 7, 369 (2016).
- Tranquada et al. (1995) J. M. Tranquada, B. J. Sternlieb, J. D. Axe, Y. Nakamura, and S. Uchida, Nature 375, 561 (1995).
- Hunt et al. (1999) A. W. Hunt, P. M. Singer, K. R. Thurber, and T. Imai, Phys. Rev. Lett. 82, 4300 (1999).
- Singer et al. (1999) P. M. Singer, A. W. Hunt, A. F. Cederström, and T. Imai, Phys. Rev. B 60, 15345 (1999).
- Hunt et al. (2001) A. W. Hunt, P. M. Singer, A. F. Cederström, and T. Imai, Phys. Rev. B 64, 134525 (2001).
- Service (1999) R. Service, Science 283, 1116 (1999).
- Croft et al. (2014) T. P. Croft, C. Lester, M. S. Senn, A. Bombardi, and S. M. Hayden, Phys. Rev. B 89, 224513 (2014).
- Thampy et al. (2014) V. Thampy, M. P. M. Dean, N. B. Christensen, L. Steinke, Z. Islam, M. Oda, M. Ido, N. Momono, S. B. Wilkins, and J. P. Hill, Phys. Rev. B 90, 100510 (2014).
- He et al. (2017) W. He, Y. S. Lee, and M. Fujita, (2017), unpublished.
- Imai et al. (2017) T. Imai, S. K. Takahashi, A. Arsenault, A. W. Acton, D. Lee, W. He, Y. S. Lee, and M. Fujita, Phys. Rev. B 96, 224508 (2017).
- Arsenault et al. (2018) A. Arsenault, S. K. Takahashi, T. Imai, W. He, Y. S. Lee, and M. Fujita, Phys. Rev. B 97, 064511 (2018).
- (12) Z. Zhang et al., arXiv:1707.04367.
- Lee et al. (1999) Y. S. Lee, R. J. Birgeneau, M. A. Kastner, Y. Endoh, S. Wakimoto, K. Yamada, R. W. Erwin, S.-H. Lee, and G. Shirane, Phys. Rev. B 60, 3643 (1999).
- Savici et al. (2002) A. T. Savici, Y. Fudamoto, I. M. Gat, T. Ito, M. I. Larkin, Y. J. Uemura, G. M. Luke, K. M. Kojima, Y. S. Lee, M. A. Kastner, R. J. Birgeneau, and K. Yamada, Phys. Rev. B 66, 014524 (2002).
- Kimura et al. (1999) H. Kimura, K. Hirota, H. Matsushita, K. Yamada, Y. Endoh, S.-H. Lee, C. F. Majkrzak, R. Erwin, G. Shirane, M. Greven, Y. S. Lee, M. A. Kastner, and R. J. Birgeneau, Phys. Rev. B 59, 6517 (1999).
- Jorgensen et al. (1988) J. D. Jorgensen, B. Dabrowski, S. Pei, D. G. Hinks, L. Soderholm, B. Morosin, J. E. Schirber, E. L. Venturini, and D. S. Ginley, Phys. Rev. B 38, 11337 (1988).
- Chou et al. (1992) F. C. Chou, J. H. Cho, and D. C. Johnston, Physica C 197, 303 (1992).
- Wells et al. (1996) B. Wells, R. J. Birgeneau, F. C. Chou, Y. Endoh, D. C. Johnston, M. A. Kastner, Y. Lee, G. Shirane, J. M. Tranquada, and K. Yamada, Z. Physics B 100, 535 (1996).
- Wells et al. (1997) B. O. Wells, Y. S. Lee, M. A. Kastner, R. J. chrisianson, R. J. Birgenau, K. Yamada, Y. Endoh, and G. Shirane, Science 277, 1067 (1997).
- Khaykovich et al. (2002) B. Khaykovich, Y. S. Lee, R. W. Erwin, S.-H. Lee, S. Wakimoto, K. J. Thomas, M. A. Kastner, and R. J. Birgeneau, Phys. Rev. B 66, 014528 (2002).
- Khaykovich et al. (2003) B. Khaykovich, R. J. Birgeneau, F. C. Chou, R. W. Erwin, M. A. Kastner, S.-H. Lee, Y. S. Lee, P. Smeibidl, P. Vorderwisch, and S. Wakimoto, Phys. Rev. B 67, 054501 (2003).
- Jorge et al. (2004) G. A. Jorge, M. Jaime, L. Civale, C. D. Batista, B. L. Zink, F. Hellman, B. Khaykovich, M. A. Kastner, Y. S. Lee, and R. J. Birgeneau, Phys. Rev. B 69, 174506 (2004).
- Kremer et al. (1993) R. K. Kremer, V. Hizhnyakov, E. Sigmund, A. Simon, and K. A. Müller, Z. Physik B 91, 169 (1993).
- Fujita et al. (2004) M. Fujita, H. Goka, K. Yamada, J. M. Tranquada, and L. P. Regnault, Phys. Rev. B 70, 104517 (2004).
- Hammel et al. (1993) P. C. Hammel, A. P. Reyes, S.-W. Cheong, Z. Fisk, and J. E. Schirber, Phys. Rev. Lett. 71, 440 (1993).
- Thurber et al. (1997) K. R. Thurber, A. W. Hunt, T. Imai, F. C. Chou, and Y. S. Lee, Phys. Rev. Lett. 79, 171 (1997).
- (27) T. Imai and K. Hirota, Unpublished 63Cu, 139La, and 17O NMR work on a La1.885Sr0.115CuO4 single crystal presented first at the Aspen Winter Conference on Quantum Criticality (January 1999).
- Xiong et al. (1996) X. Xiong, P. Wochner, S. C. Moss, Y. Cao, K. Koga, and N. Fujita, Phys. Rev. Lett. 76, 2997 (1996).
- Narath (1967) A. Narath, Phys. Rev. 162, 320 (1967).
- Weller et al. (2009) M. Weller, A. Sacchetti, H. R. Ott, K. Mattenberger, and B. Batlogg, Phys. Rev. Lett. 102, 056401 (2009).
- Mitrović et al. (2008) V. F. Mitrović, M.-H. Julien, C. de Vaulx, M. Horvatić, C. Berthier, T. Suzuki, and K. Yamada, Phys. Rev. B 78, 014504 (2008).
- Baek et al. (2015) S.-H. Baek, Y. Utz, M. Hücker, G. D. Gu, B. Büchner, and H.-J. Grafe, Phys. Rev. B 92, 155144 (2015).
- Tranquada et al. (1999) J. M. Tranquada, N. Ichikawa, and S. Uchida, Phys. Rev. B 59, 14712 (1999).
- Rømer et al. (2013) A. T. Rømer, J. Chang, N. B. Christensen, B. M. Andersen, K. Lefmann, L. Mähler, J. Gavilano, R. Gilardi, C. Niedermayer, H. M. Rønnow, A. Schneidewind, P. Link, M. Oda, M. Ido, N. Momono, and J. Mesot, Phys. Rev. B 87, 144513 (2013).
- Tsuda et al. (1988) T. Tsuda, T. Shimizu, H. Yasuoka, K. Kishio, and K. Kitazawa, J. Phys. Soc. Jpn. 57, 2908 (1988).
- Mila and Rice (1989) F. Mila and T. M. Rice, Physica C 157, 561 (1989).
- Nishihara et al. (1987) H. Nishihara, H. Yasuoka, T. Shimizu, T. Tsuda, T. Imai, S. Sasaki, S. Kanbe, K. Kishio, K. Kitazawa, and K. Fueki, J. Phys. Soc. Jpn. 56, 4559 (1987).
- Imai et al. (1988) T. Imai, T. Shimizu, H. Yasuoka, Y. Ueda, and K. Kosuge, J. Phys. Soc. Jpn. 57, 2280 (1988).
- Barrett et al. (1990) S. E. Barrett, D. J. Durand, C. H. Pennington, C. P. Slichter, T. A. Friedmann, J. P. Rice, and D. M. Ginsberg, Phys. Rev. B 41, 6283 (1990).
- Millis et al. (1990) A. J. Millis, H. Monien, and D. Pines, Phys. Rev. B 42, 167 (1990).
- Ohsugi et al. (1994) S. Ohsugi, Y. Kitaoka, K. Ishida, Z. G.-q., and A. K., J. Phys. Soc. Jpn. 63, 700 (1994).
- Ishida et al. (1989) K. Ishida, Y. Kitaoka, and K. Asayama, J. Phys. Soc. Jpn. 58, 36 (1989).
- Tou et al. (1992) H. Tou, M. Matsumura, and H. Yamagata, J. Phys. Soc. Jpn. 61, 1477 (1992).
- Pennington et al. (1989) C. H. Pennington, D. J. Durand, C. P. Slichter, J. P. Rice, E. D. Bukowski, and D. M. Ginsberg, Phys. Rev. B 39, 274 (1989).
- Sokol and Pines (1993) A. Sokol and D. Pines, Phys. Rev. Lett. 71, 2813 (1993).
- Imai et al. (1993a) T. Imai, C. P. Slichter, K. Yoshimura, and K. Kosuge, Phys. Rev. Lett. 70, 1002 (1993a).
- Imai et al. (1993b) T. Imai, C. P. Slichter, K. Yoshimura, M. Katoh, and K. Kosuge, Phys. Rev. Lett. 71, 1254 (1993b).
- Arguello et al. (2014) C. J. Arguello, S. P. Chockalingam, E. P. Rosenthal, L. Zhao, C. Gutiérrez, J. H. Kang, W. C. Chung, R. M. Fernandes, S. Jia, A. J. Millis, R. J. Cava, and A. N. Pasupathy, Phys. Rev. B 89, 235115 (2014).
- Kivelson et al. (2001) S. A. Kivelson, G. Aepplie, and V. J. Emery, Proc. Nat. Acad. Sci. 98, 11903 (2001).