Sizing the star cluster population of the Large Magellanic Cloud
Abstract
The number of star clusters that populate the Large Magellanic Cloud (LMC) at deprojected distances 4 deg has been recently found to be nearly double the known size of the system. Because of the unprecedented consequences of this outcome in our knowledge of the LMC cluster formation and dissolution histories, we closely revisited such a compilation of objects and found that only 35 per cent of the previously known catalogued clusters has been included. The remaining entries are likely related to stellar overdensities of the LMC composite star field, because there is a remarkable enhancement of objects with assigned ages older than log( yr-1) 9.4, which contrasts with the existence of the LMC cluster age gap; the assumption of a cluster formation rate similar to that of the LMC star field does not help to conciliate so large amount of clusters either; and nearly 50 per cent of them come from cluster search procedures known to produce more than 90 per cent of false detections. The lack of further analyses to confirm the physical reality as genuine star clusters of the identified overdensities also glooms those results. We support that the actual size of the LMC main body cluster population is close to that previously known.
keywords:
techniques: photometric – galaxies: individual: LMC – galaxies: star clusters: general1 Introduction
Recently, Bitsakis et al. (2017, hereafter B17) have reported the detection of 4850 star clusters in the Large Magellanic Cloud (LMC), out of which 3451 are new identifications. These surprisingly large number of clusters strikes our previous knowledge about the size of the LMC cluster population. Indeed, the most frequently used catalogue of extended objects compiled by Bica et al. (2008, hereafter B08) contains nearly 2580 objects distributed throughout the same area surveyed by B17, including actual clusters, associations and nebulae. On the other hand, recent searches for still unrecognised clusters in different regions of the LMC main body have not succeeded in finding large amount of new clusters, but few, if any (e.g., Piatti, 2016a; Sitek et al., 2016; Piatti, 2017c).
The extraordinary large number of new clusters listed by B17, that by itself surpasses the total number of known B08’s clusters by far, leads to important consequences in our understanding of the cluster disruption processes. For instance, Baumgardt et al. (2013) predicted a 20 per cent faster cluster dissolution rate than the standard one based on their own complete compilation of ages for clusters more massive than 5000 . However, bearing in mind the age distribution of the new clusters identified by B17, such a dissolution rate might be significantly much smaller. In addition, the observationally well-documented burst of cluster formation in both Magellanic Clouds as a consequence of the mutual tidal interaction that peaked at 2-3 Gyr (e.g., Piatti, 2011a, b; Piatti & Geisler, 2013, and references therein) would appear to be blurred as well. Furthermore, the outside-in formation scenario supported by analyses of a variety of collections of data sets (e.g., Carrera et al., 2011; Meschin et al., 2014; Piatti et al., 2018) is not recovered, but an inside-out one.
Beside this, we also found some internal discrepancies in B17’s results that we cannot explain. For instance, the amount of new clusters counted from their Figure 6 - assuming a histogram resolution of 1.25 pc - is roughly 1800 objects; nearly half the total number of new clusters recognised by them. These reasons motived us to revisit B17’s results seeking for any clue that might shed light to conciliate their outcomes with the current knowledge on the history of the formation and evolution of the LMC star cluster population. We approached B17’s results from four different ways as described in Sections 2 to 4, and summarise the main conclusions of our work in Section 5.
2 Cross-correlation with the B08’s catalogue
We started by simply matching the B17’s list of clusters to that of B08. In order to do that we used the tmatch task within IRAF111IRAF is distributed by the National Optical Astronomy Observatories, which is operated by the Association of Universities for Research in Astronomy, Inc., under contract with the National Science Foundation., which provided us with two tables that include matched and unmatched objects, respectively. The task associates any pair of coordinates (R.A., Dec.) in the B17’s list to the one in the B08’s catalogue for which the distance between them - defined as the square root of the sum in quadrature of Relative R.A. cos(Dec.) and Relative Dec. - is smaller than certain tolerance value. The latter is represented by a circle around each point in the reference table (B08) and is set by the user. Therefore, we firstly used a radius of 0.01 deg to avoid multiple matchings to B08’s clusters. Then, we used the remaining unmatched objects in both B17 and B08 lists and run tmatch with a tolerance of 0.014 deg, which produced again no multiple matchings. Finally, we repeated the procedure using a radius of 0.017 deg, without multiple cross-correlations in the outcomes. We assumed that any object in the B17’s compilation located farther than one arcmin from any B08’s cluster is an object not included in B08. This is a very relaxed constraint, because the smallest clusters in the LMC are typically of 0.3 arcmin wide in radius.
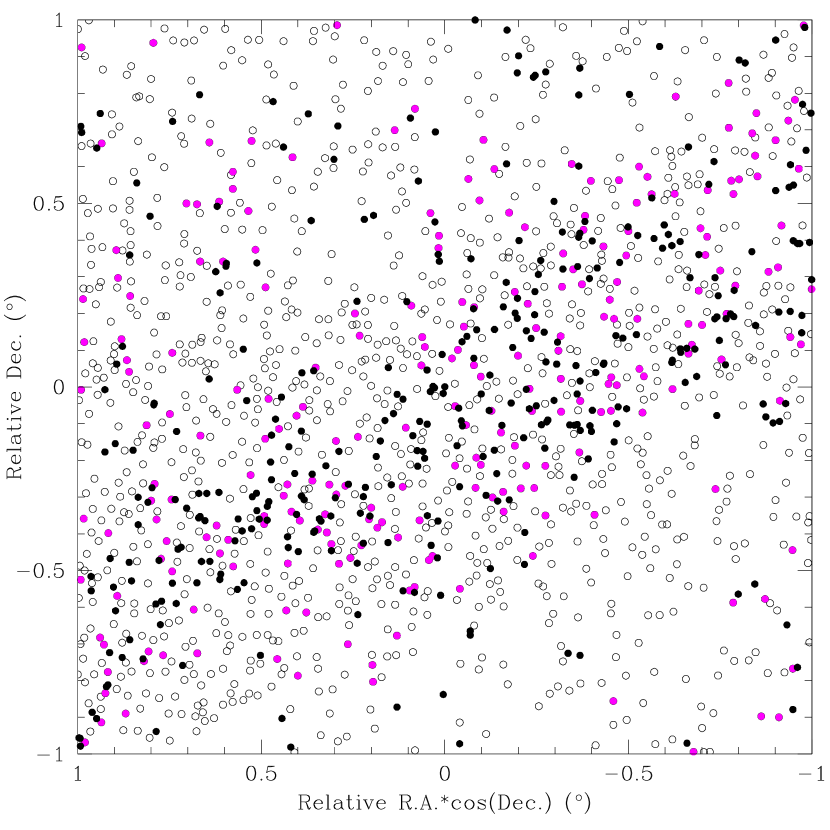
We merged the three individual output lists with single matched objects resulting in 918 entries. This amount of clusters represents 35 per cent of the B08’s clusters distributed in the area used by B17 to automatically detect resolved objects. The remaining B17’s not matched clusters add up to 3932 entries. Fig. 1 illustrates the result of the matching procedure for a central LMC area of 4 square degrees; the finding chart of the whole analysed LMC main body is provided as on-line material for a clearer and easy inspection by the reader. In the Appendix we show some examples of unmatched and new candidate clusters.
Two main issues arise from the above results. On the one hand, the low percentage of recovered known star clusters and, on the other hand, the huge amount of new detected objects, which seem somehow paradoxical. B17 did not perform any cross-correlation with the B08’s catalogue, so that they could not realise on this. They simply run a code that identified local overdensities directly tagged as star clusters. Nevertheless, a stellar overdensity is far from being confirmed as a genuine stellar aggregate without further careful analyses (Piatti, 2014b, 2017b). As discussed by Piatti et al. (2016), the ranges of cluster dimensions and their mean stellar densities at different wavelength regimes play a role in automatically searching for star clusters, in addition to the level of photometric completeness of the images employed. B17 performed some Monte Carlos experiments to probe with artificial clusters the effectiveness in recovering them, no dependence on cluster sizes, number of stars and depth of the photometry is mentioned, regardless the different LMC composite star field populations that contaminate differently the cluster fields. In addition, for some of their data sets, they yielded more than 90 per cent of false detections (see their Table 1).
Piatti & Bica (2012) showed that cleaning a colour-magnitude diagram (CMD) of a star cluster from star field contamination is not an easy task, even more difficult if it is performed automatically, without any check or inspection of the resulting cleaned cluster CMDs. The variation of the number of field stars as a function of their magnitudes, their colour range and stochastic effects (e.g., few isolated bright stars) usually vary over a sky region and very frequently they vary around the cluster regions as well. For this reason, the general recommendation is to use as many field areas around the cluster field as possible with relatively similar sizes to that of the cluster area to improve the statistics (Maia et al., 2014, 2016). By employing one relatively small circular star field area (see Figure 3 in B17) could lead to an unrepresented field population, and hence, to decontaminated cluster CMDs strongly featuring the composite field star population. Furthermore, the membership probability assigned by B17 (their equation 1) depends on the position and size of the bins overplotted on the CMDs, although the authors used fixed values of (colour,magnitude) = (0.5 mag, 1.0 mag). Maia et al. (2010) showed that it is necessary to apply such a procedure many times varying the size and position of the bins, while Piatti & Bica (2012) proposed the use of variable cells to properly take into account the actual distribution of field stars in the cluster CMD.
3 deep lmc fields
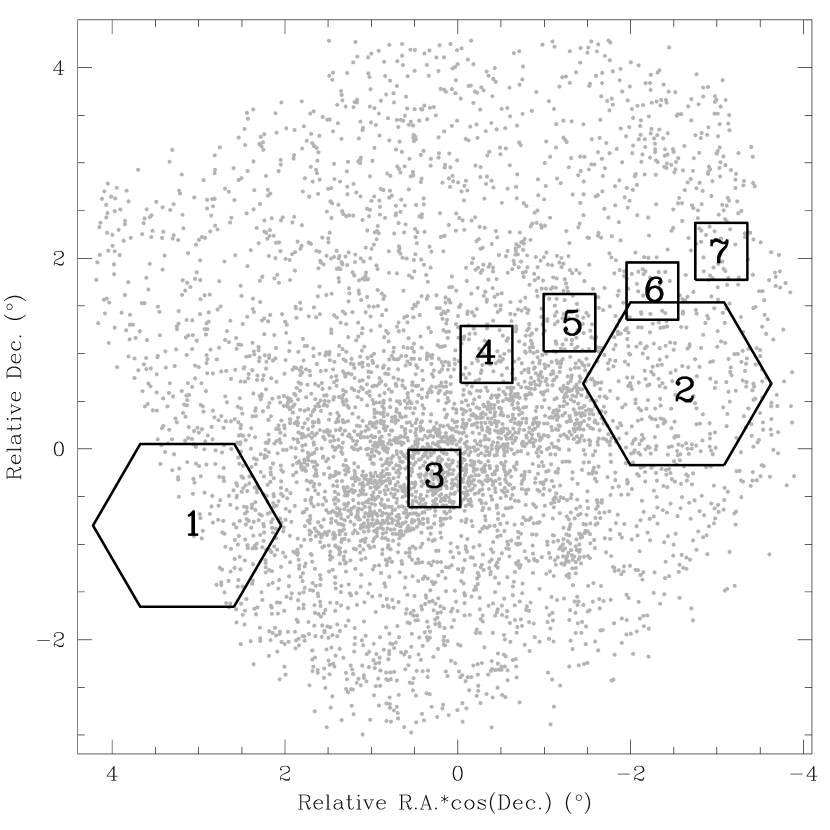
In order to closely revisit the B17’s list of detected clusters, we took advantage of recent studies that thoroughly examined the LMC cluster population in some selected fields located within the B17’s surveyed area. Fig. 2 shows the distribution of the B17’s objects and the seven well-studied LMC regions considered here overplotted. The large hexagons correspond to DECam fields ( 22 FOV, pixel size=0.263; Flaugher et al., 2015) analysed by Piatti (2017c), while the small rectangles correspond to MOSAIC II fields (3636 FOV, pixel size= 0.269) studied by Piatti (2017b) and Piatti et al. (2018). The 4-m Blanco telescope at the Cerro Tololo Interamerican Observatory (CTIO) was employed to observe those fields, among others distributed outwards the B17’s surveyed area as part of different photometric surveys aimed at studying the most metal-poor stars outside the Milky Way (rectangles: CTIO 2008B-0296 programme, PI: Cole) and the Magellanic Clouds stellar history (hexagons Nidever et al., 2017).
These LMC fields were carefully surveyed looking for star clusters by employing the method mentioned above (Piatti et al., 2016), i.e., by constraining the search using the known cluster dimension and mean stellar density ranges. The final cluster lists resulted to be statistically complete, because the derived photometry detected any star cluster based on counts of its brightest stars all the way down to the main sequence turnoff (MSTO) of the oldest LMC clusters. Every catalogued B08’s cluster was recovered, in addition to very few new identified clusters in some of the surveyed fields. The CMDs of the recognised extended objects were then cleaned from field star contamination by using the procedure developed by Piatti & Bica (2012), i.e., by building statistically meaningful star field CMDs that tightly reproduced the luminosity function, colour distribution and stellar density of the respective star fields, to be subtracted to the cluster CMDs. The resulting cleaned CMDs for some of the objects led to conclude that they are not genuine physical systems, but random fluctuations of the field star density. Table 1 lists the number of entries in the B08’s catalogue for each selected LMC field (field ID is as in Fig. 2), and the number of true star clusters confirmed according to the photometric analyses performed by Piatti (2017c, b) and Piatti et al. (2018).
For comparison purposes, we extracted the results of Section 2 for the selected LMC fields, namely, the number of B08’s objects matched by the B17’s ones as well as the number of B17’s new detections. They are also listed in Table 1. For completeness, we included in its last column the deprojected distances of the central coordinates of the seven LMC fields. They were computed by assuming that the LMC disc is inclined 35.14 and has a position angle of the line of nodes of = 129.51 (Balbinot et al., 2015).
From the piece of information gathered in Table 1, we confirm previous results by Piatti & Bica (2012) and Piatti (2014b), in the sense that the B08’s catalogue might contain 10-20 per cent of possible non-clusters or asterisms. Likewise, it shows that only a couple of new genuine star clusters in some of the considered LMC fields have been discovered, which strongly contrasts with the large number of new identifications compiled by B17. Because of the accuracy of the photometry used and the proven methods to identify clusters and to clean their CMDs employed, also used elsewhere (e.g., Piatti, 2016a, b; Ivanov et al., 2017; Piatti, 2017a), we are confident on the small number of new clusters found in those fields. Notice that the percentage of B08’s clusters matched to the B17’s list is nearly the same for all the fields ( 35), which can be considered as the effectiveness of recovering clusters by the automatic code of B17 at any deprojected distance.
| Field ID | B08’s catalogue | new | Ref. | B17’s objects | |||
| catalogued | actual | discoveries | B08’s | new | (deg) | ||
| objects | clusters | objects | detections | ||||
| 1 | 75 | 75 | 1 | 1 | 26 | 110 | 2.94 |
| 2 | 144 | 144 | 2 | 1 | 44 | 192 | 2.78 |
| 3 | 107 | 69 | 1 | 2 | 41 | 115 | 0.41 |
| 4 | 26 | 21 | 0 | 3 | 7 | 36 | 1.12 |
| 5 | 25 | 17 | 0 | 3 | 8 | 38 | 1.82 |
| 6 | 24 | 24 | 0 | 3 | 9 | 13 | 2.75 |
| 7 | 11 | 10 | 1 | 3 | 4 | 20 | 3.62 |
4 star cluster frequency
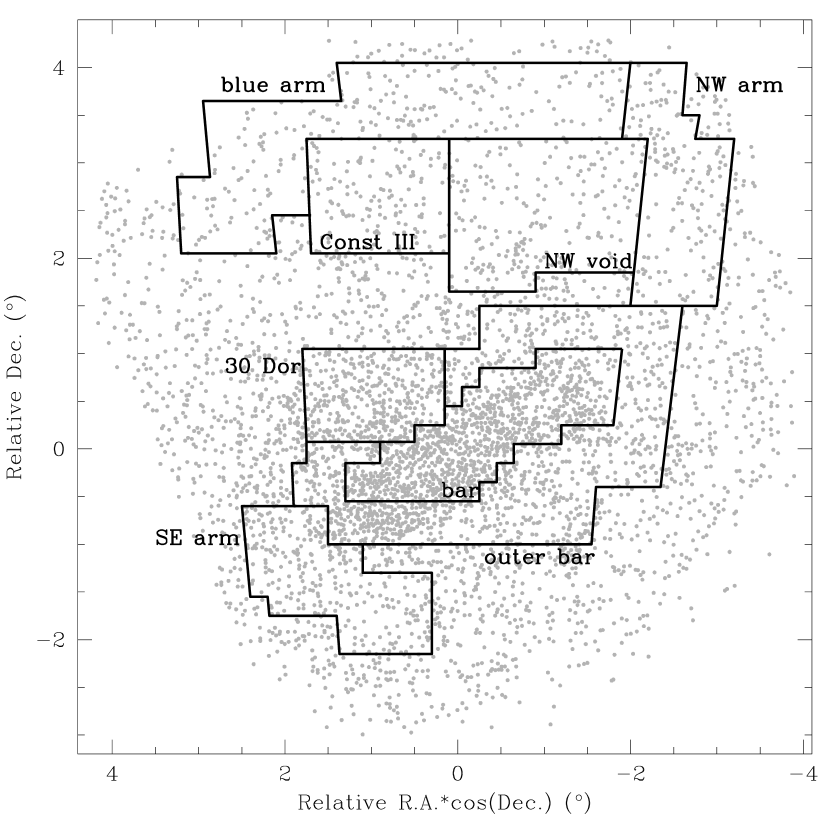
With independence of drawing conclusions on the number of clusters in the B17’s compilation, it is possible to study the distribution of the ages estimated by them in the light of the presently known LMC cluster formation history. In order to do that, we built the cluster frequencies (CFs) for different regions as defined by Harris & Zaritsky (hereafter HZ09 2009). Fig. 3 depicts those regions superposed on the spatial distribution of B17’s star cluster. CFs are distribution functions that trace the number of clusters per time unit as a function of age. They are more powerful than age histograms, because they do not depend on any age interval and the number of clusters at different ages can be compared consistently. In addition, CFs can be linked to the cluster formation rate (CFR) through the expression:
| (1) |
where is the cluster mass and the sums are computed over the LMC cluster mass range, assuming a power-law mass distribution with a slope = -2. Piatti (2014a) built CFs for the HZ09 regions using a statistically complete sample of clusters with accurate age estimates. We here consider them as representative LMC CFs. After performing a sound analysis on the effects of not considering clusters without age estimates as well as of not including still unidentified ones, he showed that there exist variations of the CFs with the position in the galaxy.
Following his approach, we selected the B17’s clusters located in the different HZ09 regions and produced CFs from the number of clusters counted in age intervals with properly chosen sizes. In doing this, we took also into account the individual uncertainties of the age estimates. Fig. 4 shows the ratio in logarithmic scale between the resulting CFs and that derived by Piatti (2014a) as a function of age for each HZ09 region. At first glance, noticeable differences arise from one field to another one, besides the large excess of B17’s clusters discussed in Sections 2 and 3. For instance, the Blue Arm, Constellation III and Southeast regions present remarkable enhancements of clusters older than log( yr-1) 9.4, contrarily to what would be expected, because of the well-known age gap ((log( yr-1)) 9.5 -10.0) where no LMC cluster apparently exist (see, e.g., Piatti & Geisler, 2013, and references therein). If those objects were stellar overdensities in relatively old composite star fields, which is a typical feature of the LMC stellar outer disc, they would explain the excesses of objects found. Similarly, the 30 Doradus region is the one known for its highest relative frequency of the youngest clusters, while Fig. 4 shows excesses of relatively old objects.
The large number of clusters older than log( yr-1) 8.8 also contrasts with the limiting magnitudes reached by the photometric catalogues used. Zaritsky et al. (2002) found little visible evidence for incompleteness for 20 mag in their Magellanic Cloud Photometric Survey catalogue (the deepest one used by B17), corresponding to a MSTO of log( yr-1) 8.7. Indeed, Glatt et al. (2010) used the same catalogue to estimate ages of 1139 LMC clusters and concluded that it is difficult to derive ages of star clusters older than log( yr-1) 9.0 due to the catalogued limited photometric depth, which does not resolve MSTO points of intermediate-age and older clusters. According to the theoretical isochrones computed by Bressan et al. (2012), a 1 Gyr old LMC cluster has its MSTO at 20 mag. B17 applied an automatic technique to fit isochrones to the observed CMDs, which could have left little space to control stochastic effects, particularly large colour dispersion at fainter magnitudes, photometry incompleteness at the bottom part of the CMDs, and residuals from field star decontamination (see their Fig. 4). The latter could have played an important role as discussed in Section 3, as is also the commom presence of residual LMC red clump stars that, in combination with relatively faint main sequences, could mimic the appearance of features typically seen in CMDs of clusters older than log( yr-1) 8.7.

5 new detections’ features
At this point, a question arises unavoidably: why did not B17 detect known clusters - unmatched B08’s clusters - with radii and ages similar to those matched B08’s clusters, and so many uncatalogued? We pose this question because in the sky, the unmatched B08’s clusters look pretty similar in average to those matched in terms of brightness relative to the background, size, etc. They were catalogued by visual inspection of photographic plates or digital images under more or less uniform detectability criteria.
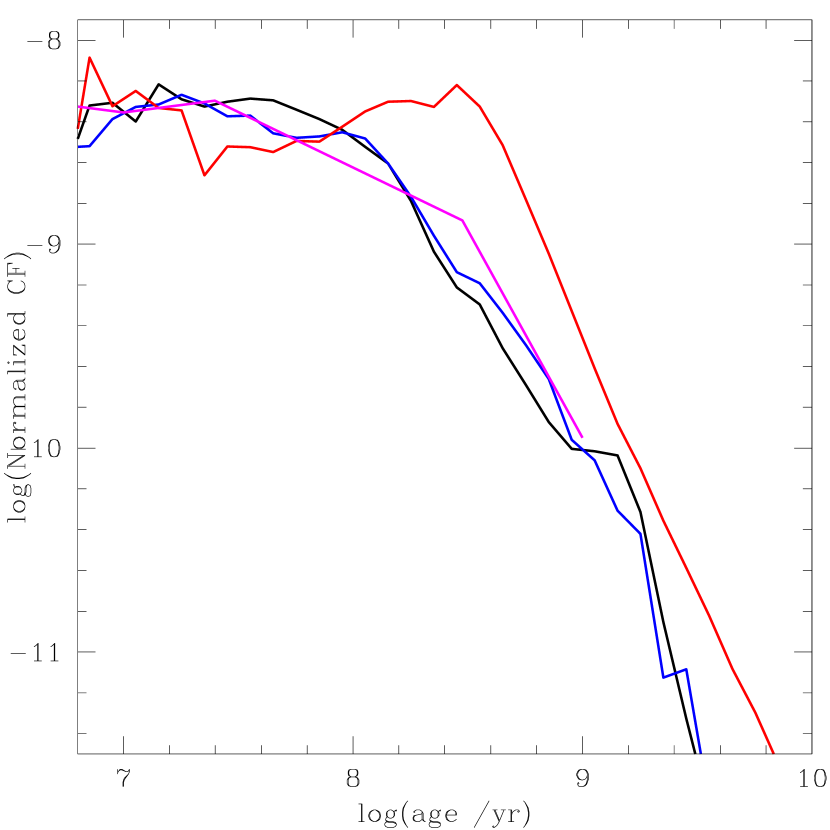
In order to know whether the new identified clusters belong to a particular kind of extended objects in the LMC, we compared the CF built from matched B08’s clusters to that from the B17’s new detections. We employed the same procedure as in Section 4, namely, considering appropriate age bins and the age uncertainties. We divided each CF by the total number of objects used, so that relative differences can be compared without introducing any shift. Fig. 5 depicts the resulting normalized CFs for matched B08 and B17 new objects traced with black and red lines, respectively. We included the normalized CF that results from using the unmatched B08’s clusters represented by a blue line. As can be seen, this is very similar to that coming from matched B08’s objects, which means that representative samples of the LMC cluster population (in terms of age distribution) produce similar CFs, as expected. The resulting CF from the B17’s new detections clearly departs from the representative LMC CFs, with a noticeable enhancement of aged objects older than log( yr-1) 8.0. According to the object searching algorithm used by B17, nearly 50 per cent of them (1865 entries) come from detections made on IRAC1 images, for which they predicted from Monte Carlo experiments more than 90 per cent of false detections.
The present-day CF is the result of a complex combination between the CFR and the dissolution rate of clusters along the galaxy lifetime. If we adopted as the CFR the star formation rate (SFR) derived by HZ09 for the LMC stellar population, we could derive the respective CF from equation (1). Indeed, Maschberger & Kroupa (2011) used only the most massive clusters on the one hand, and the whole cluster population on the other hand to reconstruct the LMC CFR, and found that there is a very good agreement between the different CFRs and the SFR derived by HZ09 for the last 1 Gyr. For older ages, the cluster age gap dominates the CFR, so that the SFR departs from it. Therefore, we corrected the HZ09’s SFR from the cluster dissolution rate found by Baumgardt et al. (2013) - the CF/CFR ratio is 40 times smaller at log( yr-1) = 9.6 respect to that ratio at log( yr-1) = 8.3 - to obtain the present-day CFR, and converted it to CF using equation (1). The normalized present-day CF for the last 1 Gyr is depicted with a magenta line in Fig. 5. As can be seen, there is a very good agreement with those for the matched and unmatched B08’s clusters, which suggests that the excess of B17’s new identifications older than log( yr-1) 8.0 can possibly be related to density fluctuations of the composite LMC stellar field.
6 Conclusions
We addressed the issue of the size of the LMC cluster population distributed throughout the main body of the galaxy ( 4 deg) motivated by the recent compilation carried out by B17 of star clusters that nearly doubles the total amount of known catalogued extended objects. Such huge amount of clusters defies our knowledge about the cluster formation and dissolution rates, the effectiveness of past and current procedures of identification of star clusters, etc.
We examined the B17’s outcomes from four different approaches with the aim of establishing the origin of such an enhancement of the LMC clusters and thus reconcile them with our knowledge of the LMC cluster formation and evolution history.
We matched the B17’s list of objects to the B08’s catalogue and found that only 35 per cent of catalogued extended objects in B08 have been recovered by B17. In addition, B17 identified in average nearly 150 per cent increase of the known number of catalogued clusters.
We confirmed the relative low effectiveness of the employed cluster searching procedure by comparing the B17’s findings with recent detailed photometric studies of the actual population of genuine clusters in different LMC regions, from the very LMC bar centre out of 3.6 deg. The actual cluster populations in those selected regions were confirmed from accurate and deep photometry that reaches the MSTO of the older LMC clusters.
We built the CFs using the B17’s list of objects distributed throughout the HZ09 regions and compared them with those derived by Piatti (2014a) from a statistically complete sample of LMC clusters. Such a comparison showed that for some of the LMC outer disc regions B17 recognized a huge amount of clusters older than log( yr-1) 9.4, which contrasts with the known cluster age gap (absence of clusters with ages in the range log( yr-1) 9.5-10.0). Since the limiting magnitude of the deepest images used by B17 barely reach the MSTO of clusters older than log( yr-1) 8.7, such an enhancement could be related to stellar overdensities in the LMC composide star field.
The high percentage of asterisms is also supported by the fact that 50 of them come from images for which Monte Carlos simulations produced more than 90 per cent of false cluster detections. The assumption of the HZ09 SFR as CFR does not explain such an extra amount of clusters either.
Acknowledgements
We thank the referee for his/her thorough reading of the manuscript and timely suggestions to improve it.
References
- Balbinot et al. (2015) Balbinot E., et al., 2015, MNRAS, 449, 1129
- Baumgardt et al. (2013) Baumgardt H., Parmentier G., Anders P., Grebel E. K., 2013, MNRAS, 430, 676
- Bica et al. (2008) Bica E., Bonatto C., Dutra C. M., Santos J. F. C., 2008, MNRAS, 389, 678
- Bitsakis et al. (2017) Bitsakis T., Bonfini P., González-Lópezlira R. A., Ramírez-Siordia V. H., Bruzual G., Charlot S., Maravelias G., Zaritsky D., 2017, ApJ, 845, 56
- Bressan et al. (2012) Bressan A., Marigo P., Girardi L., Salasnich B., Dal Cero C., Rubele S., Nanni A., 2012, MNRAS, 427, 127
- Carrera et al. (2011) Carrera R., Gallart C., Aparicio A., Hardy E., 2011, AJ, 142, 61
- Flaugher et al. (2015) Flaugher B., et al., 2015, AJ, 150, 150
- Glatt et al. (2010) Glatt K., Grebel E. K., Koch A., 2010, A&A, 517, A50
- Harris & Zaritsky (2009) Harris J., Zaritsky D., 2009, AJ, 138, 1243
- Ivanov et al. (2017) Ivanov V. D., Piatti A. E., Beamín J.-C., Minniti D., Borissova J., Kurtev R., Hempel M., Saito R. K., 2017, A&A, 600, A112
- Maia et al. (2010) Maia F. F. S., Corradi W. J. B., Santos Jr. J. F. C., 2010, MNRAS, 407, 1875
- Maia et al. (2014) Maia F. F. S., Piatti A. E., Santos J. F. C., 2014, MNRAS, 437, 2005
- Maia et al. (2016) Maia F. F. S., Moraux E., Joncour I., 2016, MNRAS, 458, 3027
- Maschberger & Kroupa (2011) Maschberger T., Kroupa P., 2011, MNRAS, 411, 1495
- Meschin et al. (2014) Meschin I., Gallart C., Aparicio A., Hidalgo S. L., Monelli M., Stetson P. B., Carrera R., 2014, MNRAS, 438, 1067
- Nidever et al. (2017) Nidever D. L., et al., 2017, preprint, (arXiv:1701.00502)
- Piatti (2011a) Piatti A. E., 2011a, MNRAS, 418, L40
- Piatti (2011b) Piatti A. E., 2011b, MNRAS, 418, L69
- Piatti (2014a) Piatti A. E., 2014a, MNRAS, 437, 1646
- Piatti (2014b) Piatti A. E., 2014b, MNRAS, 440, 3091
- Piatti (2016a) Piatti A. E., 2016a, MNRAS,
- Piatti (2016b) Piatti A. E., 2016b, MNRAS, 463, 3476
- Piatti (2017a) Piatti A. E., 2017a, MNRAS, 465, 2748
- Piatti (2017b) Piatti A. E., 2017b, A&A, 606, A21
- Piatti (2017c) Piatti A. E., 2017c, ApJ, 834, L14
- Piatti & Bica (2012) Piatti A. E., Bica E., 2012, MNRAS, 425, 3085
- Piatti & Geisler (2013) Piatti A. E., Geisler D., 2013, AJ, 145, 17
- Piatti et al. (2016) Piatti A. E., Ivanov V. D., Rubele S., Marconi M., Ripepi V., Cioni M.-R. L., Oliveira J. M., Bekki K., 2016, MNRAS, 460, 383
- Piatti et al. (2018) Piatti A. E., Cole A. A., Emptage B., 2018, MNRAS, 473, 105
- Sitek et al. (2016) Sitek M., et al., 2016, Acta Astron., 66, 255
- Zaritsky et al. (2002) Zaritsky D., Harris J., Thompson I. B., Grebel E. K., Massey P., 2002, AJ, 123, 855
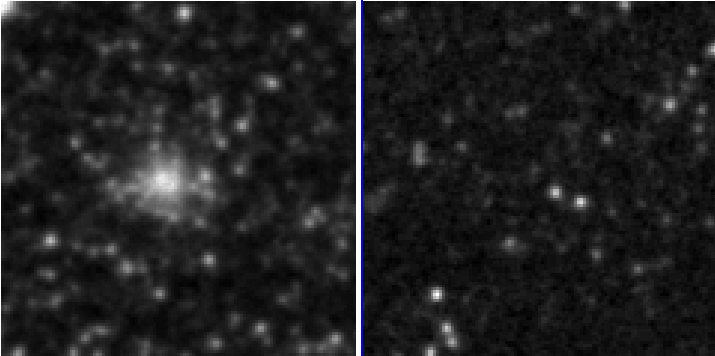
Appendix A Unmatched cluster and new detection examples